 Xiaomeng Geng
 Huiru Li1,3*
94% of researchers rate our articles as excellent or good
Learn more about the work of our research integrity team to safeguard the quality of each article we publish.
Find out more
REVIEW article
Front. Mar. Sci., 28 January 2025
Sec. Ocean Observation
Volume 12 - 2025 | https://doi.org/10.3389/fmars.2025.1546289
This article is part of the Research TopicRemote Sensing Applications in Marine Ecology Monitoring and Target SensingView all 8 articles
In recent years, Ulva prolifera green tide, as a large-scale marine ecological phenomenon, has occurred frequently in coastal areas such as the Yellow Sea and the East China Sea, significantly affecting marine ecosystems and fishery resources. With the continuous advancement of remote sensing technologies, these technologies have become indispensable tools for monitoring Ulva prolifera green tides. This review provides a comprehensive overview of the advances in remote sensing band indices for detecting green tides, including spatiotemporal distribution analysis, area and biomass estimation, drift trajectory modeling, and investigations of their driving mechanisms. Additionally, it identifies the limitations and unresolved challenges in current approaches, such as constraints on data resolution, algorithmic biases, and environmental variability. The potential for integrating multi-source remote sensing data with marine environmental parameters and deep learning techniques is discussed, emphasizing their roles in improving the accuracy and reliability of monitoring and predicting Ulva prolifera green tides. This review aims to guide future research efforts and technological innovations in this field.
Considering global environmental change, the dynamics of large-scale algal blooms, particularly Ulva prolifera green tides, have become a central topic of research. Since 2007, large-scale green tides have occurred annually in the Yellow Sea of China, attracting considerable attention from the government and researchers, especially after the 2008 outbreak in the waters near Qingdao, which interfered with Olympic sailing events (Hu and He, 2008; Zhang et al., 2019). Figure 1 illustrates the annual extent of green tides in the Yellow Sea from 2008 to 2023. Although the maximum distribution and coverage areas were relatively low in 2012, 2020, and 2022, the extent and coverage of green tides have shown an increasing trend over the years. These blooms not only affect the coastal landscape but also obstruct navigation channels, thereby posing serious threats to coastal fisheries, aquaculture, and tourism (Hu and He, 2008; Xing and Hu, 2016).
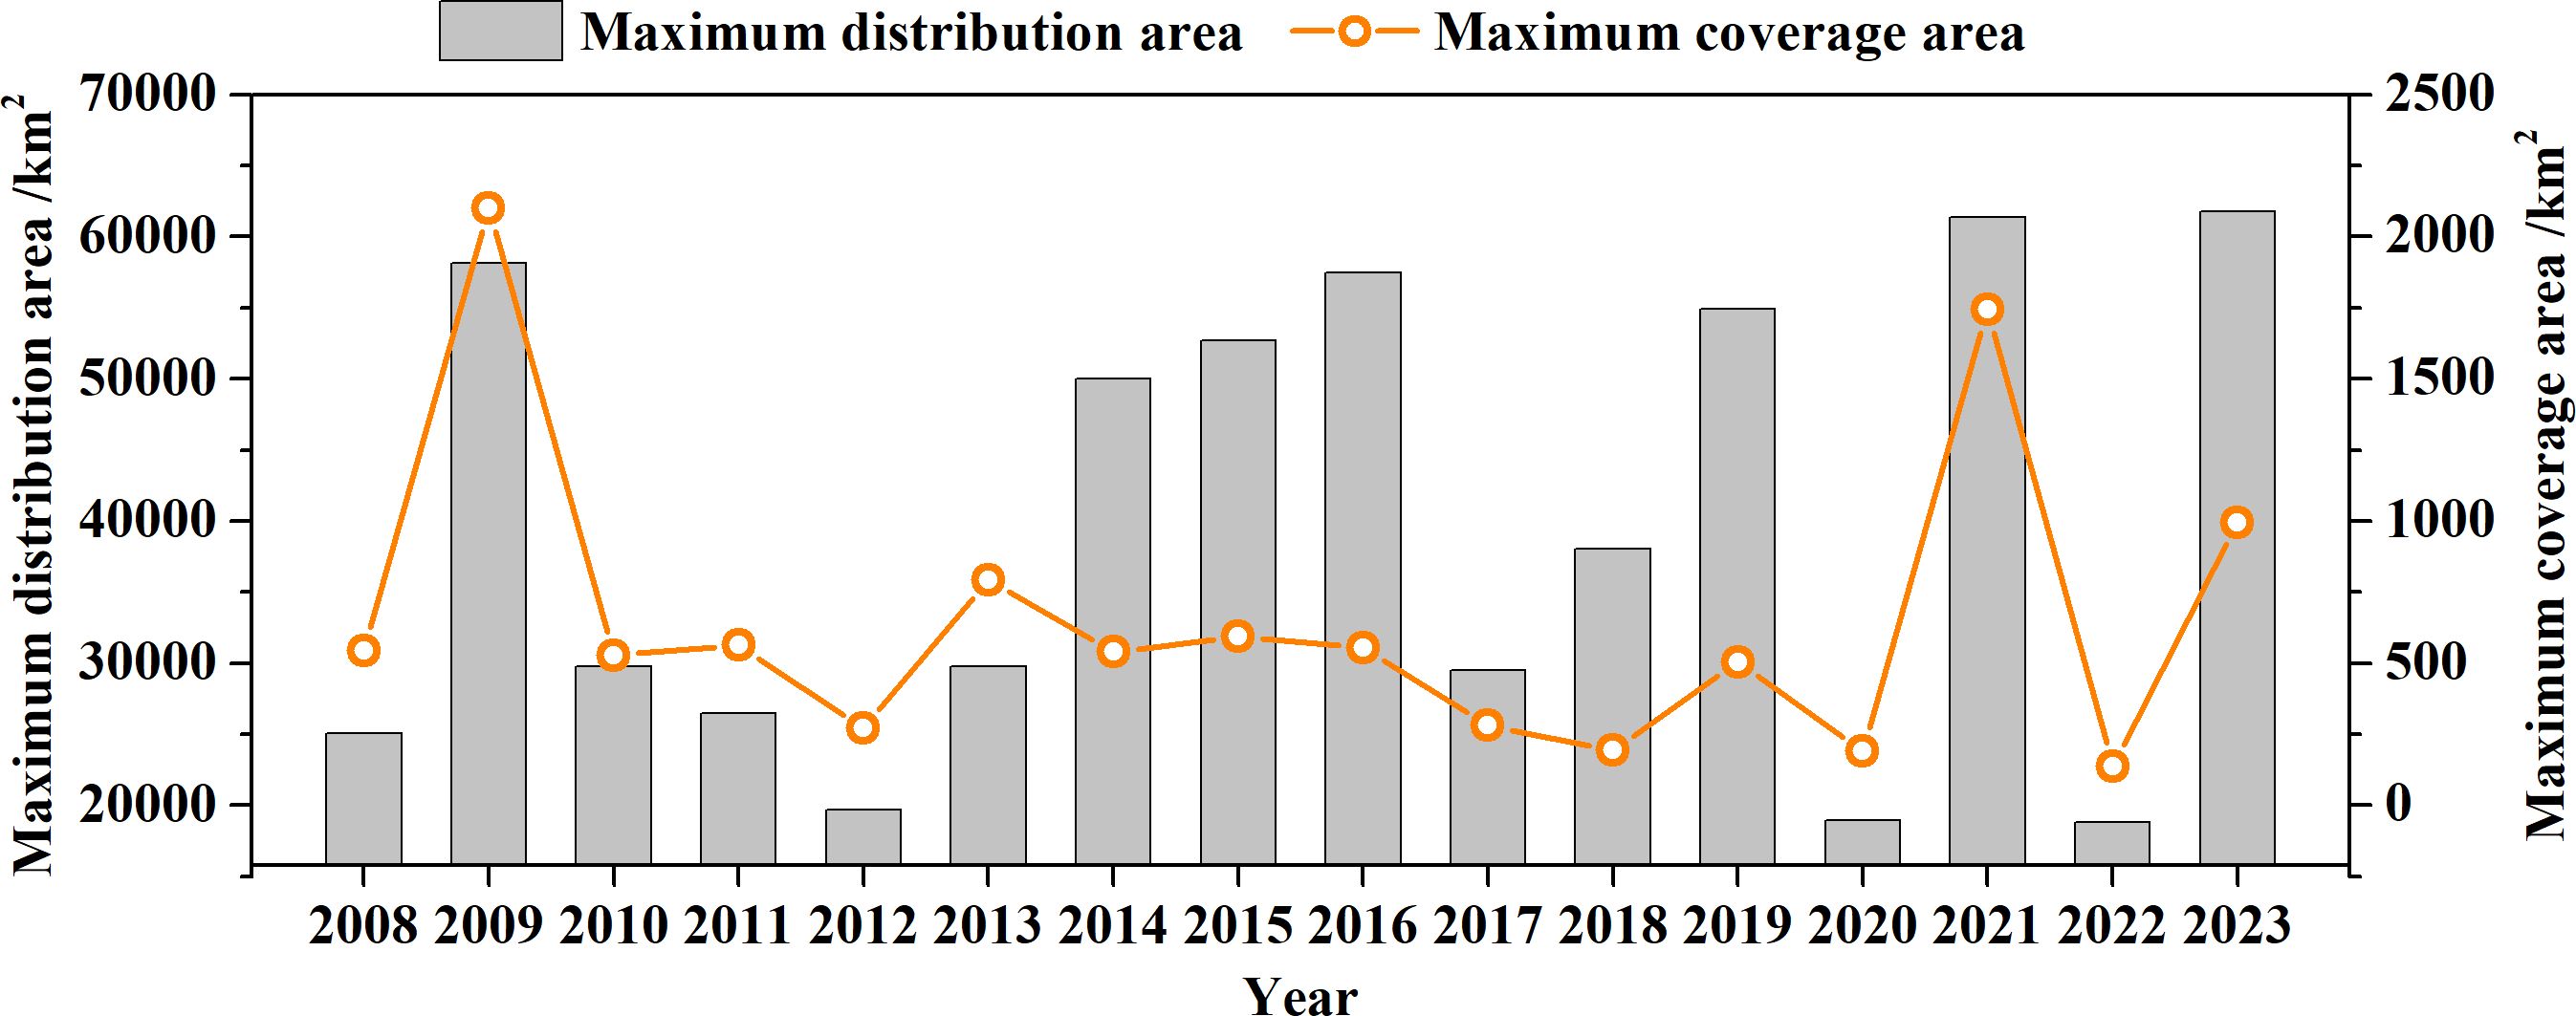
Figure 1. Maximum distribution area and coverage area of green tides in the Yellow Sea from 2008 to 2023 (data from the China Oceanic Information Network, https://www.nmdis.org.cn/).
Over the past two decades, the cultivation areas for Porphyra in China have expanded nearly fourfold, as shown in Figure 2. The Porphyra aquaculture rafts areas in the Subei Shoal (Lianyungang, Yancheng, and Nantong) are widely recognized as the primary breeding grounds for Ulva prolifera green tides (Hu, 2009; Liu et al., 2010; Xing et al., 2011; Keesing et al., 2011; Xing et al., 2018). These regions provide optimal conditions for the proliferation and dispersal of Ulva prolifera, driven by aquaculture activities, nutrient enrichment (both inorganic and organic), sea surface temperature, solar radiation, and hydrodynamic conditions. Previous studies have also highlighted a strong correlation between large-scale seaweed cultivation in the Subei region and the occurrence of extensive macroalgal blooms in the southern Yellow Sea (Geng et al., 2015; Zhang et al., 2017). In addition, this strong correlation was further confirmed through rDNA sequence analysis, with identical morphological characteristics observed (Liu et al., 2010; Zhang et al., 2014). In general, Porphyra cultivation begins every October, with rafts and ropes deployed into the sea, providing surfaces where green algae such as Ulva readily attach (Liu et al., 2010). By the following spring, as seawater temperatures reach approximately 20°C, Ulva prolifera rapidly competes with Porphyra for space. During Porphyra harvest and raft removal, some Ulva inevitably detaches in shallow waters (Liu et al., 2016; Hu et al., 2023). A study estimated that approximately 4,000 tons of Ulva prolifera biomass detached from aquaculture rafts during the raft retrieval period, floating into the surrounding waters of the Subei Shoal and providing the initial biomass for the large-scale green tide outbreak in the Yellow Sea (Han et al., 2020). Driven by tides, currents, and winds, these algae float to the surface and flourish under favorable light, temperature, and nutrient conditions, thereby drifting northward to the Shandong coast (Hu et al., 2010; Liu et al., 2013; Wang et al., 2015; Xing et al., 2019). Figure 3 illustrates the temporal and spatial dynamics of Ulva prolifera green tides over May, June, and July. During May, Ulva prolifera first appears in the Subei Shoal, marking the initial stage of its development. In June, it undergoes rapid growth, reaching its maximum coverage. In July, the algae gradually drift and accumulate in the waters near Qingdao, driven by prevailing hydrodynamic conditions. These spatiotemporal dynamics are consistent with findings reported by Kwan et al. (2022) and Yuan (2022), who also observed similar growth patterns and drifting behaviors in their studies. This phenomenon can be attributed to a combination of favorable natural conditions, such as hydrodynamic patterns and nutrient availability, alongside anthropogenic influences like coastal aquaculture and pollution, making the Yellow Sea and the East China Sea a hotspot for Ulva prolifera green tide blooms (Li et al., 2017; Zhang et al., 2019, 2020). Additionally, Ulva prolifera green tide has also occurred along the coasts of South Korea, certain regions of Southeast Asia, and the Gulf of Mexico (Hu, 2009; Kim et al., 2020; Shao et al., 2024). Although the frequency and extent of these green tide events in these regions are relatively lower than those in the Yellow Sea and the East China Sea, they still represent potential sites for green tide growth because of favorable environmental conditions.

Figure 2. Cultivated area of Porphyra in China (data from the National Fisheries Statistical Yearbook).
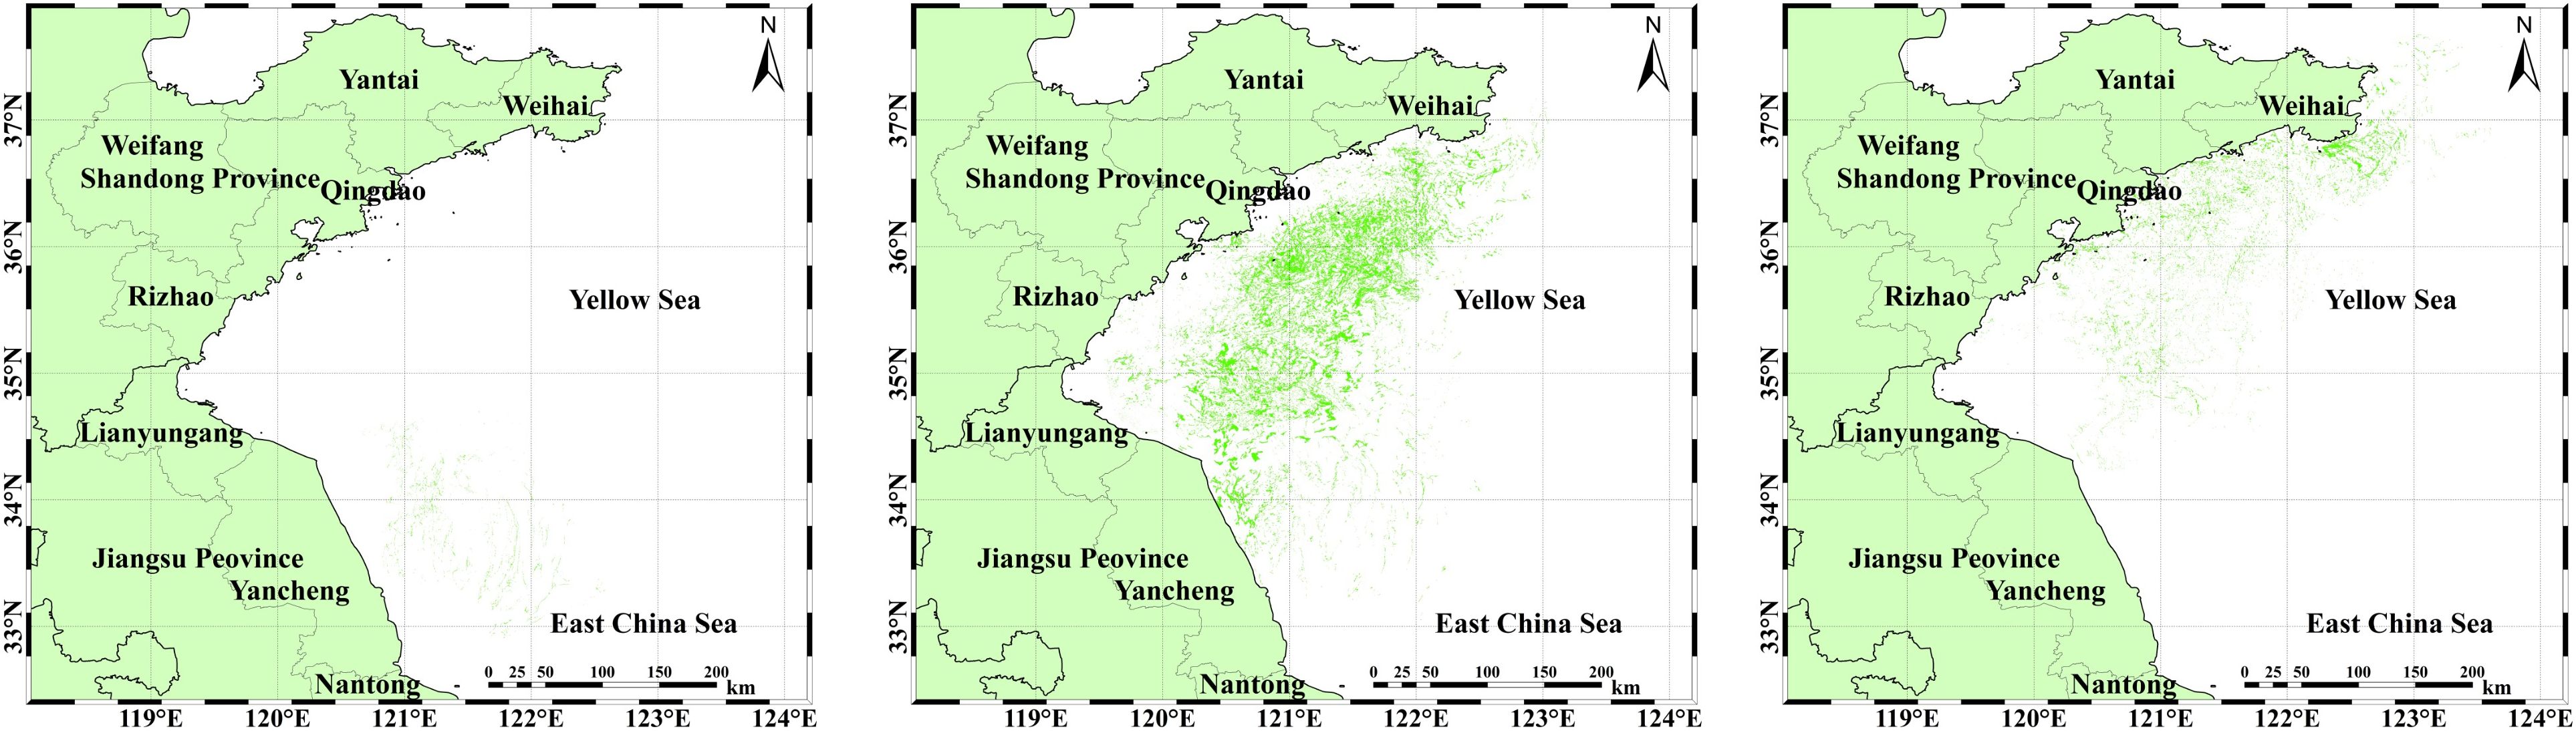
Figure 3. Distribution of Ulva prolifera detected using Sentinel-1 from May to July 2019. From Left to right: May, June, and July. Green areas indicate the distribution of Ulva prolifera.
Satellite remote sensing offers extensive monitoring coverage, high temporal resolution, and low-cost monitoring of green tides, enabling long-term dynamic observation. Consequently, remote sensing is widely applicable for monitoring green tide coverage, biomass, and drift trajectory of Ulva prolifera blooms. As reviewed in the literature, various sensors with distinct spectral bands and resolutions have been used to monitor Ulva prolifera green tides, including MODIS, VIIRS, GOCI I/II, Landsat-3/5/7/8/9, as well as China’s GaoFen series, HJ-1 series, and HaiYang-2 series satellites (Son et al., 2015; Xing and Hu, 2016, 2016; Sun et al., 2021; Men et al., 2023), as summarized in Table 1.
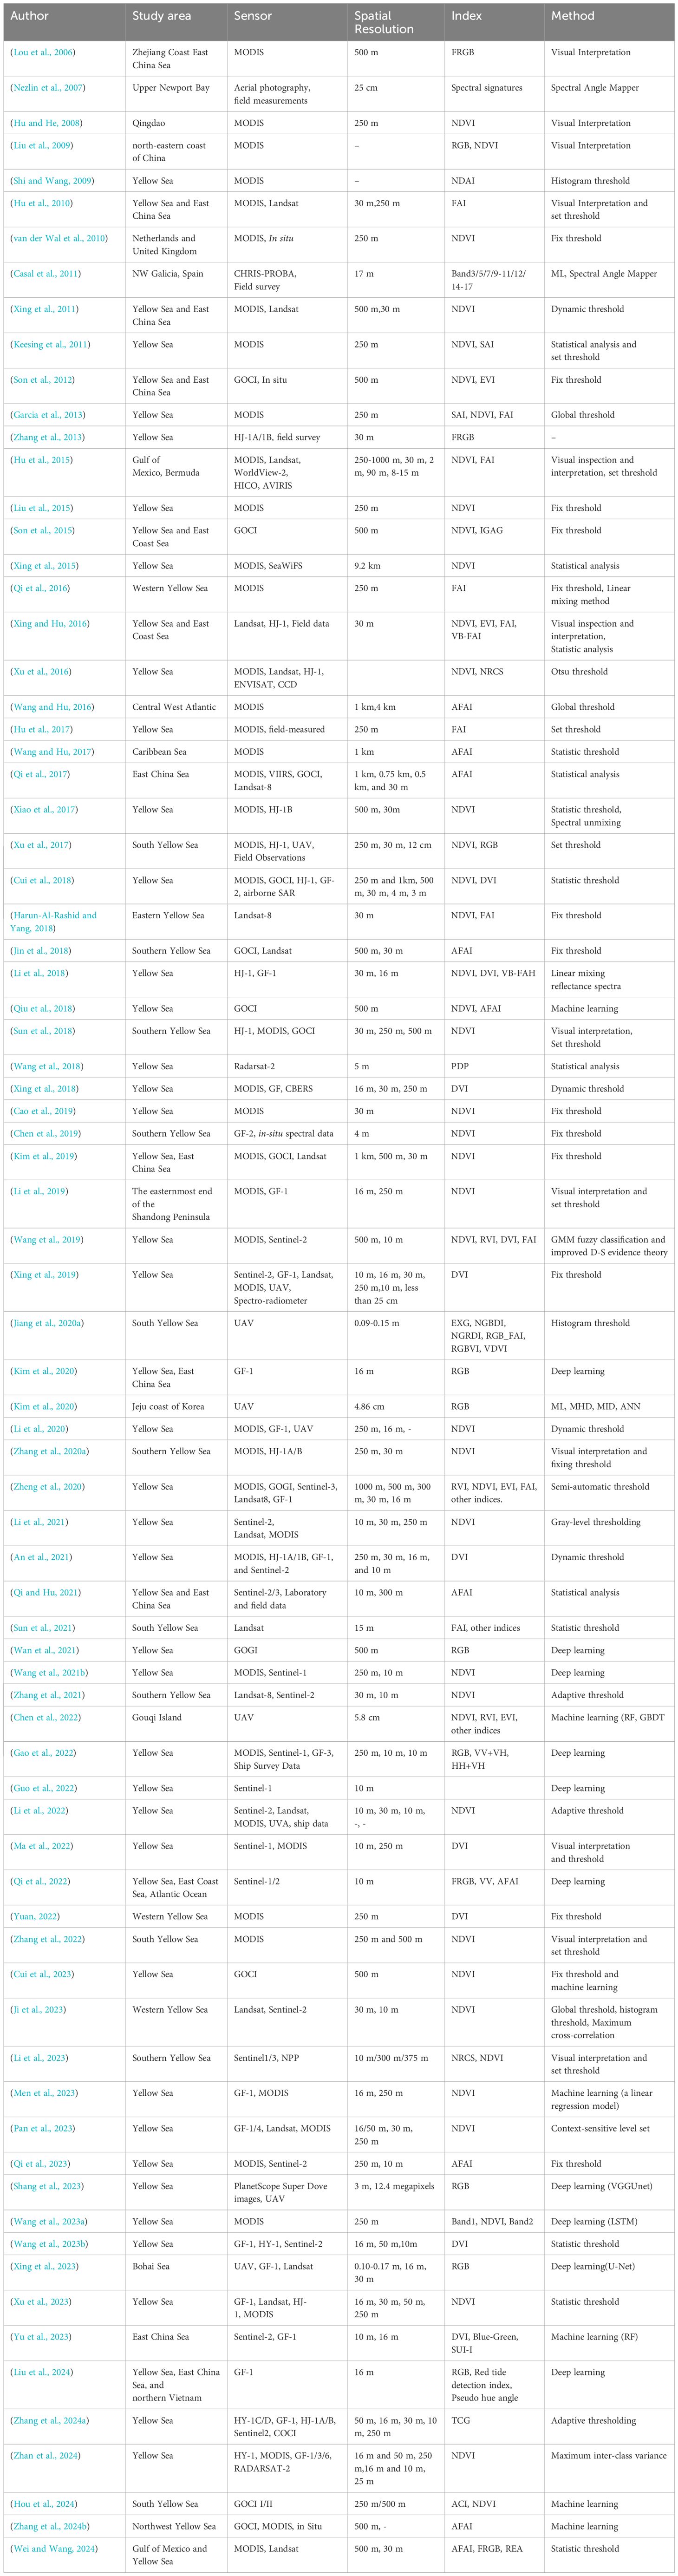
Table 1. Overview of remote sensing data, resolutions, and methods for Ulva prolifera green tide monitoring.
Ulva prolifera green tides are characterized by their dark green appearance in remote sensing imagery, primarily due to the filamentous structure of their thalli. This distinctive appearance of Ulva prolifera green tides is attributed to its unique spectral nature, which features higher reflectance in the green wavelength range and lower reflectance in the near-infrared (NIR) band (Zhang et al., 2013). Based on these spectral characteristics, several band indices have been developed and applied for detecting Ulva prolifera green tides. A comprehensive summary of these indices and their applications is presented in Table 1. These band indices include the normalized difference vegetation index (NDVI) (Hu and He, 2008; Hu, 2009), the normalized difference algae index (NDAI) (Shi and Wang, 2009), the floating algae index (FAI) (Hu, 2009; Garcia et al., 2013; Hu et al., 2015), the alternative floating algae index (AFAI) (Wang and Hu, 2016, 2017), the scaled algae index (Keesing et al., 2011), the enhanced vegetation index (EVI) (Xing et al., 2018; Zheng et al., 2020), the difference vegetation index (DVI) (Li et al., 2018; Xing et al., 2019), virtual-baseline floating algae height (VB-FAH) (Li et al., 2018), and the ratio vegetation index (RVI) (Wang et al., 2019; Zheng et al., 2020), among others indices (Yu et al., 2023; Wei and Wang, 2024; Zhang et al., 2024a). These indices have significantly advanced the detection of location, estimation of the coverage area and biomass, and prediction of the drift trajectories for Ulva prolifera green tides. Furthermore, the integrating of optical remote sensing indices with oceanographic dynamic parameters and environmental variables has yielded valuable insights into the spatiotemporal characteristics of green tides (Son et al., 2015; Jin et al., 2018; Wang et al., 2023a; Li et al., 2022). However, the dynamic nature of the marine environment often results in clouds and fog obstructing observations, making it challenging to obtain valid data. Fortunately, synthetic aperture radar (SAR), with its ability to penetrate clouds and fog and operate in all-weather, day-and-night conditions, has proven invaluable in overcoming these challenges (Cui et al., 2018; Gao et al., 2022; Li et al., 2023, 2024). For example, Li et al. (2023) effectively utilized Sentinel-1 SAR data to monitor the spatial distribution of Ulva prolifera, demonstrating its robustness in capturing key morphological features, even under adverse weather conditions. Moreover, SAR’s sensitivity to variations in surface roughness allows for the identification of floating algal blooms by differentiating them from surrounding water surfaces and other floating objects (Qi et al., 2022). In addition, SAR has been employed in biomass estimation and spatiotemporal tracking of green tides. By integrating SAR-derived backscatter metrics with auxiliary environmental data, researchers have developed models to estimate algal density and monitor its drift trajectories under varying oceanographic conditions (Guo et al., 2022; Li et al., 2023).
Given its wide coverage and strong monitoring capability, remote sensing has become a vital tool for studying the dynamics of large-scale Ulva prolifera green tide blooms. However, the accuracy of remote sensing monitoring and green tides assessments is influenced by the spatial and temporal resolution of various remote sensing data sources. For example, low-resolution satellite imagery (particularly within the range of 100-1000 m) tends to overestimate the coverage area of large algal blooms, often missing smaller patches in affected areas (Wang et al., 2021a). This overestimation occurs because pixels containing algae are often mixed, including background water information, as highlighted by Hu et al. (2019) and Qi et al. (2019). To address this issue, linear spectral unmixing techniques have been employed to decompose mixed pixels, thereby improving the accuracy of algal coverage and biomass estimates (Hu et al., 2023). Moreover, image compositing methods, which integrate individual images or average monthly observations, have been shown to further enhance the accuracy of coverage assessments (Qi et al., 2016).
The effectiveness of green tide detection methods depends heavily on the algorithm employed, as certain approaches inherently introduce biases and limitations that can impact the accuracy and reliability of the results. For example, manual visual interpretation, fixed thresholding, or adaptive threshold for threshold selection remains a common practice in green tide monitoring. However, these methods are often unstable due to varying observational conditions (Cui et al., 2023; Tang et al., 2023). In contrast, machine learning and deep learning models have demonstrated greater capability, accuracy, and efficiency in detecting and analyzing Ulva prolifera green tides. Nevertheless, their application faces several challenges, such as the need for large, high-quality training datasets, and the issue of limited interpretability (Zhu et al., 2017). Compounding these challenges, the dynamics of Ulva prolifera green tide blooms are influenced by a range of environmental factors, which make large-scale monitoring even more complex. For example, several studies have reported that the highest Ulva prolifera green tide coverage occurred in 2021, which was several times greater than that in 2019 (Li et al., 2022; Zheng et al., 2022a). In contrast, another study indicated that the coverage of Ulva prolifera green tide peaked in 2019 (Qi et al., 2022). These discrepancies underscore the inconsistencies arising from differences in sensors, methodologies, and environmental conditions, which collectively complicate the detection and estimation of Ulva prolifera green tide blooms.
In summary, significant progress has been achieved in remote sensing-based monitoring of Ulva prolifera green tides. However, several critical challenges remain, including the influence of data resolution on area and biomass estimations, biases introduced by algorithmic selections, and inconsistencies in monitoring results caused by sensors and environmental conditions variations. Therefore, it is essential to systematically review the progress in this field, summarize the strengths and limitations of existing approaches and explore future research directions. By providing a comprehensive overview of recent developments, key techniques, and applications related to Ulva prolifera green tides, this study offers valuable insights to advance research and proposes feasible strategies to address current scientific challenges. This work serves as a valuable resource for researchers in remote sensing, marine ecology, and environmental science. Furthermore, it offers guidance for practitioners involved in coastal management and algal bloom prevention, as well as for policymakers and government administrators.
This study focuses on the field of remote sensing monitoring of Ulva prolifera green tide blooms. A literature search was performed using the keywords “Ulva prolifera and remote sensing” and “green tides and remote sensing” in the Web of Science, yielding 153 relevant publications from 2009 to 2024. A visual analysis of these publications was conducted using the CiteSpace bibliometric analysis tool, revealing the developmental trajectory and current state of research in the remote sensing monitoring of Ulva prolifera green tide blooms.
The temporal variation in publication numbers reflects the growing interest in Ulva prolifera green tide monitoring, underscoring its increasing importance in the scientific community. Between 2009 and 2017, the number of relevant articles remained relatively low, with no publications in 2012. However, since 2017, the volume of publications has steadily increased, peaking in 2023 with 26 articles. These publications were distributed across 60 journals, with Remote Sensing leading with 19 articles, followed by Marine Pollution Bulletin with 12, and Marine Environmental Research with 7, among others. This upward trend in publication volume indicates that remote sensing–based monitoring of green tides has become a prominent research focus, in line with the latest scientific developments, as shown in Figures 4, 5.

Figure 4. Publication trends in remote sensing research on Ulva prolifera green tide from 2009 to 2024.
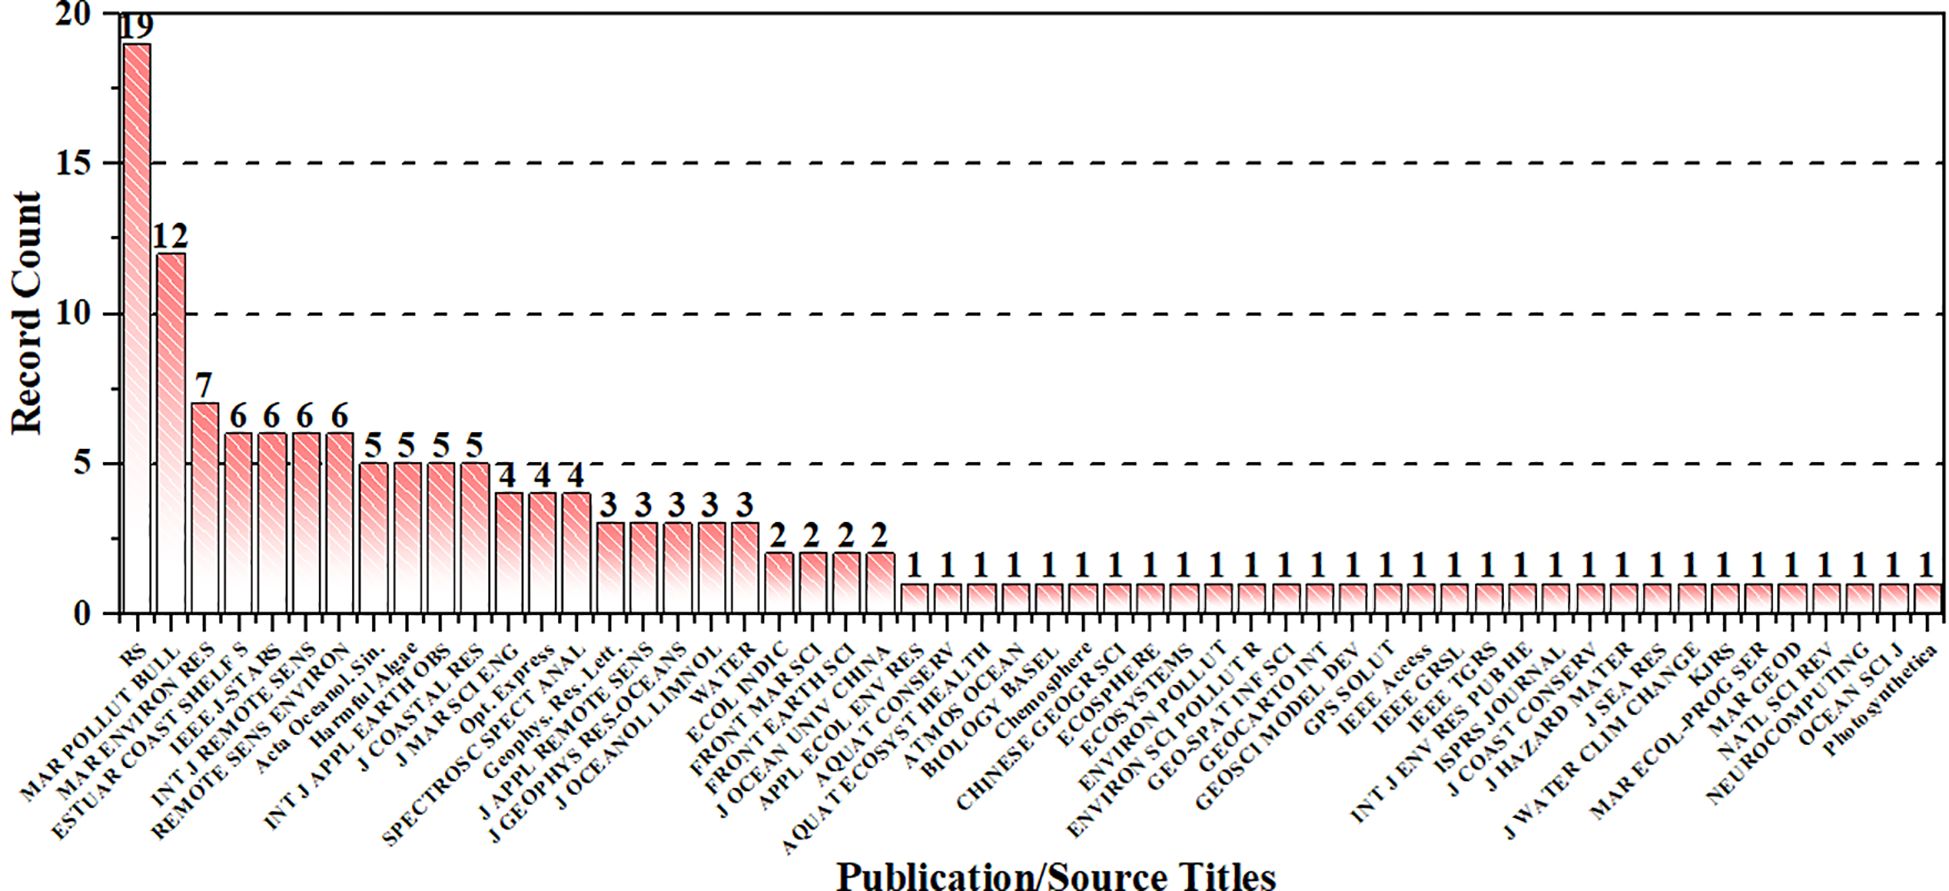
Figure 5. Number of publications by the journal on Ulva prolifera green tide.
Further analysis of the author collaboration network, using CiteSpace, identifies several prominent research groups, with two central clusters led by Hu Chuanmin and Xing Qianguo. This finding indicates a growing trend toward collaborative research in the field of Ulva prolifera green tide monitoring, as shown in Figure 6. In addition, the research institution collaboration network underscores the remarkable contributions of institutions such as the Chinese Academy of Sciences, Ocean University of China, and Yantai Institute of Coastal Zone Research, all of which play key roles in advancing this area of study, as illustrated in Figure 7.
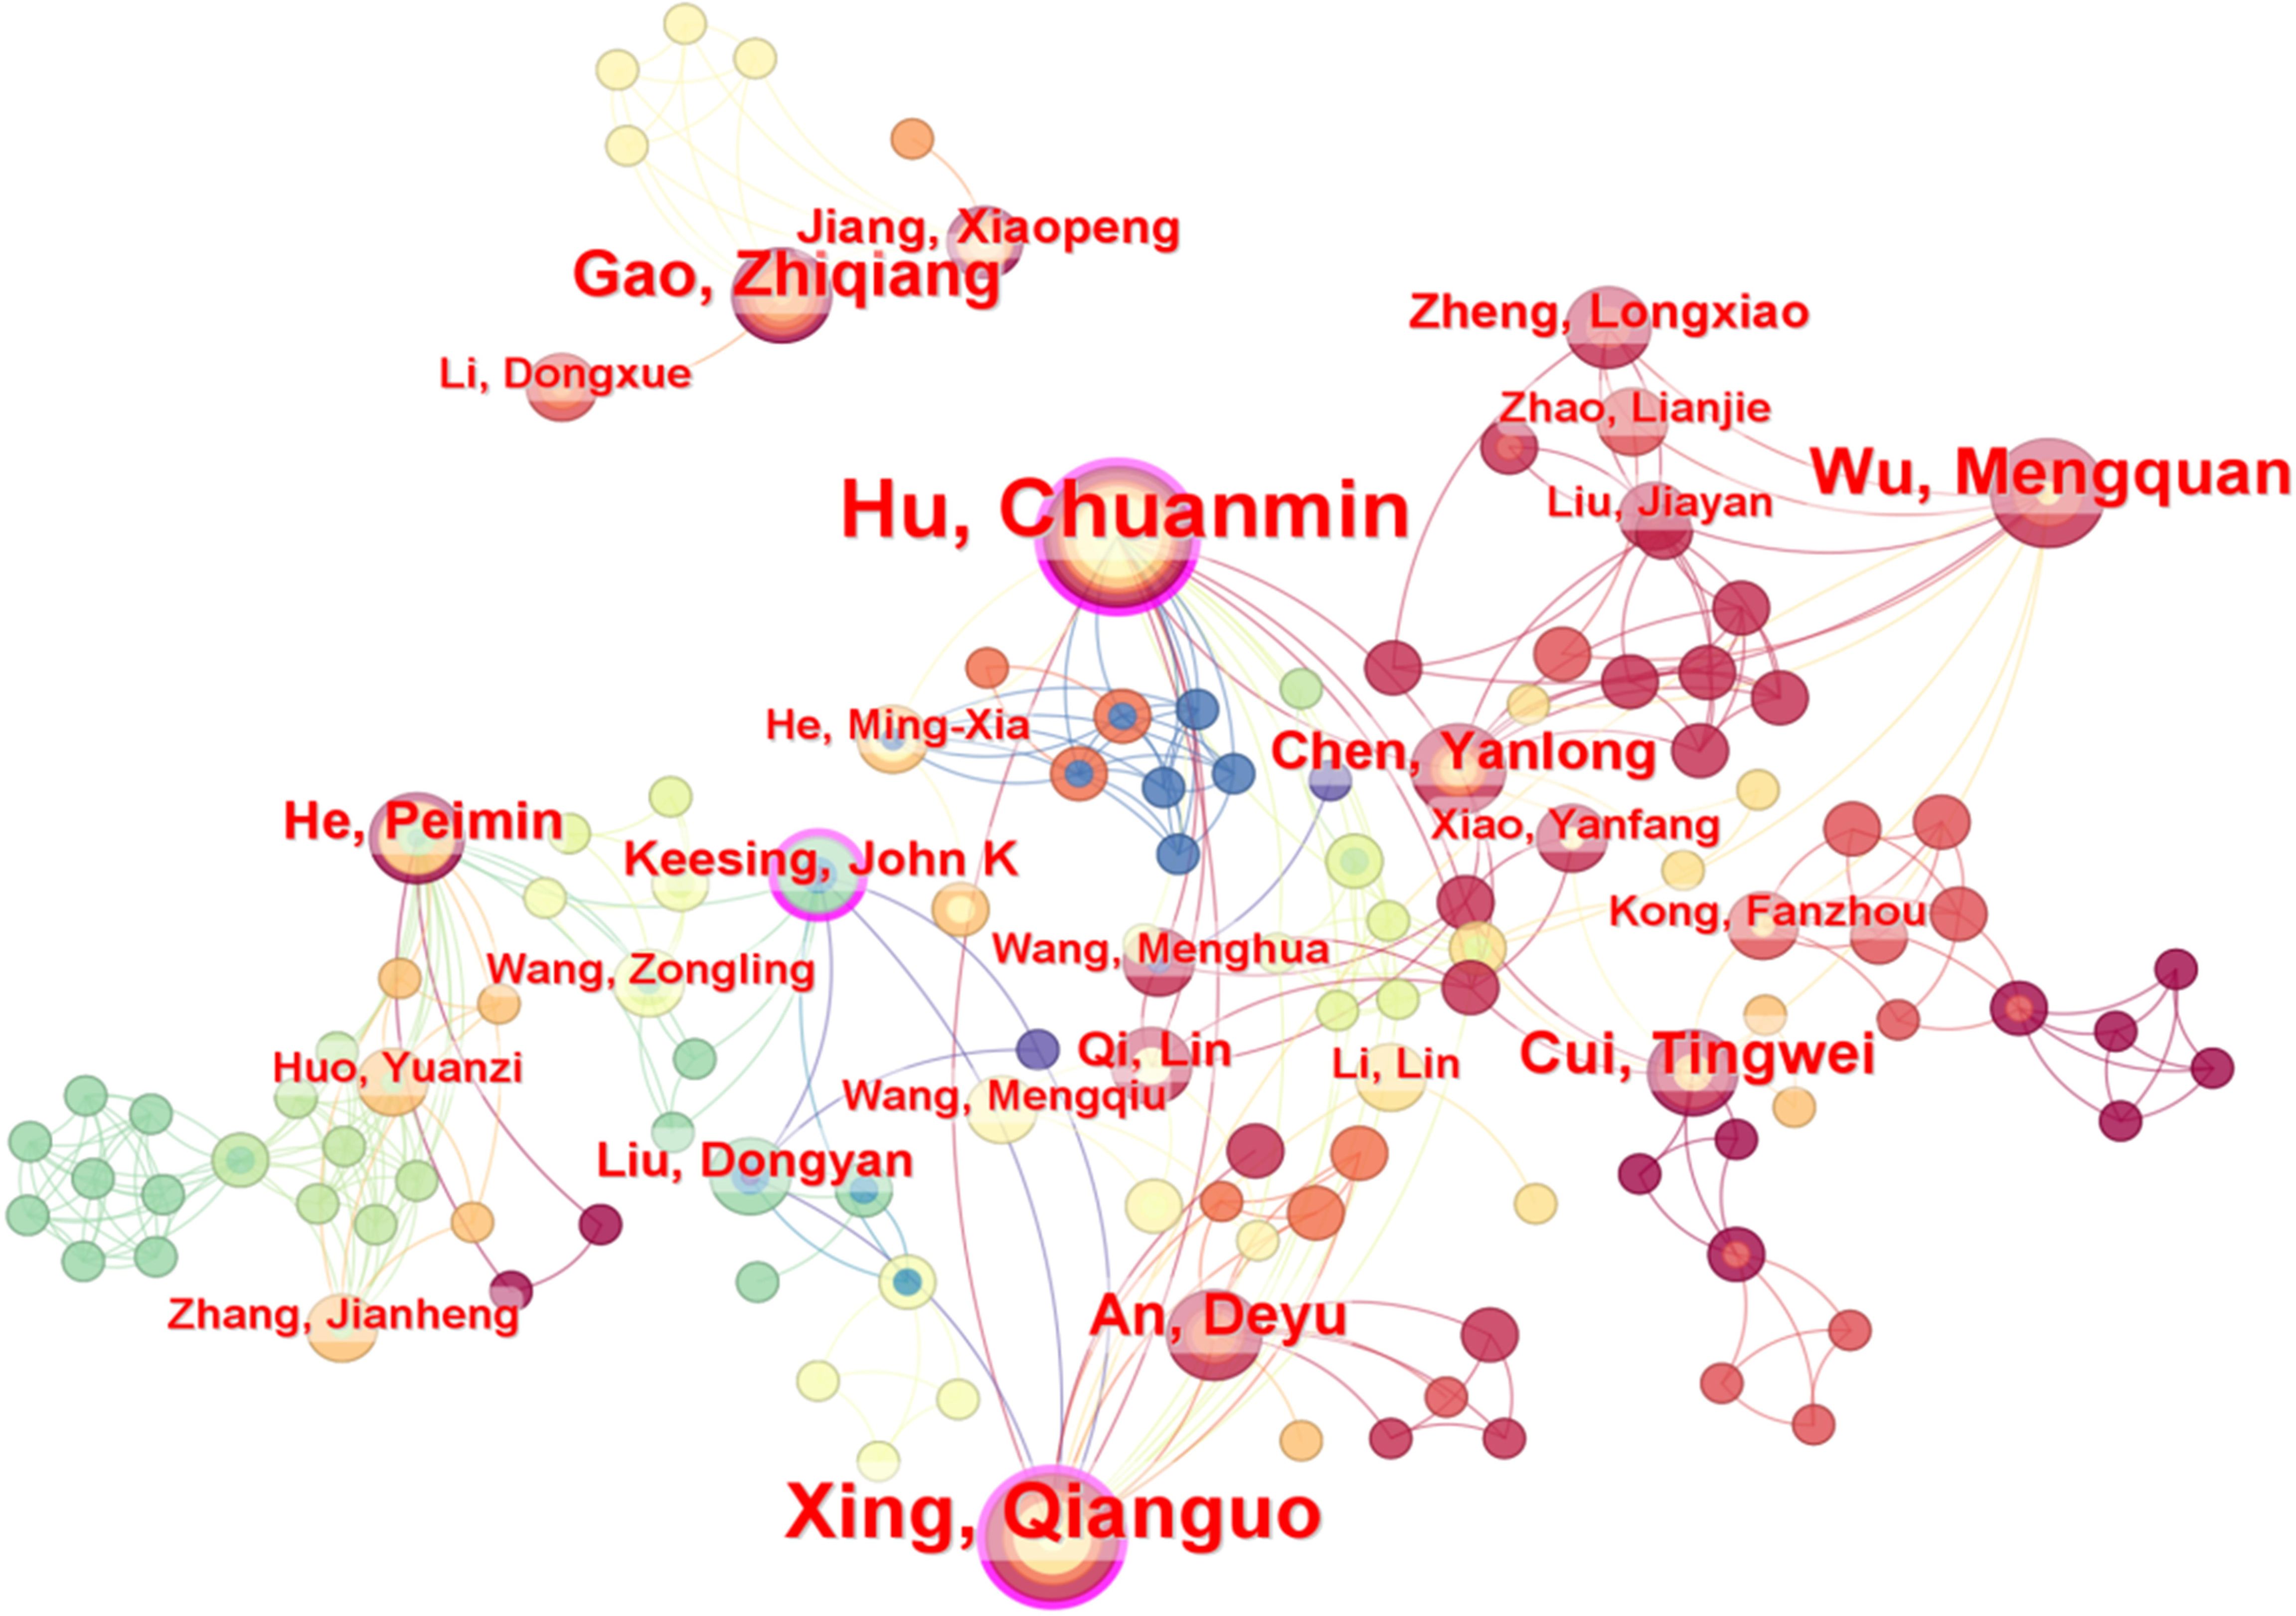
Figure 6. Author co-occurrence network map.
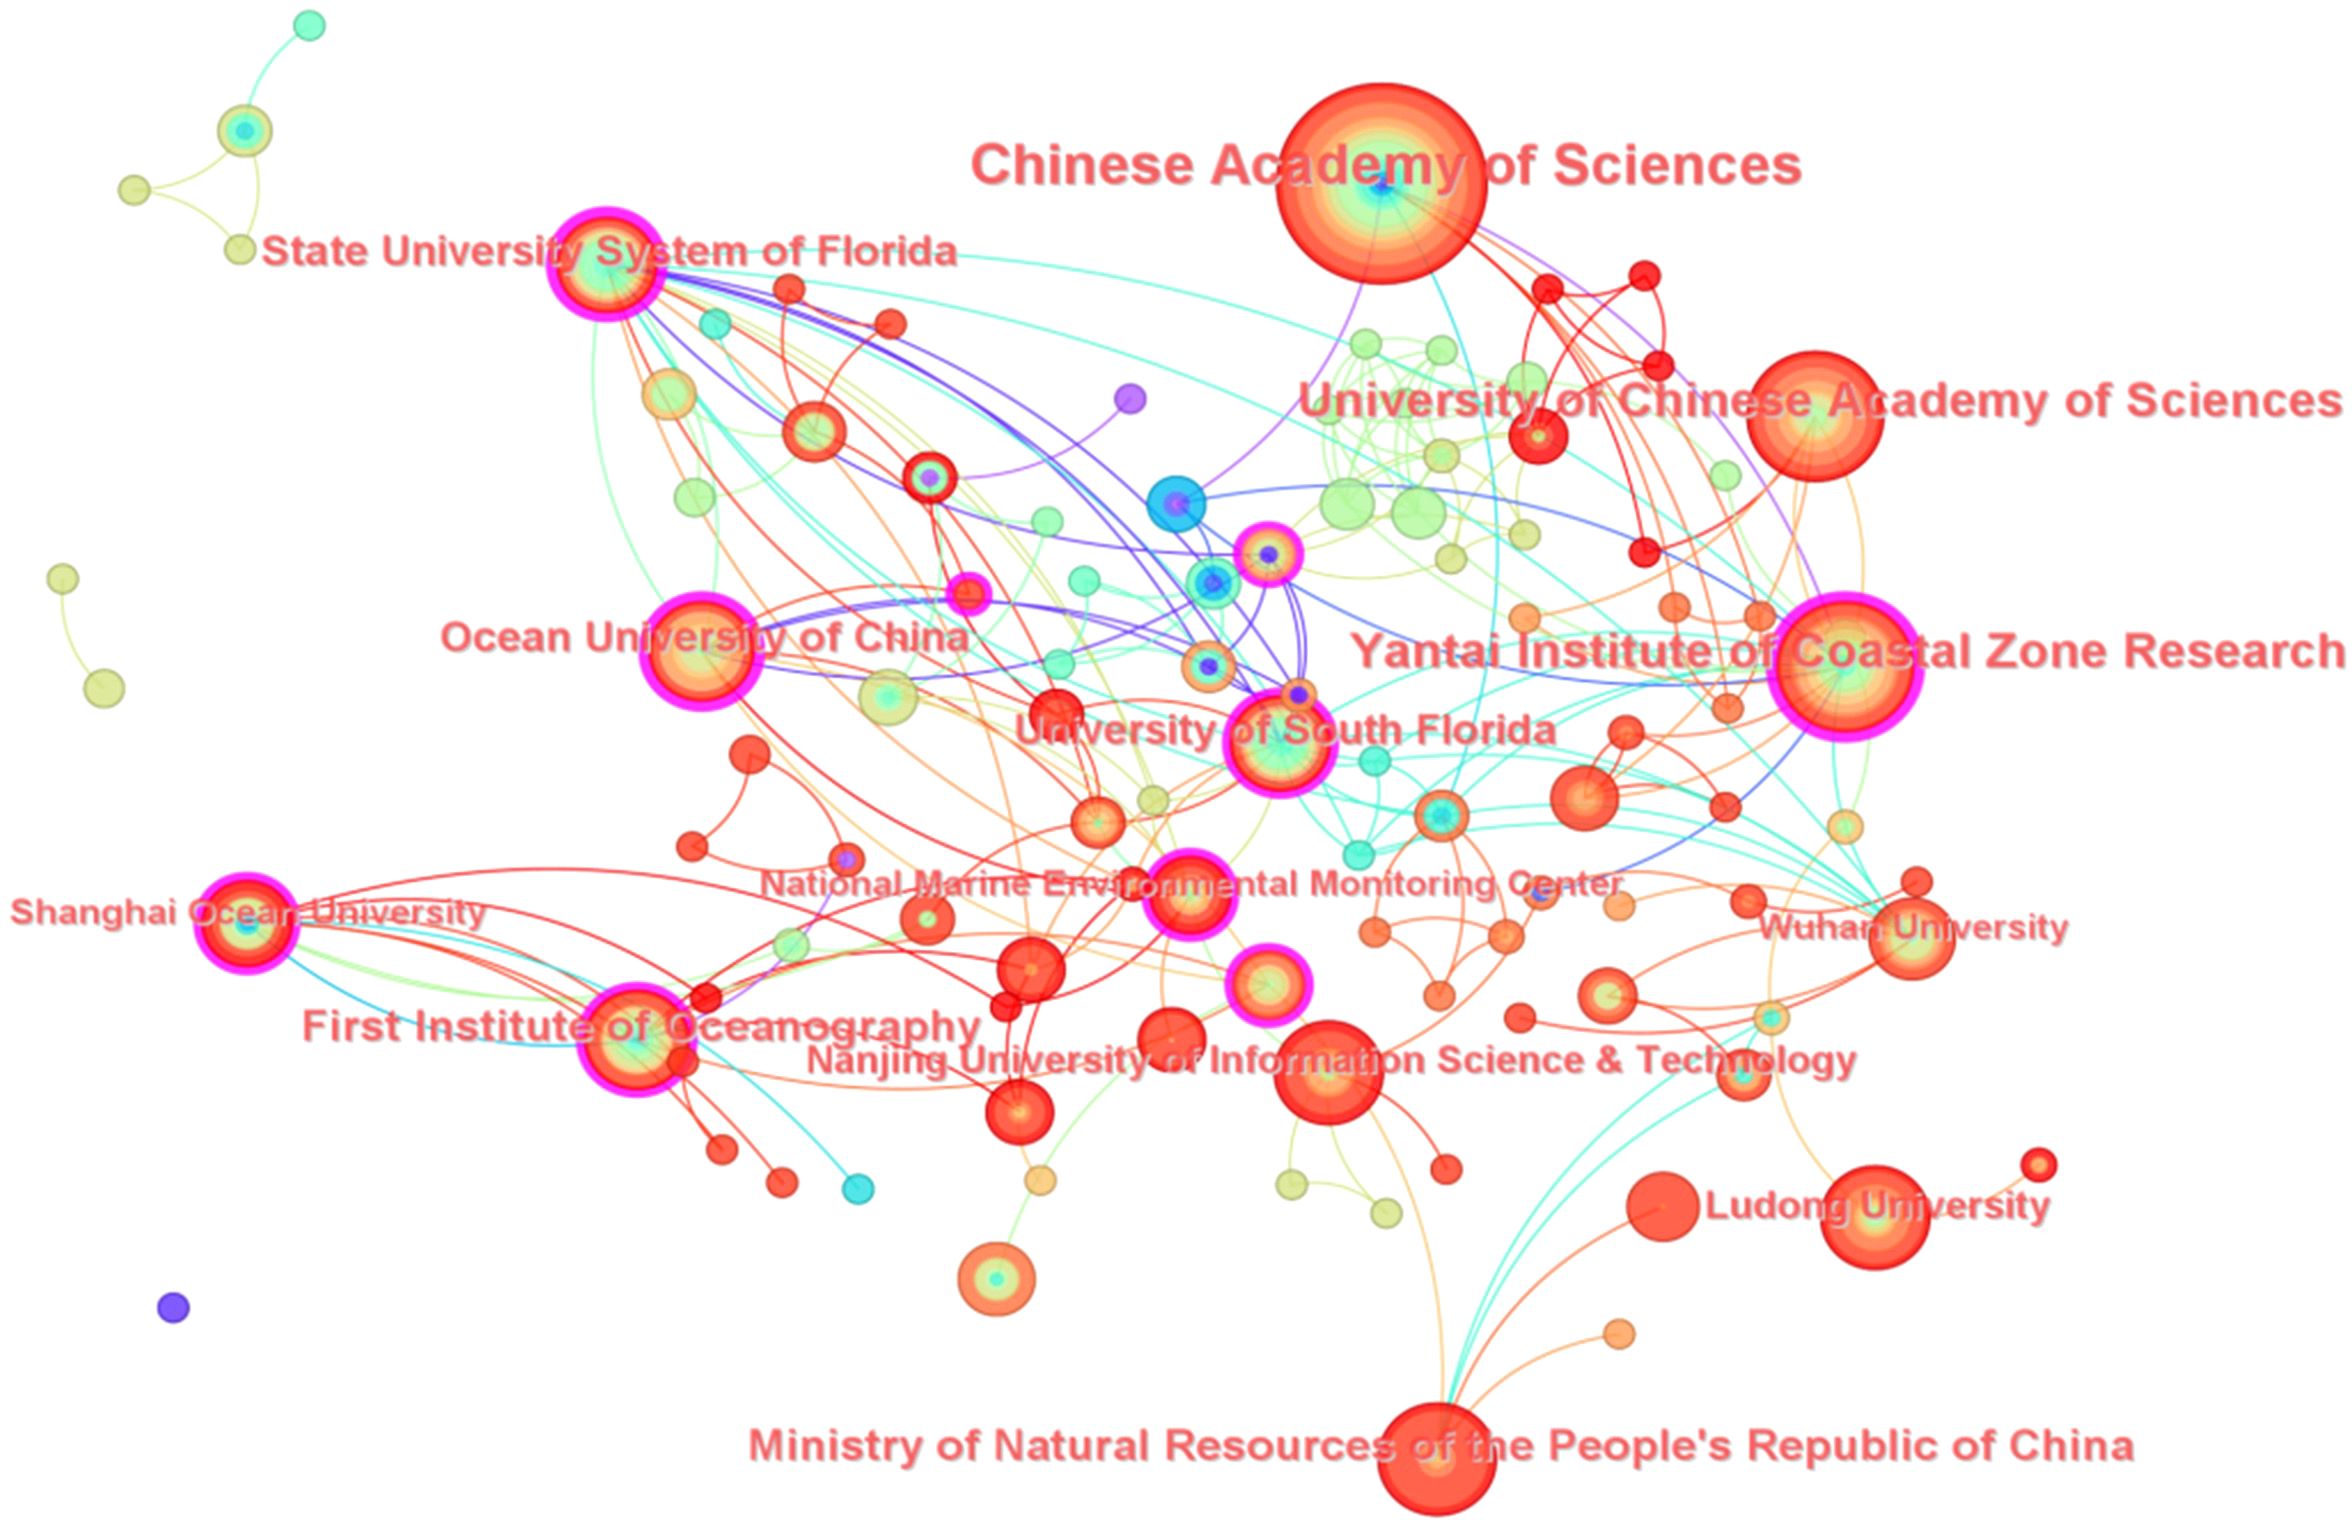
Figure 7. Institutional cooperation co-occurrence network map.
Figure 8 presents the keyword co-occurrence network analysis, highlights the frequently used keyword terms such as Ulva prolifera, green tide, Yellow Sea, East China Sea, remote sensing, biomass, and area estimation. Research on Ulva prolifera green tides focuses on topics such as growth, expansion, bloom events, dynamics, interannual variability, growth rates, biomass, area estimation, and prediction modeling, with a strong emphasis on applications of remote sensing technologies. Notably, this study specifically centers on the Yellow Sea and East China Sea regions, which serve as key areas for understanding the dynamics and impacts of Ulva prolifera green tides.

Figure 8. Keyword co-occurrence network map.
The remote sensing monitoring of Ulva prolifera green tide primarily relies on satellite, aerial, and unmanned aerial vehicle (UAV) technologies, as listed in Table 1. Each platform offers advantages and limitations in monitoring green tides, as summarized in Table 2. Satellite remote sensing technology is highly effective for large-scale, long-term observations, extensive coverage and regular revisit capabilities. However, their spatial resolution and ability to detect smaller patches of green tides are insufficient compared to aerial remote sensing. In addition, in-situ measurements and oceanographic environmental data, such as sea surface temperature (SST), sea surface wind (SSW), sea surface salinity (SSS), rainfall, ocean currents, and solar radiation, are used to calibrate and validate remote sensing data.
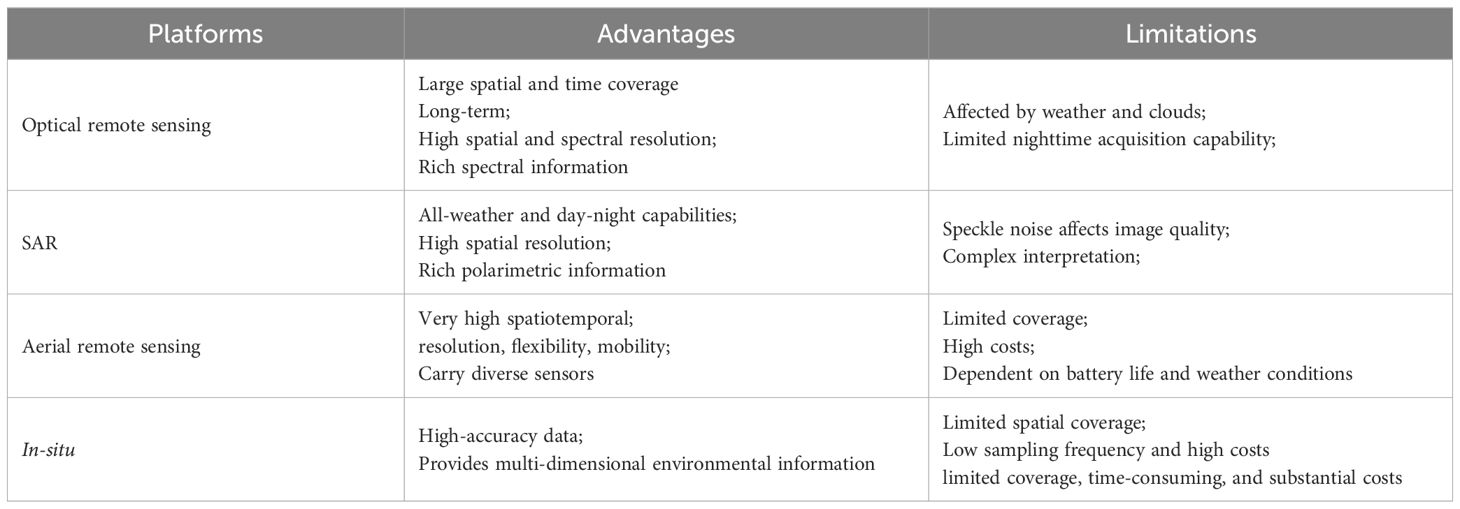
Table 2. Comparing the advantages and limitations of different platforms.
MODIS (TERRA/AQUA) has been providing data from 36 bands with spatial resolutions of 250 m, 500 m, and 1 km capturing observations twice daily since 2002, making it a widely used tool for long-term monitoring of algal blooms (An et al., 2022; Men et al., 2023; Qi et al., 2023). Similarly, GOCI I/II, with its capability for high-frequency observations at 1-hour intervals and spatial resolution of 250 and 500 m, is particularly well-suited for real-time monitoring of algal bloom dynamics, distribution, and drift of Ulva prolifera green tides (Gu et al., 2011; Son et al., 2012). The first application of MODIS data for green tide research was conducted by Hu and He (2008), who studied the origin, nearshore distribution, and temporal variations of floating algae during the 2008 Beijing Olympic sailing competitions (Hu and He, 2008). High-resolution satellites, such as Landsat-3/5/7/8/9, Sentinel-2/3, GF-1/2, and HY-1A/B/C/D/E, provide high spatial resolution and they can effectively complement the limitations of MODIS and GOCI I/II in monitoring green tides over wide areas (Xu et al., 2016). However, optical remote sensing remains vulnerable to disruptions caused by cloud cover, fog, and rainfall, which often hinder data acquisition in real-world scenarios. To address the limitation, synthetic aperture radar (SAR) satellites, such as ASAR, ENVISAT, Sentinel-1, and Radarsat-1/2, have been employed (Xu et al., 2016; Qi et al., 2022). These synthetic aperture radar (SAR) satellites offer all-weather, day-and-night observation capabilities, enabling continuous and reliable monitoring of the spatial distribution and movement patterns of green tides (Wang et al., 2018; Li et al., 2023). Given the advantages and limitations of optical and SAR remote sensing, a growing trend in Ulva prolifera green tide research is the integration of multi-sensor imagery to achieve a comprehensive understanding of the spatial distribution, temporal variation, and movement patterns of green tides, while mitigating the inherent limitations of each data source (Hu et al., 2015; Xu et al., 2016).
Additionally, SST and SSW derived from passive microwave sensors play a critical role in the development of green tides, influencing their germination, growth rates, movement direction, and spatial distribution (Zhan et al., 2024). A review of the literature indicates that SSW data are primarily obtained from microwave scatterometers such as ASCAT and QuikSCAT, which provide a spatial resolution of 0.25°. In contrast, SST data are commonly retrieved from MODIS and NOAA sensors, offering higher spatial resolutions of 0.1° and 0.25°, respectively.
In general, aerial remote sensing, including UAV and manned aircraft, provides higher resolution than satellite remote sensing, often achieving the centimeter level or even finer. This high resolution enables the capture of detailed information about Ulva prolifera green tides, particularly in nearshore and shallow water areas, where small-scale green tides can be effectively identified (Xing et al., 2011; Kim et al., 2020; Li et al., 2020; Xing et al., 2023). For example, Li et al. (2020) investigated the northernmost drift location of green tides in the Yellow Sea. Although satellite imagery had suggested that no green tides had reached the Shidao Island area, UAV imagery revealed small nearshore patches, indicating that green tides had already invaded local aquaculture zones. In addition, aerial remote sensing offers flexibility for conducting local flights within a short time frame, enabling the acquisition of real-time data without the limitation of satellite revisit cycles. Furthermore, it facilitates the customization of spectral bands (e.g., visible light, infrared, thermal imaging, and LiDAR) to address specific monitoring requirements, thereby making it highly adaptable to diverse applications (Rossiter et al., 2020; Chen et al., 2023; Shang et al., 2023; Xing et al., 2023). For example, Jiang et al. (2020a) developed a new green tide index based on UAV images, which demonstrated superior extraction accuracy for green tides during the decay phase under hazy atmospheric conditions. Similarly, Jiang et al. (2020b) used UAV to detect and evaluate the initial biomass of green algae attached to aquaculture rafts in shallow waters of northern Jiangsu.
While these studies highlight the advantages of aerial remote sensing in algal monitoring-such as high spatiotemporal resolution, flexibility, mobility, and the capacity to carry diverse sensors-certain limitations, including restricted coverage and operational constraints, primarily position it as a tool or supporting and validating satellite remote sensing data.
Field Observation data offer high precision and resolution, making them crucial for the calibration and validation of remote sensing data, to ensure the accuracy of remote monitoring results (Hu et al., 2019; Xiao et al., 2019; Zhang et al., 2024b). On-site measurements, such as the biomass of green tides and environmental parameters (e.g., SST, SSS, and nutrient concentrations), provide essential calibration data for the validation of remote sensing observations (Zhang et al., 2024b). Laboratory or field measurements of the surface reflectance of mixed algae-water samples at various ratios can help establish the upper threshold values for pixel decomposition, which is critical for accurately estimating the coverage of green tides (Hu et al., 2017). Ground-based high-frequency multispectral cameras are used to measure spectral reflectance in the field, enabling the accurate identification and classification of different algae types, as well as the estimation of their coverage and health status (van der Wal et al., 2014). Additionally, data assimilation techniques allow ocean buoy data to be integrated with satellite remote sensing and historical data within ocean circulation models to simulate the drift paths of floating algae (Choi et al., 2023).
The calibration and validation of remote sensing data using field observation data play an essential role in ensuring the accuracy and reliability of remote sensing results. However, despite the high precision and resolution of these observations, their application in large-scale monitoring faces several challenges, such as limited coverage, time-consuming, and substantial costs. Therefore, to achieve effective monitoring of the occurrence, development, and temporal dynamics of Ulva prolifera green tides over large spatial and long temporal scales, it remains essential to integrate satellite and aerial remote sensing technologies. This integration is crucial for improving the spatial and temporal accuracy of monitoring.
Table 3 lists the commonly used oceanic environmental parameters, including SST, SSW, photosynthetically available radiation (PAP), ocean currents, salinity, precipitation, chlorophyll concentration, and nutrient levels, which influence Ulva prolifera green tide growth, decay, and drift (Xu et al., 2016; Li et al., 2017; Jin et al., 2018; Li et al., 2022; Xiao et al., 2024). In addition to remote sensing data, SST and SSW are frequently obtained from datasets such as the ECMWF Reanalysis 5th Generation (ERA5) and the Hybrid Coordinate Ocean Model (HYCOM), with spatial resolutions ranging from 0.08° to 0.25° (Li et al., 2020, 2021; Zheng et al., 2022b). Table 3 also lists the spatial and temporal resolutions for other oceanic environmental parameters (Li et al., 2021, 2022; Xue et al., 2023; Hou et al., 2024). Although existing oceanic physical, ecological, and other environmental data typically have much lower spatial resolution than remote sensing data, studies have not identified significant discrepancies in the large-scale spatiotemporal distribution, biomass estimation, driving factor analysis, or drift trajectory of green tides when using data from different models.
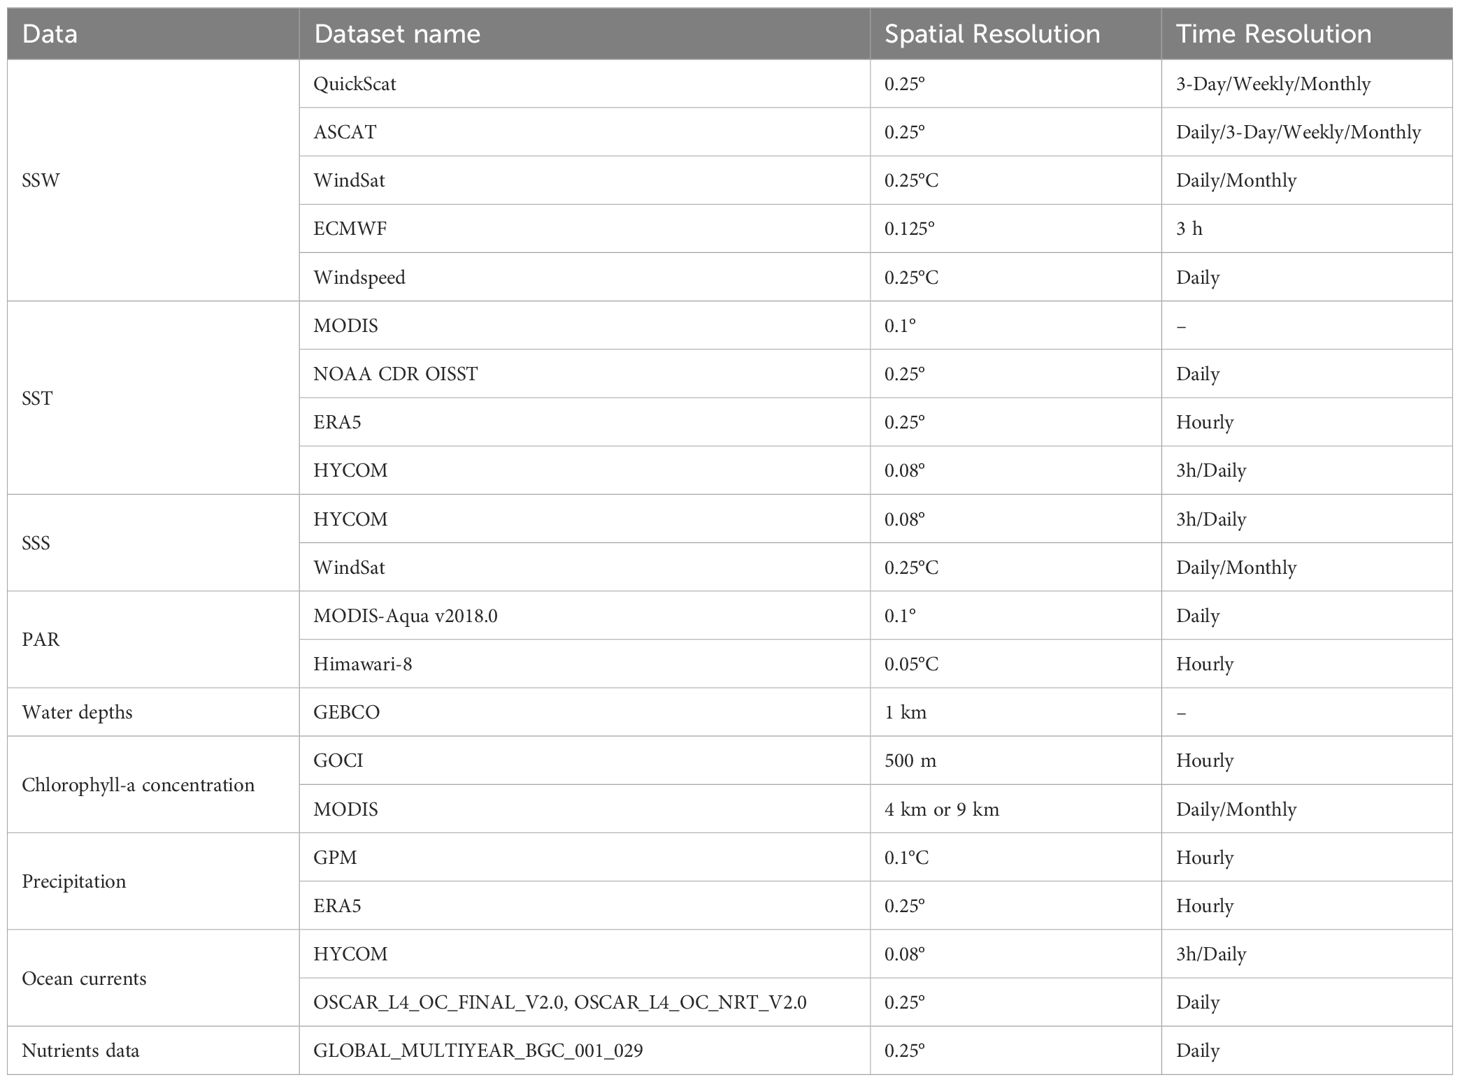
Table 3. Potential driving factors of Ulva prolifera green tides.
Researchers have developed several remote sensing methods for monitoring Ulva prolifera green tides, focusing on detecting their spatial distribution and estimating their biomass and coverage area. As shown in the Ulva prolifera green tide distribution map from May to July 2019 in Figure 8. Additionally, studies have extended to analyzing the spatial and temporal distribution patterns of green tides, integrating environmental factor analysis to understand the conditions driving their growth. Furthermore, predictive models have been applied to track the drift trajectories of green tides, enhancing understanding of their movement and spread (Li et al., 2014; Wang et al., 2015). These approaches include band indices, thresholding segmentation, machine learning, and deep learning methods. Among these methods, while deep learning approaches are currently the most widely used, several challenges remain, such as lack of interpretability and significant computational resources required, with the detailed summary provided in Table 4.

Table 4. Comparing the advantages and limitations of green tide monitoring methods.
Various remote sensing band indices, including NDVI, FAI, EVI, SAI, DVI, and RVI, have been commonly employed in monitoring Ulva prolifera green tides, as summarized in Table 1. The definitions for these indices are provided below in Equations (1) to (5). NDVI utilizes the reflectance difference between the NIR bands to identify floating algae. NDVI was first applied successfully to describe the origin and evolution of floating algae in the Yellow Sea during the 2008 Beijing Olympic Games (Hu and He, 2008). However, NDVI values are highly sensitive to environmental factors such as aerosols, solar/viewing geometry, and water turbidity, which may complicate its effectiveness in distinguishing floating algae from surrounding waters (Hu, 2009). For example, in clear water, the red and NIR bands absorb light, leading to low NDVI values, while suspended materials like sediments and Sargassum modify the reflectance characteristics, particularly in these bands. These variations reduced contrast between floating algae and surrounding water, complicating the quantitative analysis of NDVI values (Hu, 2009; Huang et al., 2021). Additionally, NDVI’s reliance on the reflectance difference between red and NIR bands limits its ability to accurately reflect high biomass levels when algae concentration is high. To address these limitations, alternative indices such as EVI and FAI have been developed. EVI improves upon NDVI by incorporating the blue band to reduce atmospheric aerosol and water interference, thereby enhancing the response to vegetation photosynthesis. This makes it more accurate when monitoring high concentrations of green tides and Sargassum (Xing et al., 2018; Zheng et al., 2020). RVI, as an adaptation of the EVI, utilizes the ratio of reflectance between the NIR and RED bands. This modification enhances its ability to identify and monitor the spatial distribution and spread of floating algae, such as Sargassum and green tides, particularly under variable environmental conditions (Wang et al., 2019; Zheng et al., 2020). FAI combines the RED, NIR, and short-wave infrared (SWIR) bands, greatly reducing the impact of sun glint or haze and improving its ability to distinguish algae from suspended matter (Xing et al., 2018; Zheng et al., 2020). Studies have shown that FAI is less sensitive to environmental and observational changes, making it more stable than NDVI and EVI (Hu, 2009). However, FAI does not offer an effective cloud masking method, which results in both clouds and Sargassum exhibiting high FAI values in images. To address this, a modified version of FAI, known as AFAI, was proposed, which uses different spectral bands (RED = 667 nm, NIR = 748 nm, SWIR = 869 nm) to improve accuracy (Wang and Hu, 2016). A major limitation of FAI is the unavailability of SWIR bands on many satellite sensors, which necessitates the use of alternatives such as DVI. DVI is particularly sensitive in areas with low vegetation cover, making it suitable for early-stage and mid-stage algae detection (Li et al., 2018; Xing et al., 2018, 2019). In environments with highly variable atmospheric conditions, turbid waters, or sun glint effects, the Scaled Algae Index (SAI) has been proposed to improve the detection of floating algae. This index utilizes reflectance differences among the SWIR, NIR, and RED bands, reducing interference from water turbidity and other impurities, and thereby improving algae detection (Keesing et al., 2011). In addition, several other band indices, such as NDAI (Son et al., 2012), VB-FAH (Li et al., 2018), and VDVI (Visible-Band Difference Vegetation Index, VDVI) (Jiang et al., 2020a), have been developed based on the unique reflectance characteristics of algae.
where Rnir Rred Rblue are the reflectance values in the near-infrared, red, and blue bands, respectively. λi are the wavelength with the subscript band name. ρt represents the top-of-atmosphere reflectance, ρr represents the corresponding Rayleigh scattering reflectance. G is the gain factor, and a, b and c are pixel-independent coefficients to compensate for aerosol effects and vegetation background.
However, each of these band index methods has its strengths and limitations. In complex environments, where meteorological conditions, solar angles, and aerosol concentrations vary, cloud cover or in waters with high suspended matter, relying on a single band index to detect high-accuracy green tide information across all stages and sensor types is difficult (Wang et al., 2019). Therefore, a combination of multiple band indices and approaches may be required for more effective monitoring of green tide dynamics.
The spectral differences between water and algae are commonly utilized to detect Ulva prolifera green tide information using various band indices at different resolutions. To effectively distinguish between water and algae, thresholding methods are frequently applied based on these band indices, such as fixed threshold, statistical threshold, global threshold, and dynamic threshold. A summary of these methods is presented in Table 1.
In earlier studies, adjusting and selecting appropriate thresholds through visual interpretation and statistical analysis was a relatively accurate approach (Shi and Wang, 2009). For the green tides in the Yellow Sea, the NDVI method commonly applies thresholds greater than -0.2 or 0 for algae, with water values being below 0 (Hu and He, 2008; Hu, 2009). Similarly, the EVI method uses thresholds above 0.02, and the FAI method typically adopts thresholds around 0.02, with water values generally being less than or equal to 0 (Hu, 2009). Through iterative visual inspection and calibration, Hu et al. (2010) refined the FAI lower threshold to a range between -0.001 and 0.001. While thresholding methods adjusted through interactive visual interpretation are accurate for monitoring targets with clear boundaries, they lack robustness under varying conditions, as threshold values often differ across scenarios, which limits their applicability across periods or regions (Hou et al., 2024). Son et al. (2012) conducted statistical analyses of NDVI, EVI, and IGAG values to determine optimal thresholds for extracting green tide pixels. They observed that the number of extracted pixels was highly sensitive to the selected threshold (Son et al., 2012). Although NDVI and EVI methods are effective when applied to both high-resolution and medium-to-low-resolution satellite data, their reliability diminishes in scenarios with low algae density or under complex conditions such as cloud cover, aerosol interference, or water turbidity (Son et al., 2012). One solution involves removing the background water signal from the area of interest to normalize local algae indices. For example, in the NDAI method, algae pixel values are refined by subtracting the average value of surrounding non-algal pixels, resulting in a homogeneous background that enables the application of global thresholds to isolate floating algae pixels (Shi and Wang, 2009). However, global thresholds are prone to underestimation in scenes with highly variable backgrounds (Garcia et al., 2013). To address these limitations, Garcia et al. (2013) proposed the SAI algorithm, which scales the NDVI or FAI images by subtracting local ocean medians and then applies a scene-wide exclusion method to segment algae pixels. Additionally, dynamic thresholding methods have been developed to detect Ulva prolifera green tides under challenging conditions such as solar flares, thin clouds, or other interferences (Xing et al., 2018; An et al., 2021). Local adaptive thresholding methods further enhance performance by dynamically selecting thresholds within moving pixel windows based on satellite top-of-atmosphere reflectance data and canopy greenness indices. These methods have shown promising results in non-optimal observation conditions, including complex water backgrounds, sun glint, and cloud cover (Zhang et al., 2024b).
Although threshold-based classification algorithms are widely adopted for their practicality and simplicity in binary classification, they face significant challenges in adapting to dynamic marine environment conditions. Changes in illumination, seasonal variations, water depth, and turbidity can alter the reflection properties of green tides, reducing the effectiveness of these methods. Consequently, thresholding methods require frequent adjustments and struggle to differentiate fine-scale algae features under low-resolution conditions, leading to reduced robustness and adaptability (Hou et al., 2024).
Machine learning methods, including the Mahalanobis distance (MHD), maximum likelihood (ML), minimum distance (MD), support vector machine (SVM), and random forest (RF), have been widely applied in the remote sensing monitoring of Ulva prolifera green tides. These methods, along with their specific applications, are summarized in Table 1. Gu et al. (2011) demonstrated that decision tree models could effectively utilize spectral differences among Sargassum, seawater, and solar glint, reducing image noise caused by solar flares and extracting Sargassum information from imagery. Similarly, Casal et al. (2011) demonstrated that the ML method is highly effective in distinguishing algae pixels from non-algae pixels, with an accuracy exceeding 90% when validated against ground-truth samples. Among classification algorithms such as MHD, ML, MD, and artificial neural networks (ANN), ML and ANN achieved the highest accuracy in evaluating green tide areas from UAV remote sensing data (Kim et al., 2020). The multi-layer perceptron effectively addresses challenges such as clouds, aerosols, and solar flares under various environmental conditions better than traditional methods (Qiu et al., 2018). However, these supervised classification methods inevitably require human intervention for sample delineation and image interpretation, which is a time-consuming and labor-intensive process. To address this, a method combining the Gaussian mixture model and an improved Dempster-Shafer evidence theory has been proposed to enable automatic detection of Sargassum distribution. This approach can automatically integrate NDVI, RVI, DVI, and FAI features to extract the distribution and coverage of Sargassum (Wang et al., 2019). Additionally, by applying advanced machine learning algorithms like RF and gradient boosting decision trees (GBDT), researchers assessed the biomass of various intertidal algae species, demonstrating that GBDT provides a more accurate biomass evaluation (Chen et al., 2022). High-resolution remote sensing data, with their fine spatial resolution, enable the detection of detailed green tide features, while low-resolution data, offering higher temporal resolution, support frequent monitoring of temporal changes. By integrating high- and low-resolution data, machine learning models can effectively analyze the appearance, evolution, and migration patterns of green tides (Men et al., 2023). As spatial resolution improves, the ability to distinguish different algae features is significantly enhanced. For example, the RF method, known for its strong robustness, has been demonstrated to efficiently monitor the spatial and temporal distribution of Sargassum and other algae (Yu et al., 2023). Additionally, a hybrid remote sensing model combining the RF algorithm with the optical algal cloud index has been shown to accurately distinguish between thin cloud boundaries and dense green tide areas, outperforming SVM and nearest neighbor methods (Hou et al., 2024).
Compared with traditional thresholding methods, machine learning approaches provide greater robustness and adaptability for detecting Ulva prolifera green tides under varying environmental conditions, such as changes in lighting, seasonality, water depth, and turbidity. These models can fully exploit spectral, spatial, and textural features, enabling automatic and efficient detection even with limited labeled samples. However, their performance heavily depends on manually designed feature extraction processes, requiring expert knowledge to select effective features such as color and texture, and inadequate or irrelevant feature selection can compromise the model’s accuracy.
Artificial intelligence (AI) is a comprehensive research field encompassing various technologies and methodologies, with machine learning serving as a crucial approach for realizing AI, thus becoming a central component of the field. Deep learning, a subset of machine learning, employs deep neural networks for data modeling and feature extraction and has emerged as one of the most advanced technologies in recent years (Jordan and Mitchell, 2015). Unlike traditional methods such as threshold segmentation, SVM, and RF, which typically rely on manually designed features (e.g., color, texture, and shape) for green tide detection, deep learning models can automatically learn these features from raw data, significantly improving detection accuracy and adaptability. Additionally, deep learning not only utilizes the spectral information from individual pixels but also incorporates spatial relationships among these pixels, thereby achieving better feature extraction results (Qi et al., 2022). For example, Kim et al. (2020) compared the performance of MHD, ML, MD, and ANN for coastal green tide monitoring and found that ML and ANN methods yielded the highest accuracy (Kim et al., 2020). Unlike traditional methods, which often struggle to distinguish algae from other marine objects with similar spectral features, deep learning networks can capture subtle differences among various target features, enabling more accurate differentiation (Kim et al., 2020). Moreover, deep learning methods can effectively consider the spectral information of each pixel and the spatial context among pixels, leading to a remarkable improvement in green tide detection accuracy compared to traditional approaches (Wan et al., 2021). Green tide outbreaks are often widely covered in the news, and a significant correlation is found between these events. Deep learning can leverage temporal and spatial features to model these correlations, enabling the detection of daily green tides and utilizing observed green tides to infer societal reactions (Wang et al., 2021b). Although deep learning is robust in green tide detection, it often requires large amounts of labeled data. However, in practice, pure samples are scarce, and background samples are often predominant, leading to class imbalance. These challenges can be addressed by optimizing the loss function to improve performance (Guo et al., 2022). Furthermore, by optimizing U-Net model, more accurate estimates of green tide coverage and biomass density can be extracted (Shang et al., 2023). Deep learning can also adapt to different illumination conditions and environmental factors when analyzing remote sensing images, allowing for the precise detection of green tides under varying conditions. In particular, mixed pixels in low-resolution images may hinder accurate biomass estimation, but deep learning can integrate pre-trained image super-resolution models to enhance the spatial resolution of satellite imagery and strengthen edge features, thereby minimizing the impact of mixed pixels (Liu et al., 2024).
Compared to machine learning, deep learning models can automatically select features, reducing the need for manual feature design. These models are also better at capturing complex patterns and features, demonstrating greater stability and robustness when confronted with diverse marine environments and conditions. However, there are certain limitations (Zhu et al., 2017). First, deep learning is highly dependent on labeled data, requiring a large quantity of high-quality labeled data for training. Inaccurate labeling or insufficient samples from diverse scenarios (such as varying lighting conditions or cloud cover) can significantly impair the model’s generalization ability. Second, training deep learning models is computationally expensive, particularly when dealing with high-resolution remote-sensing images. Third, the black-box nature of deep learning models makes them less interpretable than traditional machine learning methods. This lack of interpretability poses challenges for decision-makers and environmental managers who need to understand why a model makes certain predictions. Furthermore, the complexity of deep learning models limits their explainability.
With the expansion of seaweed farming on the northern Jiangsu shallow shoals, Sargassum (green tide) shed or discarded during the harvesting and dismantling of seaweed farming rafts has been identified as a major source of large-scale green tide outbreaks in the Yellow Sea (Liu et al., 2009; Keesing et al., 2011). To estimate the cumulative biomass of these outbreaks, Wang et al. (2015) developed a mathematical model that utilized initial biomass data from seaweed farming rafts, combined with floating and growth rates of green tides derived from field experiments. Expanding on this work, Liu et al. (2015) established 27 monitoring stations in regions with the most severe outbreaks and employed both remote sensing and field surveys during and after seaweed raft cleaning to estimate large-scale green tide biomass accurately. To improve biomass estimation, Hu et al. (2017) developed a remote sensing model based on reflectance-derived FAI, using biomass and reflectance data from laboratory experiments. Subsequently, this model was later extended to MODIS remote sensing imagery, enabling large-scale biomass estimation of green tides in the Yellow Sea (Hu et al., 2017). Furthermore, Hu et al. (2019) refined this approach by constructing an FAI gradient image to reduce the impact of suspended sediments, atmospheric turbidity, and sunlight on coverage estimation. They extracted algae-containing pixels and calibrated the relationship between coverage and biomass based on tank and field experiments (Hu et al., 2019). While effective, this method still faced challenges under extreme observational conditions, such as large viewing angles or high atmospheric turbidity (Hu et al., 2019). In addition to FAI, other indices have been explored for green tide biomass estimation. Xiao et al. (2019) demonstrated strong exponential relationships between biomass per unit area and indices such as EVI, NDVI, and FAI, with EVI being the least affected by mixed pixels. They further applied EVI to MODIS imagery to estimate the maximum green tide biomass in the Yellow Sea from 2007 to 2016. Similarly, Xing et al. (2018) utilized the DVI to develop linear regression models for surface coverage, enabling potential biomass estimation. Xu et al. (2023) adopted Gompertz and logistic growth models to fit cumulative coverage area data from 2008 to 2022, effectively tracking daily variations in green tide coverage.
Despite these advancements, most biomass assessments still rely on measurements of maximum algal coverage or manually removed biomass, often overlooking the significant growth potential of Sargassum. Under favorable conditions, daily biomass growth rates can exceed 25%, resulting in underestimations of green tide coverage (Xing et al., 2018; Yuan, 2022). To address this limitation, Yuan (2022) proposed a folding model to predict upstream algae growth and the potential maximum biomass of green tide outbreaks. This model incorporates both growth dynamics and cumulative coverage, providing a more accurate estimation of outbreak scales in the Yellow Sea.
Many researchers have investigated the factors driving the growth and outbreak of Ulva prolifera green tides, focusing particularly on the environmental and physical conditions influencing its proliferation and movement. Studies consistently highlight that SSW plays a pivotal role in the movement and horizontal drift of floating algae. Xu et al. (2014) analyzed the impact of SST and SSW, finding that while SST was not a critical factor affecting the scale of algal bloom, SSW significantly influenced the movement and distribution of floating algae. Similarly, Li et al. (2020) analyzed the development, dissipation, and northward drift of green tides in Rongcheng from 2013 to 2018, concluding that SSW had the greatest impact on the occurrence and movement of Ulva prolifera green tide blooms. Furthermore, Zhang et al. (2022) tracked Ulva prolifera green tides using remote sensing from 2015 to 2019 and confirmed that SST provided necessary growth conditions, while SSW was the primary driver of horizontal drift, determining the distribution patterns of green tides. Environmental factors affecting green tide growth vary across its life cycle. Jin et al. (2018) found that during the initial phase, SST and available radiation were the primary factors influencing algal biomass; during the outbreak phase, water transparency, precipitation, and wind activity facilitated algal proliferation; and in the dissipation phase, SST, strong radiation, and human cleanup operations accelerated algal mortality. Adequate light conditions have also been identified as a crucial factor. Zhang et al. (2020a) observed that sufficient light during the growth period was a key driver of Ulva prolifera green tide outbreaks. Similarly, Cui et al. (2015) identified the optimal SST range for Ulva prolifera growth as 20°C to 27°C, a finding that was further corroborated by Nukapothula et al. (2022), who analyzed MODIS SST data. They found that algal blooms typically initiated when SST rose from 18°C to 25°C and that abundance declined when SST exceeded 25°C. These findings highlight the interconnected roles of nutrient availability and physical forcing in both the growth and dispersion of green tides.
In addition to physical conditions, nutrient availability significantly impacts green tide growth. Zhang et al. (2020a) emphasized that while suitable SST and sufficient light promote growth, these factors alone are insufficient under nutrient-poor conditions. High concentrations of nutrient salts, particularly phosphate, and balanced N/P/Si ratios are essential for sustaining rapid algal proliferation. Precipitation also plays a complex role in green tide dynamics. Li et al. (2021) noted that during the dissipation phase, SST was negatively correlated with green tide abundance, as higher temperatures accelerated dissipation. However, precipitation slowed this process, and typhoons could disrupt it. Zheng et al. (2022b) further revealed that moderate light conditions promoted growth and reproduction, while excessive ultraviolet radiation could inhibit algal proliferation.
Recent studies have expanded the understanding of green tide dynamics by integrating multiple environmental and water quality parameters. Hou et al. (2024) identified phosphate content, N/P/Si ratios, and water transparency as additional factors influencing the growth rate of Ulva prolifera. These findings underscore the importance of considering a combination of physical, chemical, and biological factors to fully understand the mechanisms driving green tide outbreaks.
Recent advancements in remote sensing and modeling have significantly improved our ability to monitor and predict the drift trajectories of Ulva prolifera green tides. In early May, large algae originate from the turbid waters near the northern Shandong shoals of the Yellow Sea and begin to drift southward. However, as the East Asian summer monsoon strengthens, the primary drift direction shifts northward (Xing et al., 2011). The radial sand ridges in the northern Shandong shoals contribute to longitudinal and transverse ocean currents, with the longitudinal net movement serving as the primary driver for transporting green tides into nearshore waters (Bao et al., 2015). Various studies have confirmed the influence of ocean currents and wind fields on green tide dynamics. For example, Son et al. (2015) highlighted that typhoons and enhanced wind conditions significantly influenced the movement of floating algae patches. Liu et al. (2015) and Li et al. (2020) documented the northward drift of green tides from the coastal waters of Jiangsu Province in May, eventually reaching the southern coast of Shandong Province. Ma et al. (2022) used optical and microwave remote sensing data to monitor the movement of green tides in the Yellow Sea and the East China Sea in 2021, indicating a consistent northward trajectory passing through multiple coastal regions before gradually dissipating near Qingdao. Similar trends were observed using remote sensing at different spatial resolutions, where the overall drift direction of Ulva prolifera green tide was found to be northward (Wang et al., 2023a). Recent remote sensing studies indicate that the northward drift of Ulva prolifera is primarily driven by ocean currents and wind fields (Hou et al., 2024).
To predict green tide drift trajectories, researchers have combined remote sensing with different modeling methods, such as numerical models and ecosystem models (Hu et al., 2018). Xu et al. (2016) used a Lagrangian spill trajectory model to simulate the migration of floating algae in the Yellow Sea, achieving results consistent with satellite observations. Zhou et al. (2021) enhanced this approach by incorporating an ecological dynamic growth module into the Lagrangian model, enabling the prediction of spatiotemporal variations in large-scale green tide blooms. Despite the utility of Lagrangian models, limitations such as low spatial resolution in large-scale grids and instability in high-resolution settings have been noted (Sheng et al., 2023). To address these challenges, Sheng et al. (2023) developed a bidirectional feedback model that uses algae distribution data from remote sensing as the initial input. This model integrates drift, diffusion, and elimination mechanisms, demonstrating superior predictive performance compared to traditional methods. During the decay phase, green tide growth is closely linked to SST, PAR, and phosphate levels, while salinity and nitrate have minimal effects. Based on these findings, Yang et al. (2023) created a regression model using SST, PAR, and phosphate to predict green tide production rates during this phase.
The growth of Ulva prolifera green tide typically follows an S-shaped curve (Banks et al., 2017). Xu et al. (2023) analyzed daily coverage data of green tides in the Yellow Sea from 2008 to 2022 and applied Gompertz and logistic growth curves to model cumulative coverage over time. However, estimating green tide outbreaks solely based on cumulative or maximum coverage can lead to inaccuracies, as these metrics may not fully capture the outbreak scale or temporal dynamics (Yuan, 2022). Sheng et al. (2023) proposed a bidirectional feedback model for Ulva prolifera green tide drift, which uses the spatial distribution of algae extracted from remote sensing images as the initial model. Based on the drift and diffusion mechanisms of Ulva prolifera green tide, a bidirectional feedback model between algae elimination and driving modules was established, showing superior performance in predicting algae drift and dispersion compared with traditional methods. In cases where remote sensing data have long revisit cycles or limited spatial coverage, predictive challenges arise. To overcome these limitations, Wang et al. (2023b) proposed using Long Short-Term Memory Networks. This approach leverages spatiotemporal features from oceanic physical factors (e.g., SSW and ocean currents) and biological factors (e.g., SST, SSS, and solar radiation) to learn drift patterns. The model can accurately predict the geometric position of Ulva prolifera green tides within a seven-day window, offering a robust tool for short-term trajectory forecasting.
Despite significant advancements in understanding the outbreak areas, detection methods, spatiotemporal distribution characteristics, biomass estimation, driving factors, and drift trajectory prediction of the Yellow Sea green tide, several challenges remain unresolved. For example, there remains a persistent trade-off between high temporal and high spatial resolution in multi-source remote sensing data, and effective methods for integrating data from different platforms to fully exploit their complementary strengths are still lacking. Additionally, the estimation of green tide coverage and biomass is susceptible to variations in image quality, data sources, and algorithm selection, which increases the uncertainty of monitoring results. Although factors such as temperature, salinity, and light intensity have been identified as key drivers of green tides, the interactions among these factors and their relationship with the reproduction of Ulva prolifera remain inadequately studied. The absence of physical-biological coupled models that integrate ocean dynamics with the biological characteristics of Ulva prolifera limits the accuracy of drift trajectory predictions and the spread of green tides. Advanced multimodal data fusion techniques offer a promising solution to overcome the limitation by integrating high-resolution spatial, high-frequency temporal remote sensing data, and filed data. This approach offers a way to enhance the precision and responsiveness of green tide monitoring (Li et al., 2022). It can effectively mitigate challenges associated with cloud cover, weather variability, and noise, enabling researchers to better capture the dynamic processes of Ulva prolifera, including its growth, outbreak, and dissipation phases, thus significantly improving biomass estimation and spatial coverage analysis. Furthermore, incorporating marine environmental factors (e.g., SST, SSS, light intensity, and SSW) and extreme climatic events (e.g., typhoons and heatwaves) into predictive models of green tide drift trajectories provides a more comprehensive understanding of the driving mechanisms underlying the spread and drift of Ulva prolifera.
Convolutional Neural Networks (CNNs) offer promising solutions for addressing the challenges associated with the temporal and spatial resolution differences in green tide monitoring, as well as improving predictions of drift trajectories and outbreak trends (Zhu et al., 2017; Wang et al., 2023a). Future research should focus on multi-source fusion (e.g., optical imagery, SAR data, hyperspectral imagery) and non-remote sensing data (e.g., oceanographic monitoring data, meteorological data) to extract and align multimodal features using CNNs, thereby addressing challenges related to temporal and spatial resolution discrepancies. In addition, exploring the nonlinear relationships between Ulva prolifera and environmental factors, and developing coupled models that integrate biological processes with remote sensing data, will help reveal the growth, drift, and decay processes of Ulva prolifera, as well as predict its drift trajectories and outbreak trends. These studies will facilitate the development of more accurate and real-time monitoring solutions, thereby improving the efficiency of green tide detection and optimizing strategies for early warning, evaluation, and management.
In conclusion, this study comprehensively reviews green tide remote sensing research, highlighting current trends, technological limitations, and future directions. It not only provides researchers with insights into the trends and dynamics of Ulva prolifera green tide studies and highlights potential research opportunities but also serves as a valuable reference for government administrators in formulating evidence-based strategies.
XG: Writing – original draft, Writing – review & editing, Conceptualization, Formal analysis, Funding acquisition, Methodology. HL: Conceptualization, Methodology, Writing – review & editing, Data curation. LW: Writing – review & editing. WS: Writing – review & editing. YL: Writing – review & editing.
The author(s) declare financial support was received for the research, authorship, and/or publication of this article. This work was supported by the Key Laboratory of Marine Ecological Monitoring and Restoration Technologies, MNR (Grant MEMRT202312), the Hebei Natural Science Foundation (Grant D2024205042), and the Science Research Project of Hebei Education Department (Grant QN2023126), and the Technology Innovation Fund from Hebei Normal University (L2023B33).
The authors would like to acknowledge the funding provided by the Key Laboratory of Marine Ecological Monitoring and Restoration Technologies, MNR.
The authors declare that this research was conducted without any commercial, financial, or personal relationships that could be perceived as influencing the work reported in this paper.
The author(s) declare that no Generative AI was used in the creation of this manuscript.
All claims expressed in this article are solely those of the authors and do not necessarily represent those of their affiliated organizations, or those of the publisher, the editors and the reviewers. Any product that may be evaluated in this article, or claim that may be made by its manufacturer, is not guaranteed or endorsed by the publisher.
An D., Yu D., Zheng X., Zhou Y., Meng L., Xing Q. (2021). Monitoring the dissipation of the floating green macroalgae blooms in the yellow sea, (2007-2020) on the basis of satellite remote sensing. Remote Sensing. 13, 3811. doi: 10.3390/rs13193811
An D., Xing Q., Yu D., Pan S. (2022). A simple method for estimating macroalgae area under clouds on MODIS imagery. Front. Mar. Sci. 9, 995731. doi: 10.3389/fmars.2022.995731
Banks H. T., Collins E., Flores K., Pershad P., Stemkovski M., Stephenson L. (2017). Statistical error model comparison for logistic growth of green algae (Raphidocelis subcapitata). Appl. Mathematics Letters. 64, 213–222. doi: 10.1016/j.aml.2016.09.006
Bao M., Guan W., Wang Z., Wang D., Cao Z., Chen Q. (2015). Features of the physical environment associated with green tide in the southwestern Yellow Sea during spring. Acta Oceanologica Sinica. 34, 97–104. doi: 10.1007/s13131-015-0692-x
Cao Y., Wu Y., Fang Z., Cui X., Liang J., Song X. (2019). Spatiotemporal patterns and morphological characteristics of Ulva prolifera distribution in the Yellow Sea, China in 2016–2018. Remote Sens. 11 (4), 445. doi: 10.3390/rs11040445
Casal G., Kutser T., Dominguez-Gomez J. A., Sanchez-Carnero N., Freire J. (2011). Mapping benthic macroalgal communities in the coastal zone using CHRIS-PROBA mode 2 images. Estuarine Coast. Shelf Science. 94, 281–290. doi: 10.1016/j.ecss.2011.07.008
Chen J., Li X., Wang K., Zhang S., Li J. (2022). Estimation of seaweed biomass based on multispectral UAV in the intertidal zone of gouqi island. Remote Sensing. 14, 2143. doi: 10.3390/rs14092143
Chen J., Wang K., Zhao X., Cheng X., Zhang S., Chen J., et al. (2023). Satellite imagery-estimated intertidal seaweed biomass using UAV as an intermediary. Remote Sensing. 15, 4428. doi: 10.3390/rs15184428
Chen Y. L., Wan J. H., Zhang J., Ma Y. J., Wang L., Zhao J. H., et al. (2019). Spatial-temporal distribution of golden tide based on high-resolution satellite remote sensing in the South Yellow Sea. J. Coast. Res. 90, 221–227. doi: 10.2112/SI90-027.1
Choi J.-G., Kim D., Shin J., Jang S.-W., Lippmann T. C., Jo Y.-H., et al. (2023). New diagnostic sea surface current fields to trace floating algae in the Yellow Sea. Mar. Pollut. Bulletin. 195, 115494. doi: 10.1016/j.marpolbul.2023.115494
Cui H., Chen J., Jiang X., Fu Y., Qiao F. (2023). A novel quantitative analysis for diurnal dynamics of Ulva prolifera patch in the Yellow Sea from Geostationary Ocean Color Imager observation. Front. Mar. Science. 10. doi: 10.3389/fmars.2023.1177997
Cui T. W., Liang X. J., Gong J. L., Tong C., Xiao Y. F., Liu R. J., et al. (2018). Assessing and refining the satellite-derived massive green macro-algal coverage in the Yellow Sea with high resolution images. ISPRS J. Photogrammetry Remote Sensing. 144, 315–324. doi: 10.1016/j.isprsjprs.2018.08.001
Cui J., Zhang J., Huo Y., Zhou L., Wu Q., Chen L., et al. (2015). Adaptability of free-floating green tide algae in the Yellow Sea to variable temperature and light intensity. Mar. pollut. Bull. 101, 660–666. doi: 10.1016/j.marpolbul.2015.10.033
Gao L., Li X., Kong F., Yu R., Guo Y., Ren Y. (2022). AlgaeNet: A deep-learning framework to detect floating green algae from optical and SAR imagery. IEEE J. Sel. Top. Appl. Earth Observations Remote Sensing. 15, 2782–2796. doi: 10.1109/JSTARS.2022.3162387
Garcia R. A., Fearns P., Keesing J. K., Liu D. (2013). Quantification of floating macroalgae blooms using the scaled algae index. J. Geophysical Research: Oceans. 118, 26–42. doi: 10.1029/2012JC008292
Geng H., Yan T., Zhou M., Liu Q. (2015). Comparative study of the germination of Ulva prolifera gametes on various substrates. Estuarine Coast. Shelf Science. 163, 89–95. doi: 10.1016/j.ecss.2014.12.026
Gu X.-f., Chen X.-f., Yin Q., Li Z.-q., Xu H., Shao Y., et al. (2011). Stereoscopic remote sensing used in monitoring enteromorpha prolifra disaster in chinese yellow sea. Spectrosc. Spectral Analysis. 31, 1627–1632. doi: 10.3964/j.issn.1000-0593(2011)06-1627-06
Guo Y., Gao L., Li X. (2022). A deep learning model for green algae detection on SAR images. IEEE Trans. Geosci. Remote Sensing. 60, 1–14. doi: 10.1109/TGRS.2022.3215895
Han H., Fan S., Song W., Li Y., Xiao J., Wang Z., et al. (2020). The contribution of attached Ulva prolifera on Pyropia aquaculture rafts to green tides in the Yellow Sea. Acta Oceanologica Sinica. 39, 101–106. doi: 10.1007/s13131-019-1452-0
Harun-Al-Rashid A., Yang C. S. (2018). Improved detection of tiny macroalgae patches in Korea bay and Gyeonggi bay by modification of floating algae index. Remote Sensing. 10, 1478. doi: 10.3390/rs10091478
Hou W., Chen J., He M., Ren S., Fang L., Wang C., et al. (2024). Evolutionary trends and analysis of the driving factors of Ulva prolifera green tides: A study based on the random forest algorithm and multisource remote sensing images. Mar. Environ. Res. 198, 106495. doi: 10.1016/j.marenvres.2024.106495
Hu C. (2009). A novel ocean color index to detect floating algae in the global oceans. Remote Sens. Environment. 113, 2118–2129. doi: 10.1016/j.rse.2009.05.012
Hu C., Feng L., Hardy R. F., Hochberg E. J. (2015). Spectral and spatial requirements of remote measurements of pelagic Sargassum macroalgae. Remote Sens. Environment. 167, 229–246. doi: 10.1016/j.rse.2015.05.022
Hu C., He M. (2008). Origin and offshore extent of floating algae in olympic sailing area. EoS Trans. 89, 302–303. doi: 10.1029/2008EO330002
Hu L., Hu C., Ming-Xia H. (2017). Remote estimation of biomass of Ulva prolifera macroalgae in the Yellow Sea. Remote Sens. Environment. 192, 217–227. doi: 10.1016/j.rse.2017.01.037
Hu C., Li D., Chen C., Ge J., Muller-Karger F. E., Liu J., et al. (2010). On the recurrent Ulva prolifera blooms in the Yellow Sea and East China Sea. J. Geophysical Research: Oceans. 115, C05017. doi: 10.1029/2009JC005561
Hu P., Liu Y., Hou Y., Yi Y. (2018). An early forecasting method for the drift path of green tides: A case study in the Yellow Sea, China. Int. J. Appl. Earth Observation Geoinformation. 71, 121–131. doi: 10.1016/j.jag.2018.05.001
Hu C., Qi L., Hu L., Cui T., Xing Q., He M., et al. (2023). Mapping Ulva prolifera green tides from space: A revisit on algorithm design and data products. Int. J. Appl. Earth Observation Geoinformation. 116, 103173. doi: 10.1016/j.jag.2022.103173
Hu L., Zeng K., Hu C., He M.-X. (2019). On the remote estimation of Ulva prolifera areal coverage and biomass. Remote Sens. Environment. 223, 194–207. doi: 10.1016/j.rse.2019.01.014
Huang S., Tang L., Hupy J. P., Wang Y., Shao G. (2021). A commentary review on the use of normalized difference vegetation index (NDVI) in the era of popular remote sensing. J. For. Res. 32, 1–6. doi: 10.1007/s11676-020-01155-1
Ji M., Zhao C., Dou X., Wang C., Zhou D., Zhu J. (2023). Identification and assessment of the drift velocity of green tides using the maximum cross-correlation method in the Yellow Sea. Mar. pollut. Bull. 194, 115420. doi: 10.1016/j.marpolbul.2023.115420
Jiang X., Gao M., Gao Z. (2020a). A novel index to detect green-tide using UAV-based RGB imagery. Estuarine Coast. Shelf Science. 245, 106943. doi: 10.1016/j.ecss.2020.106943
Jiang X., Gao Z., Zhang Q., Wang Y., Tian X., Shang W., et al. (2020b). Remote sensing methods for biomass estimation of green algae attached to nursery-nets and raft rope. Mar. Pollut. Bulletin. 150, 110678. doi: 10.1016/j.marpolbul.2019.110678
Jin S., Liu Y., Sun C., Wei X., Li H., Han Z. (2018). A study of the environmental factors influencing the growth phases of Ulva prolifera in the southern Yellow Sea, China. Mar. Pollut. Bulletin. 135, 1016–1025. doi: 10.1016/j.marpolbul.2018.08.035
Jordan M. I., Mitchell T. M. (2015). Machine learning: Trends, perspectives, and prospects. Science 349, 255–260. doi: 10.1126/science.aaa841
Keesing J. K., Liu D., Fearns P., Garcia R. (2011). Inter- and intra-annual patterns of Ulva prolifera green tides in the Yellow Sea during 2007-2009, their origin and relationship to the expansion of coastal seaweed aquaculture in China. Mar. Pollut. Bulletin. 62, 1169–1182. doi: 10.1016/j.marpolbul.2011.03.040
Kim K., Shin J., Kim K. Y., Ryu J. H. (2019). Long-term trend of green and golden tides in the Eastern Yellow Sea. J. Coast. Res. 90, 317–323. doi: 10.2112/SI90-040.1
Kim K., Kim B.-J., Kim E., Ryu J.-H. (2020). lassification of Green Tide at Coastal Area Using Lightweight UAV and only RGB Images. J. Coast. Res. 102, 224–231. doi: 10.2112/SI102-028.1
Kwan V., Fong J., Ng C. S. L., Huang D. (2022). Temporal and spatial dynamics of tropical macroalgal contributions to blue carbon. Sci. Total Environment. 828, 154369. doi: 10.1016/j.scitotenv.2022.154369
Li D., Gao Z., Song D., Shang W., Jiang X. (2019). Characteristics and influence of green tide drift and dissipation in shandong rongcheng coastal water based on remote sensing. Estuarine Coast. Shelf Sci. 227, 106335. doi: 10.1016/j.ecss.2019.106335
Li D., Gao Z., Wang Z. (2022). Analysis of the reasons for the outbreak of Yellow Sea green tide in 2021 based on long-term multi-source data. Mar. Environ. Res. 178, 105649. doi: 10.1016/j.marenvres.2022.105649
Li D., Gao Z., Xu F. (2021). Research on the dissipation of green tide and its influencing factors in the Yellow Sea based on Google Earth Engine. Mar. Pollut. Bulletin. 172, 112801. doi: 10.1016/j.marpolbul.2021.112801
Li D., Gao Z., Zheng X., Wang N. (2020). Analysis of the interannual variation characteristics of the northernmost drift position of the green tide in the Yellow Sea. Environ. Sci. pollut. Res. 27, 35137–35147. doi: 10.1007/s11356-020-09730-z
Li L., Ma H., Zhang X., Zhao X., Lv M., Jia Z. (2024). Synthetic aperture radar image change detection based on principal component analysis and two-level clustering. Remote Sens. 16, 1861. doi: 10.3390/rs16111861
Li Y., Song W., Xiao J., Wang Z., Fu M., Zhu M., et al. (2014). Tempo-spatial distribution and species diversity of green algae micro-propagules in the Yellow Sea during the large-scale green tide development. Harmful Algae. 39, 40–47. doi: 10.1016/j.hal.2014.05.013
Li H., Zhang Y., Tang H., Shi X., Rivkin R. B., Legendre L. (2017). Spatiotemporal variations of inorganic nutrients along the Jiangsu coast, China, and the occurrence of macroalgal blooms (green tides) in the southern Yellow Sea. Harmful Algae. 63, 164–172. doi: 10.1016/j.hal.2017.02.006
Li L., Zheng X., Wei Z., Zou J., Xing Q. (2018). A spectral-mixing model for estimating sub-pixel coverage of sea-surface floating macroalgae. Atmosphere-Ocean 56, 296–302. doi: 10.1080/07055900.2018.1509834
Li C., Zhu X., Li X., Jiang S., Shi H., Zhang Y., et al. (2023). All-weather monitoring of Ulva prolifera in the yellow sea based on sentinel-1, sentinel-3, and NPP satellite data. Remote Sensing. 15, 5772. doi: 10.3390/rs15245772
Liu R., Cui B., Dong W., Fang X., Xiao Y., Zhao X., et al. (2024). A refined deep-learning-based algorithm for harmful-algal-bloom remote-sensing recognition using Noctiluca scintillans algal bloom as an example. J. Hazardous Materials. 467, 133721. doi: 10.1016/j.jhazmat.2024.133721
Liu D., Keesing J. K., Dong Z., Zhen Y., Di B., Shi Y., et al. (2010). Recurrence of the world’s largest green-tide in 2009 in Yellow Sea, China: Porphyra yezoensis aquaculture rafts confirmed as nursery for macroalgal blooms. Mar. Pollut. Bulletin. 60, 1423–1432. doi: 10.1016/j.marpolbul.2010.05.015
Liu D., Keesing J. K., He P., Wang Z., Shi Y., Wang Y. (2013). The world’s largest macroalgal bloom in the Yellow Sea, China: Formation and implications. Estuarine Coast. Shelf Science. 129, 2–10. doi: 10.1016/j.ecss.2013.05.021
Liu D., Keesing J. K., Xing Q., Shi P. (2009). World’s largest macroalgal bloom caused by expansion of seaweed aquaculture in China. Mar. Pollut. Bulletin. 58, 888–895. doi: 10.1016/j.marpolbul.2009.01.013
Liu X., Li Y., Wang Z., Zhang Q., Cai X. (2015). Cruise observation of Ulva prolifera bloom in the southern Yellow Sea, China. Estuarine Coast. Shelf Science. 163, 17–22. doi: 10.1016/j.ecss.2014.09.014
Liu X., Wang Z., Zhang X. (2016). A review of the green tides in the Yellow Sea, China. Mar. Environ. Res. 119, 189–196. doi: 10.1016/j.marenvres.2016.06.004
Lou X., Huang W., Mao X., Shi A., Zhang H., Chen P. (2006). Satellite observation of a red tide in the East China Sea during 2005. Proc. SPIE, 64061M. doi: 10.1117/12.693856
Ma Y., Wong K., Tsou J. Y., Zhang Y. (2022). Investigating spatial distribution of green-tide in the yellow sea in 2021 using combined optical and SAR images. J. Mar. Sci. Engineering. 10 2), 127. doi: 10.3390/jmse10020127
Men Y., Liu Y., Ma Y., Wong K. P., Tsou J. Y., Zhang Y. (2023). Remote sensing monitoring of green tide disaster using MODIS and GF-1 data: A case study in the yellow sea. J. Mar. Sci. Engineering. 11, 2212. doi: 10.3390/jmse11122212
Nezlin N. P., Kamer K., Stein E. D. (2007). Application of color infrared aerial photography to assess macroalgal distribution in an eutrophic estuary, Upper Newport Bay, California. Estuaries Coasts 30, 855–868. doi: 10.1007/BF02841339
Nukapothula S., Yunus A. P., Chen C. (2022). Signals of intense primary production in response to Ulva prolifera bloom in the Yellow Sea during summer 2021. Phys. Chem. Earth. 128, 103257. doi: 10.1016/j.pce.2022.103257
Pan X., Meng D., Ren P., Xiao Y., Kim K., Mu B., et al. (2023). Macroalgae monitoring from satellite optical images using Context-sensitive level set (CSLS) model. Ecological Indicators 149, 110160. doi: 10.1016/j.ecolind.2023.110160
Qi L., Hu C. (2021). To what extent can Ulva and Sargassum be detected and separated in satellite imagery? Harmful Algae 103, 10200. doi: 10.1016/j.hal.2021.102001
Qi L., Hu C., Wang M., Shang S., Wilson C. (2017). Floating algae blooms in the East China Sea. Geophysical Res. Lett. 44, 11–501. doi: 10.1002/2017GL075525
Qi L., Tsai S. F., Chen Y., Le C., Hu C. (2019). In search of red noctiluca scintillans blooms in the East China Sea. Geophysical Res. Lett. 46, 5997–6004. doi: 10.1029/2019GL082667
Qi L., Hu C., Xing Q., Shang S. (2016). Long-term trend of Ulva prolifera blooms in the western Yellow Sea. Harmful Algae. 58, 35–44. doi: 10.1016/j.hal.2016.07.004
Qi L., Wang M., Hu C. (2023). Uncertainties in MODIS-derived Ulva prolifera amounts in the yellow sea: A systematic evaluation using sentinel-2/MSI observations. IEEE Geosci. Remote Sens. Letters. 20, 1–5. doi: 10.1109/LGRS.2023.3272889
Qi L., Wang M., Hu C., Holt B. (2022). On the capacity of Sentinel-1 synthetic aperture radar in detecting floating macroalgae and other floating matters. Remote Sens. Environment. 280, 113188. doi: 10.1016/j.rse.2022.113188
Qiu Z., Li Z., Bilal M., Wang S., Sun D., Chen Y. (2018). Automatic method to monitor floating macroalgae blooms based on multilayer perceptron: case study of Yellow Sea using GOCI images. Optics express 26 (21), 26810–26829. doi: 10.1364/OE.26.026810
Rossiter T., Furey T., McCarthy T., Stengel D. B. (2020). UAV-mounted hyperspectral mapping of intertidal macroalgae. Estuarine Coast. Shelf Science. 242, 106789. doi: 10.1016/j.ecss.2020.106789
Shang W., Gao Z., Gao M., Jiang X. (2023). Monitoring green tide in the yellow sea using high-resolution imagery and deep learning. Remote Sensing. 15, 1101. doi: 10.3390/rs15041101
Shao S., Wang Y., Liu G., Song K. (2024). A systematic review of the application of the geostationary ocean color imager to the water quality monitoring of inland and coastal waters. Remote Sensing. 16, 1623. doi: 10.3390/rs16091623
Sheng H., Li J., Wang Q., Zou B., Shi L., Xu M., et al. (2023). A multi-module with a two-way feedback method for Ulva drift-diffusion. Acta Oceanologica Sinica. 42, 118–134. doi: 10.1007/s13131-023-2165-y
Shi W., Wang M. (2009). Green macroalgae blooms in the Yellow Sea during the spring and summer of 2008. J. Geophysical Research: Oceans 114, C12010. doi: 10.1029/2009JC005513
Son Y. B., Choi B.-J., Kim Y. H., Park Y.-G. (2015). Tracing floating green algae blooms in the Yellow Sea and the East China Sea using GOCI satellite data and Lagrangian transport simulations. Remote Sens. Environment. 156, 21–33. doi: 10.1016/j.rse.2014.09.024
Son Y. B., Min J.-E., Ryu J.-H. (2012). Detecting massive green algae (Ulva prolifera) blooms in the Yellow Sea and East China Sea using Geostationary Ocean Color Imager (GOCI) data. Ocean Sci. J. 47, 359–375. doi: 10.1007/s12601-012-0034-2
Sun D., Chen Y., Wang S., Zhang H., Qiu Z., Mao Z., et al. (2021). Using Landsat 8 OLI data to differentiate Sargassum and Ulva prolifera blooms in the South Yellow Sea. Int. J. Appl. Earth Observation Geoinformation. 98, 102302. doi: 10.1016/j.jag.2021.102302
Sun X., Wu M., Xing Q., Song X., Zhao D., Han Q., et al. (2018). Spatiotemporal patterns of Ulva prolifera blooms and the corresponding influence on chlorophyll-a concentration in the Southern Yellow Sea, China. Sci. Total Environ. 640, 807–820. doi: 10.1016/j.scitotenv.2018.05.378
Tang J., Jiao J., Suo Z., Liu Y., Lu Y. (2023). Effect of viewing angle difference on spaceborne optical estimation of floating Ulva prolifera biomass in the Yellow Sea. Optics Express. 31, 29986–29993. doi: 10.1364/OE.498578
van der Wal D., Wielemaker-van den Dool A., Herman P. M. (2010). Spatial synchrony in intertidal benthic algal biomass in temperate coastal and estuarine ecosystems. Ecosystems 13, 338–351. doi: 10.1007/s10021-010-9322-9
van der Wal D., van Dalen J., Wielemaker-van den Dool A., Dijkstra J. T., Ysebaert T. (2014). Biophysical control of intertidal benthic macroalgae revealed by high-frequency multispectral camera images. J. Sea Res. 90, 111–120. doi: 10.1016/j.seares.2014.03.009
Wan X., Wan J., Xu M., Liu S., Sheng H., Chen Y., et al. (2021). Enteromorpha coverage information extraction by 1D-CNN and bi-LSTM networks considering sample balance from GOCI images. IEEE J. Selected Topics Appl. Earth Observations Remote Sensing. 14, 9306–9317. doi: 10.1109/JSTARS.2021.3110854
Wang Z., Fan B., Yu D., Fan Y., An D., Pan S. (2023b). Monitoring the spatio-temporal distribution of Ulva prolifera in the yellow sea, (2020-2022) based on satellite remote sensing. Remote Sensing. 15, 157. doi: 10.3390/rs15010157
Wang Z., Fang Z., Liang J., Song X. (2023a). Estimating Ulva prolifera green tides of the Yellow Sea through ConvLSTM data fusion. Environ. Pollution. 324, 121350. doi: 10.1016/j.envpol.2023.121350
Wang Z., Fang Z., Wu Y., Liang J., Song X. (2019). Multi-source evidence data fusion approach to detect daily distribution and coverage of Ulva prolifera in the yellow sea, China. IEEE Access. 7, 115214–115228. doi: 10.1109/ACCESS.2019.2936247
Wang Z., Fang Z., Zhang Y., Song Z. (2021b). Bidirectional spatio-temporal association between the observed results of ulva prolifera green tides in the yellow sea and the social response in sina weibo. IEEE J. Sel. Top. Appl. Earth Observations Remote Sensing. 14, 5988–6008. doi: 10.1109/JSTARS.2021.3085090
Wang M., Hu C. (2016). Mapping and quantifying Sargassum distribution and coverage in the Central West Atlantic using MODIS observations. Remote Sens. Environment. 183, 350–367. doi: 10.1016/j.rse.2016.04.019
Wang M., Hu C. (2017). Predicting Sargassum blooms in the Caribbean Sea from MODIS observations. Geophysical Res. Letters. 44, 3265–3273. doi: 10.1002/2017GL072932
Wang X., Shao Y., Tian W., Li K. (2018). On the classification of mixed floating pollutants on the Yellow Sea of China by using a quad-polarized SAR image. Front. Earth Science. 12, 373–380. doi: 10.1007/s11707-017-0664-x
Wang Z., Xiao J., Fan S., Li Y., Liu X., Liu D. (2015). Who made the world’s largest green tide in China?—an integrated study on the initiation and early development of the green tide in Yellow Sea. Limnology Oceanography. 60, 1105–1117. doi: 10.1002/lno.10083
Wang X., Xing Q., An D., Meng L., Zheng X., Jiang B., et al. (2021a). Effects of spatial resolution on the satellite observation of floating macroalgae blooms. Water 13, 1761. doi: 10.3390/w13131761
Wei J., Wang M. (2024). Mapping ocean surface algal blooms with SWIR-derived satellite remote sensing reflectance. Int. J. Appl. Earth Observation Geoinformation. 131, 103921. doi: 10.1016/j.jag.2024.103921
Xiao M., Song W., Zhang H., Shi X., Su R. (2024). Eutrophication of Jiangsu coastal water and its role in the formation of green tide. J. Ocean Univ. China. 23, 109–118. doi: 10.1007/s11802-024-5507-2
Xiao Y., Zhang J., Cui T. (2017). High-precision extraction of nearshore green tides using satellite remote sensing data of the Yellow Sea, China. Int. J. Remote Sens. 38, 1626–1641. doi: 10.1080/01431161.2017.1286056
Xiao Y., Zhang J., Cui T., Gong J., Liu R., Chen X., et al. (2019). Remote sensing estimation of the biomass of floating Ulva prolifera and analysis of the main factors driving the interannual variability of the biomass in the Yellow Sea. Mar. Pollut. Bulletin. 140, 330–340. doi: 10.1016/j.marpolbul.2019.01.037
Xing Q., Hu C., Tang D., Tian L., Tang S., Wang X. H., et al. (2015). World’s largest macroalgal blooms altered phytoplankton biomass in summer in the Yellow Sea: satellite observations. Remote Sensing 7, 12297–12313. doi: 10.3390/rs70912297
Xing Q., An D., Zheng X., Wei Z., Wang X., Li L., et al. (2019). Monitoring seaweed aquaculture in the Yellow Sea with multiple sensors for managing the disaster of macroalgal blooms. Remote Sens. Environment. 231, 111279. doi: 10.1016/j.rse.2019.111279
Xing Q., Hu C. (2016). Mapping macroalgal blooms in the Yellow Sea and East China Sea using HJ-1 and Landsat data: Application of a virtual baseline reflectance height technique. Remote Sens. Environment. 178, 113–126. doi: 10.1016/j.rse.2016.02.065
Xing Q., Liu H., Li J., Hou Y., Meng M., Liu C. (2023). A novel approach of monitoring Ulva pertusa green tide on the basis of UAV and deep learning. Water 15, 3080. doi: 10.3390/w15173080
Xing Q., Wu L., Tian L., Cui T., Li L., Kong F., et al. (2018). Remote sensing of early-stage green tide in the Yellow Sea for floating-macroalgae collecting campaign. Mar. Pollut. Bulletin. 133, 150–156. doi: 10.1016/j.marpolbul.2018.05.035
Xing Q. G., Zheng X. Y., Shi P., Hao J. J., Yu D. F., Liang S. Z., et al. (2011). Monitoring “Green tide” in the yellow sea and the east China sea using multi-temporal and multi-source remote sensing images. Spectrosc. Spectral Analysis. 31, 1644–1647. doi: 10.3964/j.issn.1000-0593(2011)06-1644-04
Xu F., Gao Z., Shang W., Jiang X., Zheng X., Ning J., et al. (2017). Validation of MODIS-based monitoring for a green tide in the Yellow Sea with the aid of unmanned aerial vehicle. J. Appl. Remote Sens. 11, 012007–012007. doi: 10.1117/1.JRS.11.012007
Xu S., Yu T., Xu J., Pan X., Shao W., Zuo J., et al. (2023). Monitoring and forecasting green tide in the yellow sea using satellite imagery. Remote Sensing. 15, 2196. doi: 10.3390/rs15082196
Xu Q., Zhang H., Cheng Y. (2016). Multi-sensor monitoring of Ulva prolifera blooms in the Yellow Sea using different methods. Front. Earth Sci. 10, 378–388. doi: 10.1007/s11707-015-0528-1
Xu Q., Zhang H., Ju L., Chen M. (2014). Interannual variability of Ulva prolifera blooms in the Yellow Sea. Int. J. Remote Sensing. 35, 4099–4113. doi: 10.1080/01431161.2014.916052
Xue M., Wu M., Zheng L., Liu J., Liu L., Zhu S., et al. (2023). Multi-factors synthetically contribute to Ulva prolifera outbreaks in the south yellow sea of China. Remote Sensing. 15, 5151. doi: 10.3390/rs15215151
Yang D., Yuen K.-V., Gu X., Sun C., Gao L. (2023). Influences of environmental factors on the dissipation of green tides in the Yellow Sea, China. Mar. Pollut. Bulletin. 189, 114737. doi: 10.1016/j.marpolbul.2023.114737
Yu D., Li J., Xing Q., An D., Li J. (2023). The dynamics of floating macroalgae in the east China sea and its vicinity waters: A comparison between 2017 and 2023. Water 15, 3797. doi: 10.3390/w15213797
Yuan C. (2022). A new assessment of the algal biomass of green tide in the Yellow Sea. Mar. Pollut. Bulletin. 174, 113253. doi: 10.1016/j.marpolbul.2021.113253
Zhan Y., Qiu Z., Wang Y., Su Y., Li Y., Cui Y., et al. (2024). Long-term spatiotemporal characteristics of Ulva prolifera green tide and effects of environmental drivers on its monitoring by satellites: A case study in the yellow sea, China, from 2008 to 2023. J. Mar. Sci. Engineering. 12, 630. doi: 10.3390/jmse12040630
Zhang B., Guo J., Li Z., Cheng Y., Zhao Y., Boota M. W., et al. (2022). Identifying the spatio-temporal variations of Ulva prolifera disasters in all life cycle. J. Water Climate Change. 13, 629–644. doi: 10.2166/wcc.2021.424
Zhang Y., He P., Li H., Li G., Liu J., Jiao F., et al. (2019). Ulva prolifera green-tide outbreaks and their environmental impact in the Yellow Sea, China. Natl. Sci. Review. 6, 825–838. doi: 10.1093/nsr/nwz026
Zhang J., Huo Y., Wu H., Yu K., Kim J. K., Yarish C., et al. (2014). The origin of the Ulva macroalgal blooms in the Yellow Sea in 2013. Mar. Pollut. Bulletin. 89, 276–283. doi: 10.1016/j.marpolbul.2014.09.049
Zhang J. H., Huo Y. Z., Zhang Z. L., Yu K. F., He Q., Zhang L. H., et al. (2013). Variations of morphology and photosynthetic performances of Ulva prolifera during the whole green tide blooming process in the Yellow Sea. Mar. Environ. Res. 92, 35–42. doi: 10.1016/j.marenvres.2013.08.009
Zhang G., Niu L., Wu M., Kaufmann H., Li H., He Y., et al. (2024b). Ecological impact patterns and temporal cycles of green tide biomass in the settlement region: based on time-series remote sensing and in situ data. IEEE J. Selected Topics Appl. Earth Observations Remote Sensing. 17, 1610–1622. doi: 10.1109/JSTARS.2023.3338979
Zhang G., Wu M., Wei J., He Y., Niu L., Li H., et al. (2021). Adaptive threshold model in Google Earth Engine: A case study of Ulva prolifera extraction in the South Yellow Sea, China. Remote Sensing 13, 3240. doi: 10.3390/rs13163240
Zhang H., Qin Q., Sun D., Ye X., Wang S., Zong Z. (2024a). Automatic detection of floating Ulva prolifera bloom from optical satellite imagery. J. Mar. Sci. Engineering. 12, 680. doi: 10.3390/jmse12040680
Zhang H., Wang G., Zhang C., Su R., Shi X., Wang X. (2020b). Characterization of the development stages and roles of nutrients and other environmental factors in green tides in the Southern Yellow Sea, China. Harmful Algae. 98, 101893. doi: 10.1016/j.hal.2020.101893
Zhang G., Wu M., Zhang A., Xing Q., Zhou M., Zhao D., et al. (2020a). Influence of sea surface temperature on outbreak of Ulva prolifera in the Southern Yellow Sea, China. Chin. Geographical Science. 30, 631–642. doi: 10.1007/s11769-020-1129-9
Zhang J., Zhao P., Huo Y., Yu K., He P. (2017). The fast expansion of Pyropia aquaculture in “Sansha” regions should be mainly responsible for the Ulva blooms in Yellow Sea. Estuarine Coast. Shelf Sci. 189, 58–65. doi: 10.1016/j.ecss.2017.03.011
Zheng H. Y., Liu Z., Chen B., Xu H. (2020). Quantitative Ulva prolifera bloom monitoring based on multi-source satellite ocean color remote sensing data. Appl. Ecol. Environ. Res. 18, 4897–4913. doi: 10.15666/aeer/1804_48974913
Zheng L., Wu M., Cui Y., Tian L., Yang P., Zhao L., et al. (2022a). What causes the great green tide disaster in the South Yellow Sea of China in 2021? Ecol. Indicators. 140, 108988. doi: 10.1016/j.ecolind.2022.108988
Zheng L., Wu M., Zhou M., Zhao L. (2022b). Spatiotemporal distribution and influencing factors of Ulva prolifera and Sargassum and their coexistence in the South Yellow Sea, China. J. Oceanology Limnology. 40, 1070–1084. doi: 10.1007/s00343-021-1040-y
Zhou F., Ge J., Liu D., Ding P., Chen C., Wei X. (2021). The Lagrangian-based Floating Macroalgal Growth and Drift Model (FMGDM v1.0): application to the Yellow Sea green tide. Geoscientific Model. Dev. 14, 6049–6070. doi: 10.5194/gmd-14-6049-2021
Keywords: Ulva prolifera green tide, Yellow Sea, East China Sea, remote sensing, deep learning
Citation: Geng X, Li H, Wang L, Sun W and Li Y (2025) A comprehensive review of remote sensing techniques for monitoring Ulva prolifera green tides. Front. Mar. Sci. 12:1546289. doi: 10.3389/fmars.2025.1546289
Received: 16 December 2024; Accepted: 08 January 2025;
Published: 28 January 2025.
Edited by:
Liangliang Li, Beijing Institute of Technology, ChinaCopyright © 2025 Geng, Li, Wang, Sun and Li. This is an open-access article distributed under the terms of the Creative Commons Attribution License (CC BY). The use, distribution or reproduction in other forums is permitted, provided the original author(s) and the copyright owner(s) are credited and that the original publication in this journal is cited, in accordance with accepted academic practice. No use, distribution or reproduction is permitted which does not comply with these terms.
*Correspondence: Huiru Li, bGlodWlydUBoZWJ0dS5lZHUuY24=
Disclaimer: All claims expressed in this article are solely those of the authors and do not necessarily represent those of their affiliated organizations, or those of the publisher, the editors and the reviewers. Any product that may be evaluated in this article or claim that may be made by its manufacturer is not guaranteed or endorsed by the publisher.
Research integrity at Frontiers
Learn more about the work of our research integrity team to safeguard the quality of each article we publish.