 Siwen Gao
 Chao Zhou
 Lingling Jiang
 Jingping Xu
- 1National Marine Environmental Monitoring Center, Ministry of Ecology Environment, Dalian, China
- 2College of Environmental Science and Engineering, Dalian Maritime University, Dalian, China
The complex composition of seawater presents significant challenges for accurately estimating biogeochemical data through optical measurements, both in situ and via satellite data. To address the regional applicability of single bio-optical or remote sensing algorithms caused by these challenges, we explored a water optical classification method based on inherent optical properties and particle composition. The ratio of organic particulate matter to total suspended particulate matter concentration (POM/SPM) serves as an optical discriminator of water bodies based on the proportions of organic and mineral particles. The boundary value is determined by the relationship between the particulate backscattering coefficient bbp(λ) and POM/SPM. By analyzing in situ data collected from the coastal waters of Qinhuangdao in the Bohai Sea, China, we developed empirical algorithms to estimate both the POM/SPM ratio and chlorophyll-a (Chl-a) concentration, the latter being a key parameter derived from current ocean remote sensing that indicates phytoplankton abundance. The evaluation of our algorithms demonstrates that accounting for POM/SPM variations significantly improves Chl-a estimate accuracy across the optically-complex coastal waters near Qinhuangdao compared to algorithms that do not consider changes in particle composition, such as the well-known OC4Me algorithm. Furthermore, we determined the distribution of monthly averaged Chl-a concentration and POM/SPM ratio on the coast of Qinhuangdao, Bohai Sea, in 2023. Our results show, for the first time, that the monthly average variations of the POM/SPM ratio in the Bohai Sea and Chl-a concentrations exhibit pronounced seasonal fluctuations.
1 Introduction
The intricate composition of seawater presents a significant challenge for accurately estimating biogeochemical conditions through various optical measurements, including in situ and satellite data. The interaction between light and complex assemblages of water constituents is closely tied to the composition of suspended particulate matter, particularly the proportion of organic and inorganic particles (Stramski et al., 2023). Due to the variability of these particle compositions across different marine regions, the optical properties of seawater exhibit significant complexity and diversity (Xi et al., 2015; Reynolds et al., 2016). In the open sea, organic particles such as plankton and detritus predominate, whereas coastal waters contain particles from river inflow, seabed disturbances, and precipitation, resulting in a mix of organic and mineral particles under turbulent conditions (Baumas and Bizic, 2024). Consequently, no single bio-optical or remote sensing algorithm whether empirical, semi-analytical, or analytical-can fully encompass the variety of aquatic environments in coastal waters. These algorithms are highly dependent on specific datasets and require adjustment, optimization, and validation when applied to large-scale regions (Mélin and Vantrepotte, 2015).
To address the regional applicability of optical inversion algorithms in ocean color remote sensing, the concept of water optical classification has been introduced. This method is independent of place and time and shows strong universality. It involves establishing a classification method to distinguish different water environments and selecting appropriate algorithms based on these conditions. Methods include remote sensing reflectance spectral clustering (Lubac and Loisel, 2007; Vantrepotte et al., 2012), biological optical parameter thresholds (McKee et al., 2007; Binding et al., 2009), and classification based on particle intrinsic characteristics (Stramski et al., 2001; Sullivan et al., 2005). Particle refractive index, size distribution, and backscattering ratio are among the intrinsic characteristics closely linked to optical properties. Some studies suggest that particles are concentric shells with varying refractive indices (Boss et al., 2009). Inorganic particles have higher refractive indices than organic particles (Zaneveld et al., 1974; Aas, 1996; Stramski et al., 2004). Limited research indicates that particles with a relatively high refractive index significantly affect the backscattering coefficient and, consequently, the remote sensing reflectance (Reynolds et al., 2016; Uusõue et al., 2022). Therefore, optical classification of water bodies based on particle intrinsic characteristics could be a feasible solution. However, technical difficulties in measuring these characteristics, such as refractive index, make this method challenging to apply, leaving it largely in the field data analysis stage.
The backscattering coefficient (bb(λ)) is crucial for quantifying ocean color and influences the diffuse reflectance capacity of the water column (Boss et al., 2004). It provides valuable information about the abundance and types of suspended particles and is used to estimate their refractive index (Twardowski et al., 2001; Babin et al., 2003). Because seawater contains a mixture of different particle types that are difficult to separate, the measured refractive index in practical observations is largely influenced by particle composition rather than individual components. Accordingly, light backscattering properties and their relation to particle composition have been investigated (Vaillancourt et al., 2004), including the ratio of Chlorophyll-a (Chl-a) to suspended minerals (Chl-a/MSS) (Mckee and Cunningham, 2006), the ratio of mineral to total suspended solid concentration (MSS/TSS) (Bowers et al., 2014), the ratio of organic particulate matter to total suspended particulate matter concentration (POM/SPM) (Snyder et al., 2008) and the ratio of particulate organic carbon to suspended particulate matter concentration (POC/SPM) (Woniak et al., 2010). In summary, inherent optical properties are effectively linked to the intrinsic characteristics of particulate matter (refractive index) through the relationship between backscattering characteristics and particle composition (Lain et al., 2023). By utilizing this relationship to classify water bodies with distinct properties and subsequently inversing the particulate matter concentration, advanced remote sensing analysis based on the intrinsic nature of particulate matter can be achieved. This approach not only broadens the scope of inversion methods for coastal particulate matter concentration but also has great potential for significantly improving inversion accuracy. However, few studies have applied this classification method to the inversion of particulate matter concentration in satellite images, with focusing on the inversion of suspended particle types or the differentiation of water types (Loisel et al., 2023; Wang et al., 2023). As a result, it remains challenging to verify the accuracy improvement in particle concentration inversion based on the backscattering- particle composition classification method.
Therefore, this study aimed to: (i) investigate the relationship between backscattering and POM/SPM as a method for optically distinguishing water bodies, (ii) develop algorithms for estimating the POM/SPM ratio and Chl-a concentration from optical measurements of remote-sensing reflectance (Rrs(λ)), and (iii) validate the backscattering-POM/SPM classification-based Chl-a concentration estimation method. The selection of Chl-a as the inversion index is attributed to the fact that Chl-a concentration can, to a certain extent, reflect the abundance of marine photosynthetic plankton or phytoplankton, which is also a key product in current ocean remote sensing research. In this study, a water classification method based on inherent optical properties and particle composition algorithms was established. This framework was built upon discerning the relationship between the particulate backscattering coefficient (bbp(λ)) and the organic suspended matter to suspended particulate matter concentration ratio (POM/SPM).
2 Materials and methods
2.1 In situ dataset
The Bohai Sea is located in the northern part of the east coast of China. It is a semi-enclosed body of water, surrounded by the land from 3 sides, and is divided into 4 parts: Liaodong Bay, Bohai Bay, Laizhou Bay and the Central Bohai Sea. The study area was located near the coast of Qinhuangdao in the northwest of the Bohai Sea, as shown in Figure 1, which details the sampling stations’ locations. Several large rivers, including the Shi River, Dai River, and Yang River, flow into the Qinhuangdao coastal waters, carrying a substantial amount of inorganic and organic suspended matter. As a result, the optical properties of this sea area exhibit typical characteristics of Case II waters.
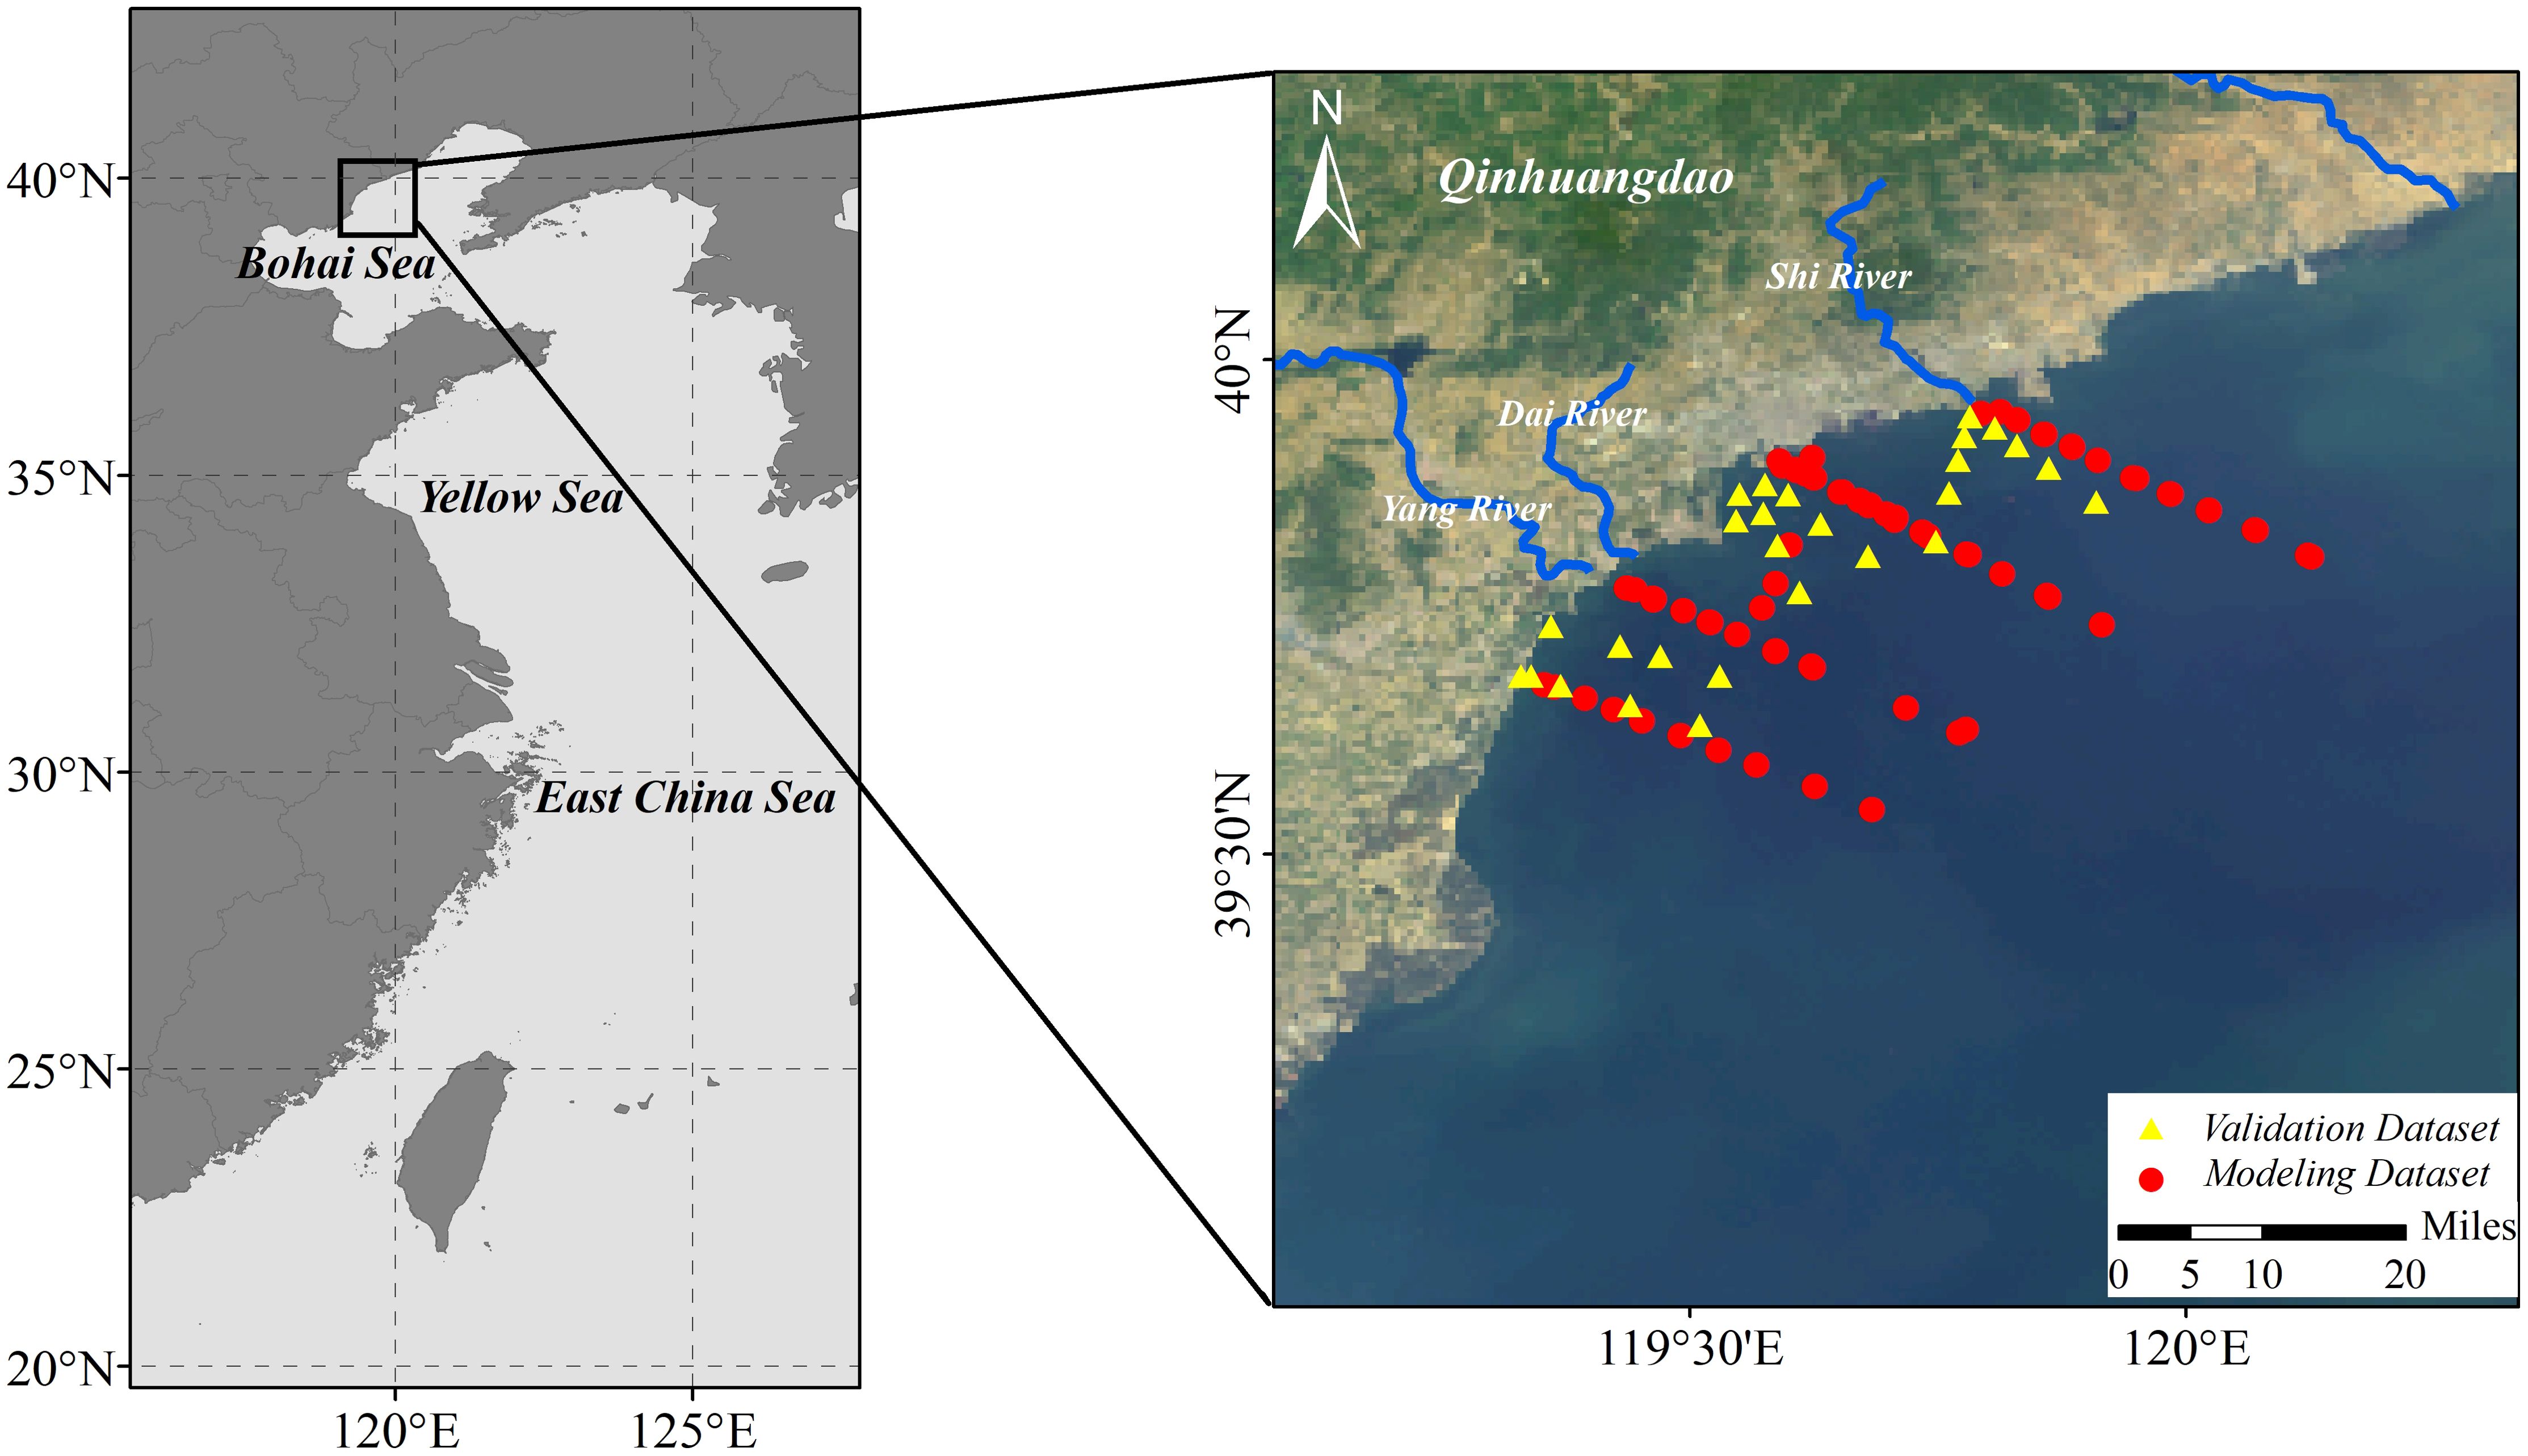
Figure 1. Location of sampling stations in the coastal waters of Qinhuangdao, Bohai Sea, China.
A total of 100 samples were collected from 2016-2018 and the descriptive of data collection was listed in the Table 1. 73 samples were used for the modeling dataset and 27 samples were used for the validation dataset. In situ data included optical and biochemical parameters of the ocean surface, such as Rrs(λ), bb(λ), bbp(λ), and the concentrations of SPM, POM, and Chl-a. Water samples for biochemical parameters were collected at a depth of 0.5 m.
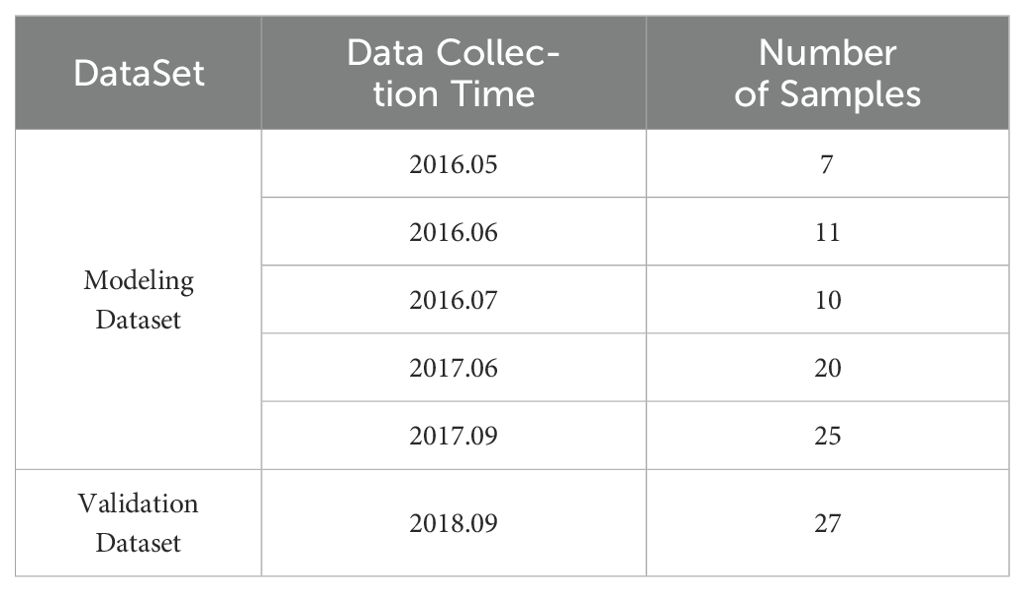
Table 1. Descriptive of data collection.
An Analyti-cal Spectral Device (ASD) FieldSpec spectral radiometer with a spectral range from 350 to 2500 nm was used to measure the downwelling solar irradiance (Ed(λ)), the above-water upwelling radiance (Lsfc(λ)) and the diffuse sky radiance (Lsky(λ)), following the NASA Ocean Optics Protocols (Mueller et al., 2003). The Lsfc(λ) was observed to avoid the ship’s shadow and sunlight pollution with an azimuth viewing direction of 135°C from the sun and a zenith angle of 40°C . Before each cruise, the absolute radiometric calibration was performed on the detector. The Rrs(λ) is calculated as Formula 1:
where Lw(λ) is the water leaving radiance and ρ is the dimensionless air-water reflectance, which is always in the range of 0.022–0.05 (Lee et al., 1996; Tang et al., 2004) and was set at 0.028 for this study (Mobley, 1999). The median was selected after repeated measurement, and the Rrs(λ) were resampled to 1 nm intervals.
The bb(λ) was obtained using a six-channel backscattering measuring instrument (HOBI Labs Hydroscat-6, HS-6), which recorded the total volume-scattering function β(λ) at a backward angle of approximately 140° (Maffione and Dana, 1997). The measured wavelengths are 412 nm, 442 nm, 488 nm, 550 nm, 620 nm, and 700 nm, respectively. The bbp(λ) was the measured value corrected by sigma minus the backscattering coefficient of pure water bw(λ), as Formula 2:
SPM and POM were determined by the gravimetric method (Administration of Quality and Technology Superision of China, 1998) through GF/F filters with 0.45 µm nominal pore sizes and filtration equipment. GF/F filters are pre-combusted at high temperatures (e.g., 450°C) to remove any organic material that might interfere with measurements. After combustion, they are rinsed with deionized water and dried. Measure 1L to 2L seawater and filter it through a prepared GF/F filters. And the filters are weighed before and after filtration using a precision balance capable of measuring in filters. After weighing, the filters containing collected particles are combusted again to determine POM. The weight loss during combustion indicates the amount of organic matter present, while the remaining weight represents inorganic matter (PIM), as Formula 3:
Chl-a was measured using the fluorometric method (Administration of Technology Supervision of China, 1991). Water samples were filtered through Whatman GF/F glass microfiber filters. The volumes of the seawater samples were 0.5L to 1L. The filters were analyzed immediately with a laboratory fluorometer (Turner Designs, TD-700), otherwise stored in the refrigerator (−20°C) until analysis in the laboratory.
2.2 Satellite data
OLCI (Ocean and Land Colour Instrument) Level-2 Ocean Color Full-resolution data (OLCI_WFR, 300-m) covering the study areas were obtained from the EUMETSAT Data Store (https://data.eumetsat.int/search). The Level-2 OLCI data were pre-processed with the Baseline Atmospheric Correction (BAC) to obtain Rrs(λ). The BAC is based on the NIR black pixel assumption (Gordon and Wang, 1994a) and the bright pixel atmospheric correction algorithm (Moore et al., 1999). OLCI Level 2 CHL Concentration product includes Chl_OC4Me and Chl_NN (neural net algorithm). The Chl_OC4Me product is generated using ESA’s 4-band combination chlorophyll-a algorithm (OC4Me) which applies a fourth-order polynomial equation and a Maximum Band Ratio (MBR) between the irradiance reflectance at the wavelength of 443, 490, 510, and 555 nm, and the algorithm is widely known and freely available to the public (Morel et al., 2007).
For monthly products, cloud-free OLCI images were selected and processing using spatial binning at 300 m resolution with the nearest neighbor method, utilizing the Level 3-binning feature of the Sentinel Application Platform (SNAP), and then the aggregation of individual images into monthly products.
2.3 Match-up procedures
The match-ups between satellite data and the in situ dataset were determined based on satellite overpass time and sampling location. A one-day time window was selected, and a surrounding 3-by-3 pixel box centered on the location of the in situ points was extracted. The pixel box was discarded if fewer than six valid pixels were present, or if the center pixel was invalid. Mean and standard deviation were calculated for all satellite products with valid pixels in the pixel boxes. In situ data were averaged if multiple measurements were available in the same pixel. Through this procedure, 27 valid match-ups were obtained and used as the validation dataset.
2.4 Water classification method of backscattering-particle composition algorithms
The backscattering coefficient at 550 nm was chosen as the parameter to investigate the relationship between the particulate backscattering coefficient and particle composition. At this particular wavelength, the absorption coefficient is least affected by phytoplankton, meaning that particles reflected more light at this wavelength than at any other wavelength in the visible spectrum (Lee et al., 2002). Additionally, the data obtained at 550 nm are less affected by atmospheric interference than at the other wavelengths, making it a reliable choice for ocean color measurements (Gordon, 2021). The variation trend of bbp(550) with the organic particle composition (POM/SPM) is shown in Figure 2. The highest value of bbp(550) was associated with the proportion of POM/SPM having a value of 0.23. Before reaching the peak, the bbp(550) increased along with the rise of POM/SPM; however, then displayed a declining trend as POM/SPM continued to increase. It is worth noting that the turning point of the trend (POM/SPM=0.23) happens to fall near the peak of the particle composition’s Gaussian kernel density estimation which indicates that the majority of particulate matter is assembled in this proportion. The opposite trend of the relationship between particle composition and backscattering implies the influence of particle intrinsic characteristics on scattering properties, and due to the presence of particulate matter in seawater as a mixture, as well as the influence of other particle characteristic such as particle size, shape, and structure, backscattering is not linearly proportional to particle composition, which also indicates that backscattering is not linearly related to the refractive index of particulate matter (Snyder et al., 2008). The differences in sensitivities of particle backscattering to composition of particulate assemblages provide a means to study and classify particles (Boss et al., 2004). Thus, water bodies could be classified into two types based on their optical properties by POM/SPM ratio as inorganic-dominant and organic-dominant particle assemblages. The samples exhibiting ratios below 0.23 were classified as assemblages dominated by inorganic particles (N=29), while those with ratios exceeding 0.23 were classified as assemblages dominated by organic particles (N=44).
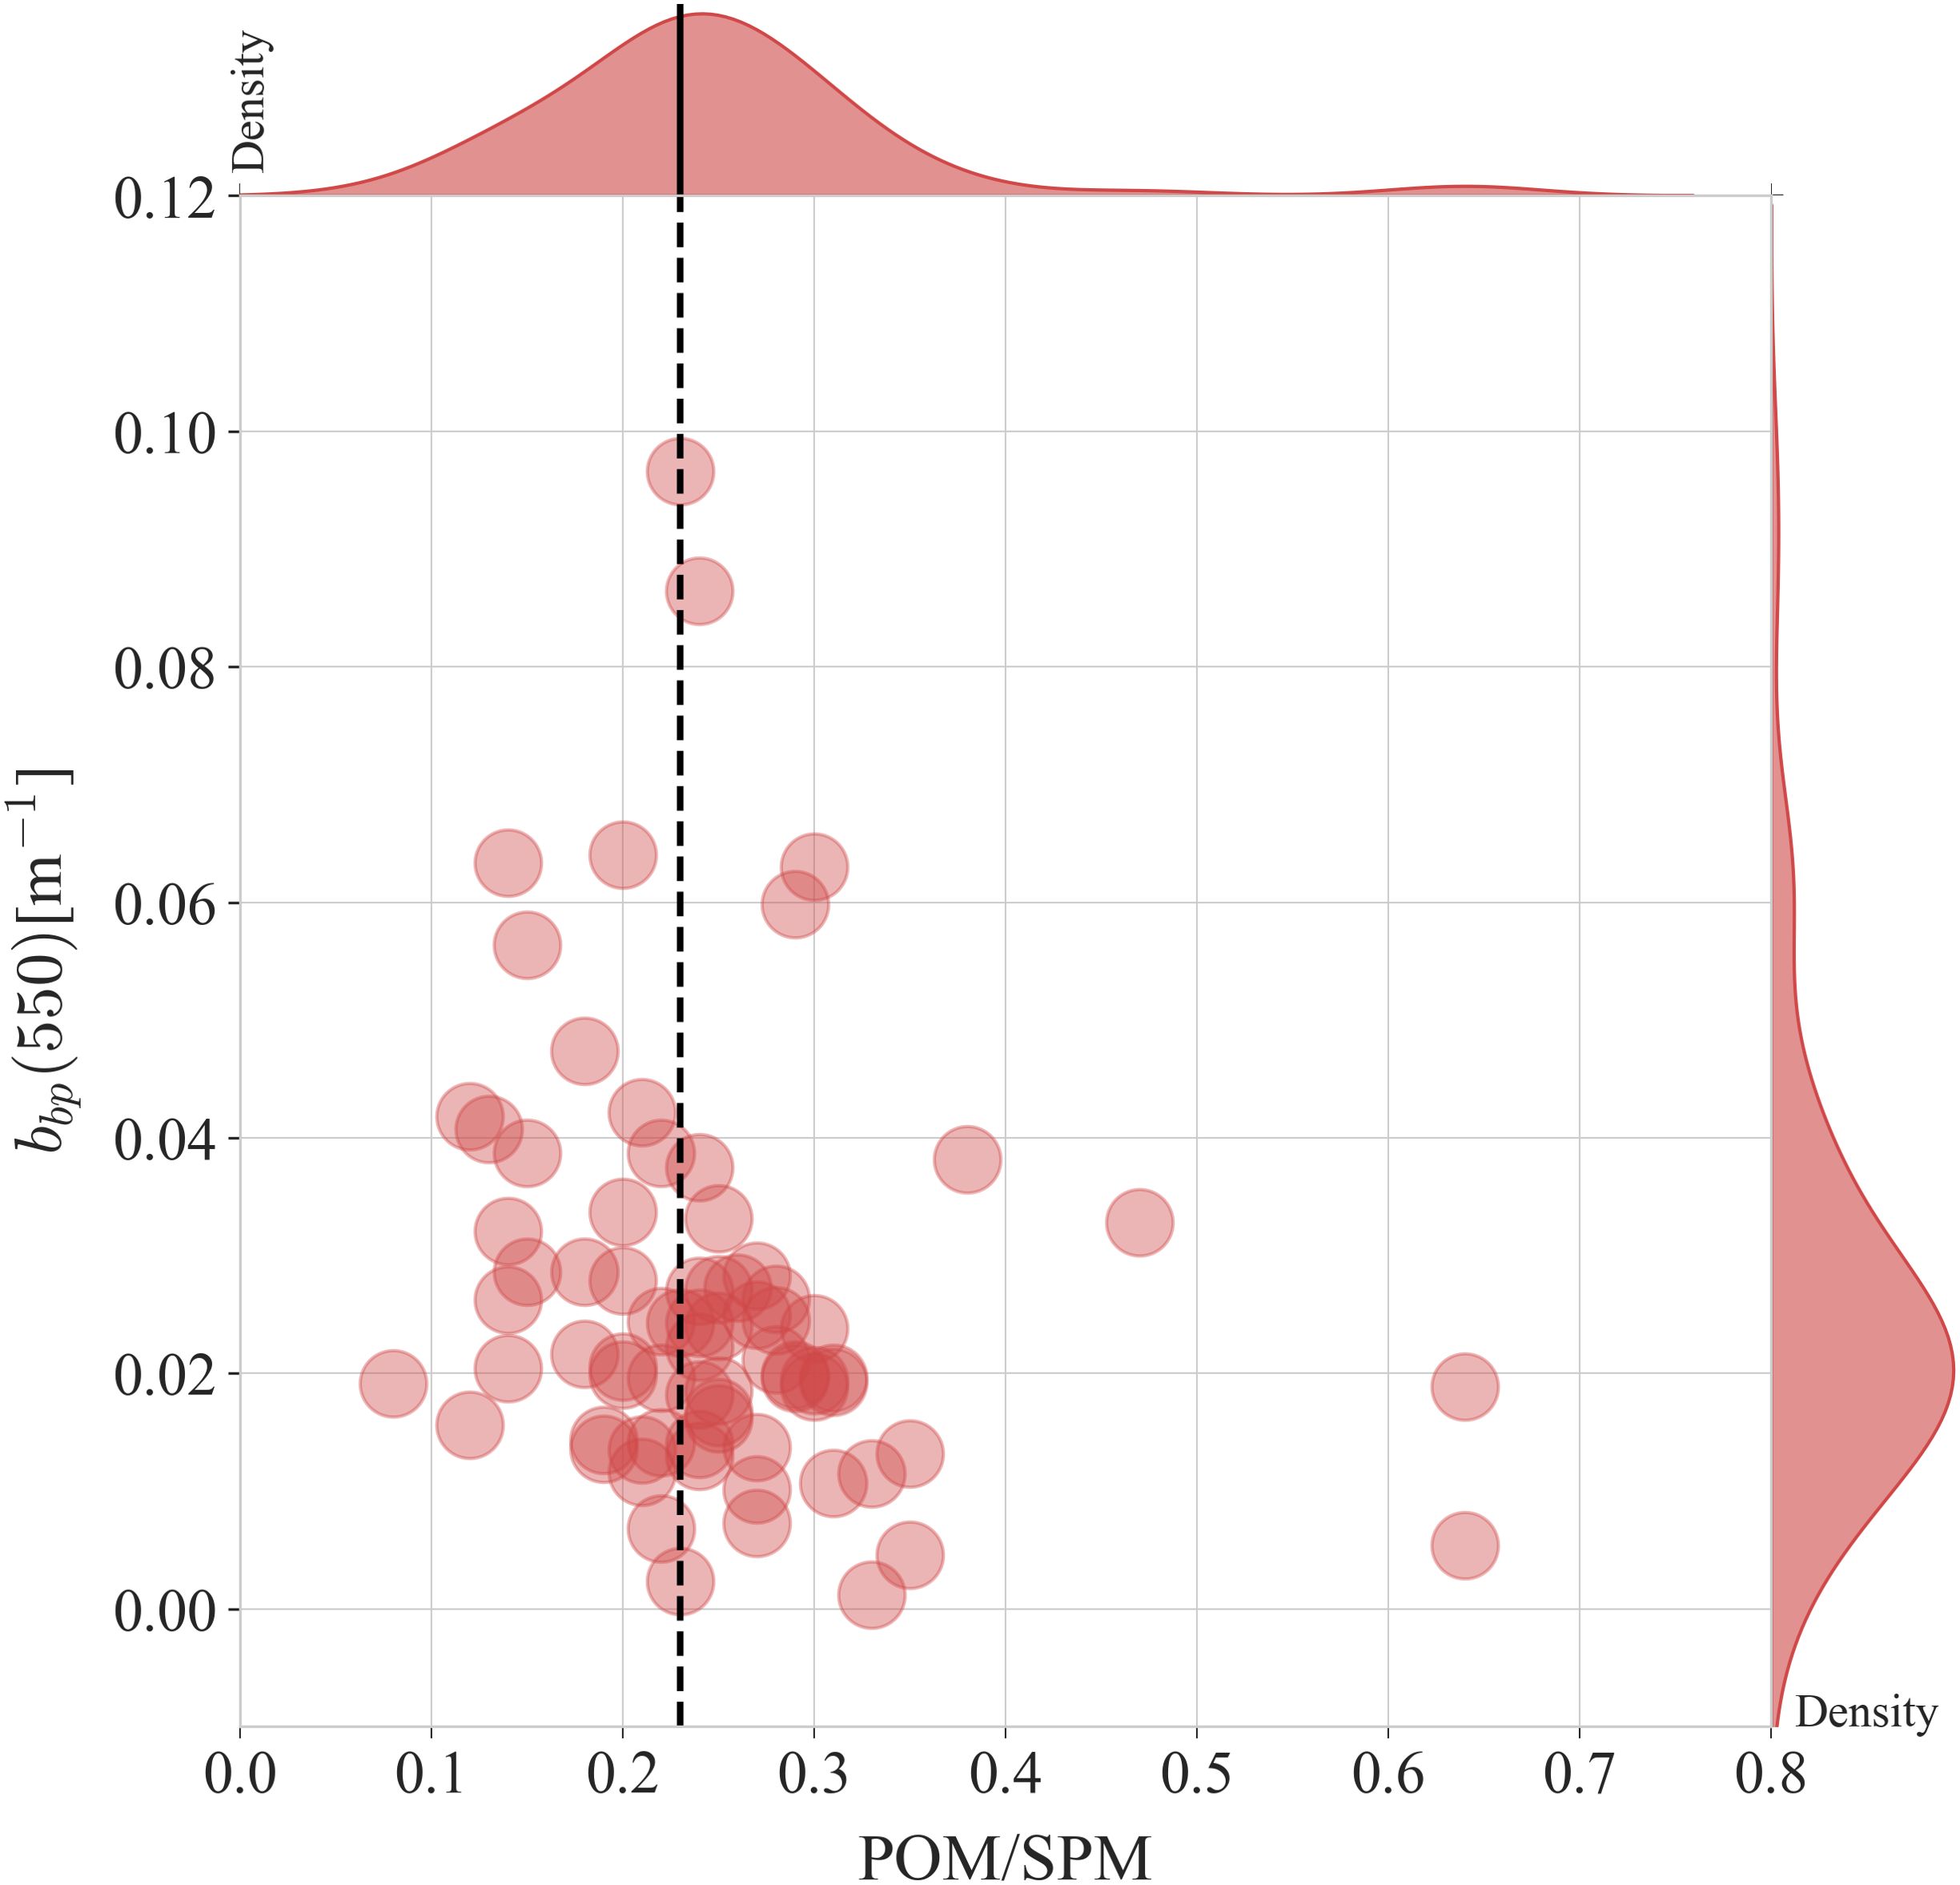
Figure 2. Trend of backscattering coefficient with composition of organic particles.
2.5 Structure of backscattering-particle composition classification-based Chl-a concentration estimation algorithms
The backscattering-particle composition classification-based Chl-a concentration estimation algorithm includes: (i) backscattering-POM/SPM classification, (ii) POM/SPM estimation algorithm, and (iii) Chl-a concentration estimation algorithm for each water type (Figure 3).
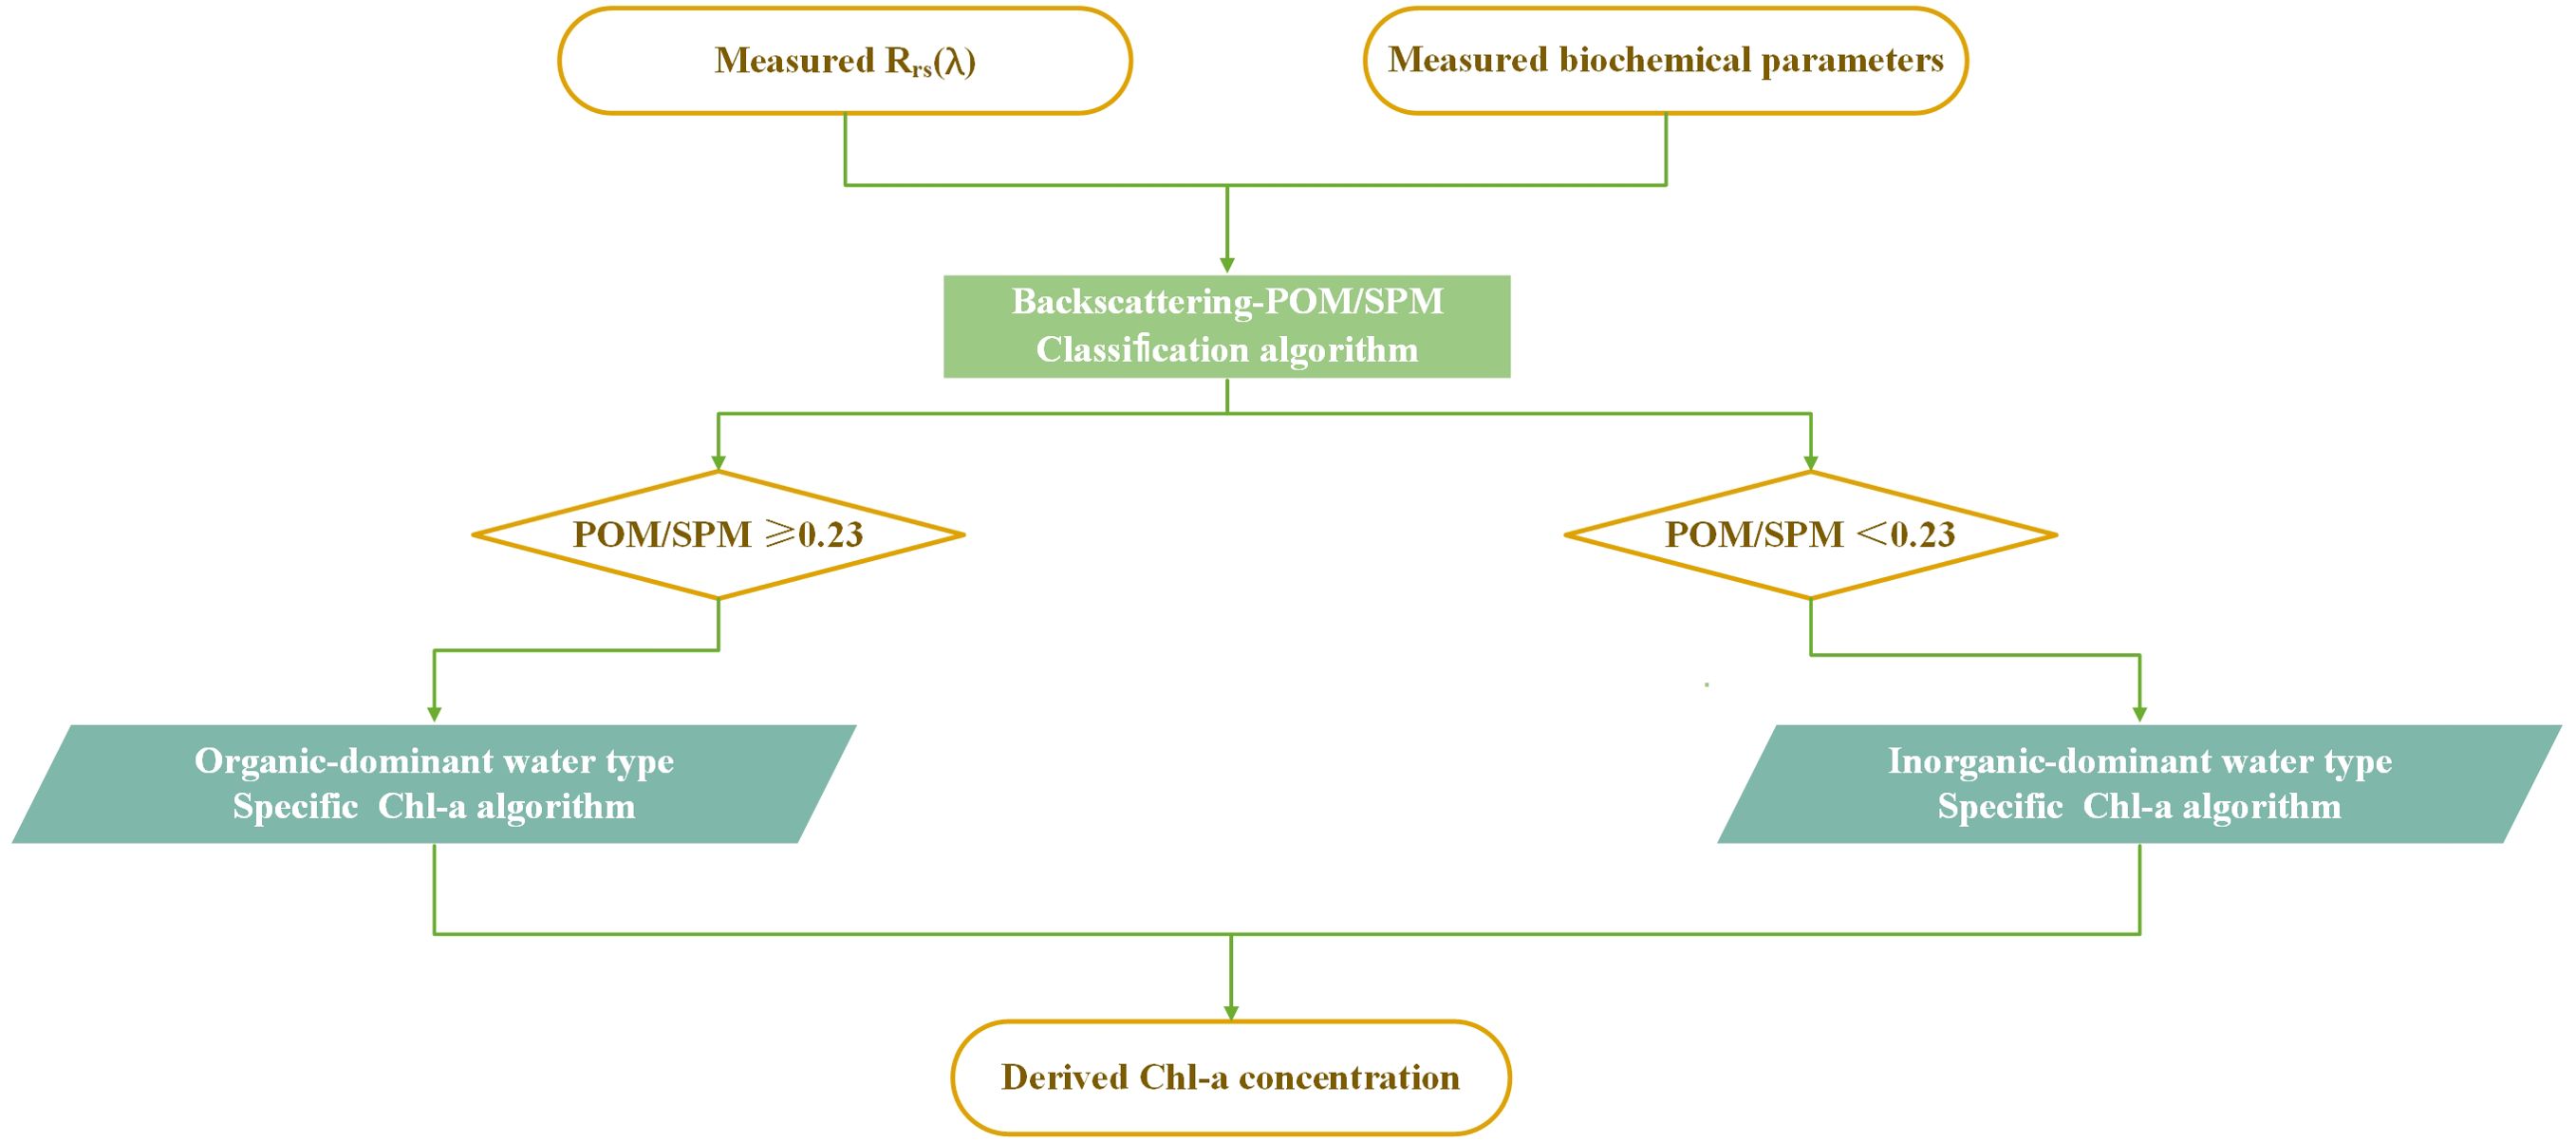
Figure 3. Backscattering-particle composition classification-based Chl-a concentration estimation method.
2.6 Accuracy assessment
The statistics examined included minimum, maximum, average, standard deviation (SD), and coefficient of variation (CV) values:
To evaluate the performance of each algorithm quantitatively, the slope, intercept, coefficient of determination (R²), root mean square error (RMSE), median absolute percent difference (APDm), mean absolute percentage error (MAPE), mean absolute error (MAE), and Pearson correlation coefficient (r) between algorithm-derived and measured variables were calculated.
where N was the number of samples, xi was the measured value, µ was the average value, and yi was the estimated value.
3 Results
3.1 Bio−optical characteristics of the in situ dataset
The pigment and particle mass concentrations exhibited a limited and broad range of variation in our field dataset (Table 2). The SPM values ranged from 2.00 to 17.57 mg L-1, POM and Chl-a were 0.47–9.71 mg L-1 and 0.25–50.85 mg m-3, respectively. Specifically, the Chl-a distribution differed significantly from the SD and CV values. Based on this, we calculated the POM/SPM, Chl-a/SPM, and Chl-a/POM ratios. The values of the POM/SPM ratio (Table 2) vary from about 0.08 to 0.64 which indicates that the particle assemblages range from being totally dominated by inorganic particles (the lowest POM/SPM) to that by the organic particles (the highest POM/SPM). The mean and median values of POM/SPM are nearly identical (0.25 and 0.24, respectively) and the data are evenly distributed with a standard deviation of only 0.09. A wide range of Chl-a/SPM and Chl-a/POM ratios (Table 2) was also observed, which suggests considerable variability in the contribution of phytoplankton to the particle assemblages. Overall, the changes in the particle characteristics shown in Table 2 indicate different conditions in the water body of the study area, with significant variations in the compositions of inorganic, organic, and phytoplankton particles in different proportions.
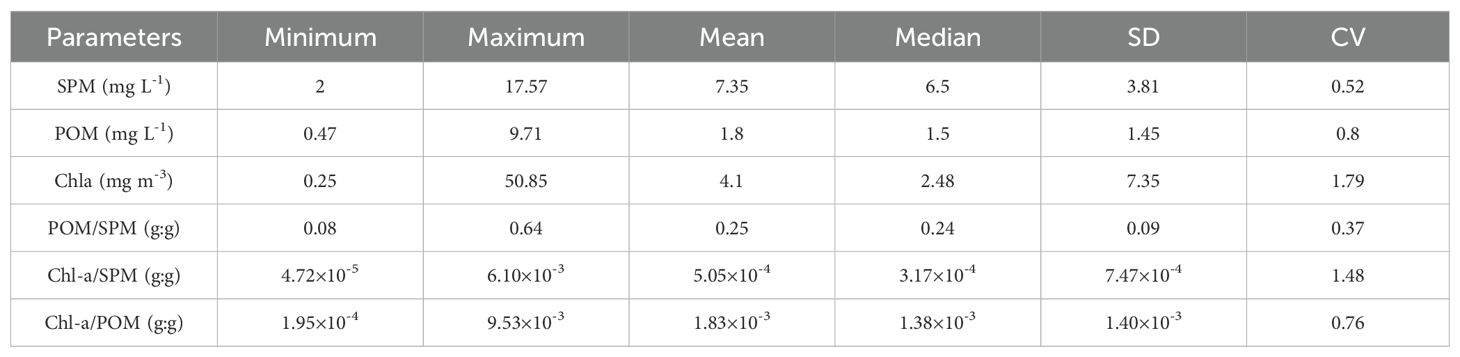
Table 2. Descriptive statistics of measured parameters (N=73).
However, the spectral shapes of Rrs(λ) do not show significant discrimination between the two particle-composition water types (Figure 4). The peak observed near Rrs(550), a typical spectral feature resulting from the weak absorption of Chl-a and carotenoids and strong backscattering by particles in inorganic-dominated water, was higher in the average spectra of inorganic-dominated water than that in organic-dominated water (Vantrepotte et al., 2012). This result is reasonably expected to be reflected in the average bbp(λ) spectra (Figure 5). From the perspective of the spectral clustering method, this dataset does not exhibit a clear taxonomic delineation; however, the backscattering-particle composition classification demonstrates distinct differences between water bodies. This suggests that the widely employed spectral clustering method requires further refinement. While such a classification may prove effective in large-scale applications, effective water-type categorization within small-scale regions, particularly in the coastal sea, may prove elusive. Only through the establishment of an accurate and robust water classification system can the precision of water optical parameter inversion, including Chl-a concentration and even non-optical parameter inversion, be reliably enhanced.
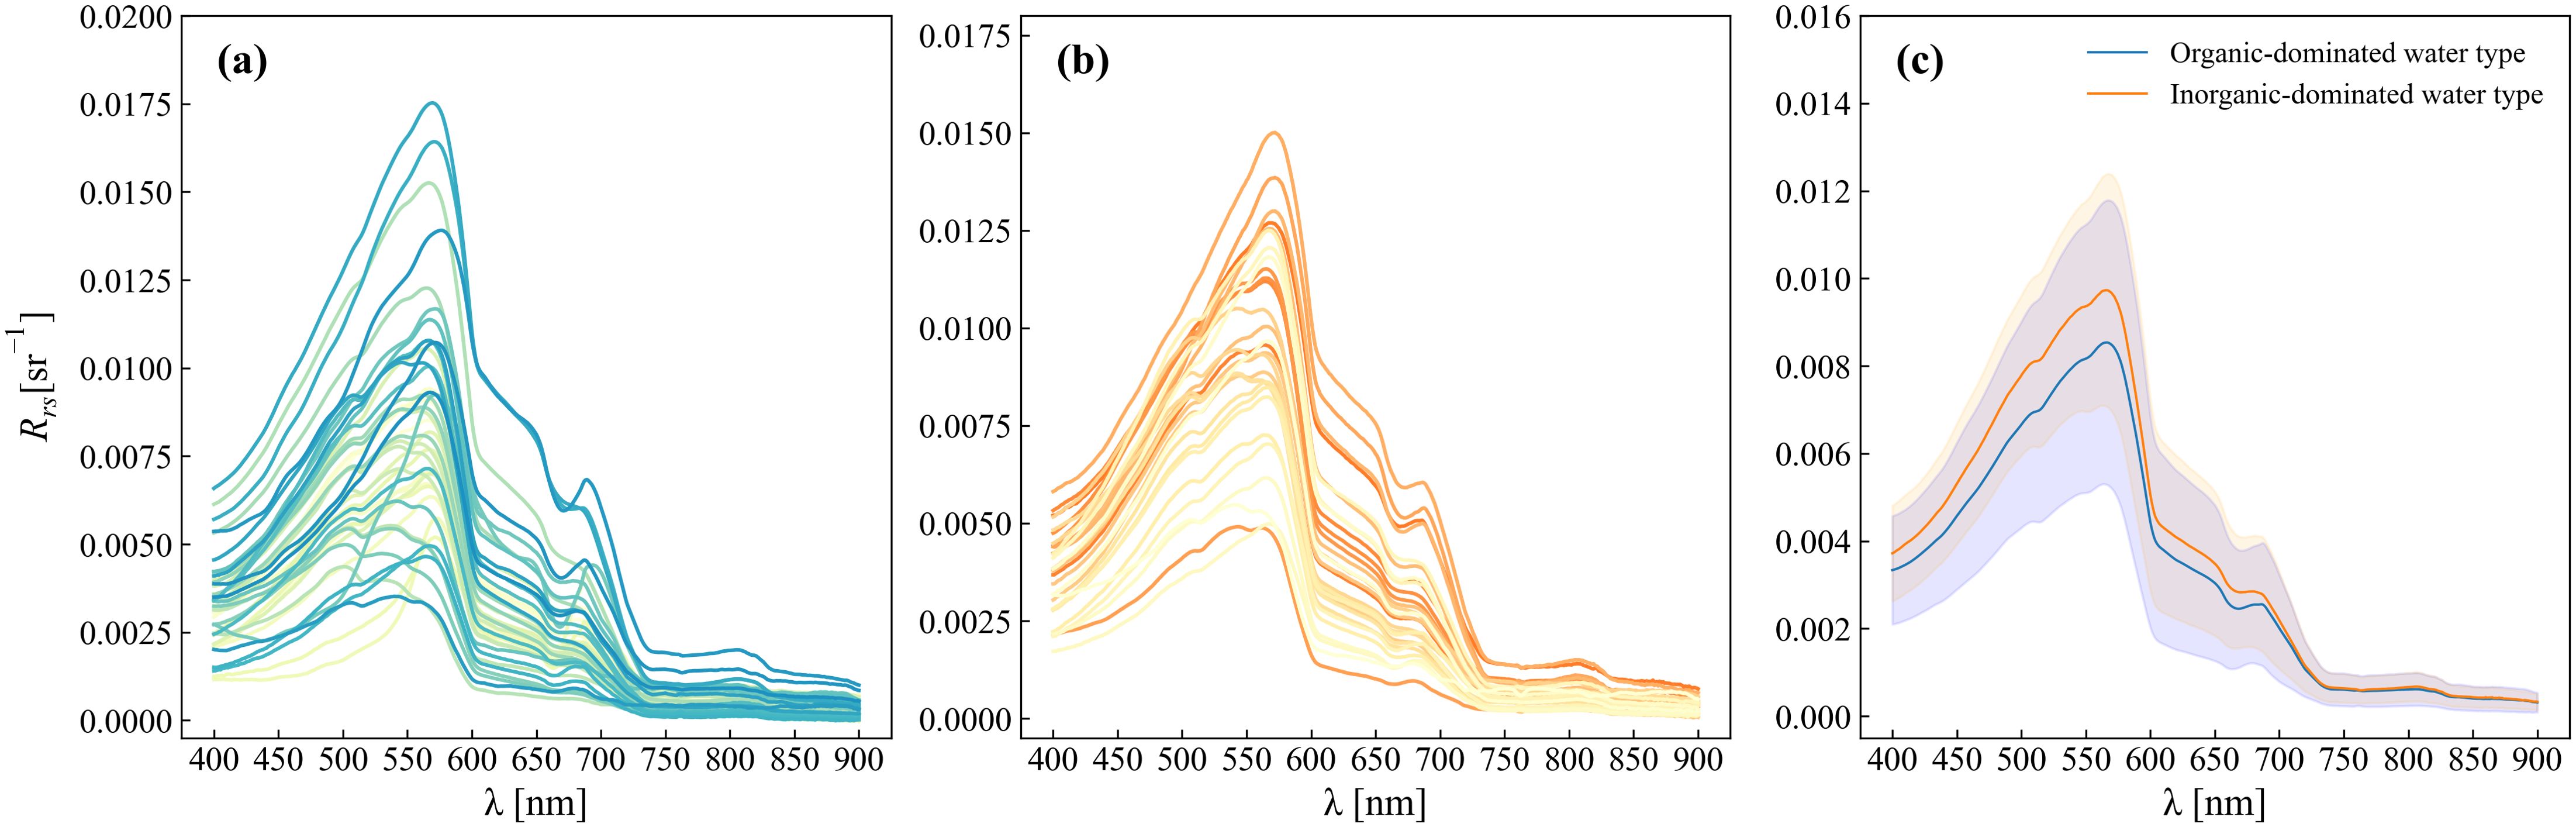
Figure 4. Spectra of remote sensing reflectance, Rrs(λ), for: (A) inorganic-dominated water type, (B) organic-dominated water type, (C) the average spectra for each water type and standard deviation (shaded area).
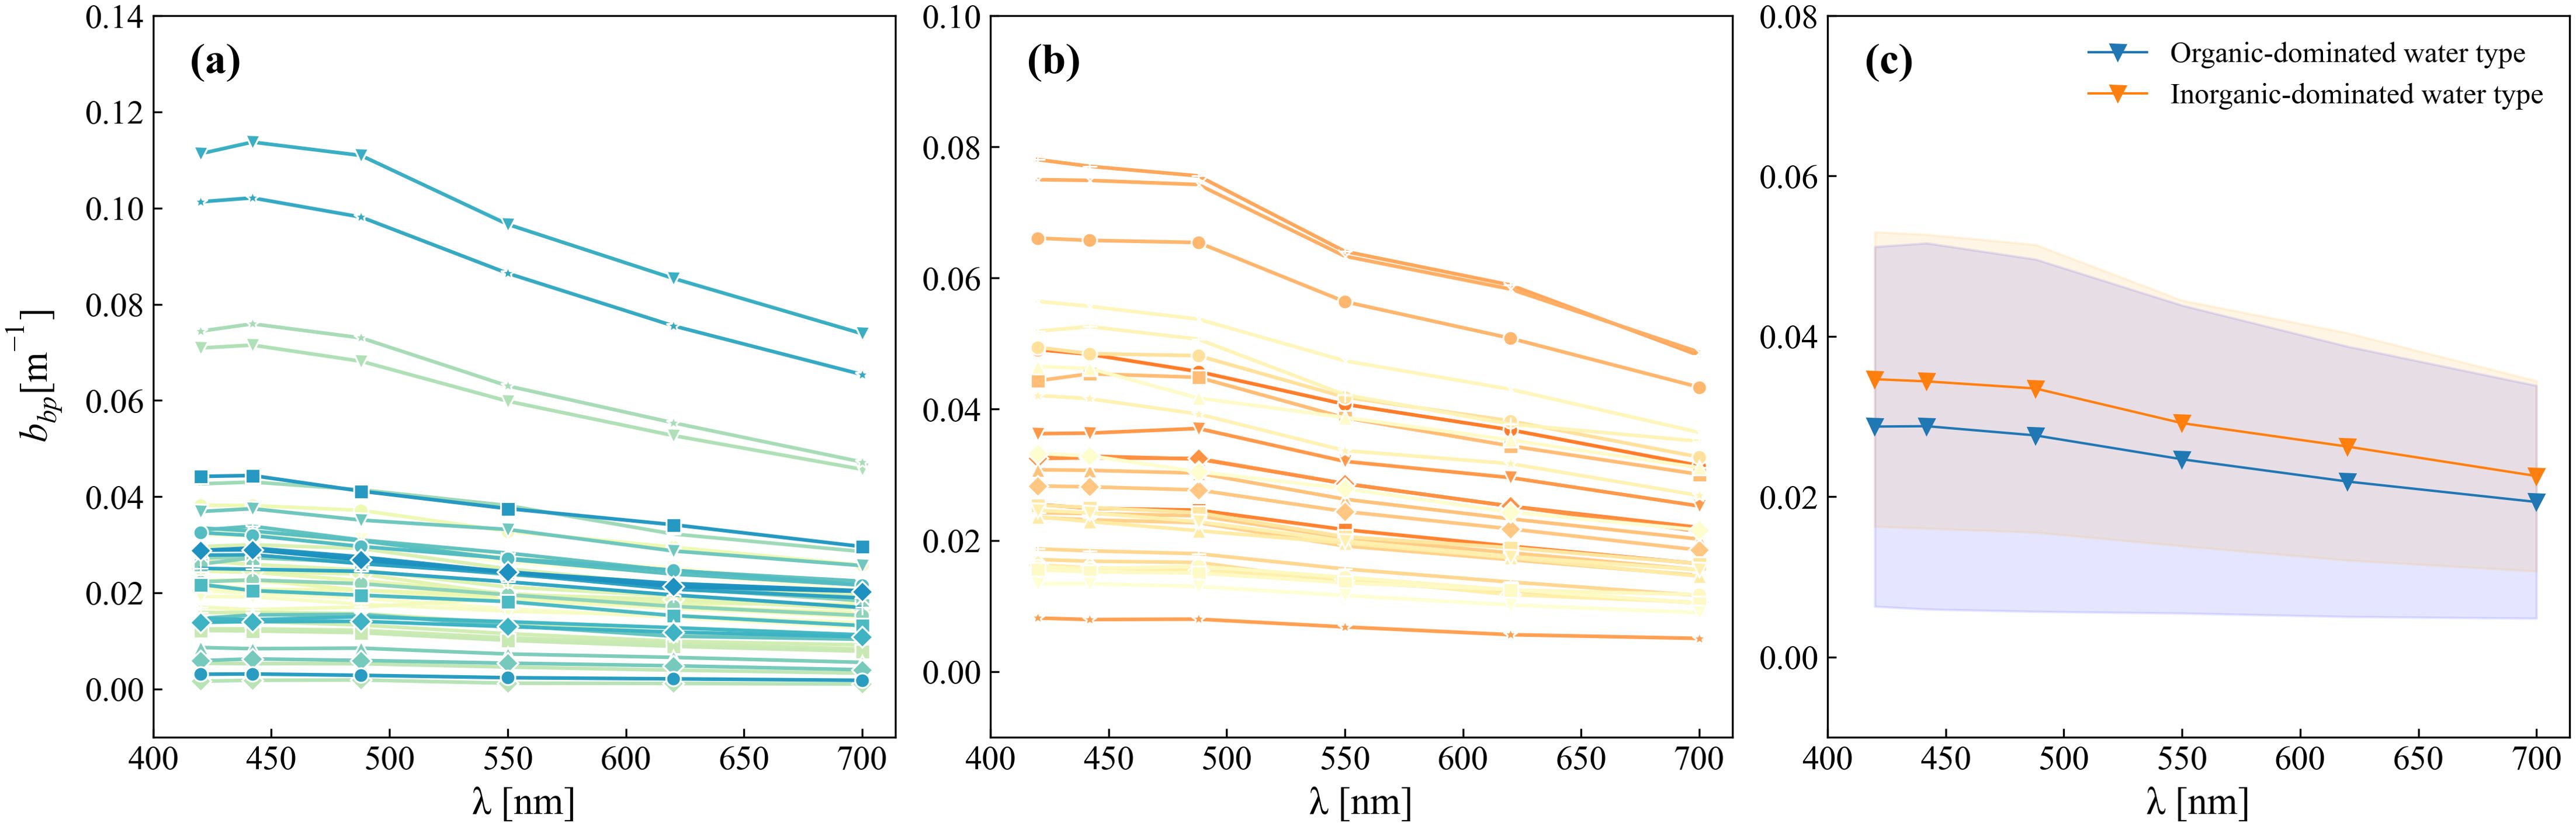
Figure 5. Spectra of backscattering coefficient, bbp(λ), for: (A) inorganic-dominated water type, (B) organic-dominated water type, (C) the average spectra for each water type and standard deviation (shaded area)..
3.2 Rrs-based POM/SPM estimation algorithms
The Rrs-based POM/SPM estimation algorithm was established following Stramski’s (Stramski et al., 2023) the ratio of particulate organic carbon to suspended particulate matter concentration (POC/SPM) estimation algorithms because POC represents a fraction of POM, and many studies have focused on monitoring POM in the ocean by remote sensing of POC (Babin et al., 2003; Tanioka et al., 2020). The relationship between POC/SPM and Rrs(λ) was found that a multiple regression model involving three reflectance predictors spanning the spectral range from the blue through the red bands, provides a reasonably good algorithm. The coefficients of the POC/SPM algorithm were readapted using the field data of the OLCI bands and POM/SPM values in this study. Figure 6 shows the POM/SPM values derived from Formulas 10 plotted versus the measured POM/SPM.
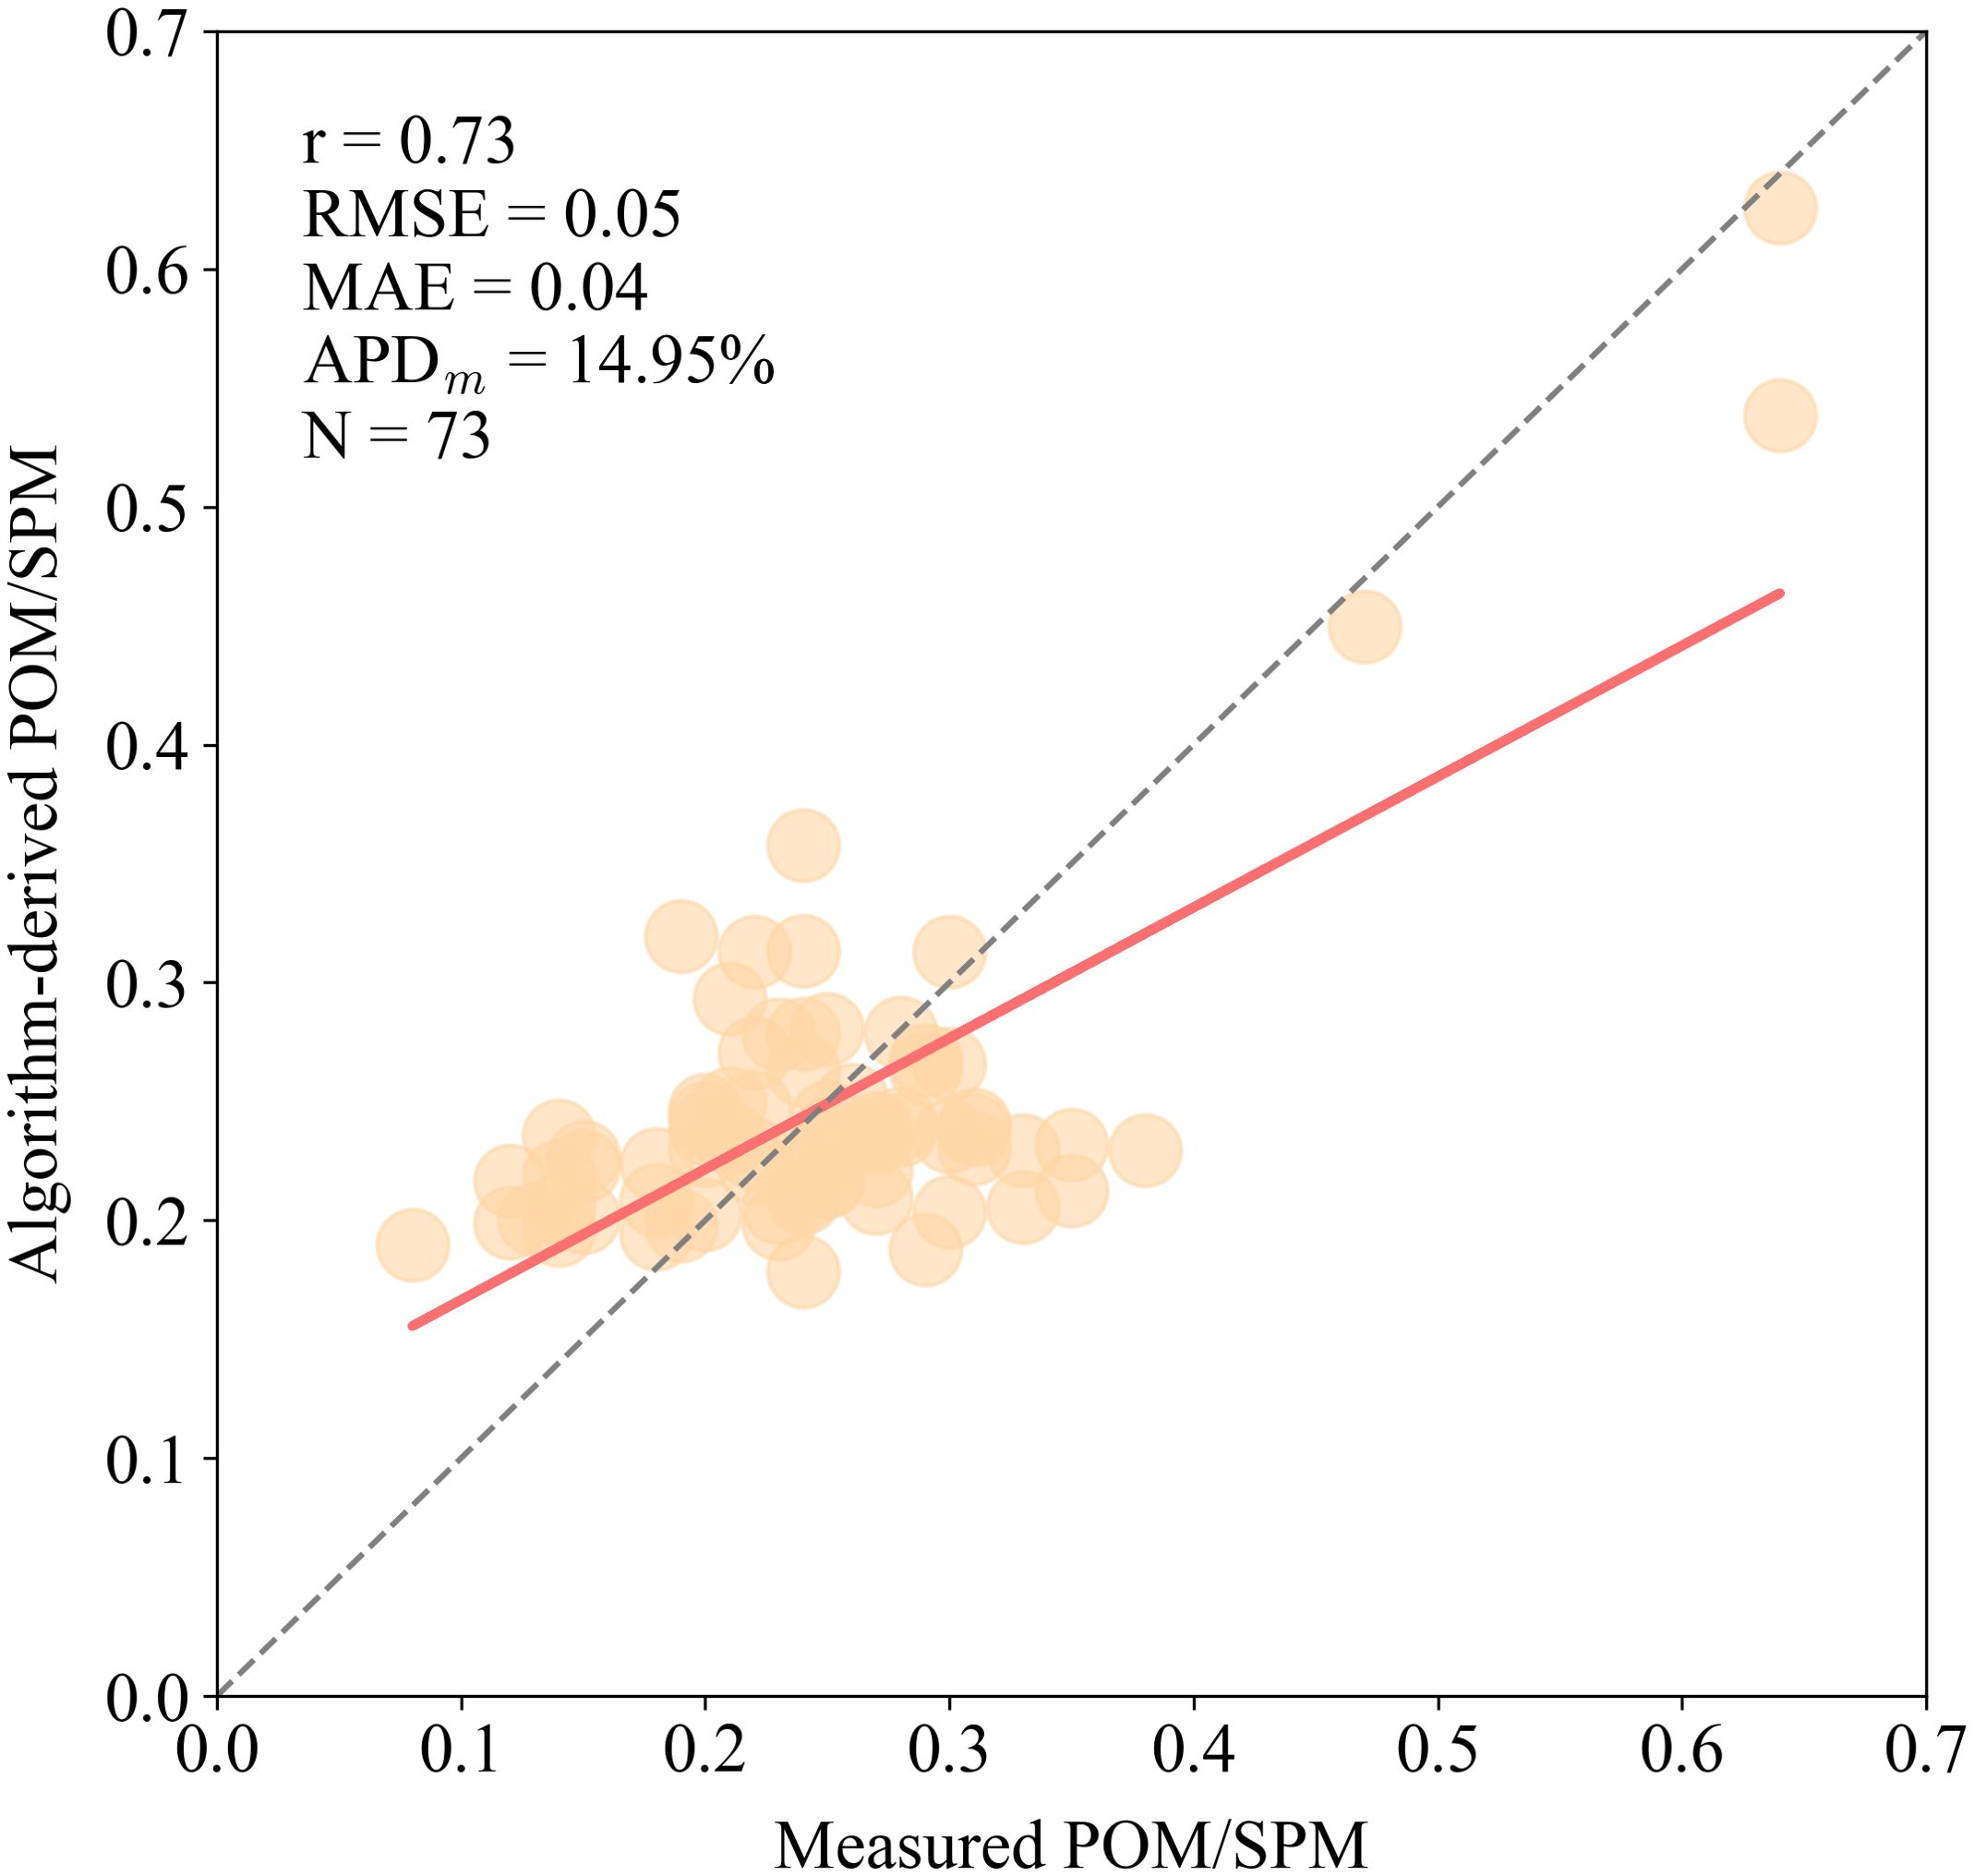
Figure 6. Scatter plot comparing the algorithm-derived POM/SPM ratio and measured POM/SPM ratio for Rrs-based POM/SPM estimation algorithm expressed in Formula 10. The black line represents the 1:1 line, and the red line represents the corresponding linear regression line.
where RB = log[Rrs(490)], RG = log[Rrs(560)], RR = log[Rrs(665)], and N = 73.
The statistical parameters indicate that the algorithm we developed provides a good estimate of POM/SPM with r of 0.73 and RMSE, MAE and APDm are 0.05, 0.04, 14.95%, respectively.
3.3 Particle composition-specific Chl-a estimation algorithms
A variety of Rrs band combinations were tested and evaluated to identify the optimal candidate algorithm, and the best-fit regression functions for both water types were chosen to estimate the Chl-a concentration. For each water type, the algorithms were applied to the in situ samples, and the results are shown in Figure 7. It can be seen that the organic-dominant water type covers a broader range in Chl-a (0.25 to 50.85 mg m-3) than the inorganic-dominant water type (0.66 to 7.13 mg m-3), and both algorithms produce a good fit for Chl-a prediction with r of 0.99 and 0.86, respectively; the organic-dominant water type estimation algorithm is almost distributed along the 1:1 line, with a slope of 0.99. The Formulas for the organic-dominant and inorganic-dominant water type Chl-a estimation algorithms are as follows:
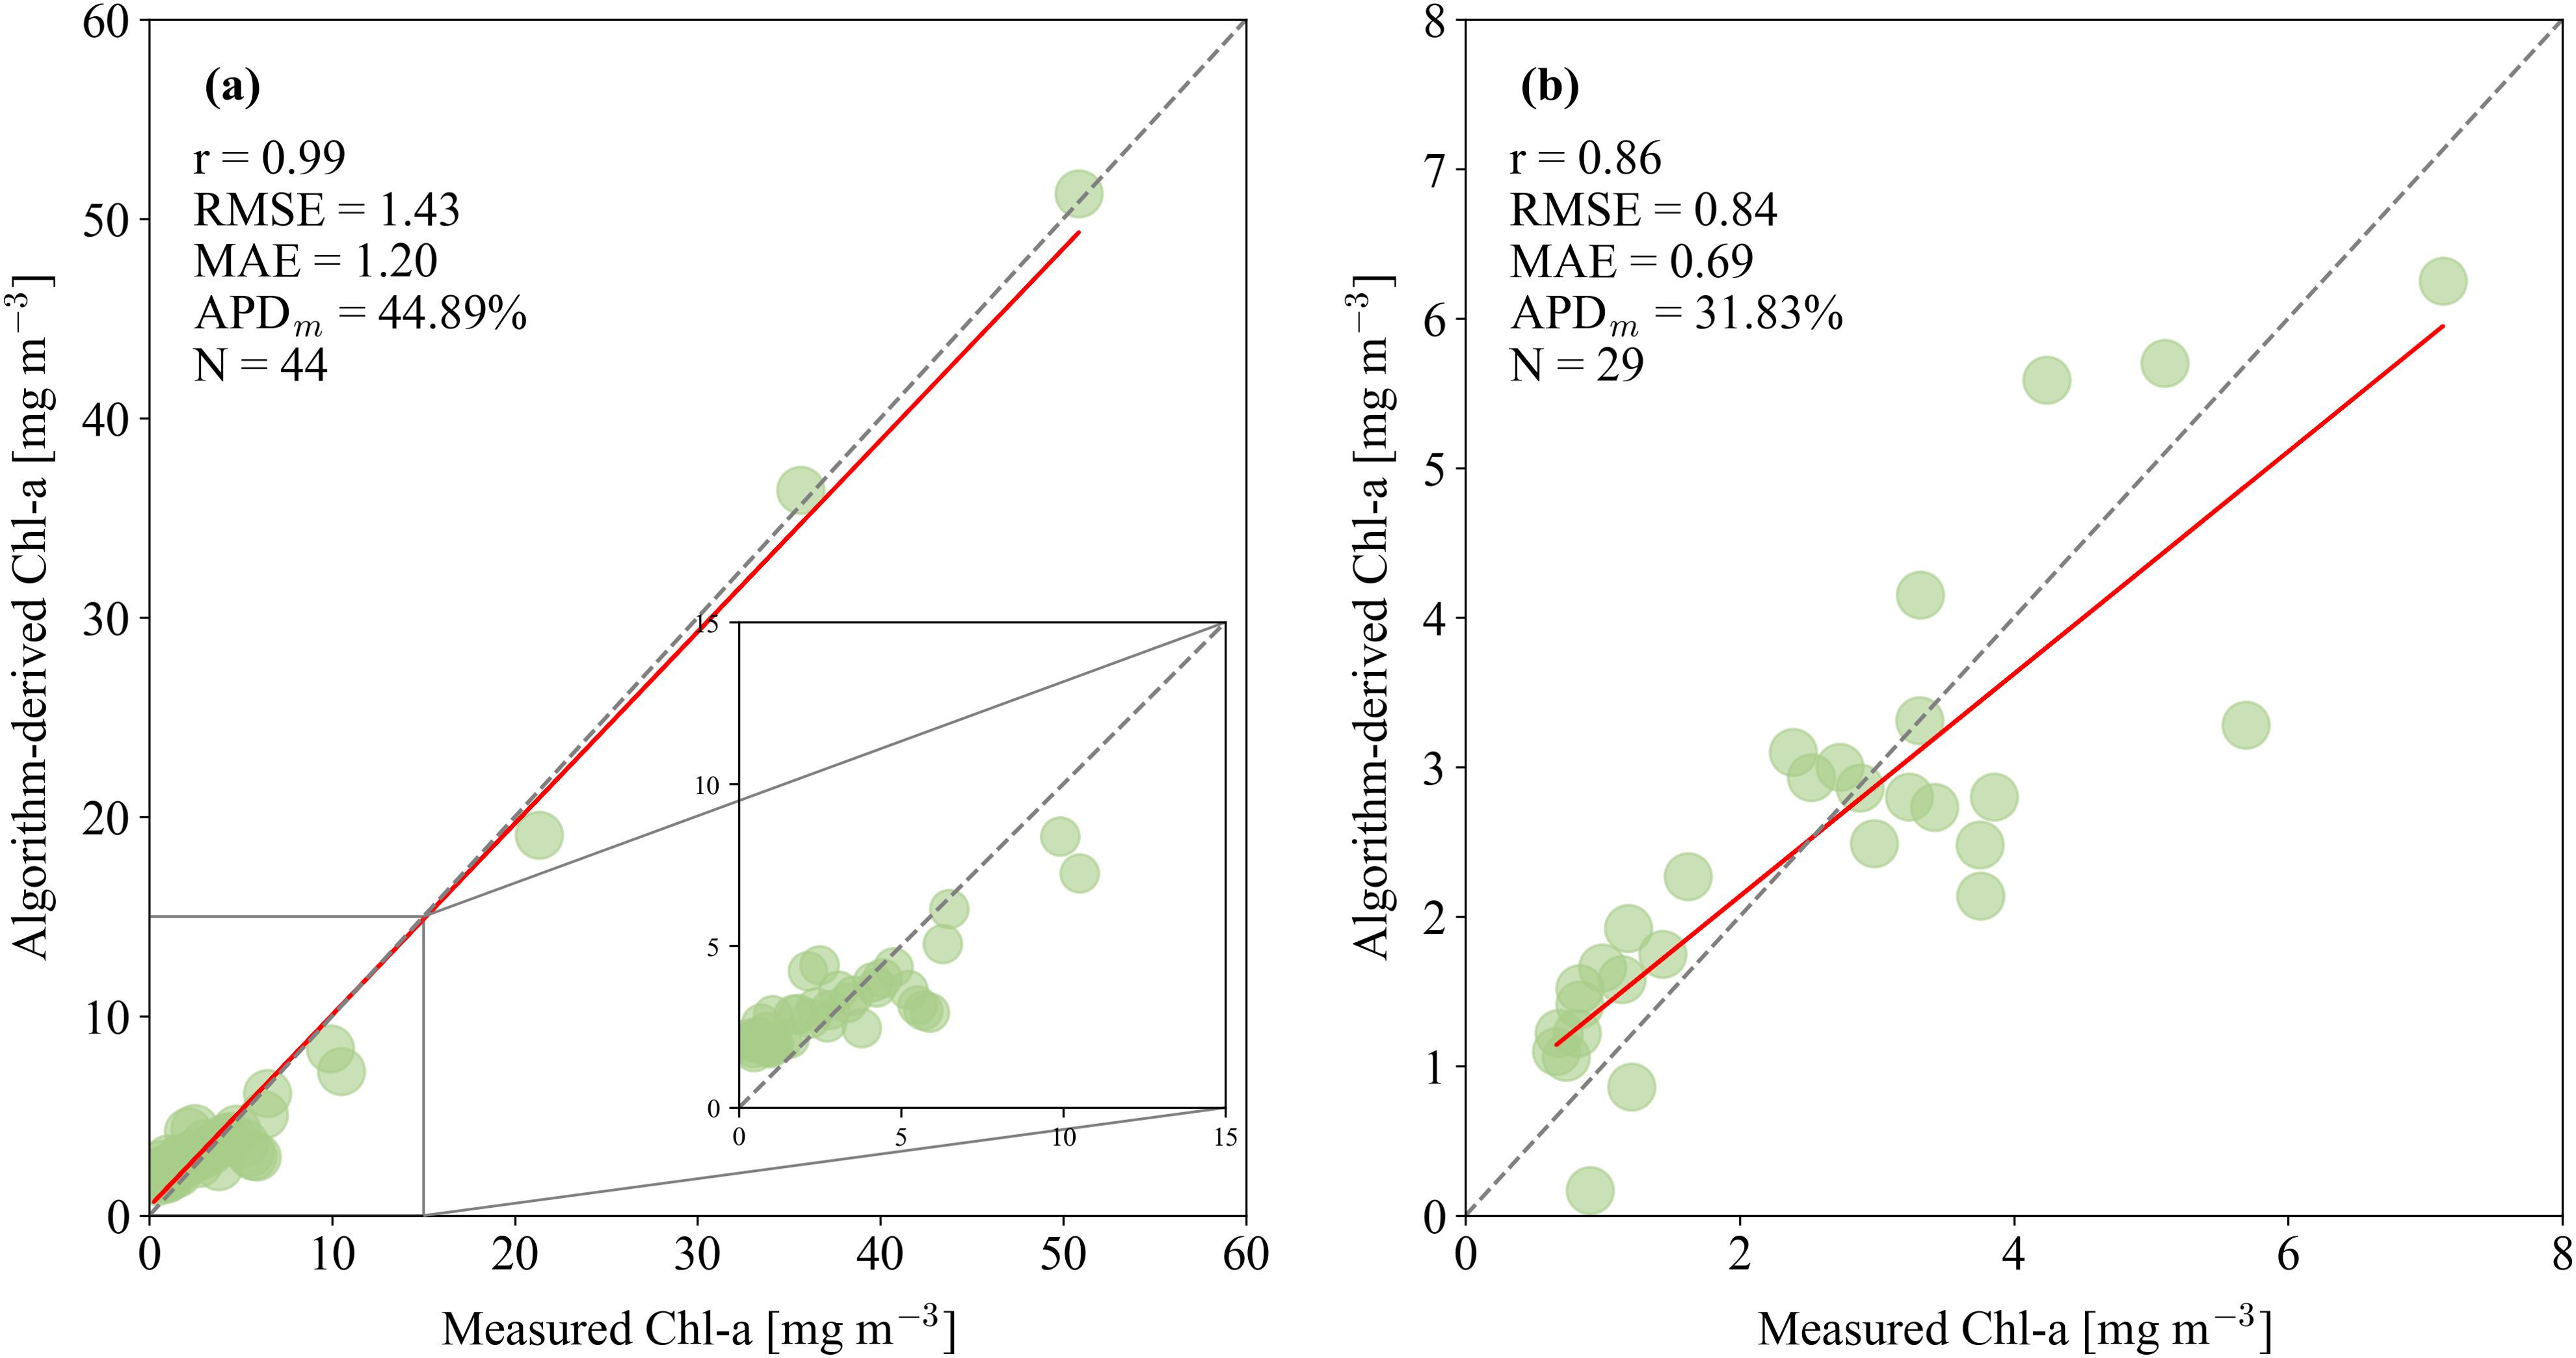
Figure 7. Scatter plots comparing the algorithm-derived Chl-a with a measured Chl-a for each water type: (A) the organic-dominant water type, (B) the inorganic-dominant water type. The black line represents the 1:1 line, and the red line represents the corresponding linear regression line.
where Ra = log[Rrs(665)/Rrs(681)], Rb = log[Rrs(673)/Rrs(681)], and Rc = log[(Rrs(708)–Rrs(754))/(Rrs(655)–Rrs(754))].
4 Discussion
4.1 Accuracy of particle composition-specific Chl-a estimation algorithms
The performance of the particle composition-specific Chl-a estimation algorithms was examined. For comparison, the OC4Me algorithm was applied, and the parameters were adjusted based on data without employing water classification from the present study. The two algorithms both exhibit high estimation accuracy with r values higher than 0.9 indicating a strong correlation between measured Chl-a concentration and derived Chl-a concentration. Other statistics (RMSE, MAE, APDm) of particle composition-specific Chl-a estimation algorithms are also better than the adjusted OC4Me algorithm (Table 3). Moreover, an underestimation of the adjusted OC4Me algorithm can be observed for the in situ values less than 15 mg m-3 (Figure 8).
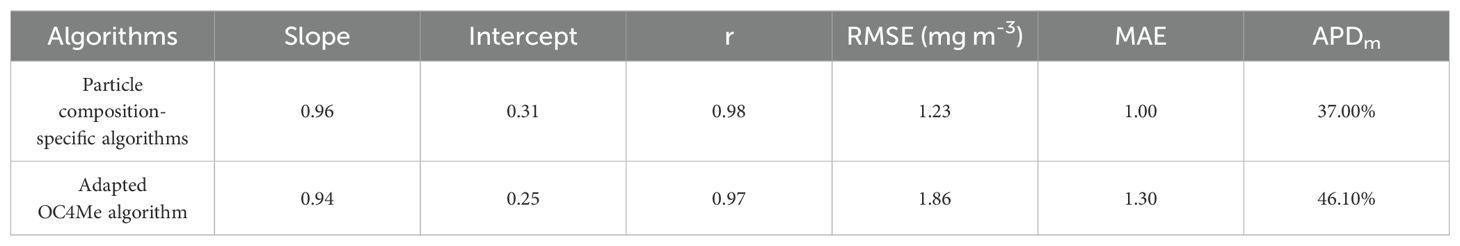
Table 3. Accuracy verification statistics of different algorithms.
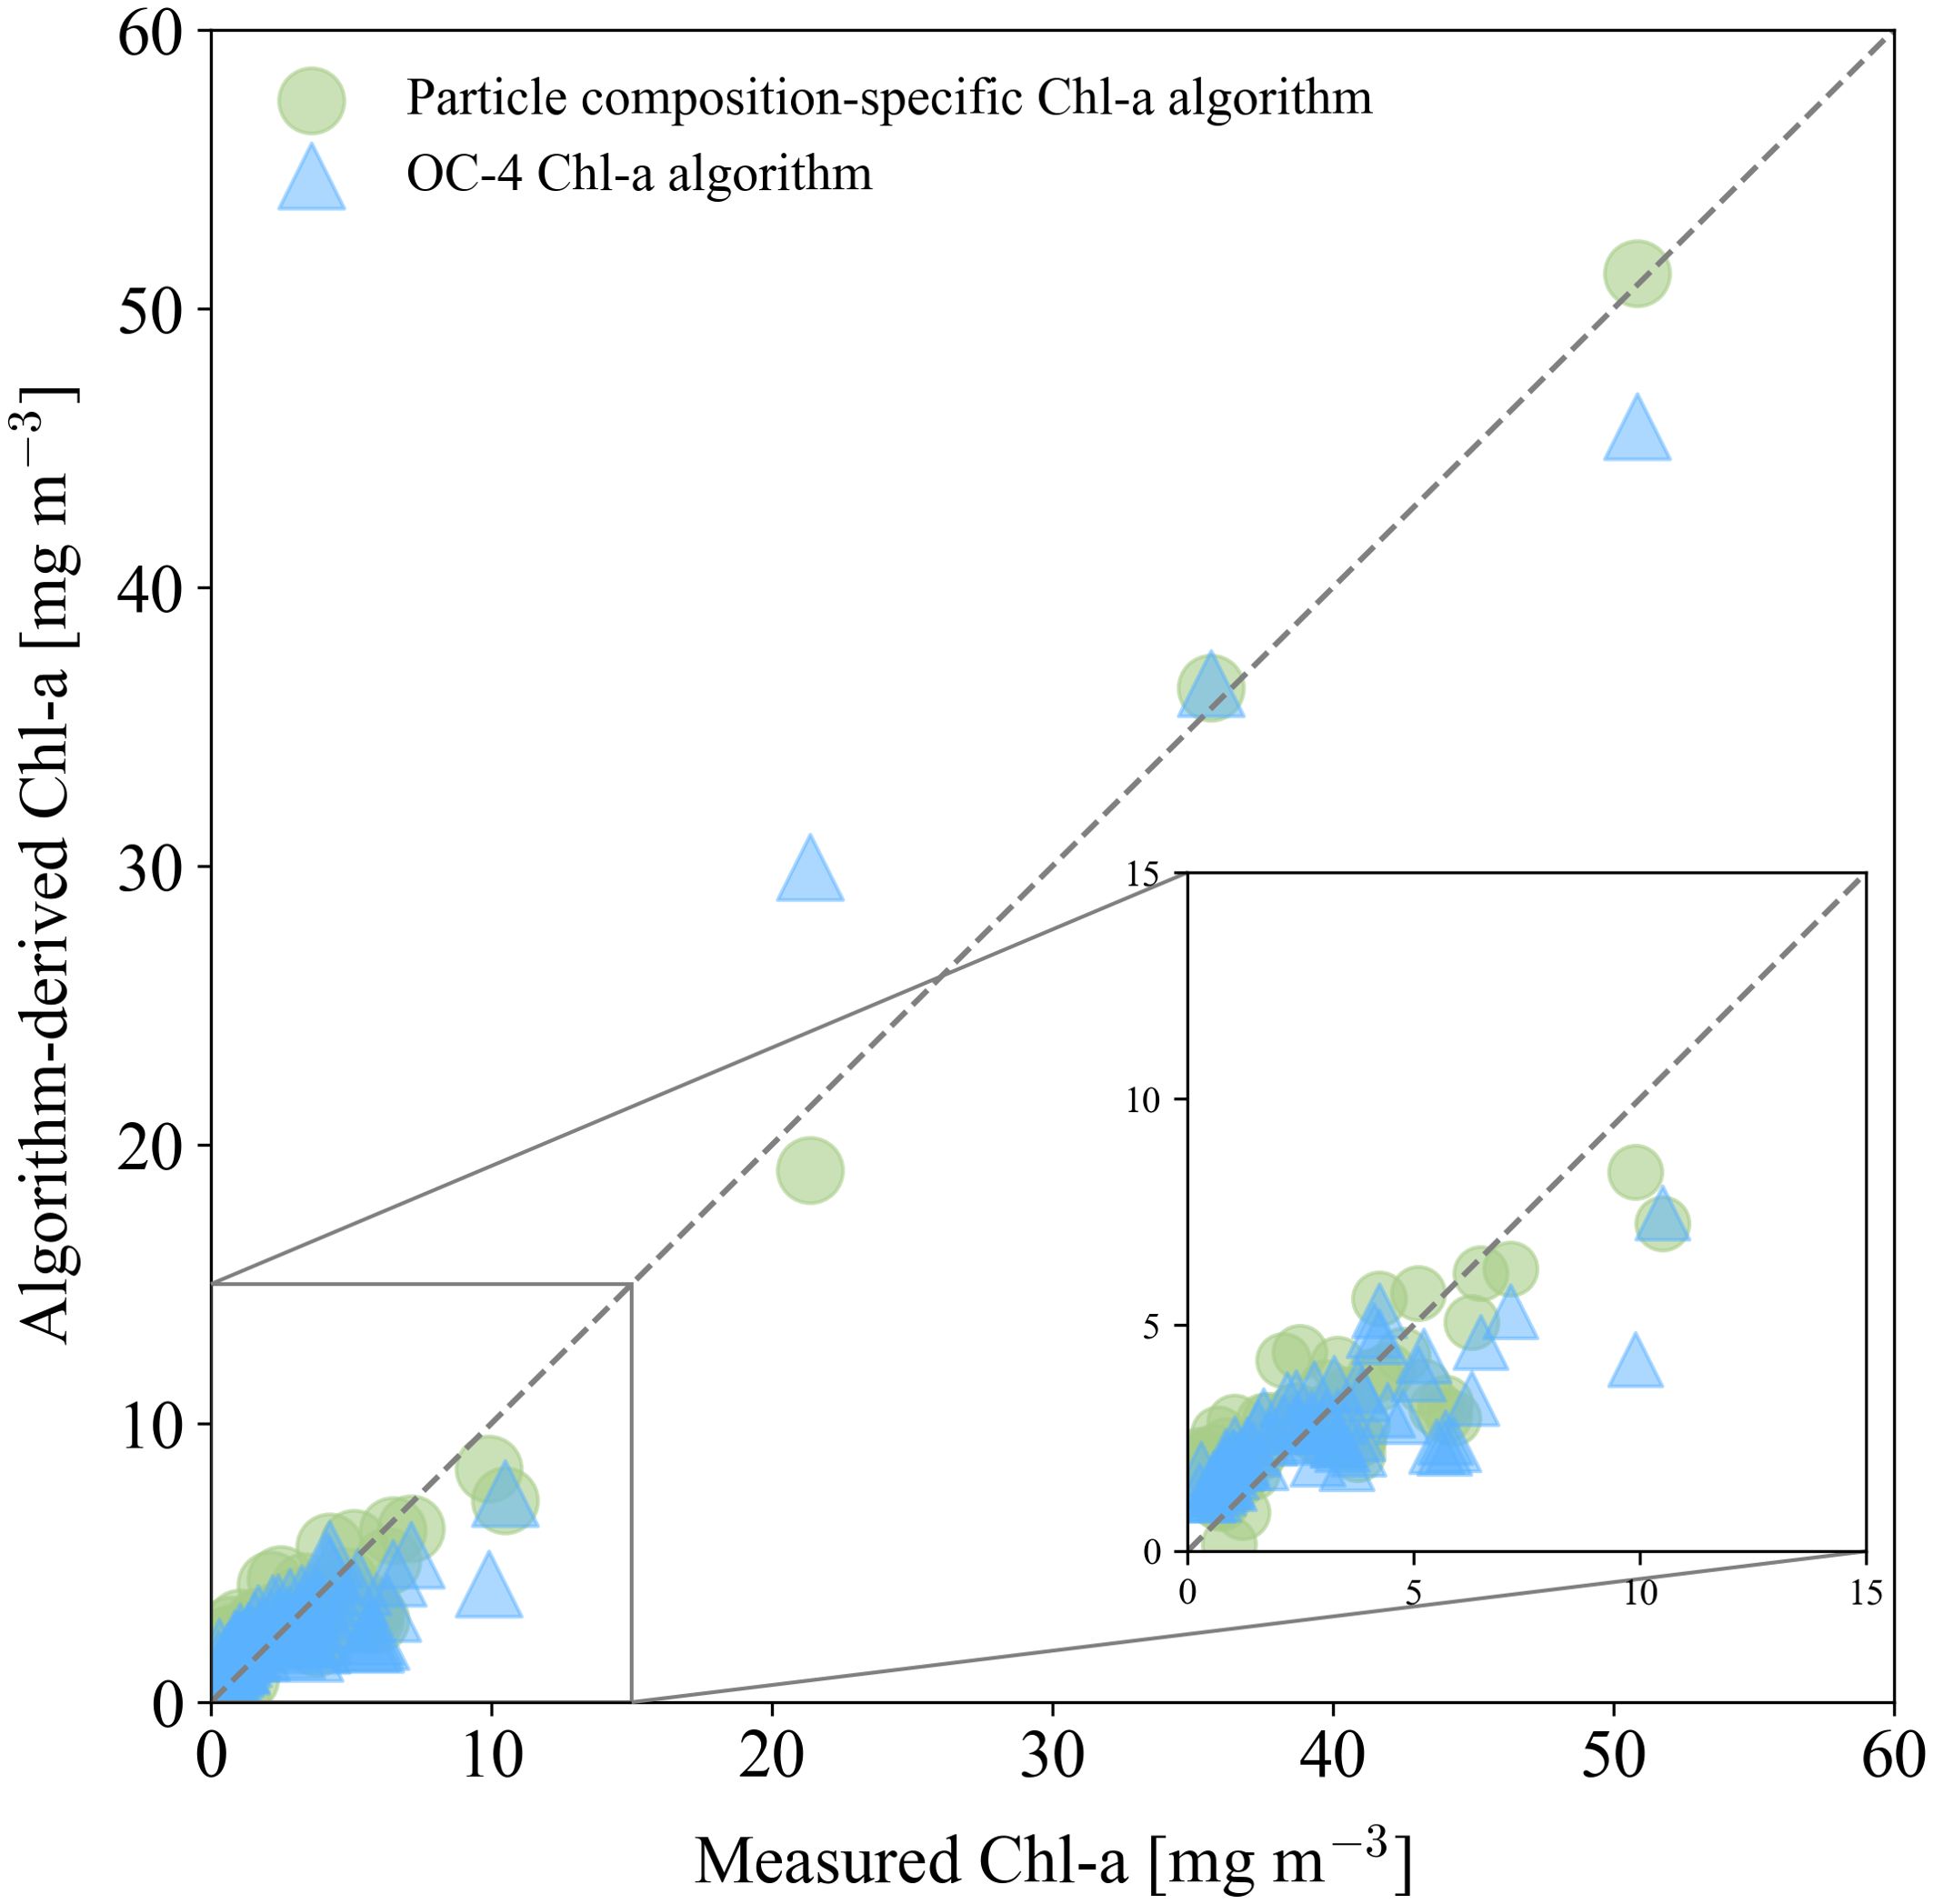
Figure 8. Scatter plot of the derived and measured Chl-a data using the Particle composition-specific estimation algorithms and adjusted OC4Me algorithm.
4.2 Evaluation of particle composition-specific Chl-a estimation algorithms for OLCI images
An independent database was used to validate the accuracy of the algorithms when applied to actual OLCI images (N = 27, satellite synchronization data). After the OLCI data pre-processing and match-up procedure, 27 match-ups were obtained, and in situ samples were collected on September 17, 2018 (Figure 9). The Chl-a concentration of these match-ups in Validation Dataset ranged from 0.38 to 17.91 mg m-3 with a average value of 3.63 mg m-3.
Figure 9. (A) Chl-a derived from the Particle composition-specific estimation algorithms; (B) Relative percentage difference between (A) and OLCI Chl_OC4Me product; (C) Dominant water type based on the backscattering-POM/SPM classification algorithms. These results were obtained from OLCI image associated with the match-ups dataset.
Figure 9 shows the application of Chl-a derived from particle composition-specific Chl-a estimation algorithms (Figure 9A and POM/SPM derived from Rrs-based POM/SPM estimation algorithms (Figure 9C in the northeast part of the Bohai Sea associated with the match-up dataset. Elevated Chl-a concentrations are generally associated with relatively high POM/SPM, indicating a significant or dominant contribution of organic particles to SPM.
For comparison, Figure 9 shows the relative difference in the percentage of Chl-a derived from the particle composition-specific Chl-a estimation algorithms and the OLCI Chl_OC4Me product (Figure 9B. The largest differences were generally observed in the region of dominant organic particles, and the Chl_OC4Me product was underestimated compared with the Chl-a derived from the particle composition-specific Chl-a estimation algorithms. The statistical parameters of the Chl-a algorithms and match-ups are summarized in Table 4, which shows that the algorithm developed in this study has a more accurate prediction of Chl-a values with lower RMSE, MAPE, MAE, and APDm.
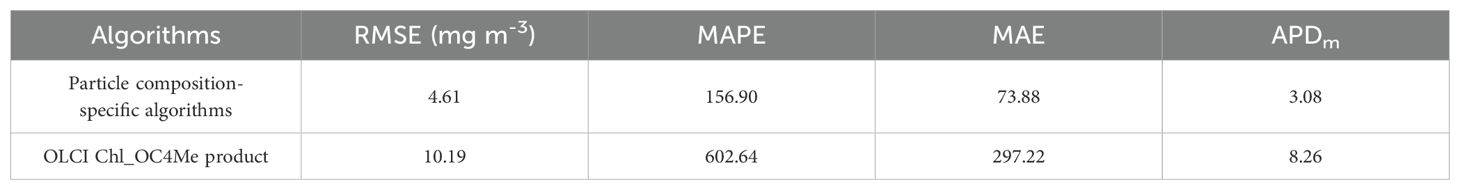
Table 4. Statistical metrics between Chl-a concentrations in the Bohai Sea match-up dataset and algorithm retrievals applied to OLCI data by backscattering-particle composition classification-based algorithm and the OLCI standard OC4Me algorithm.
4.3 Demonstration of application to satellite observations
Figures 10 and 11 show the monthly variations in Chl-a concentration and POM/SPM on the coast of Qinhuangdao, Bohai Sea. High Chl-a concentration in winter was the most significant seasonal difference; however, the POM/SPM did not change accordingly. This disparity may be influenced by the complex interplay among various factors, including nutrient availability, temperature, sunlight exposure, and ocean currents (Behrenfeld, 2010; Boss and Behrenfeld, 2010; Ma et al., 2021; Hampton et al., 2022). In particular, the coastal area of Qinhuangdao, an ice-free harbor located by the northern part of mainland China, is notably affected by the Yellow Sea warm current, which strengthens in winter and diminishes in summer (Mask et al., 1998). In addition, it can be note that the maps of Chl-a concentration in summer exhibit significant image noise, while the POM/SPM images show no obvious noise. It could be observed that, unlike the POM/SPM inversion formula, the Chl-a inversion formulas use near-infrared (NIR) bands (708 nm and 754 nm) to develop the algorithms. However, in optically complex Class II water bodies, the accuracy of the NIR bands is relatively low due to the limitations of current atmospheric correction algorithms (Li et al., 2022). Moreover, the BAC algorithm applied to process OLCI Level 2 products combines the Gw94 (Gordon and Wang, 1994b) and the BPAC (Moore et al., 1999) models, switching between the two depending on the turbidity flag. In the study area, seasonal factors, including terrestrial runoff that introduces abundant nutrients and favorable temperature conditions, promote rapid phytoplankton growth in coastal waters, leading to significant changes in water quality. This may be attributed to the use of different models of BAC algorithm in adjacent pixels, leading to significant noise in the NIR bands of the image.
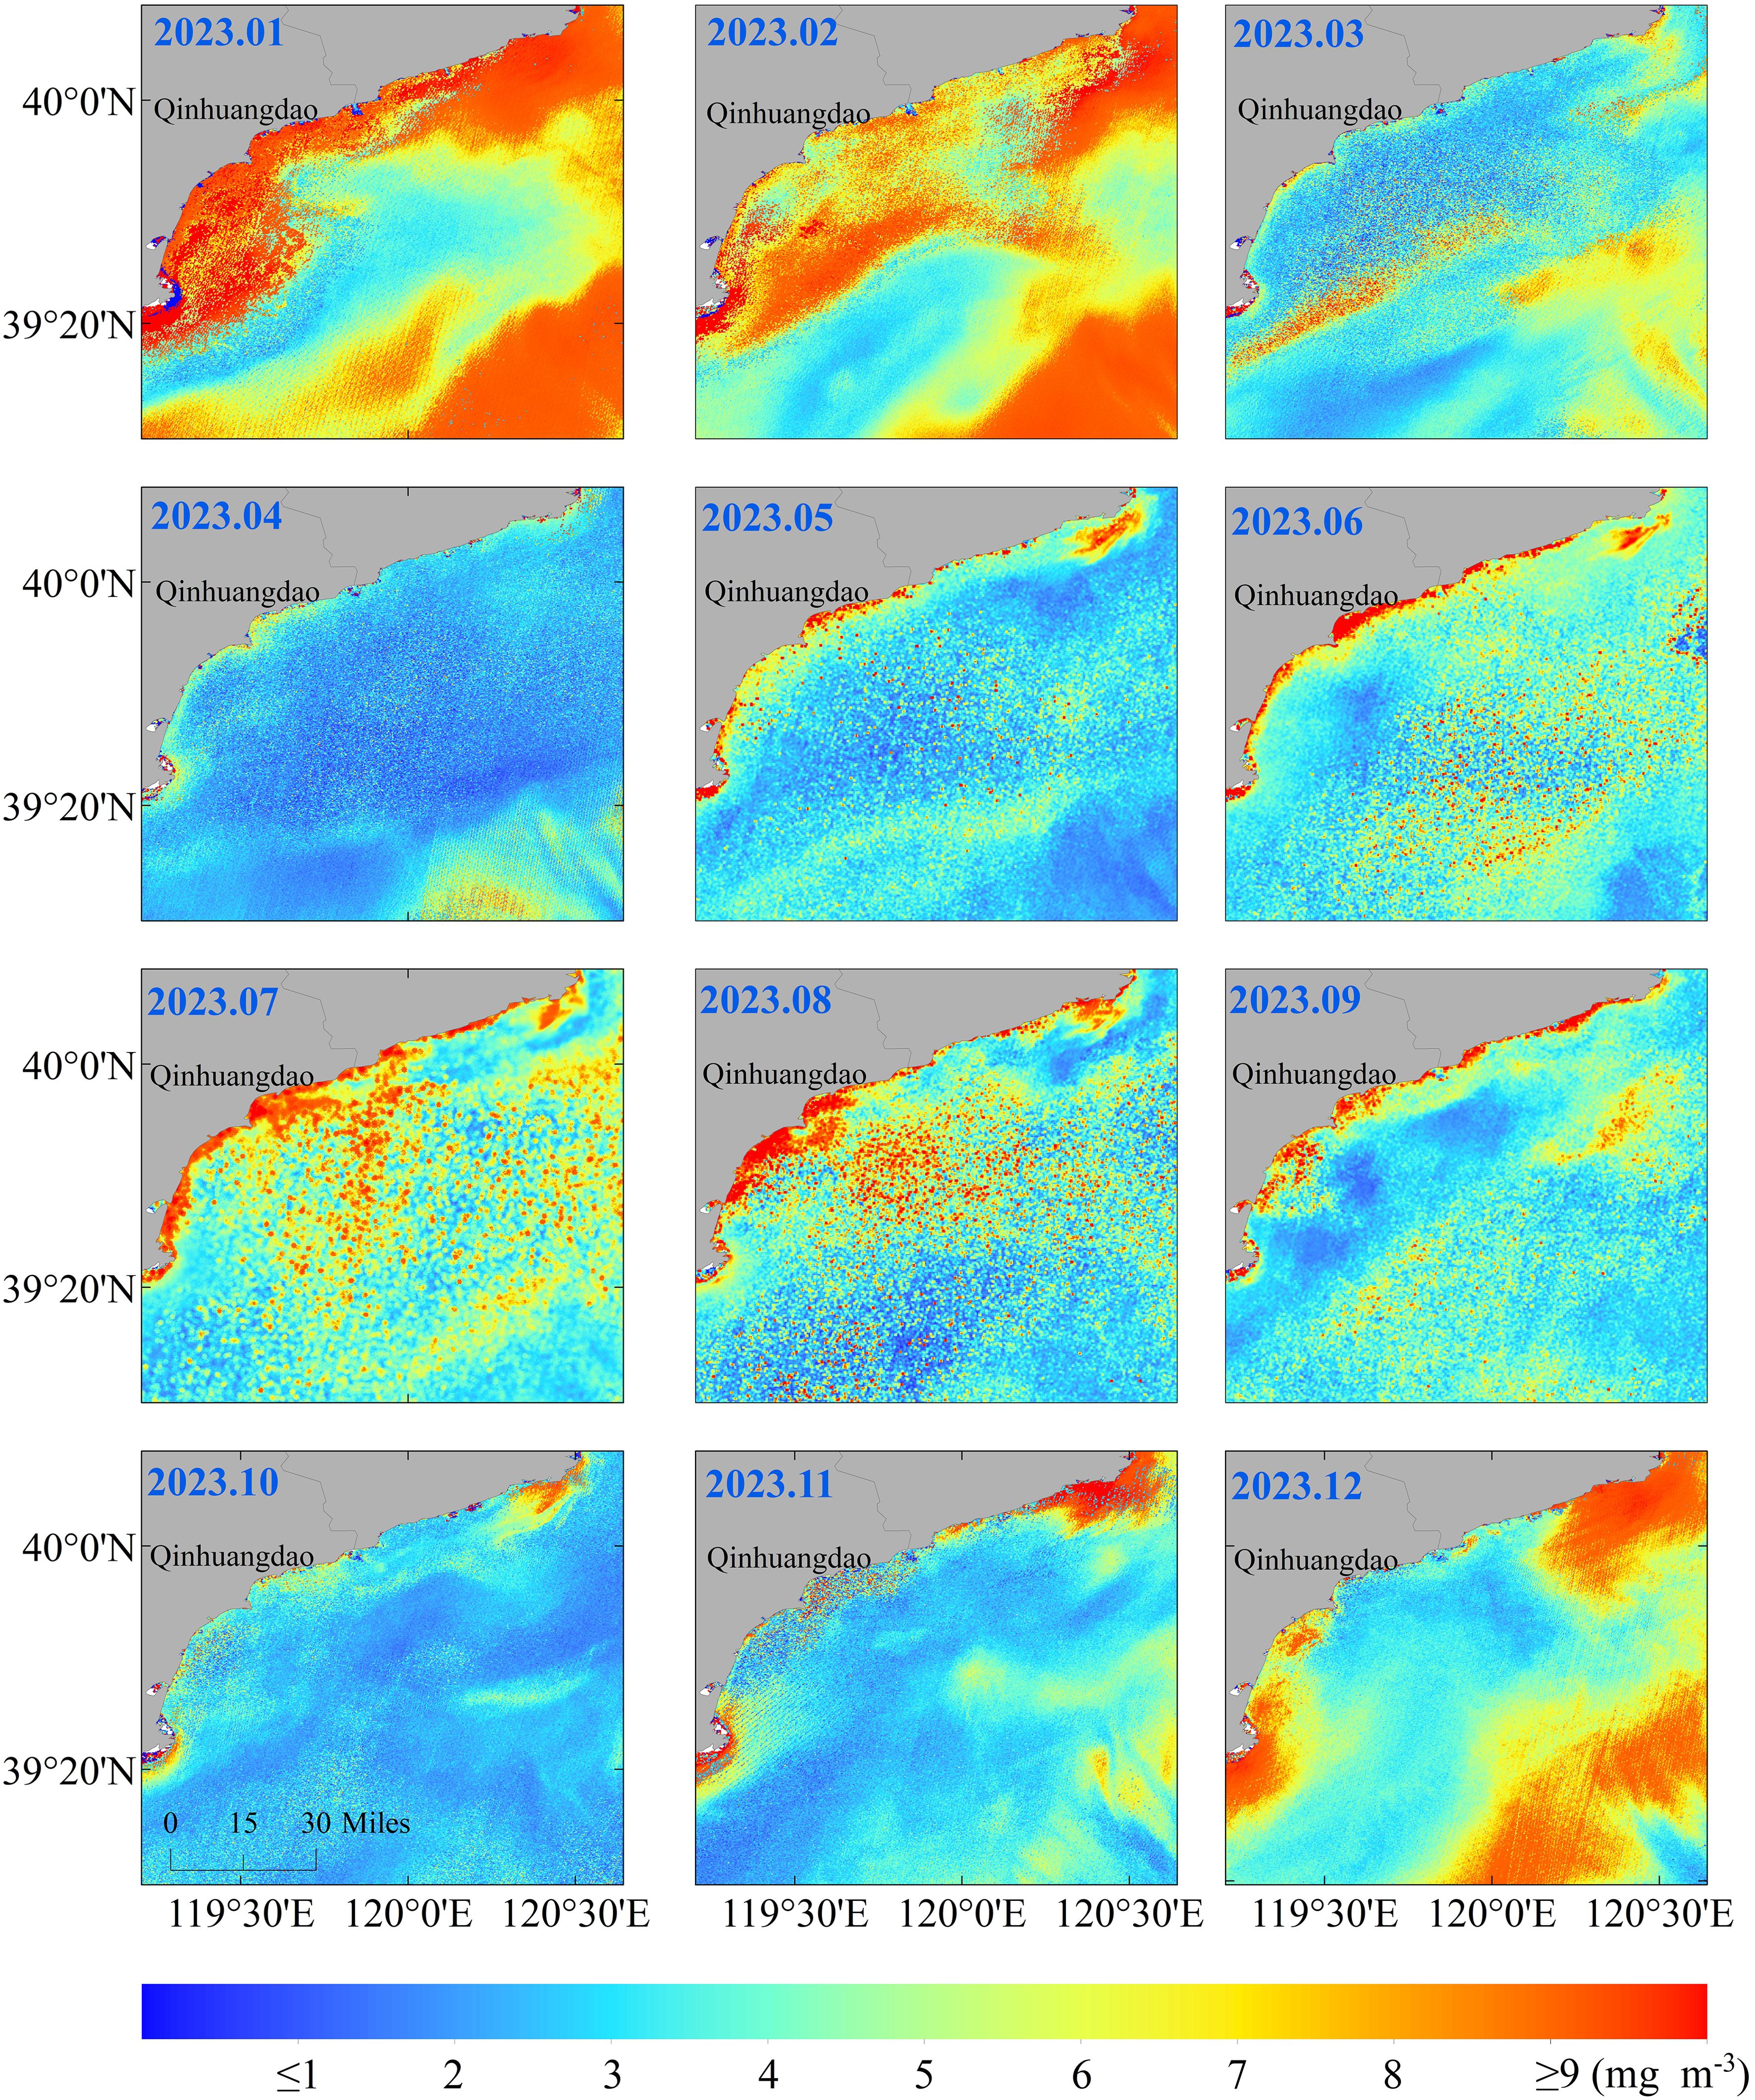
Figure 10. Distribution of monthly averaged Chl-a concentration in the coastal of Qinhuangdao, Bohai Sea in 2023.
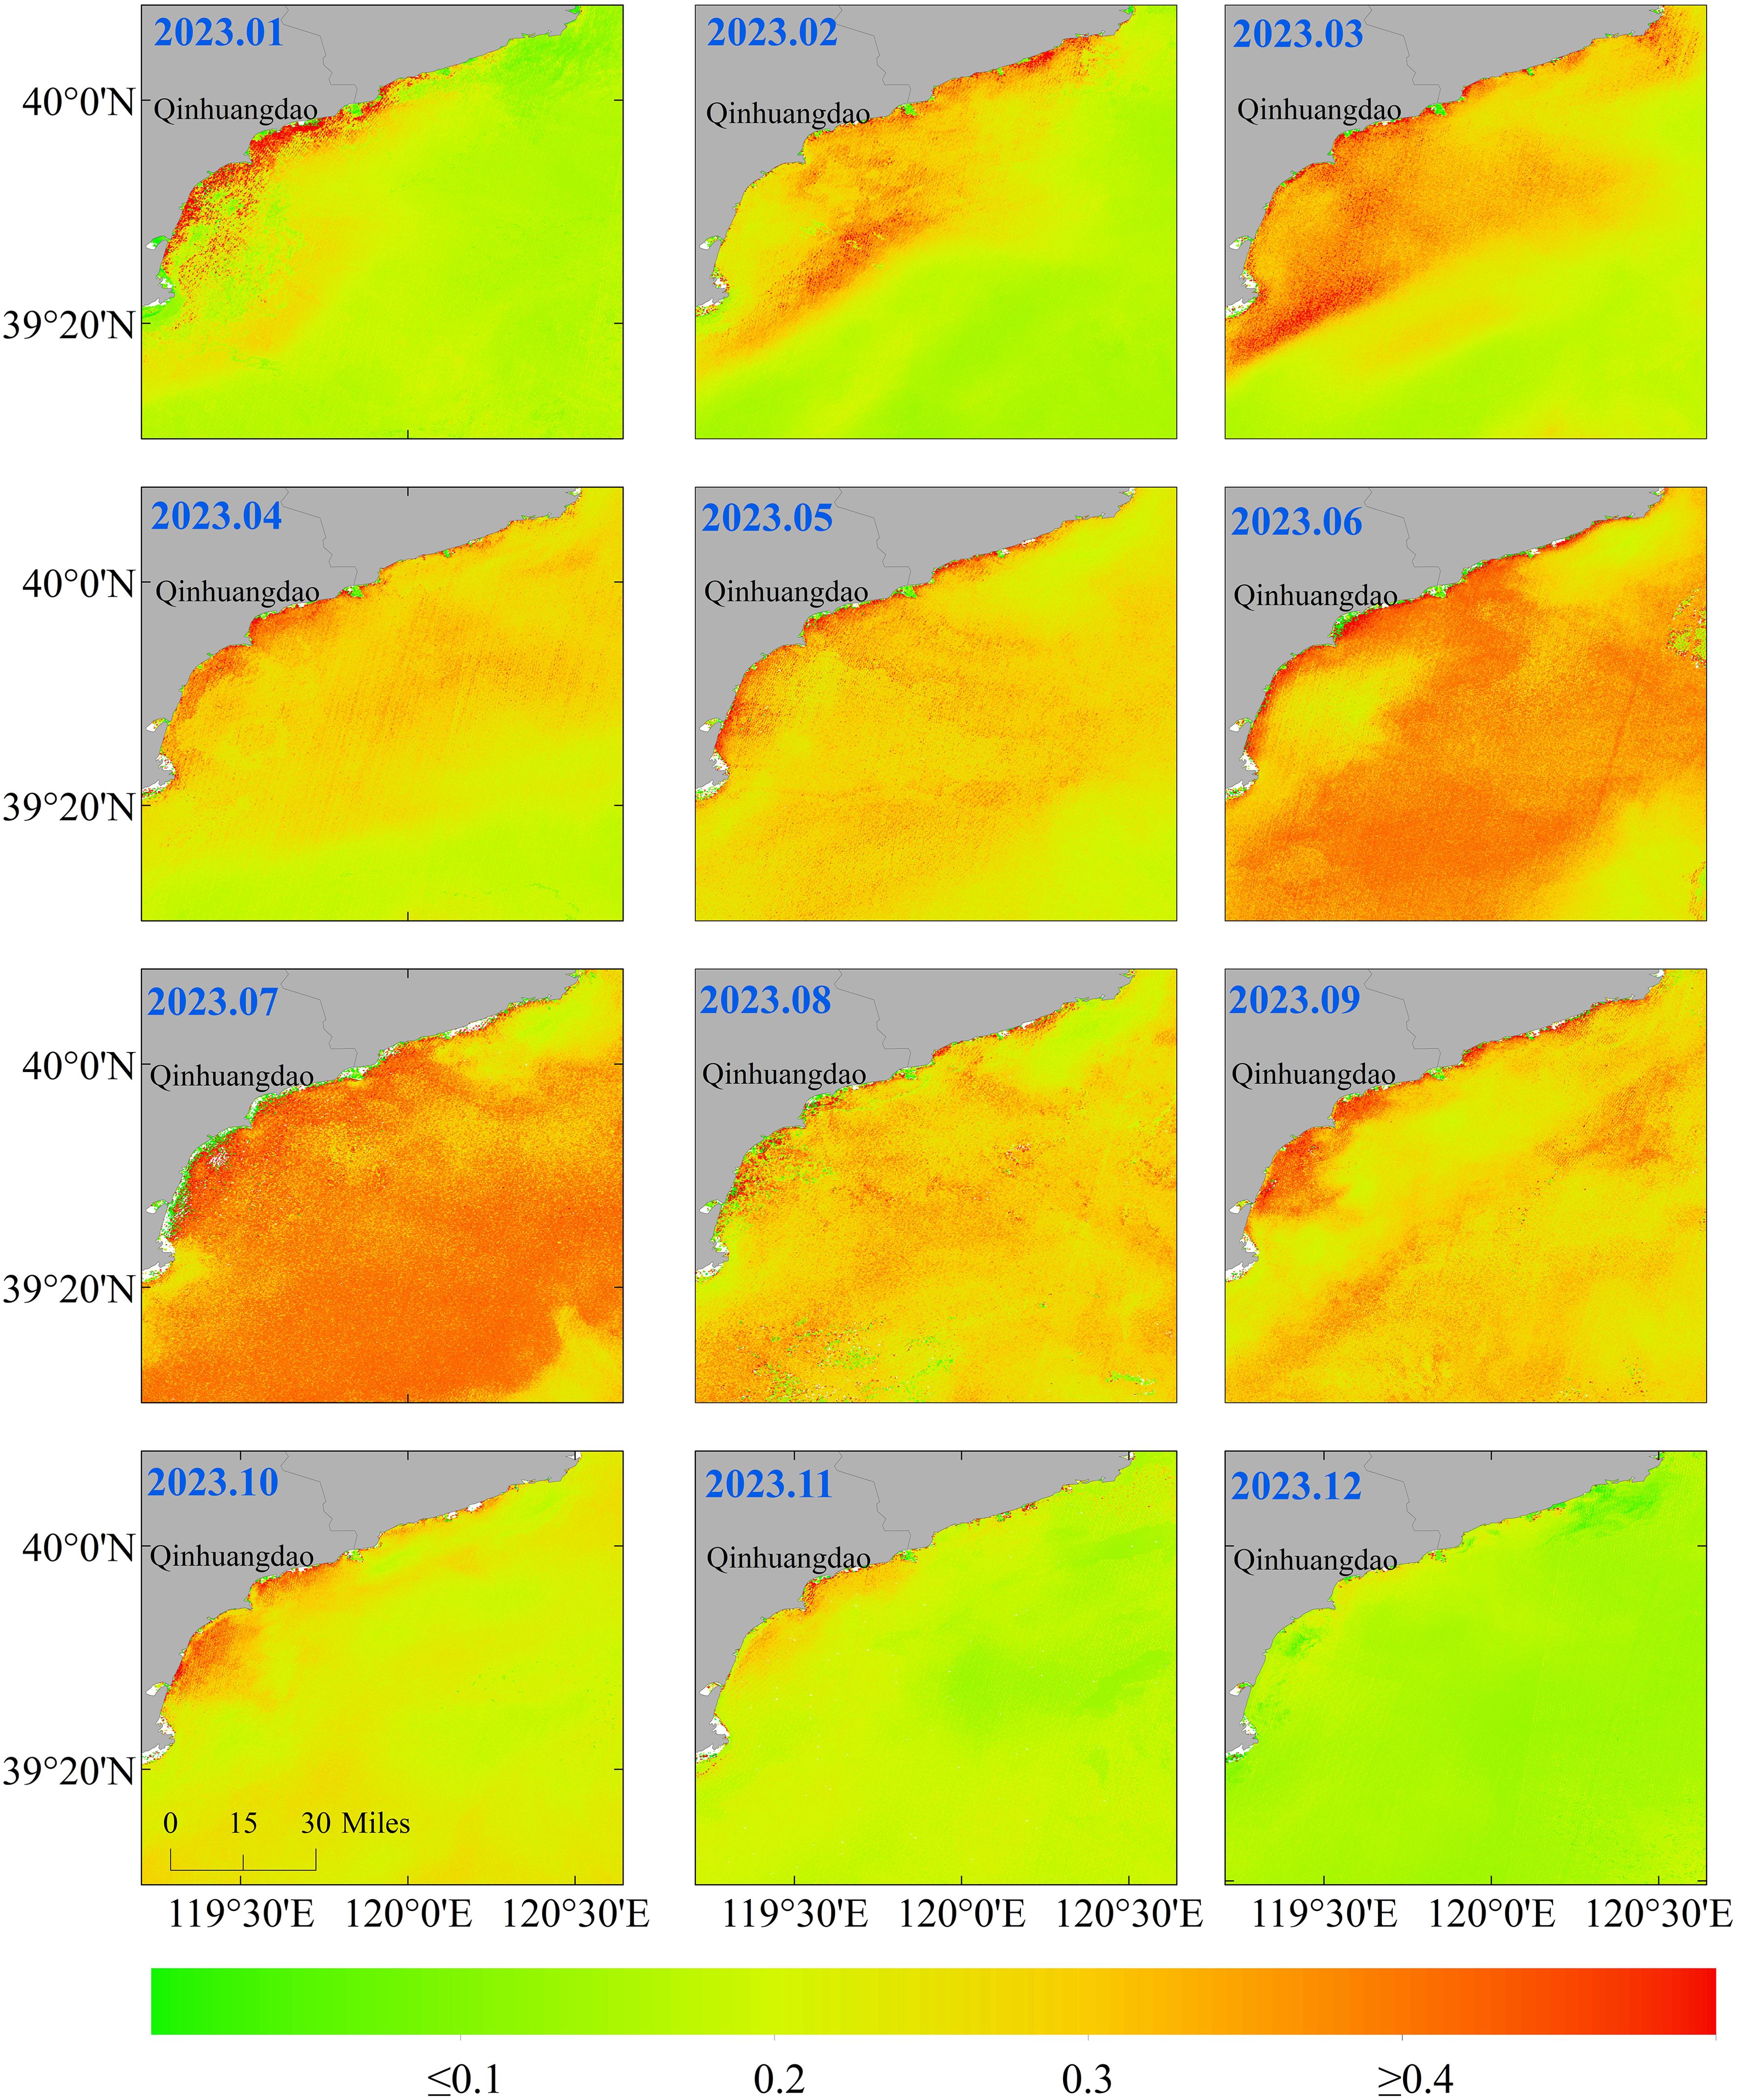
Figure 11. Distribution of monthly averaged POM/SPM ratio in the coastal of Qinhuangdao, Bohai Sea in 2023.
Figure12 provides a clearer representation of the Chl-a concentration and the monthly average fluctuations in POM/SPM. From April to October, the Chl-a concentration increased as POM/SPM increased, or decreased as POM/SPM decreased. However, from November to March, the trend was reversed, and the Chl-a concentration increased as the POM/SPM ratio decreased or decreased as the POM/SPM ratio increased. Additionally, similar changes in the monthly average Chl-a concentration variation in the Bohai Sea were shown by Xia et al. (Xia et al., 2021). and Zhang Kunlong (Zhang et al., 2023).
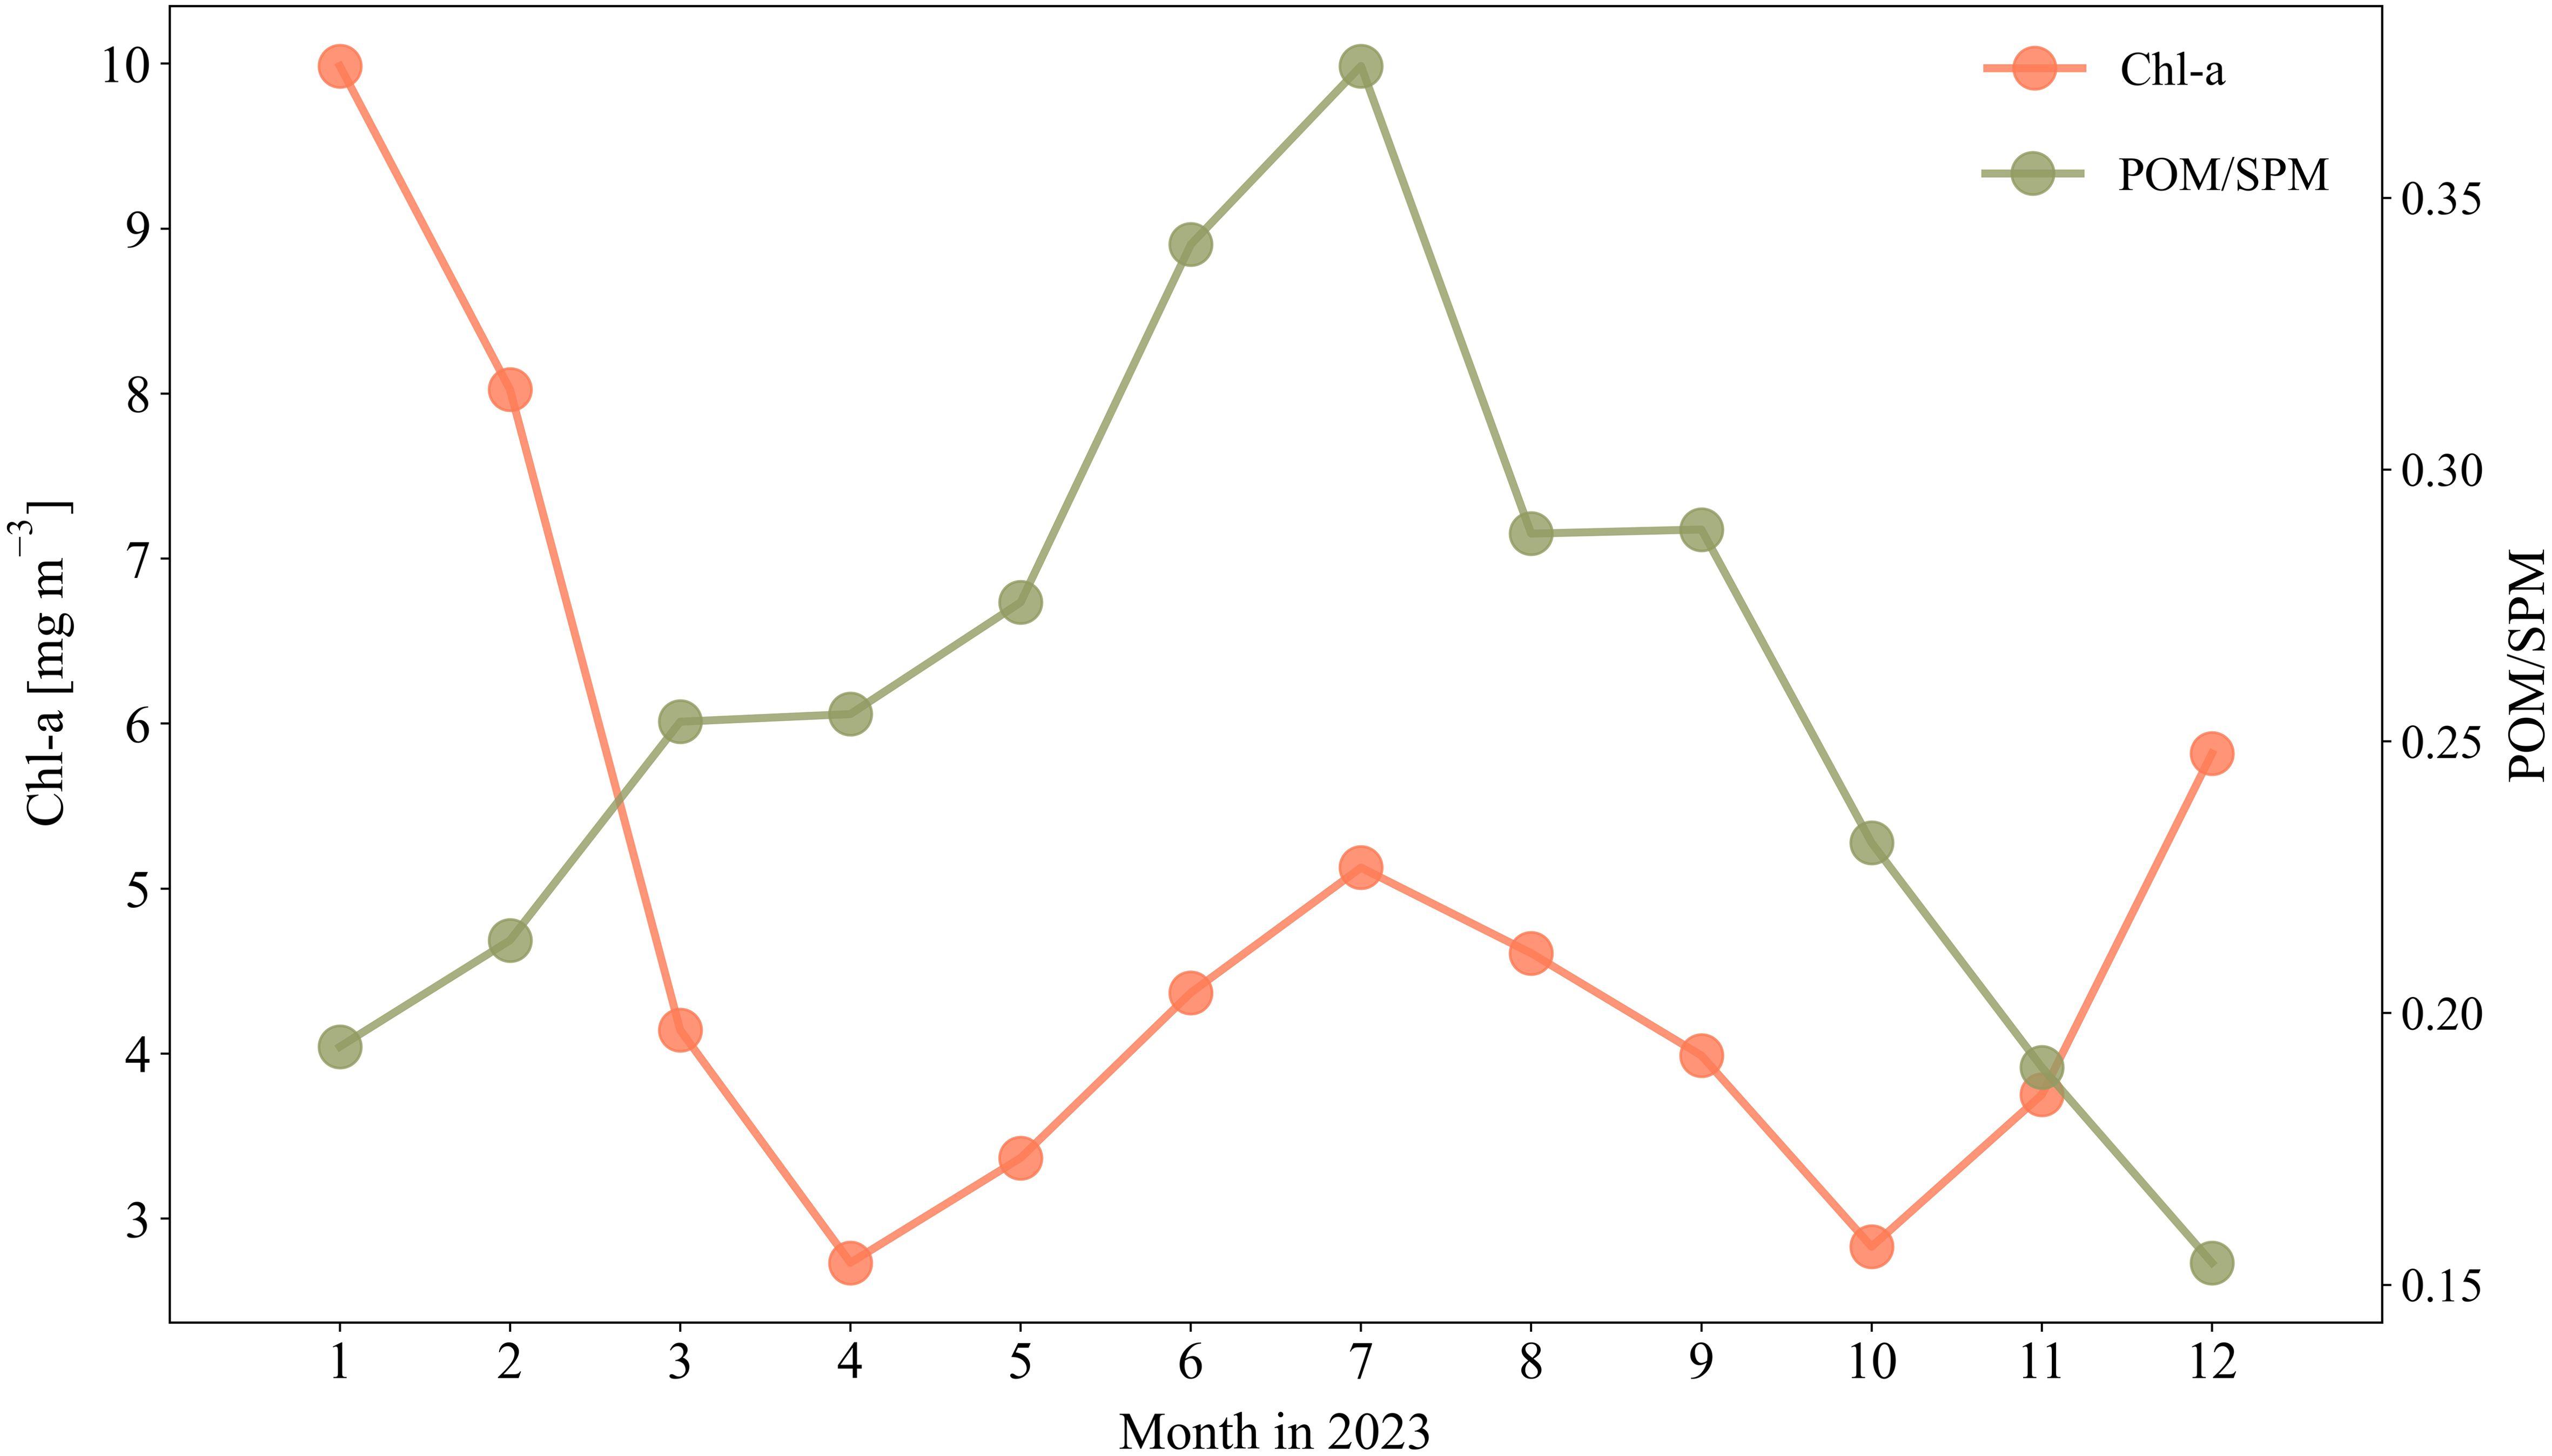
Figure 12. Monthly averaged Chl-a concentration and POM/SPM ratio in the coastal of Qinhuangdao, Bohai Sea in 2023.
5 Conclusion
The intricate and variable nature of seawater constituents in coastal waters presents significant challenges in establishing single algorithmic approaches for estimating Chl-a and other biogeochemically essential constituents based on optical observations across diverse aquatic environments. To address these challenges, we present a water optical classification method for estimating Chl-a that considers the variability in the composition of suspended particulate matter. The POM/SPM ratio was used as an indicator of particle composition to distinguish the optically differentiated water bodies with different proportions of organic and inorganic particles. Using field data from the coastal waters of Qinhuangdao (Bohai Sea) that exhibit a broad range of water composition and optical properties, we developed empirical algorithms to estimate POM/SPM and Chl-a from the spectral remote-sensing reflectance of the ocean, Rrs(λ). The analysis showed significant improvements in Chl-a estimation from particle composition-specific algorithms in optically complex Qinhuangdao coastal waters compared with algorithms that do not account for variations in particle composition, especially the OC4Me Chl-a estimation algorithm used for global satellite applications. We also demonstrated an example application to satellite ocean color observations in the Qinhuangdao coastal waters. The algorithm is not limited to specific regions but is expected to be broadly applicable. Additionally, this study established the IOPs-particle composition classification algorithm using POM/SPM. Further improvements can be done by integrating additional characteristics of water components across a broader temporal and spatial scope, considering the optical variations induced by water constituents in diverse environments. In this study, the ability to estimate POM/SPM provided a mechanism-based framework for specific estimation algorithms for Chl-a. However, it’s worth noting that POM/SPM can itself be a useful product for biogeochemical research. POM serves not only as a key channels for the conversion of diverse nutrients within marine ecosystems, but also as a key interplay between dissolved organic matter (DOM) and POM in organic carbon dynamics within aquatic environments, thus influencing nutrient accessibility, pollutant bioavailability, and ecological phenomena (Stramski et al., 2004; Winogradow et al., 2019; Jo et al., 2021).
In summary, backscattering-POM/SPM classification provides a framework for optical algorithms, which exhibits improved performance in Chl-a concentration estimation for the water continuum affected by significant changes in particle composition and optical properties.
Data availability statement
The original contributions presented in the study are included in the article/supplementary material. Further inquiries can be directed to the corresponding author.
Author contributions
SG: Methodology, Writing – original draft. CZ: Writing – review & editing. LJ: Writing – review & editing. JX: Funding acquisition, Writing – review & editing.
Funding
The author(s) declare financial support was received for the research, authorship, and/or publication of this article. The National Natural Science Foundation of China 41871281.
Conflict of interest
The authors declare that the research was conducted in the absence of any commercial or financial relationships that could be construed as a potential conflict of interest.
Publisher’s note
All claims expressed in this article are solely those of the authors and do not necessarily represent those of their affiliated organizations, or those of the publisher, the editors and the reviewers. Any product that may be evaluated in this article, or claim that may be made by its manufacturer, is not guaranteed or endorsed by the publisher.
References
Aas E. (1996). Refractive index of phytoplankton derived from its metabolite composition. J. Plankton Res. 18, 2223–2249. doi: 10.1093/plankt/18.12.2223
Administration of Technology Supervision of China (1991). The specification for oceanographic survey: Marine biological survey. GB 12763.6-91. (China: Ministry of Natural Resources of China).
Administration of Technology Supervision of China (1998). The specification for marine monitoring Part 4: Seawater analysis. GB 12378.4-1998. (China: Ministry of Natural Resources of China).
Babin M., Morel A., Fournier-Sicre V., Fell F., Stramski D. (2003). Light scattering properties of marine particles in coastal and open ocean waters as related to the particle mass concentration. Limnol. Oceanogr. 48, 843. doi: 10.4319/lo.2003.48.2.0843
Baumas C., Bizic M. (2024). A focus on different types of organic particles and their significance in the open ocean carbon cycle. Prog. Oceanogr. 224, 103233. doi: 10.1016/j.pocean.2024.103233I
Behrenfeld M. J. (2010). Abandoning Sverdrup’s critical depth hypothesis on phytoplankton blooms. Ecology 91, 977–989. doi: 10.1890/09-1207.1
Binding C. E., Bowers D. G., Mitchelson-Jacob E. G. (2009). Estimating suspended sediment concentrations from ocean colour measurements in moderately turbid waters; the impact of variable particle scattering properties. Remote Sens. Environ. 94, 373–383. doi: 10.1016/j.rse.2004.11.002
Boss E., Behrenfeld M. (2010). In situ evaluation of the initiation of the North Atlantic phytoplankton bloom. Geophysical Res. Lett. 37, L18603. doi: 10.1029/2010GL044174
Boss E., Slade W., Hill P. (2009). Effect of particulate aggregation in aquatic environments on the beam attenuation and its utility as a proxy for particulate mass. Optics express 17, 9408–9420. doi: 10.1364/OE.17.009408
Boss E., Stramski D., Bergmann T., Scott Pegau W., Lewis M. (2004). Why should we measure the optical backscattering coefficient? Oceanography 17, 44. doi: 10.5670/oceanog.2004.46
Bowers D. G., Hill P. S., Braithwaite K. M. (2014). The effect of particulate organic content on the remote sensing of marine suspended sediments. Remote Sens. Environ. 144, 172–178. doi: 10.1016/j.rse.2014.01.005
Gordon H. R. (2021). Evolution of ocean color atmospheric correction: 1970–2005. Remote Sens. 13, 5051. doi: 10.3390/rs13245051
Gordon H. R., Wang M. (1994a). Influence of oceanic whitecaps on atmospheric correction of ocean-color sensors. Appl. optics 33, 7754–7763. doi: 10.1364/AO.33.007754
Gordon H. R., Wang M. (1994b). Retrieval of water-leaving radiance and aerosol optical thickness over the oceans with SeaWiFS: a preliminary algorithm. Appl. optics 33, 443–452. doi: 10.1364/AO.33.000443
Hampton S. E., Sharma S., Brousil M. R., Filazzola A. (2022). Winter and summer storms modify chlorophyll relationships with nutrients in seasonally ice-covered lakes. Ecosphere 13, e4272. doi: 10.1002/ecs2.4272
Jo N., La H. S., Kim J.-H., Kim K., Kim B. K., Kim M. J., et al. (2021). Different biochemical compositions of particulate organic matter driven by major phytoplankton communities in the northwestern Ross Sea. Front. Microbiol. 12. doi: 10.3389/fmicb.2021.623600
Lain L. R., Kravitz J., Matthews M., Bernard S. (2023). Simulated Inherent Optical Properties of Aquatic Particles using The Equivalent Algal Populations (EAP) model. Sci. Data 10, 412. doi: 10.1038/s41597-023-02310-z
Lee Z., Carder K. L., Arnone R. A. (2002). Deriving inherent optical properties from water color: a multiband quasi-analytical algorithm for optically deep waters. Appl. optics 41, 5755–5772. doi: 10.1364/AO.41.005755
Lee Z., Carder K., Steward R., Peacock T., Davis C., Mueller J. (1996). Protocols for measurement of remote-sensing reflectance from clear to turbid waters (Halifax: SeaWiFS Workshop).
Li Q., Jiang L., Chen Y., Wang L., Wang L. (2022). Evaluation of seven atmospheric correction algorithms for OLCI images over the coastal waters of Qinhuangdao in Bohai Sea. Regional Stud. Mar. Sci. 56, 102711. doi: 10.1016/j.rsma.2022.102711
Loisel H., Duforêt-Gaurier L., Tran T. K., Schaffer Ferreira Jorge D., Steinmetz F., Mangin A., et al. (2023). “Characterization of the organic vs. inorganic fraction of suspended particulate matter in coastal waters based on ocean color radiometry remote sensing,” in 7th edition of the Copernicus Ocean State Report (OSR7), (Germany: Copernicus Publications) vol. 1-osr7, 11. doi: 10.5194/sp-1-osr7-11-2023
Lubac B., Loisel H. (2007). Variability and classification of remote sensing reflectance spectra in the eastern English Channel and southern North Sea. Remote Sens. Environ. 110, 45–58. doi: 10.1016/j.rse.2007.02.012
Ma J., Liu H., Lin P., Zhan H. (2021). Effects of the seasonal variation in chlorophyll concentration on sea surface temperature in the global ocean. Acta Oceanologica Sin. 40, 50–61. doi: 10.1007/s13131-021-1765-7
Maffione R. A., Dana D. R. (1997). Instruments and methods for measuring the backward-scattering coefficient of ocean waters. Appl. Optics 36, 6057–6067. doi: 10.1364/AO.36.006057
Mask A. C., O’Brien J. J., Preller R. (1998). Wind-driven effects on the yellow sea warm current. J. Geophysical Res.: Oceans 103, 30713–30729. doi: 10.1029/1998JC900007
Mckee D., Cunningham A. (2006). Identification and characterisation of two optical water types in the Irish Sea from in situ inherent optical properties and seawater constituents. Estuar. Coast. Shelf Sci. 68, 305–316. doi: 10.1016/j.ecss.2006.02.010
McKee D., Cunningham A., Dudek A. (2007). Optical water type discrimination and tuning remote sensing band-ratio algorithms: Application to retrieval of chlorophyll and Kd (490) in the Irish and Celtic Seas. Estuarine Coast. Shelf Sci. 73, 827–834. doi: 10.1016/j.ecss.2007.03.028
Mélin F., Vantrepotte V. (2015). How optically diverse is the coastal ocean? Remote Sens. Environ. 160, 235–251. doi: 10.1016/j.rse.2015.01.023
Mobley C. D. (1999). Estimation of the remote-sensing reflectance from above-surface measurements. Appl. optics 38, 7442–7455. doi: 10.1364/AO.38.007442
Moore G., Aiken J., Lavender S. (1999). The atmospheric correction of water colour and the quantitative retrieval of suspended particulate matter in Case II waters: application to MERIS. Int. J. Remote Sens. 20, 1713–1733. doi: 10.1080/014311699212434
Morel A., Huot Y., Gentili B., Werdell P. J., Hooker S. B., Franz B. A. (2007). Examining the consistency of products derived from various ocean color sensors in open ocean (Case 1) waters in the perspective of a multi-sensor approach. Remote Sens. Environ. 111, 69–88. doi: 10.1016/j.rse.2007.03.012
Mueller J. L., Morel A., Frouin R., Davis C., Arnone R., Carder K., et al. (2003). Ocean optics protocols for satellite ocean color sensor validation, revision 4. Volume III: radiometric measurements and data analysis protocols. Goddard Space Flight Space Center Greenbelt MD III, 1–84. doi: 10.25607/OBP-62
Reynolds R. A., Stramski D., Neukermans G. (2016). Optical backscattering by particles in Arctic seawater and relationships to particle mass concentration, size distribution, and bulk composition. Limnol. Oceanogr. 61, 1869–1890. doi: 10.1002/lno.10341
Snyder W. A., Arnone R. A., Davis C. O., Goode W., Gould R. W., Ladner S., et al. (2008). Optical scattering and backscattering by organic and inorganic particulates in US coastal waters. Appl. Optics 47, 666–677. doi: 10.1364/AO.47.000666
Stramski D., Boss E., Bogucki D., Voss K. J. (2004). The role of seawater constituents in light backscattering in the ocean. Prog. Oceanogr. 61, 27–56. doi: 10.1016/j.pocean.2004.07.001
Stramski D., Bricaud A., Morel A. (2001). Modeling the inherent optical properties of the ocean based on the detailed composition of the planktonic community. Appl. Optics 40, 2929–2945. doi: 10.1364/AO.40.002929
Stramski D., Constantin S., Reynolds R. A. (2023). Adaptive optical algorithms with differentiation of water bodies based on varying composition of suspended particulate matter: A case study for estimating the particulate organic carbon concentration in the western Arctic seas. Remote Sens. Environ. 286, 113360. doi: 10.1016/j.rse.2022.113360
Sullivan J. M., Twardowski M. S., Donaghay P. L., Freeman S. A. (2005). Use of optical scattering to discriminate particle types in coastal waters. Appl. optics 44, 1667–1680. doi: 10.1364/AO.44.001667
Tang J.-W., Tian G.-L., Wang X.-Y., Wang X.-M., Song Q.-J. (2004). The methods of water spectra measurement and analysis I: above-water method. J. OF Remote SENSING-BEIJING- 8, 37–44. doi: 10.3321/j.issn:1007-4619.2004.01.006
Tanioka T., Fichot C. G., Matsumoto K. (2020). Toward determining the spatio-temporal variability of upper-ocean ecosystem stoichiometry from satellite remote sensing. Front. Mar. Sci. 7. doi: 10.3389/fmars.2020.604893
Twardowski M. S., Boss E., Macdonald J. B., Pegau W. S., Barnard A. H., Zaneveld J. R. V. (2001). A model for estimating bulk refractive index from the optical backscattering ratio and the implications for understanding particle composition in case I and case II waters. J. Geophysical Res.: Oceans 106, 14129–14142. doi: 10.1029/2000JC000404
Uusõue M., Ligi M., Kutser T., Bourrin F., Uudeberg K., Kangro K., et al. (2022). Effects of different conditions on particle dynamics and properties in West-Estonian coastal areas. Oceanologia 64, 694–716. doi: 10.1016/j.oceano.2022.06.006
Vaillancourt R. D., Brown C. W., Guillard R. R. L., Balch W. M. (2004). Light backscattering properties of marine phytoplankton: relationships to cell size, chemical composition and taxonomy. J. Plankton Res. 26, 191–212(122). doi: 10.1093/plankt/fbh012
Vantrepotte V., Loisel H., Dessailly D., Mériaux X. (2012). Optical classification of contrasted coastal waters. Remote Sens. Environ. 123, 306–323. doi: 10.1016/j.rse.2012.03.004
Wang S., Li X., Sun D., He X., Zhang H., Zhao W., et al. (2023). Satellite estimation of suspended particle types using a backscattering efficiency-based model in the marginal seas. Optics Express 31, 890–906. doi: 10.1364/OE.476192
Winogradow A., Mackiewicz A., Pempkowiak J. (2019). Seasonal changes in particulate organic matter (POM) concentrations and properties measured from deep areas of the Baltic Sea. Oceanologia 61, 505–521. doi: 10.1016/j.oceano.2019.05.004
Woniak S. B., Stramski D., Stramska M., Reynolds R. A., Wright V. M., Miksic E. Y., et al. (2010). Optical variability of seawater in relation to particle concentration, composition, and size distribution in the nearshore marine environment at Imperial Beach, California. J. Geophysical Res. C Oceans: JGR. 115, C08027. doi: 10.1029/2009JC005554
Xi H., Larouche P., Michel C., Tang S. (2015). Beam attenuation, scattering and backscattering of marine particles in relation to particle size distribution and composition in Hudson Bay (Canada). J. Geophysical Res. Oceans 120, 3286–3300. doi: 10.1002/2014JC010668
Xia L., Liu H., Lin L., Wang Y. (2021). Surface chlorophyll-A fronts in the Yellow and Bohai Seas based on satellite data. J. Mar. Sci. Eng. 9, 1301. doi: 10.3390/jmse9111301
Zaneveld J. R. V., Roach D. M., Pak H. (1974). The determination of the index of refraction distribution of oceanic particulates. J. Geophysical Res. 79, 4091–4095. doi: 10.1029/JC079i027p04091
Keywords: satellite ocean color, ocean optical property, inherent optical property, chlorophyll-a, particle composition, bio-optical algorithm
Citation: Gao S, Zhou C, Jiang L and Xu J (2025) Particle composition-based water classification method for estimating chlorophyll-a in coastal waters from OLCI images. Front. Mar. Sci. 11:1499767. doi: 10.3389/fmars.2024.1499767
Received: 21 September 2024; Accepted: 24 December 2024;
Published: 15 January 2025.
Edited by:
Hui Zhao, Guangdong Ocean University, ChinaReviewed by:
Kaishan Song, Chinese Academy of Sciences (CAS), ChinaYuanzhi Zhang, Nanjing University of Information Science and Technology, China
Shoujing Yin, Ministry of Ecology and Environment (China), China
Copyright © 2025 Gao, Zhou, Jiang and Xu. This is an open-access article distributed under the terms of the Creative Commons Attribution License (CC BY). The use, distribution or reproduction in other forums is permitted, provided the original author(s) and the copyright owner(s) are credited and that the original publication in this journal is cited, in accordance with accepted academic practice. No use, distribution or reproduction is permitted which does not comply with these terms.
*Correspondence: Chao Zhou, emhvdWMwMzE2QDEyNi5jb20=