- 1Naval Architecture and Shipping College, Guangdong Ocean University, Zhanjiang, China
- 2School of Information Engineering, Henan University of Science and Technology, Luoyang, China
- 3Department of Electrical Engineering, Shanghai Maritime University, Shanghai, China
In challenging visibility conditions, the reliability of existing port lighting systems is significantly affected by abrupt changes in environmental factors (primarily stemming from ocean weather). This study proposes a cloud-edge collaborative dimming model that integrates a combined filter, enabling dynamic adaptation to these weather variations to ensure the stability of the lighting system. Additionally, the application of edge computing not only alleviates computational pressure but also facilitates the model’s ability to achieve effective regional adaptive dimming in accordance with environmental regulations. Experimental results indicate that this method is suitable for scenarios with unknown mutations under extreme conditions, providing a more reliable and intelligent solution for port lighting systems within the Internet of Things (IoT) framework.
1 Introduction
In recent years, global climate change has led to an increasing probability of extreme weather events (Clarke et al., 2022). Due to the complexity and variability of weather in coastal ports, various challenging visibility conditions (such as haze, overcast skies, and heavy rain) frequently occur, resulting in economic losses and casualties in several coastal cities and ports (Yang et al., 2021). Geographical factors contribute to the significant impact of extreme weather on coastal ports (Izaguirre et al., 2021). These weather conditions can rapidly alter the lighting environment of the port, causing dramatic fluctuations in natural light intensity and visibility, which directly impacts the safety of vehicle movements and cargo handling operations (Al-Behadili et al., 2023). Therefore, under these challenging visibility conditions, effective and reliable port lighting systems are crucial for ensuring traffic and personnel safety (Galbraith and Grosjean, 2019).
To ensure the safety and visual comfort of port personnel, lighting systems are among the highest energy-consuming components in port operations, sometimes accounting for over 70% of the port’s total energy consumption (Sifakis et al., 2021). This has prompted many researchers to focus on the integration of the Internet of Things (IoT, refers to the interconnection of various physical devices via the internet, allowing them to communicate and exchange data with each other) with port lighting systems, exploring methods such as adjusting lighting schedules (Sun, 2019), introducing solar-assisted lighting (Muhamad and Ali, 2018), and optimizing energy management strategies (Prousalidis et al., 2019) to save energy required for lighting. However, despite the important role these lighting systems play in port safety, there is still a problem of insufficient intelligence (Pham, 2023). Under extreme conditions, existing lighting systems often require manual intervention and have long response times, lacking real-time monitoring and fine-tuning of environmental changes (Yau et al., 2020). Meanwhile, with the widespread adoption of intelligent assisted driving, safety hazards for logistics vehicles are becoming increasingly serious under the influence of extreme weather (He et al., 2021). Therefore, it is necessary to conduct further research on the perception capabilities and adaptive regulation capabilities of port lighting systems under extreme conditions.
In the face of extreme weather conditions, the effectiveness of environmental perception and dimming in port lighting systems relies not only on accurate localized weather data but also on overcoming the influence of urban structures on roadway monitoring (Bowden and Heinselman, 2016; Gao et al., 2024; Cao et al., 2024). However, existing methods struggle to meet these requirements. In recent years, although artificial intelligence technologies such as deep neural networks (e.g., MetNet, AI Earth) have gradually been applied to extreme weather forecasting and can achieve minute-level short-term predictions under ideal conditions with a resolution of up to 1 kilometer, these methods still have limitations in model interpretability and input sample quality (Bojesomo et al., 2021). Additionally, AI methods face challenges in integrating heterogeneous data and computational capabilities, making it difficult for existing port lighting systems to meet their computational demands (Zhang and Lu, 2021; Gao et al., 2023c, a, b; Zhang et al., 2024). Therefore, from a technical perspective, it is necessary to introduce a cloud-edge collaborative computing model to address the tracking and dimming issues of port lighting through edge computing methods. This approach not only enables real-time detection of environmental changes at the port but also ensures the precision of dimming adjustments on the edge, thereby improving the overall efficiency and reliability of the system while reducing computational pressure (Saeik et al., 2021).
Since 2015, countries such as China have gradually implemented smart streetlight infrastructure in major cities and published relevant standards (Wang et al., 2019). These standards define smart lighting, video capture, and mobile communication as standard configurations for urban roadways and require the deployment of weather monitoring functions at major roads, bridges, and intersections. The deployment of these functions enables cities to directly perceive weather changes based on edge computing capabilities, determine dimming targets, and achieve tracking and dimming of municipal lighting systems under extreme weather conditions (De Paz et al., 2016). Therefore, this paper will explore the application prospects of smart streetlights in port lighting, focusing on adaptive dimming management methods based on the perception of ocean weather conditions to enhance the intelligence level of port lighting systems and ensure safe operations. Specifically, it aims to clarify how to utilize the information collected from smart streetlight hardware systems, in conjunction with the physical state of extreme weather (primarily the impacts brought by ocean conditions) in the port environment, to improve combined tracking filters and achieve precise dimming of port lighting.
2 Problem description
2.1 Smart lighting system description
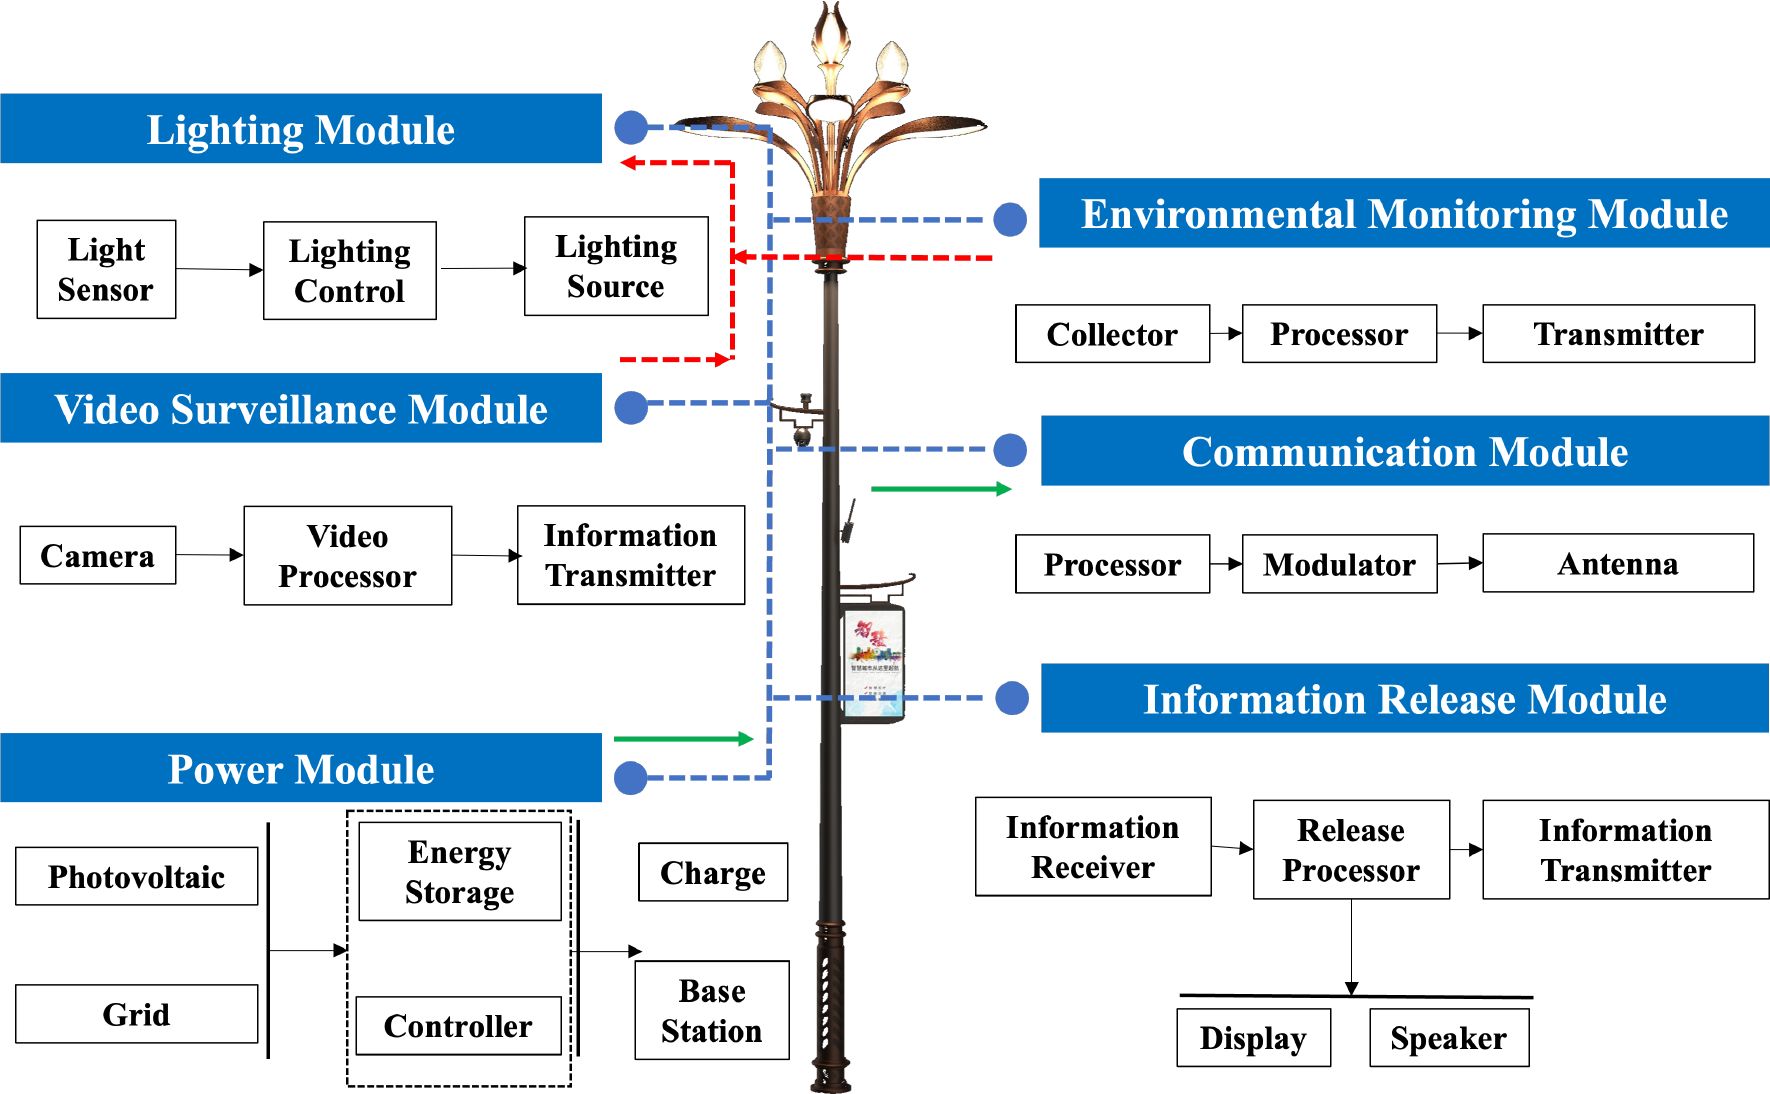
The system composition of intelligent street lighting is illustrated in Figure 1. It primarily consists of six components: the lighting module, video monitoring module, power supply module, environmental monitoring module, communication module, and information display module. The lighting module can be configured with either a light sensor or a photovoltaic panel. The brightness of the light source is regulated through the lighting controller. Currently, individual lamp control is primarily achieved through the DC intelligent control power supply, while centralized control of an entire street is accomplished by the centralized controller in the power distribution cabinet. The edge controller in the power distribution cabinet possesses enhanced computational capabilities, enabling smooth processing of video and image streams. It also offers a wide range of communication interfaces, such as Ethernet, RS485/232, CAN, HDMI, LVDS, USB2.0, line out, etc., facilitating the integration of diverse data sources and expanding various analytical functionalities. The video monitoring and environmental monitoring modules serve as the information foundation for intelligent light poles. Equipped with various sensor devices, the cameras primarily serve the recognition and tracking of specific targets for urban security, while also providing real-time monitoring of traffic flow and pedestrian movement. The environmental sensors encompass a variety of types, capable of measuring parameters such as temperature, humidity, particle concentration, wind speed, wind direction, air pressure, noise, and more. The information obtained or received by the aforementioned modules, including weather and traffic data, can be disseminated to pedestrians through LED display screens and speakers mounted on the light poles. Simultaneously, the communication module transmits this information to the big data cloud platform of the lighting system. This transmission trend is gradually shifting towards the development of 5G, facilitating distributed connections while serving as small base stations to provide external support for WIFI signals.
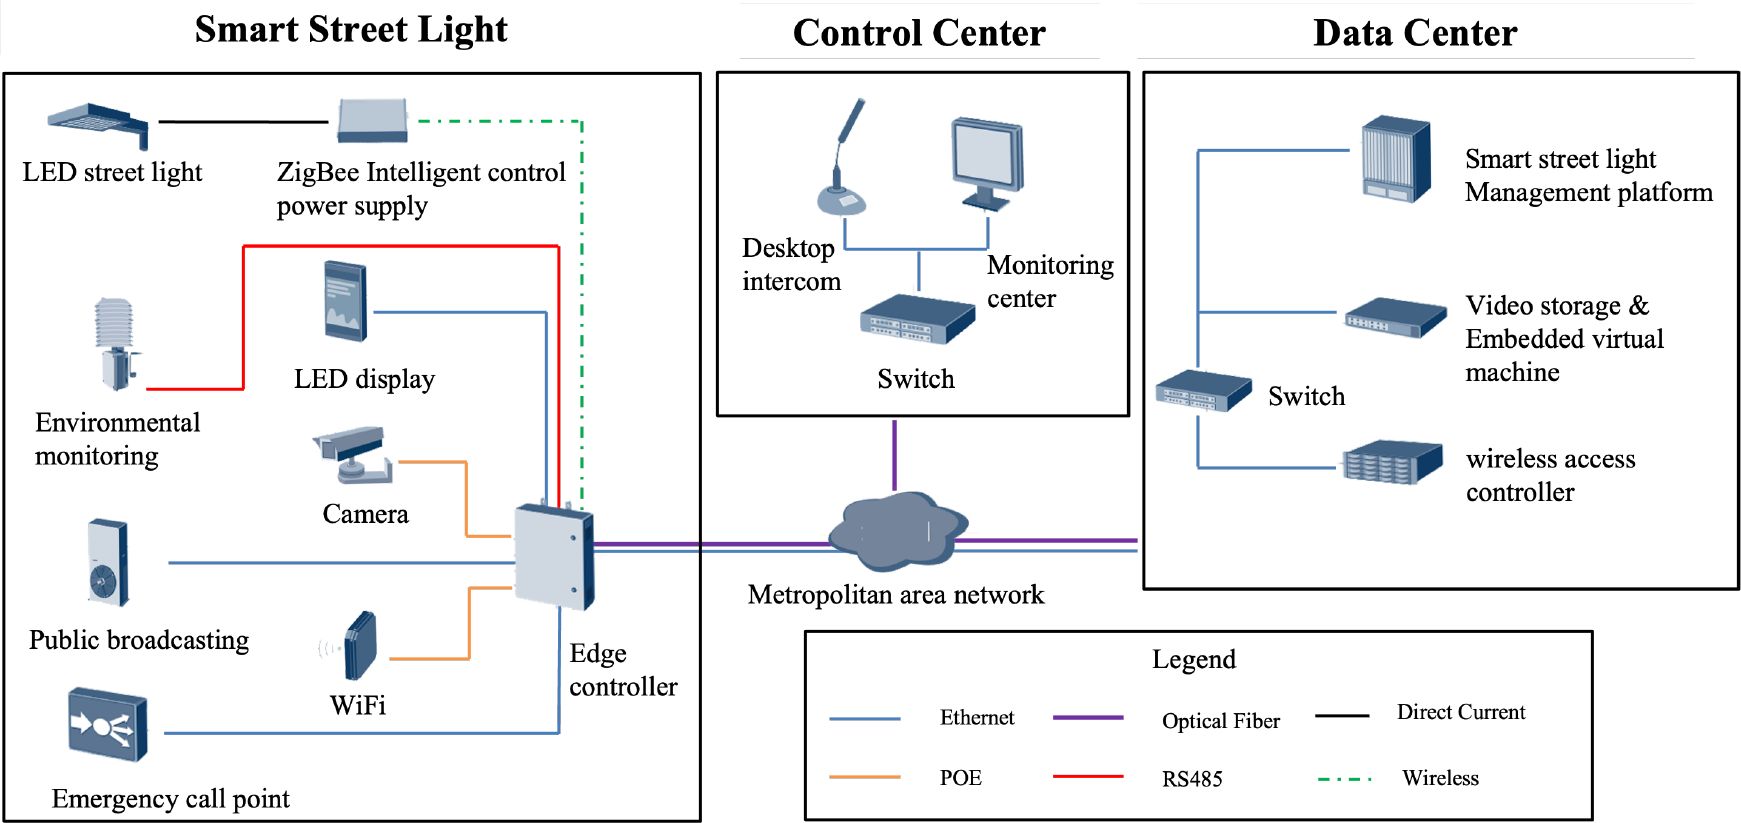
Currently, the vast amount of data generated by intelligent light poles is primarily transmitted to dedicated management and operation platforms through optical fiber communication, as illustrated in Figure 2. Multiple communication protocols, including MoDBUS, DMX512, MQTT, GPRS/LTE, RPC, and HTTPS, are employed to enable application interactions at the Internet layer. To support the IoT information system implemented on light poles, the intelligent light pole system requires collaborative power supply from photovoltaic renewable energy and the grid. It is equipped with energy storage and control systems to provide energy assurance for electric vehicle charging and 5G services. Therefore, an intelligent street light, as indicated by the green arrows in Figure 1, can be regarded as a process that starts from the power supply module, delivers data to various information modules, and then transmits it externally through the communication (closed-loop) or information display (open-loop) modules. Tracking and dimming for extreme weather conditions deviate from the fixed path and enable information flow equivalent to the red arrows in Figure 2.
Due to the lack of unified management entities for the operation of intelligent streetlights, different operators tend to emphasize different aspects based on their respective business characteristics. To ensure the general applicability of the research methodology (to address the dimming requirements of smart streetlights under various conditions in the port, thereby achieving a level of normal operation and safety assurance), it is necessary to consider the hardware configuration standards of smart streetlights. Figure 3 presents a reference specification indicating the configuration standards. It can be observed that smart lighting, video capture, and mobile communication are fundamental and commonly found configurations of smart streetlights. Additionally, meteorological monitoring is also required in urban road regulations. Therefore, this standard can serve as a hardware constraint reference for algorithm design, ensuring the consistency and compatibility of the proposed methods.

Figure 3. Installation scenarios and configuration of smart streetlights (Zhou, 2018).
2.2 Description of the dimming problem
The impact of extreme weather in coastal port scenarios on port lighting systems primarily manifests in sudden changes in meteorological conditions such as rain and fog, posing threats to the safety of logistics vehicles and pedestrians. Extreme weather reduces visibility, thereby affecting traffic safety and logistics efficiency. In this context, the smart streetlights system at the port faces photometric issues, with the adjustment target being the luminous flux Φv. Given that existing streetlights are generally optimized through lens design, it is assumed that they possess directional uniformity within the specified emission angle (non-uniformity is considered an optimization problem of the luminaire hardware and is not included in the scope of this discussion). Therefore, the adjustment of the luminance Lv with respect to the emission angle Ω can be simplified as a problem of constant light emission degree Mv. To further optimize the target illuminance Ev, two ideal assumptions are made: 1) assuming that the port road environment is fully diffusive, the illuminance can be considered uniformly consistent within a certain range of streets; 2) assuming that there is little difference between the light escaping at the boundaries and entering, or that the total amount of escaping light is small, thus considering the dynamic energy balance within the entire study space. Although these two ideal conditions may deviate to some extent in practical construction, they can be effectively approximated through engineering optimization of the lighting system. Therefore, under a fixed area conversion coefficient K𝔸, Ev can be expressed as:
where 𝔸 is the illuminated area, measured in square meters.
Introducing extreme weather factors, it is considered that the illuminance from the environment undergoes attenuation or fluctuation, and environmental factors weaken the inherent illuminance of the lighting system. It is believed that this attenuation or fluctuation exhibits a significant dynamic range, during which both the cone and rod cells of the human eye are involved. The spectral luminous efficiency function for mesopic vision is denoted as Vm, and it is defined using the MES2-system model as Vm (Gao et al., 2018):
where λ represents the wavelength of light, p denotes a coefficient, V (λ) corresponds to the luminous efficiency function under photopic vision, ν(λ) represents the luminous efficiency function under scotopic vision, and 𝕄 (p) stands for a normalization function that is influenced by photopic luminance and determined by visual adaptation conditions. Therefore, the appropriate mesopic luminance, Lm, can be defined as follows:
under the given light source, where E(λ) represents the spectral radiance distribution of the light source, and is the maximum spectral luminous efficiency, the luminance standard for mesopic vision can be obtained by measuring the standard photopic luminance and the standard scotopic luminance of the given light source. Consequently, Lm can be used as a reference for adjusting the system dimming based on mesopic vision.
Based on Equation 1 and its validity conditions, it is evident that the introduction of extreme weather conditions disrupts the energy balance of the existing lighting system, necessitating a reevaluation of the regulation behavior. However, the specific manner in which this balance is disrupted varies depending on the type of weather. For instance, cloudy conditions primarily lead to rapid changes (reductions) in natural illuminance, which can be addressed by directly adjusting the brightness or color (i.e., wavelength) of the light source based on the corresponding visual state. On the other hand, degradation of effective illuminance caused by rain (liquid droplets), haze (liquid-solid aerosols), or dust storms (solid particles) occurs due to the scattering and absorption of light by particulate matter, resulting in attenuation of light intensity after propagation through the medium. The extent of this attenuation is dependent on the size and concentration of the particles and can be described by the Lambert-Beer law (Swinehart, 1962):
where I0 represents the initial intensity of light, and I denotes the intensity of light after extinction, which is equivalent to the integral of the corresponding luminance over the spherical degree. Here, l represents the optical path length, and τ signifies the turbidity of the medium. For a polydisperse particle system consisting of n particles with an average diameter of , τ can be quantitatively expressed as described by (Gledhill, 1962):
where a and b represent the lower and upper limits, respectively, of the particle size distribution. The parameter m corresponds to the relative refractive index of the particles with respect to the surrounding medium, while kext denotes the extinction coefficient (Bruce et al., 1980). When both absorption kabs and scattering ksca processes occur simultaneously:
where
where
The functions and represent the Bessel functions of half-integer order and the Hankel functions of the first kind, respectively, both of which are series functions. It can be assumed that the absorption of particulate matter in general weather conditions is negligible, that is, the imaginary part of the complex refractive index m is zero. However, this calculation requires a substantial number of computational resources (the speed of convergence is directly proportional to the computational resources invested), which consequently increases the energy required for the entire port lighting system. Therefore, when designing tracking and dimming algorithms for extreme weather variations, it is advisable to avoid direct computation of the extinction coefficient or make necessary simplifications.
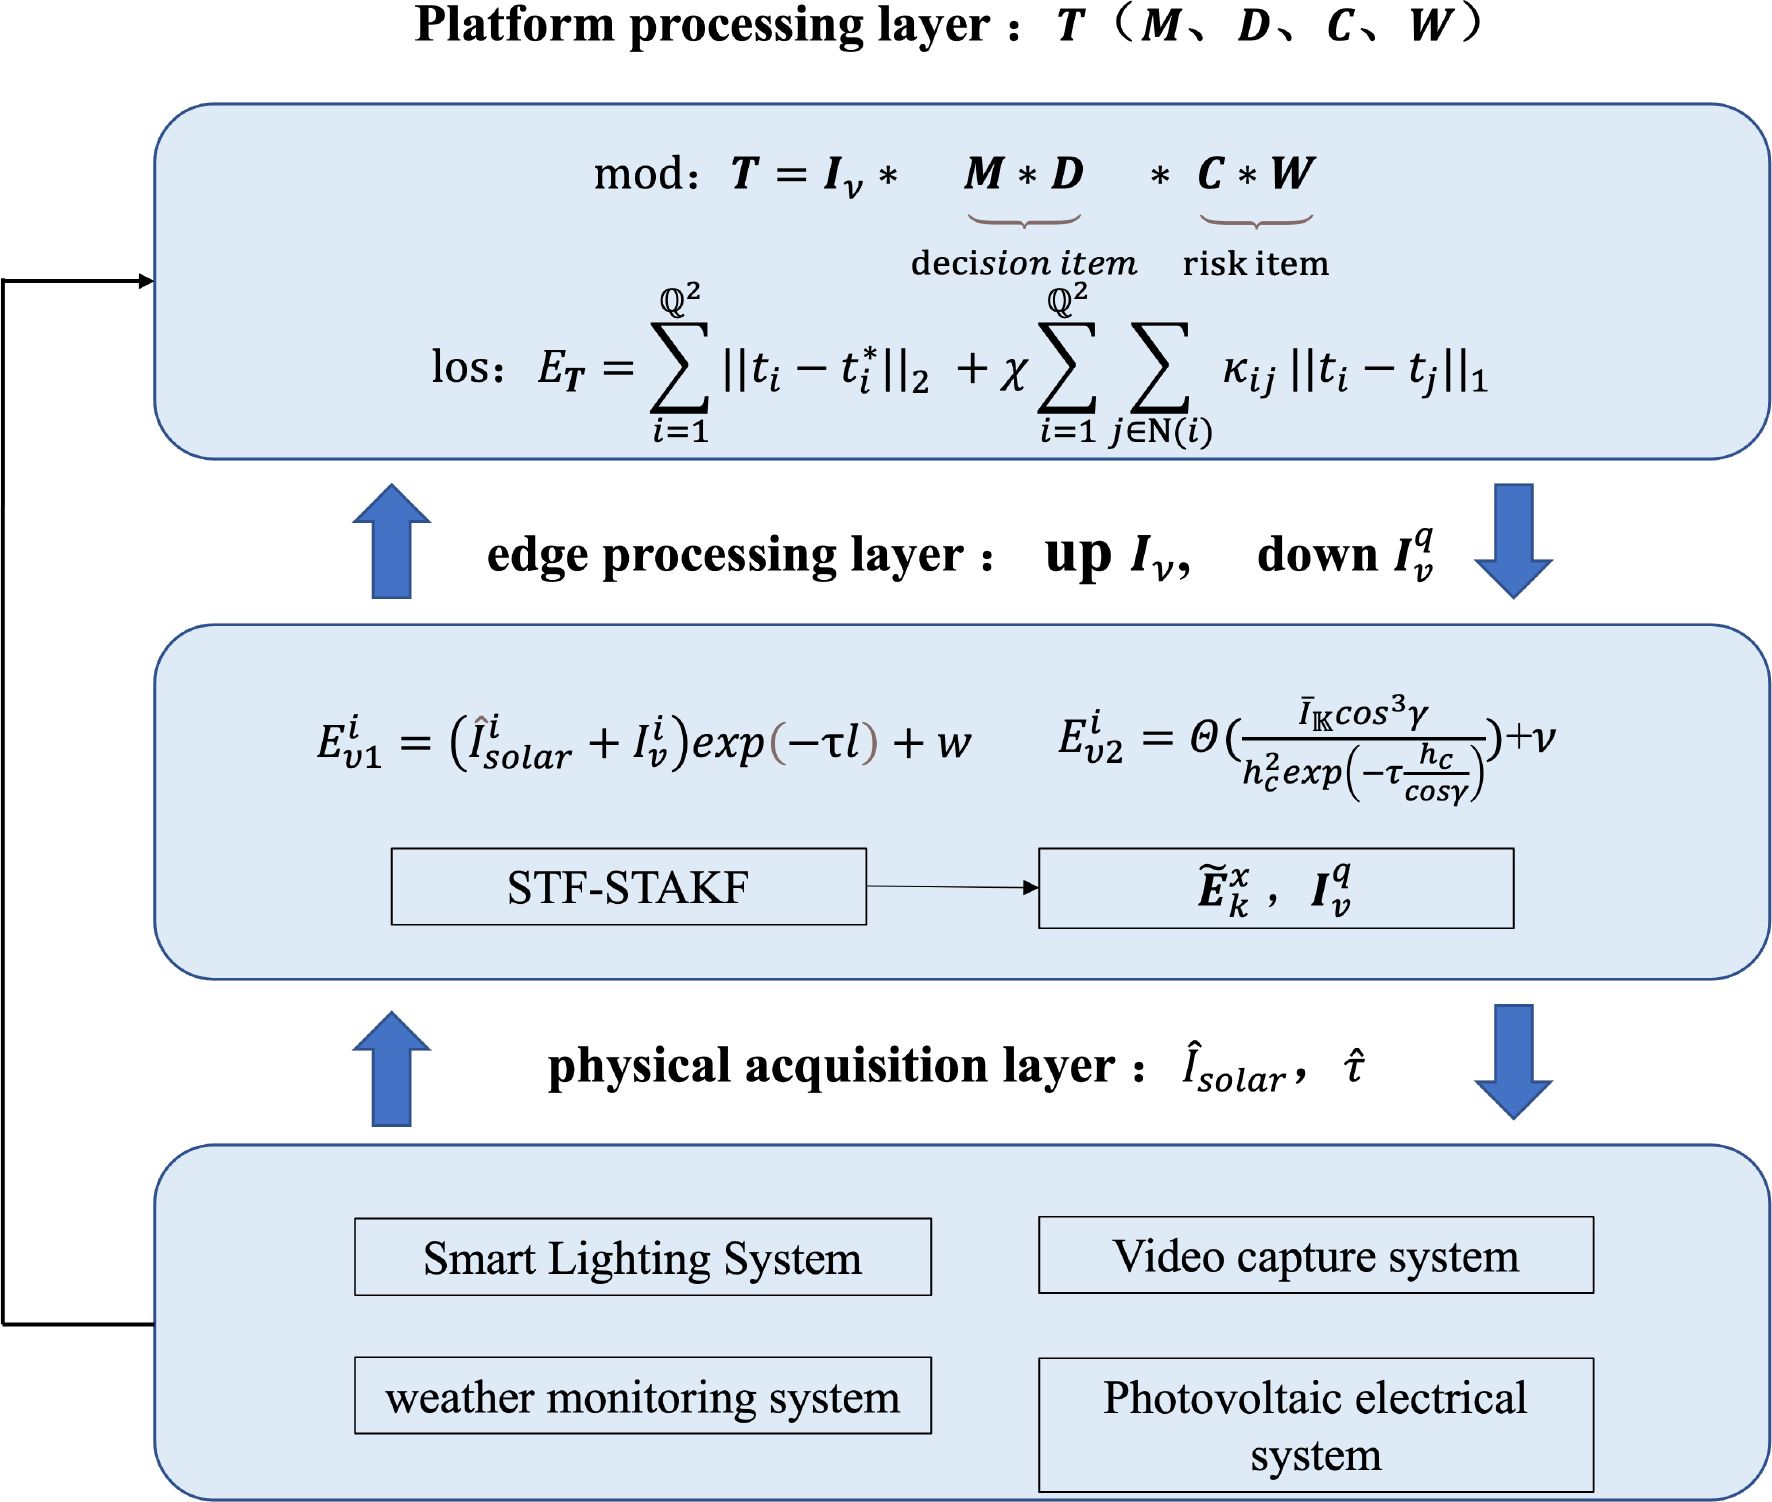
Based on the foundational discussions above, the regulation problem of the port illumination system in the face of extreme oceanic conditions can be transformed into a strong tracking problem by leveraging existing smart streetlight hardware standards. Guided by this approach, this paper proposes a method for regulating the port illumination system based on a combined tracking filter, consisting of three main components: the physical acquisition layer, the edge processing layer, and the platform processing layer. The physical acquisition layer is primarily responsible for providing observation data and system structural information. The edge processing layer is focused on tracking (the actual value of the streetlight illumination state during the k-th tracking dimming) and adjusting the vector (the dimming matrix received by the q streetlights at the edge). The platform processing layer is responsible for receiving the dimming matrix Iv, updating, and issuing macroscopic decisions T, as illustrated in Figure 4, outlining the basic framework. In a nutshell, the main contributions of this paper are outlined as follows:
● In response to the impact of extreme oceanic weather on port road illuminance, a cloud-edge collaborative dimming model is proposed, incorporating the hardware system of smart streetlights. The dimming model’s cloud control risk items and decision items are expanded and described in detail, while optimization objectives for the target matrix are provided.
● To address the real-time dynamic changes of the dimming matrix, this paper presents state estimation and observation methods under static conditions. Specifically, for air turbidity, a calculation method based on video monitoring devices and neighboring streetlights is proposed, circumventing the direct computation of the extinction coefficient.
● A dynamic system model for discretized illuminance based on Kalman filtering theory is presented to address the dynamic adjustment problem of illuminance in response to time-varying solar input and air turbidity. The uncertainties and nonlinearity of the system are decoupled from the state vector, ensuring that the main iterative process achieves a convergence rate suitable for edge computing capabilities.
● Given the challenge of a priori judgment of state mutation resulting from the aforementioned operations, and considering the distinctions between the two strong tracking filtering methods, STF and STAKF, a strategy that combines the strengths of both approaches is proposed. Additionally, an optimized step size is adopted to account for the variability in tracking.
3 Cloud-edge collaborative dimming model
3.1 Model architecture
According to Section 2.1, it is evident that there are multiple approaches for controlling the luminous intensity of smart streetlights. In this subsection, a cloud-edge collaborative dimming strategy model will be proposed, where the dimming decisions of all smart streetlights are based on the cloud-edge collaborative streetlight network model presented in this subsection, and the smart streetlights are interrelated while operating. The decision of whether to adopt a centralized or fixed strategy, which is cost-effective, requires prior decision-making at the cloud level. Based on this decision, concrete collaborative strategies can be formulated. The decision model can be expressed in the following form:
Let W denote the risk matrix primarily based on meteorological observations. For convenience, let’s assume that the streetlights scattered within the selected urban area for dimming can be projected into a square matrix of size ℚ × ℚ through an affine transformation. Here, 𝔹 represents the smallest scale that the existing forecasting system (mainly based on meteorological satellites and radars) can discern in the projection onto W. The matrix W can be expressed as follows:
where , the matrix Bii represents a submatrix of size 𝔹 × 𝔹, which can be interpreted as a city block within the port area. Due to variations in port planning and infrastructure, different blocks may exhibit varying levels of response to extreme marine meteorological risks.
Therefore, based on meteorological forecasts of disaster types and severity from marine meteorological monitoring, the cloud platform can leverage historical data and the GIS+BIM system of the smart city to further refine and adjust Bii, forming a transition matrix C:
where, is the adjustment factor. C and W together constitute the risk term in the collaborative dimming model T. Their purpose is to assign varying degrees of dimming based on evaluations of the individual impacts of extreme marine meteorological conditions on port streetlights.
The decision matrix D primarily serves to accommodate constraints from the power system and other aspects, including considerations of hardware controllability, grid dispatch, and economic factors. It can be represented as a binary matrix (1-0 matrix). If optimization operations on the D matrix are required in subsequent model applications, a sigmoid transformation can be applied to the matrix:
where X ∈ {0,1}.
In addition, the influence of extreme marine weather types needs to be considered. As discussed in Section 2.2, existing LED port lighting systems can adjust the color temperature based on marine meteorological conditions and environmental changes. Different color temperatures correspond to different S/P ratios, which in turn affect the intermediate visual brightness Lm. Since , the differences in brightness adjustment targets will impact the decision-making process for light intensity adjustment. To ensure a unified behavioral scale for the dimming matrix Iv in the model, it is necessary to normalize the influence in this aspect into a pattern matrix M, where the matrix elements Mii ∈ (0,1]. Both W, C, D, and M can be determined based on the existing information and instructions from the cloud-based control system of smart streetlights. The matrix Iv needs to reflect the dynamic changes in extreme marine meteorological conditions on the edge side, thus requiring the adoption of a strong tracking algorithm combined with relevant sensor data for control. The evaluation target ET of the entire control can be written as the target matrix T norm regularization form:
In the above equation, ti represents the elements in T arranged according to certain geographic rules. We define the calibration matrix T∗ as the reference values for evaluating T, where corresponds to the elements in T∗ that correspond to ti. The determination of T∗ is carried out by specialized instruments carried by engineering vehicles during road maintenance operations under specific conditions. It is based on standards (Jaskowski et al., 2022) that are related to road types, traffic flow, road morphology, and luminaire settings. Ideally, the dimming target T should closely resemble the standards and measured values in T∗. Hence, the evaluation objective ET includes the 2 norms || · ||2 of both T and T∗.
However, due to uncertainties in the model, standards, and measurement processes, including inaccuracies and imprecisions, as well as inherent biases in the control system transfer function, overfitting tendencies may arise when characterizing T with respect to T∗. To limit local flatness and encourage proximity, a sparse 1 norm || · ||1 is introduced in the regularization term. This ensures that adjacent light intensities do not exhibit sudden changes and are as close as possible. χ represents a tunable hyperparameter of the evaluation model, which controls the tendency for proximity and can be freely set based on preferences. N(i) denotes the local neighborhood of i, determined by the field of view of the smart streetlight’s video surveillance module (as discussed in Section 2.2). tj represents the light intensity of the streetlights within the field of view. κij denotes the affinity coefficient, and its calculation method can be expressed as (Li et al., 2020):
where the constants σ1 and σ2 are predefined constants used to control the model’s attention to the differences in light intensity and structure. STi and STj represent the multi-scale structures based on a priori weighted strategies at points i and j, respectively. Taking STi as an example:
here, Gρ= exp(−||ti−tj||2/2σ2) denotes the two-dimensional Gaussian kernel with multi-scale parameter σ, where σ ∈ {1,2,3}.
In summary, the main objective of evaluating and optimizing T is to adjust the decision and risk terms of the entire model. The parameters or strategies in this part are relatively fixed and can be allowed to be completed offline with a delay. It can be observed that the entire model, based on a large-scale data-driven smart streetlight operation and management cloud platform, is executable. Therefore, the key focus of this research lies in utilizing the edge hardware capabilities of smart streetlights to achieve tracking and adjustment of Iv.
3.2 Dimming matrix
As indicated in Section 3.1, the key challenge of the entire T model lies in handling the real-time dynamic variations of Iv. Following a data-driven approach, the main task in this regard is to establish a dataset comprising measurements from smart streetlight solar irradiance sensors, ground illuminance, and corresponding adjustment values of Iv. The real-time adjustment value of Iv can be directly obtained from the electrical system of the smart streetlight. On one hand, the solar irradiance intensity Isolar originating from solar radiation can be acquired or estimated through the environmental-meteorological sensing system integrated into the smart streetlight. On the other hand, in a more general scenario, Isolar can also be estimated from the solar panel mounted on the top of the streetlight, which processes the solar power Psolar:
where Psolar represents the output power of the photovoltaic array, ϱ denotes the photoelectric conversion efficiency of the photovoltaic cells, and 𝔸pv signifies the total area of the photovoltaic panel. The solar power Psolar is determined by the total solar irradiance received on the photovoltaic array, which includes the ground-reflected component multiplied by the spectral efficiency factor to account for photometric considerations. Since the smart streetlight’s photovoltaic panel is typically installed at the top of the pole and is nearly horizontal, Ir = 0 is negligible. The remaining term Isolar/ comprises the direct solar irradiance Id and the sky-scattered radiation Is :
In the above equation, Iba represents the total solar radiation at the location, primarily determined by factors such as solar declination angle, and is a known function of the date. h denotes the solar altitude angle, Δφ represents the angle between the solar azimuth angle and the orientation of the photovoltaic array, and θ is the tilt angle of the photovoltaic array. Under non-extreme marine climatic conditions, atmospheric scattering due to particle sizes is mainly accounted for by Rayleigh scattering. In this case, the received solar radiation intensity Isolar is primarily composed of the direct solar radiation intensity Id. Additionally, assuming that the tilt angle θ of the photovoltaic panel at the top of the smart streetlight tends towards zero, the ideal form of can be expressed primarily in terms of the local solar altitude angle:
Clearly, the height of the streetlight pole can be disregarded compared to the atmospheric height, and the differential unit area can be approximated as a solid angle. Therefore, the illuminance of any streetlight i on the road surface below it is expressed as:
In this case, the range of , is [0, I(Lm)] where I(Lm) represents the upper limit for intermediate vision [which can be defined according to relevant standards Ito et al. (2024)]. w denotes the uncertainty of the real-time state of Ev1, and its magnitude is mainly positively correlated with . Since has a well-defined reference standard, the estimation of turbidity τ is required to compute the value of exp(−τl) in order to generate the dimming matrix Iv, where l is known as the height of the lamp post.
As discussed in Section 2.2, it is not feasible to estimate τ in real-time solely relying on the environmental monitoring devices at the edge of the smart streetlights. However, the emitted light intensities of adjacent centrally controlled streetlights within any solid angle Ω are known, and their relative positional relationships are determinate. Therefore, an estimation of τ can be achieved by observing nearby streetlights using a video surveillance system installed beneath the streetlight, obtaining the observed values of road surface illuminance . Consequently, Z neighboring streetlights within the field of view of the video surveillance equipment are selected to estimate τ, and the i-th estimation result τi is given by:
Ii represents the illumination intensity of the current streetlight, represents the illumination intensity of the nearest streetlight, and d denotes the vertical height between the observation device of the current streetlight and that of the nearest streetlight’s light source. Then we have
In the case of data availability, the adjustment of the dynamic weights of vector ω can be achieved using shallow neural networks such as Extreme Learning Machines (ELM) (Liu et al., 2022) to solve for it. Alternatively, considering that the nearby streetlights have stronger light intensity and therefore a higher signal-to-noise ratio, an exponential weighted average can be employed to assign higher weights to the closest streetlights. Neglecting the influence of road surface materials, it is worth noting that different road surfaces (such as concrete or asphalt) have varying reflectance coefficients. For the sake of convenience in the discussion, it is assumed that the road surface undergoes complete diffuse reflection. The observed brightness of the road surface in the vertical direction below the nearest neighboring streetlight, as captured by the camera, is denoted as I𝕂. To mitigate the impact of outliers, actual image processing can replace individual pixel values with the average value within a pixel region, denoted as , corresponding to the direction angle γ. Therefore, under the condition of camera height hc, the following relationship holds:
Θ represents the transfer function, which is dependent on the specific parameter settings of the camera. Therefore, there exists a constant proportionality relationship between and . Furthermore, as discussed in Section 3.1, the overall optimization strategy exhibits smoothness locally due to the constraint imposed by the 1 norm. Consequently, the illuminance of the nearest neighboring road surface captured by the camera can be regarded as an observation of the vertical illuminance of the i-th streetlight, with v representing the uncertainty associated with this observation.
Based on the above analysis, static computation of Iv can be achieved. However, extreme weather conditions are typically subject to dynamic changes. Therefore, the introduction of robust tracking filtering methods is necessary to enable adaptive adjustment of Iv.
4 Adaptive adjustment method based on STF-STAKF combination
4.1 Dynamic system model
Considering the variation of Iv with extreme marine weather conditions, Isolar, τ, and other parameters are functions of time. The estimates , and so on form time series with a certain interval (time step) Δt. By discretizing Ev according to Equations 21 and 24, and extending it to the illuminance vector E corresponding to q streetlights:
where is the state vector, I ∈ Rq×q is the identity matrix, is the control vector, and the process noise satisfies the Gaussian distribution is the observation vector, H ∈ Rq×q is the observation matrix, and the observation noise satisfies the Gaussian distribution . Define:
Referring to the standard linear Kalman filter theory (Shao et al., 2021), the recursive calculation formula can be listed as follows:
where represents the a priori estimate of denotes the a priori error covariance, I ∈ Rq×q is the identity matrix, Kk ∈ Rq×q represents the Kalman gain, is the posterior estimate of , and Pk ∈ Rq×q corresponds to the updated error covariance. In the context of adaptive adjustment of the time step, the standard Kalman filter, as a non-closed-loop filter, faces challenges in adapting Kk to sudden changes caused by extreme ocean weather conditions and accumulated errors resulting from limited modeling accuracy. Consequently, there is room for improving the performance in practical light adjustment tracking and response.
To address the aforementioned issues, the algorithm needs to incorporate robust tracking filtering to tackle the challenges posed by inaccurate modeling and sudden environmental state changes. The core idea is to introduce a dynamically changing fading factor to adjust the covariance matrix of the prediction error. A computationally efficient approximation of this approach is given by:
Where
where
In Equation 36, the parameter β ∈ [1, ∞) is a user-defined damping factor that controls the smoothness of the state estimation. It plays a role in adjusting the level of smoothing in the estimated values. Vk represents the innovation covariance matrix (Zhou et al., 1991):
where ρ ∈ (0,1] is the forgetting factor, and ϒk is the innovation sequence:
If the fading factor ξk is applied to the error covariance matrix, the Strong Tracking Filter (STF) method is obtained (Han et al., 2006):
Under the constraint of the orthogonality principle, adjusting the error covariance matrix is equivalent to a modification of process noise without differentiation. However, by directly applying the damping factor to the process noise, we can obtain the Strong Tracking Adaptive Kalman Filter (STAKF) method with multiple fading factors (Ge et al., 2016):
Where
To ensure the symmetry of Pk|k−1 when the diagonal elements of Γk are not equal, Equation 41 can be written as
where is obtained by performing Cholesky decomposition on Γk:
let represent the element in the i-th row and i-th column on the diagonal of Fk, and denote the corresponding element in Qk. Then, we have:
As a result, the matrix Γk or with multiple fading factors can be determined. The difference in this approach is reflected in the tracking performance of transient variables. STF tends to assume the system model is reliable and focuses on modifying the estimation error from the previous time step. On the other hand, STAKF tends to attribute the transient changes to the inaccuracy of the system model, indicating a difference in their underlying processing principles. In this research problem, optical-electric measurement methods are frequently employed, which are susceptible to environmental disturbances. Moreover, the study focuses on extreme oceanic weather conditions where the parameters may undergo sudden changes within a processing interval. Therefore, an effective combination of both tracking filters is required.
4.2 Adaptive adjustment method based on STF-STAKF combination
Due to the time-varying nature of fitting functions such as Isolar and τ, which may exhibit non-stationary first and second-order differentials, it is crucial to emphasize the role of the discrete time step Δtk in order to closely capture the trajectory of extreme oceanic meteorological variations. Moreover, the determination and updating of Δtk need to be considered. To begin, we define the normalized distance of the error covariance matrix as 𝔻k:
By introducing 𝔻k, we establish a criterion for adjusting Δtk, such that as Δtk approaches zero, 𝔻k tends to zero. Referring to (Or et al., 2021), we can obtain the minimum value dk of the diagonal elements of 𝔻k and define a target threshold dk. Consequently, the adjustment rule for Δtk can be formulated as follows:
the parameter s takes values within the range of 0.1 to 0.2, primarily serving as an auxiliary criterion for convergence determination. The fine-tuning quantity ϵ is a predefined parameter, and its range is constrained as follows:
In order to meet the deployment requirements of the margin, the handling approach for the dynamic system model deliberately avoids nonlinearity in the state transition matrix. This strategy facilitates the real-time adaptability and tracking of various hyperparameters within the model. For states with unclear trends in extreme marine meteorological variations, a conservative adjustment effect is desired. Specifically, the outputs of the two filters under this condition, denoted as for Filter 1 and Filter 2, are collectively referred to as Y1 and Y2. Consequently, the final output result, denoted as , is obtained by:
the fusion coefficient matrix ηk∈ Rq×q is a diagonal matrix. In this example, Pk is also a diagonal matrix of the same size as ηk. As a result, there exists a correspondence between the diagonal elements and of the a priori error covariance Pk for the two filters and the diagonal elements of ηk. By calculating (Claser and Nascimento, 2021), the fusion coefficient matrix ηk is obtained:
To further prevent interference in the combined filtering under extreme oceanic weather conditions, the normalization of is performed for k ≥ 2 as follows:
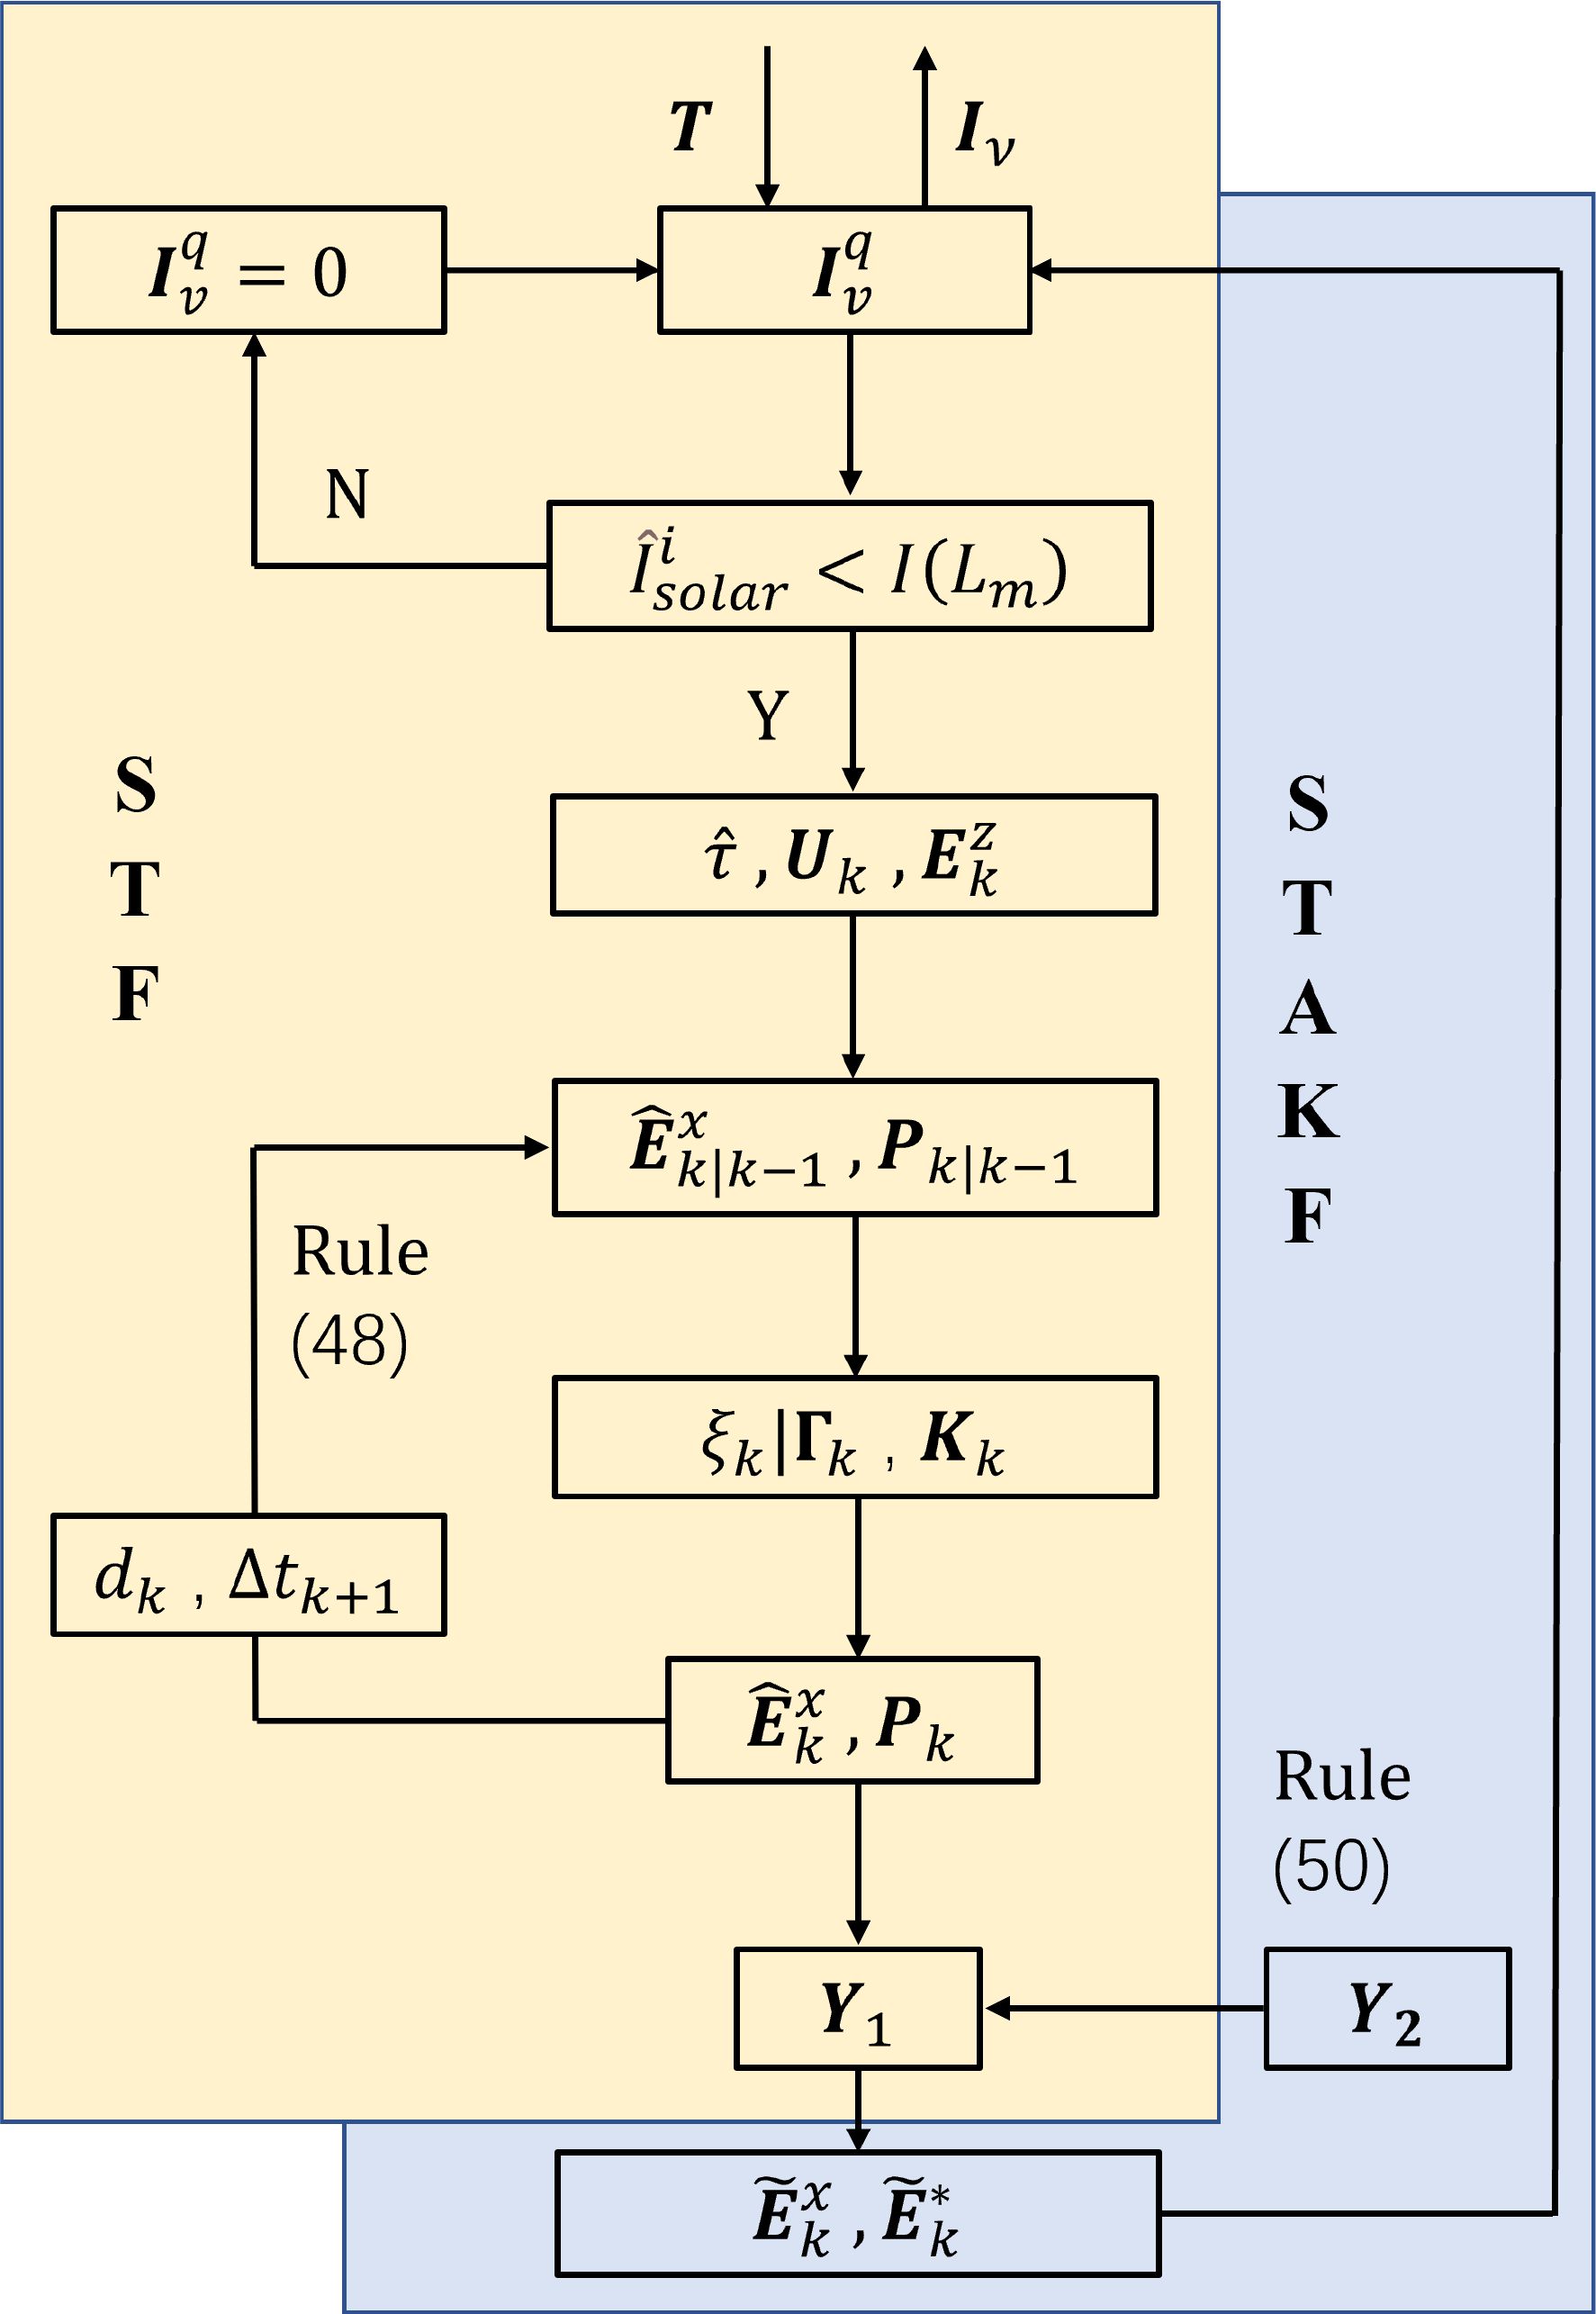
A single filter can be regarded as ηk taking values of 0 or 1. Consequently, the difference between and the target illuminance in the coordinate system can be used to set Uk+1 and obtain at time k + 1. The collection of received by the cloud is arranged according to predefined rules, resulting in the overall dimming matrix Iv. The complete algorithm flow is illustrated in Figure 5.
5 Experiments and analysis
The effectiveness of the STF-STAKF (Strong Tracking Filter - Strong Tracking Adaptive Kalman Filter) approach will be validated through two aspects:
Computer data simulation will be employed to compare the tracking performance of STF, STAKF, and STF-STAKF under scenarios involving abrupt process noise mutations. This analysis aims to verify the effectiveness of STF-STAKF in the presence of process noise mutations. Observational data of port street lighting illuminance, influenced by oceanic meteorological factors, will be utilized to compare the tracking performance of STF, STAKF, and STF-STAKF. This evaluation will further validate the effectiveness of STF-STAKF in real-world scenarios where both process noise and state value mutations occur simultaneously.The experimental Root Mean Square Error (RMSE) formula is:
The advantage of RMSE in measuring filter performance lies in its ability to effectively quantify the differences between predicted values and true values, providing an intuitive understanding of estimation errors and making it easier to identify situations of poor performance.
5.1 Computer data simulation
This part mainly uses computer numerical simulation examples to verify the effectiveness of combined filtering in the event of sudden changes in process noise. Since the research object of this study is extreme oceanic meteorological conditions, the relevant parameters may change suddenly in a short period of time, and the response scenarios mostly involve short-term parameter mutations and filter tracking. To analyze the tracking effect of the combined tracking filter when the process noise changes abruptly, the parameters and model of the simulation system are set as follows, and the filtering effect is analyzed.
The observation matrix and observed noise covariance are as follows:
define the process noise covariance as follows
The initial state vector and the initial state vector covariance are divided into:
In this subsection, computer simulation experiments are conducted by pre-setting parameters artificially, fixing certain model parameters (H, R and P), while configuring Q in a dynamic form to simulate an environment of abrupt process noise changes. The experimental interval is set to 1 second, and a total of 1000 Monte Carlo simulations are performed.
The following will compare the three filtering methods of the STF algorithm, the STAKF algorithm, and the fusion algorithm discussed in this paper, and analyze the filtering effects of the three.
In Figure 6, the root mean square error (RMSE) of both STAKF and combined filtering is lower than that of STF, indicating good tracking performance for STAKF, with the combined filtering curve being close to or slightly better than STAKF, demonstrating effective filtering.
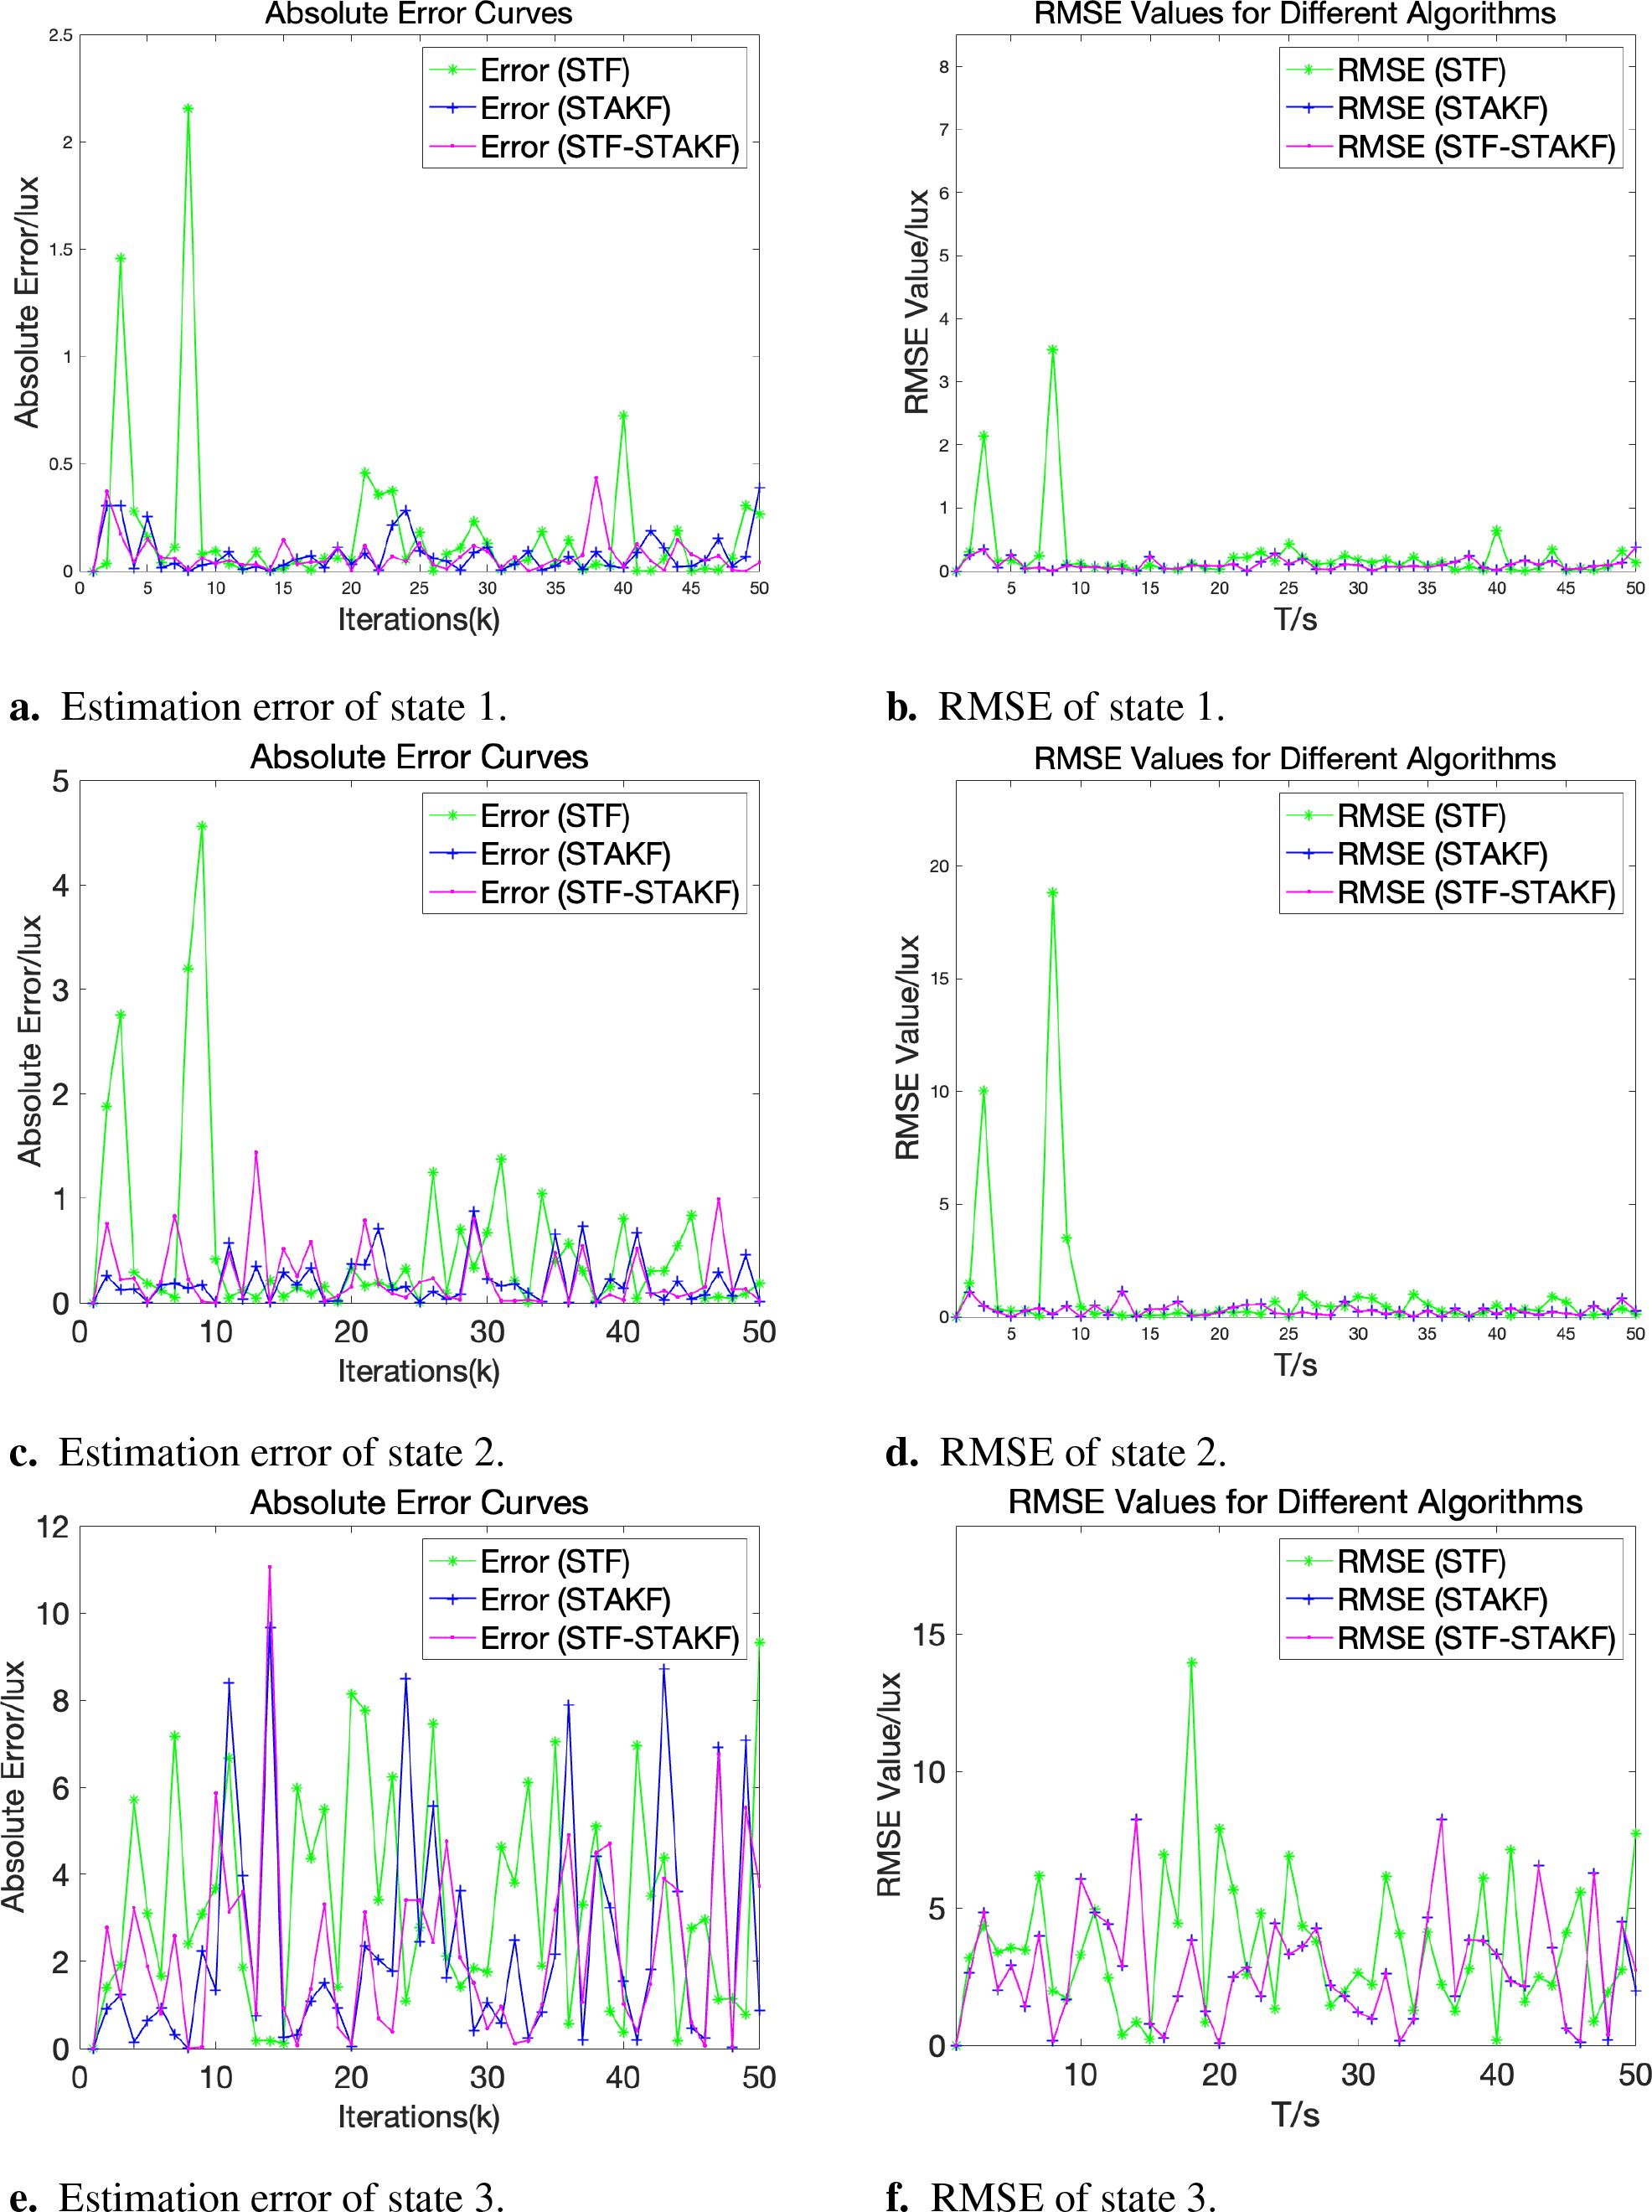
Figure 6. Estimation error. (A) Estimation error of state 1. (B) RMSE of state 1. (C) Estimation error of state 2. (D) RMSE of state 2. (E) Estimation error of state 3. (F) RMSE of state 3.
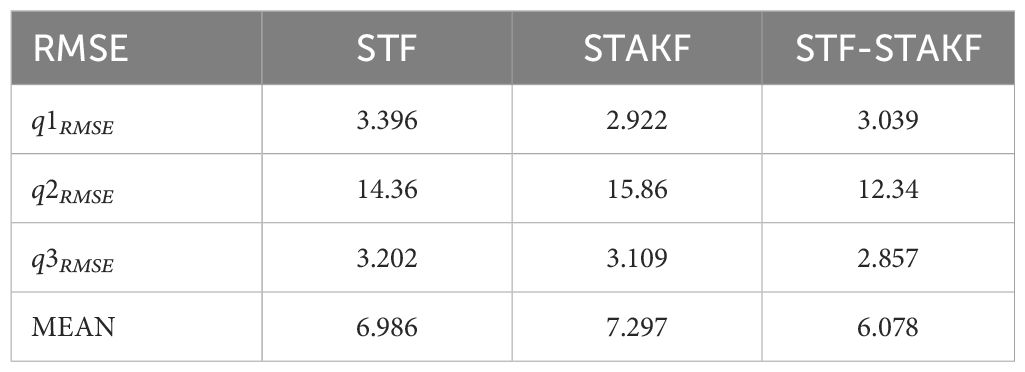
In cases of sudden changes in process noise, STAKF shows good filtering effects, and combined filtering can closely approach the STAKF curve in real time, often providing better tracking performance. This experiment verifies that under such conditions, the estimation error of STAKF is smaller than that of STF, with the overall root mean square error of combined filtering (refer to Table 1) being better than STAKF, achieving improved tracking effects.
5.2 Experiment on actual observational data of port street lighting under rain and fog conditions
This subsection uses actual observational data of port street lighting under rain and fog conditions to simulate and verify the effectiveness of the combined filter for tracking dimming in extreme oceanic weather conditions. Most of the street lighting and ocean weather data are sourced from the Qiandao Lake Research Institute and Guangdong Ocean University.
5.2.1 Single head streetlight
During extreme oceanic weather conditions such as rain and fog at the port, there may also be sudden changes in the observation data itself, leading to some uncertainty. This section analyzes the tracking effect of the fusion tracking filter when the observed data changes abruptly. Here, the change curve of streetlight dimming illuminance in rainy and foggy weather is selected to experiment with the tracking effect of combined filtering and illuminance. This observational data can be directly collected by the weather perception and video monitoring modules of the smart streetlights in the actual project. The photovoltaic panel on top is calculated simply.
This part of the experimental principle obtains the observational data of sudden changes in rainy and foggy weather by monitoring the illuminance of the nearest single-head streetlight using the monitoring device (refer to Figure 7), which does not affect the verification of the effectiveness of the combined strong tracking filter for tracking dimming in this experiment. In the actual project, the observational data obtained by adjusting the dynamic weights of turbidity after observing multiple streetlights or multi-head streetlights in the current weather (such as ELM), according to the actual streetlight placement and the position of the observation camera, can be used as the final observational data.
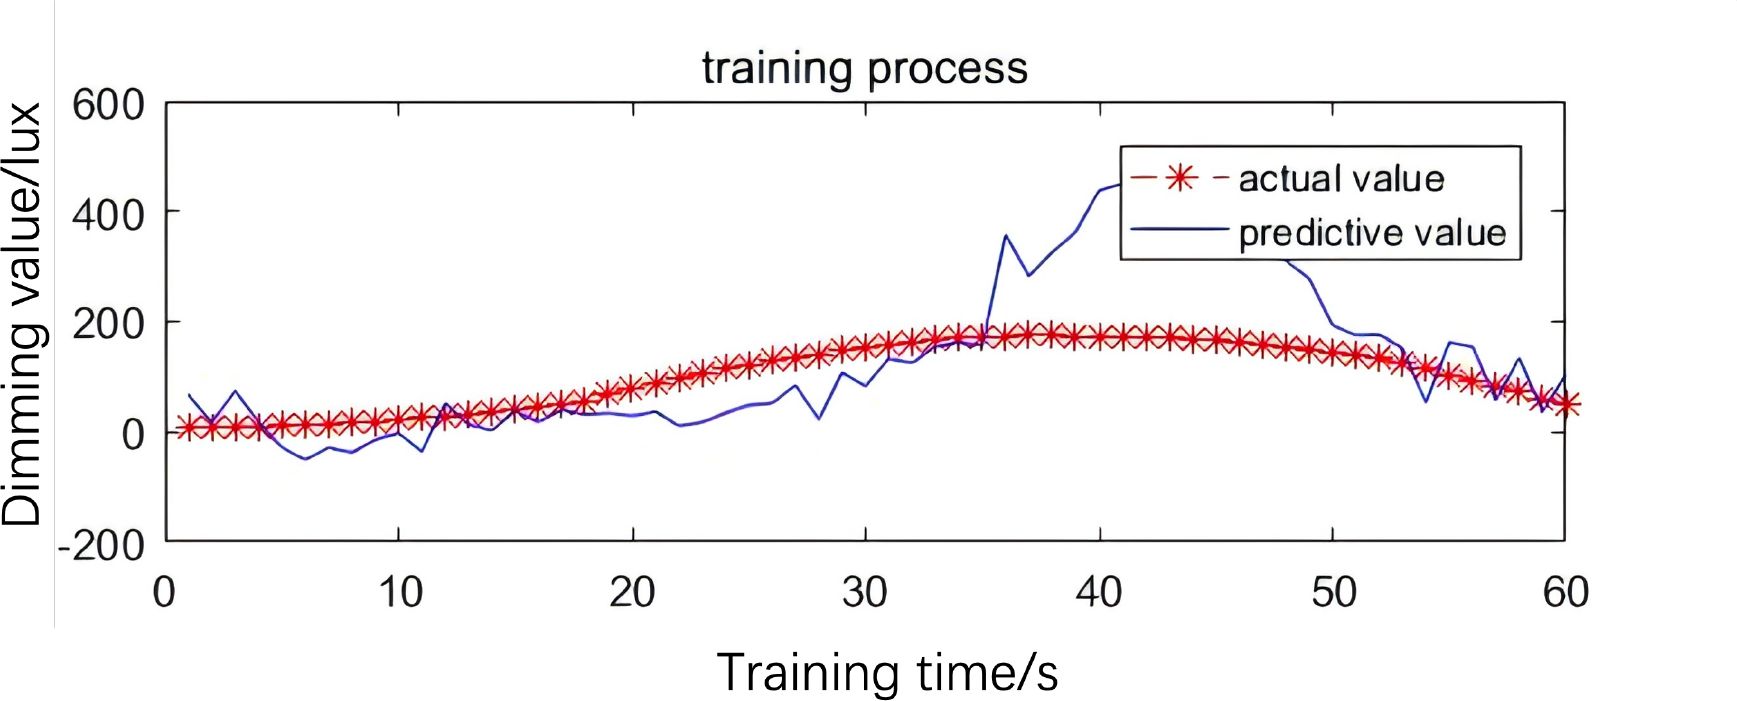
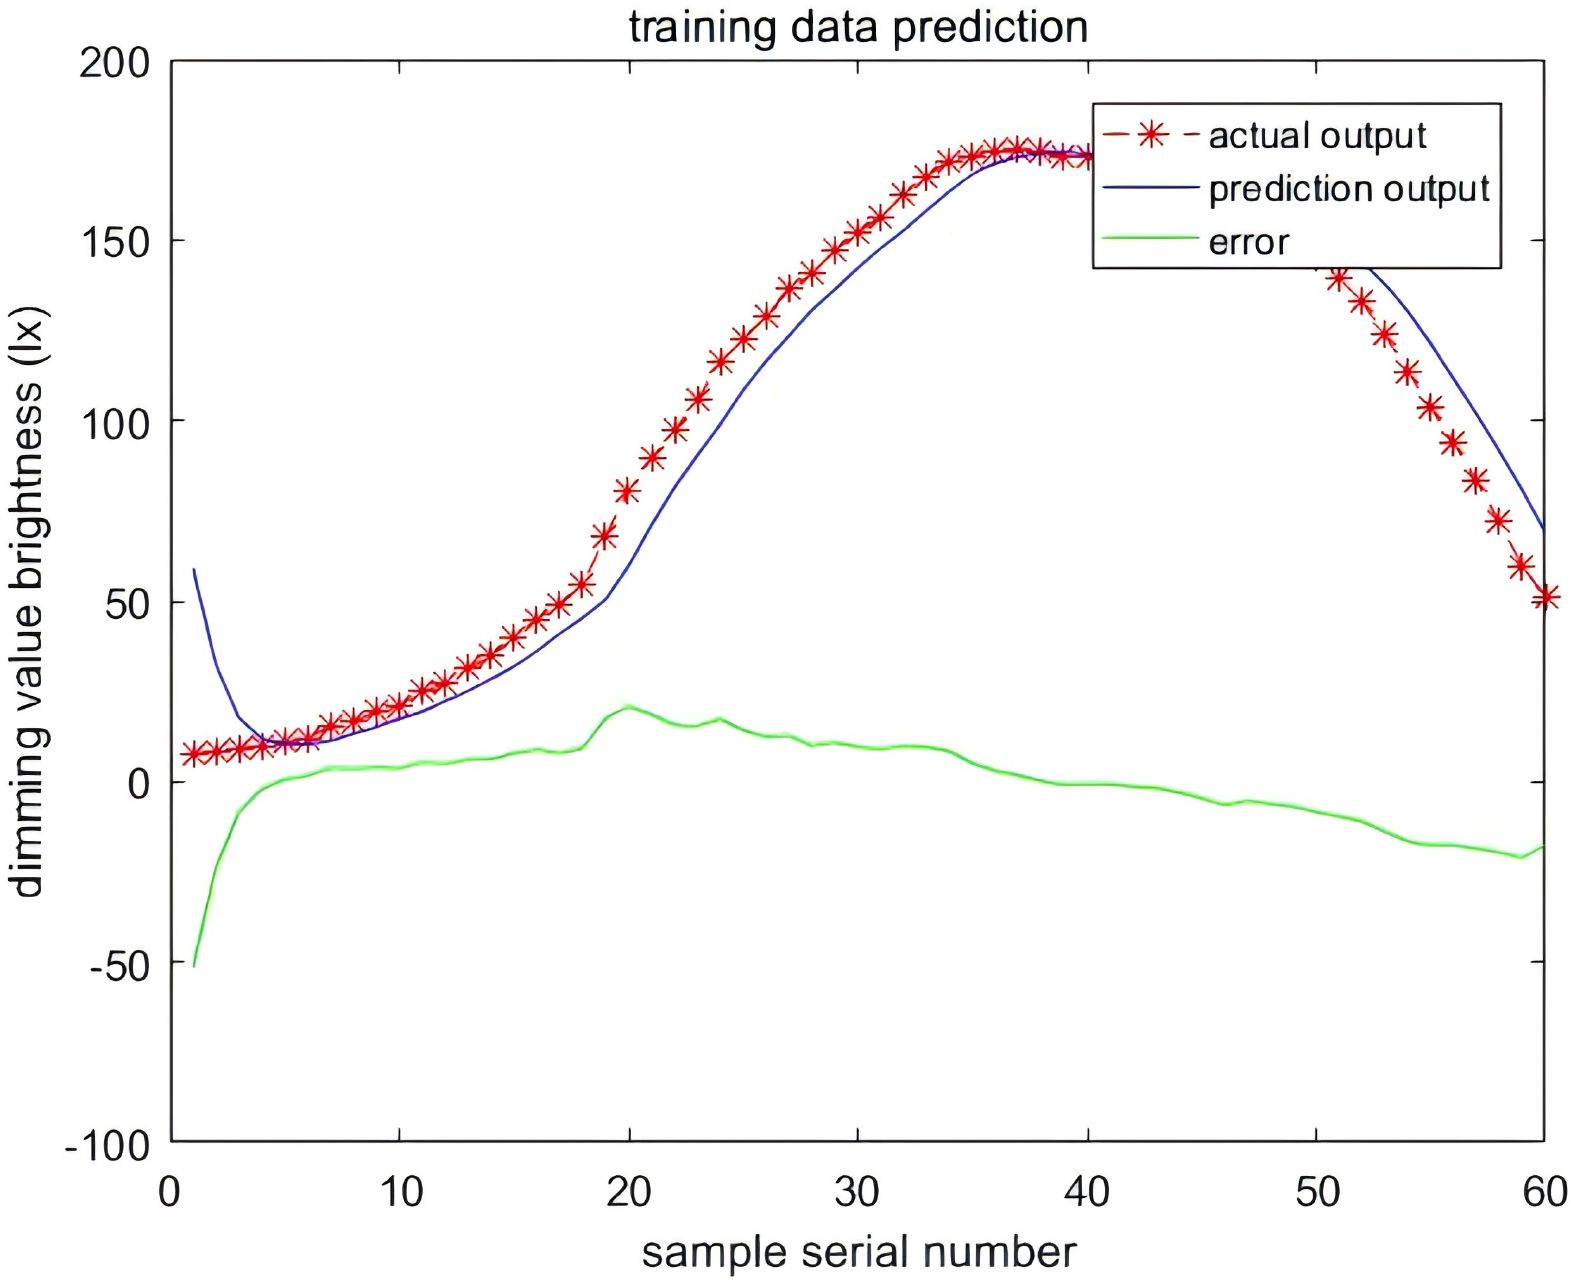
In calm and clear oceanic meteorological conditions, the adjustment of port streetlight brightness is related to factors such as traffic flow and the speed of port vehicles from morning to night. The experiment collected relevant information through the camera to detect the lighting output values when different port vehicle flows and speeds were matched. The lighting output calculation program is developed based on PSO-FNN. As shown in Figure 8, the lighting trend meets the requirements for urban lighting energy conservation control. To better reduce the residues between actual and predicted values, the residues were optimized using BLS. The results are shown in Figure 9. This method can effectively fit the actual port streetlights based on small experimental samples.
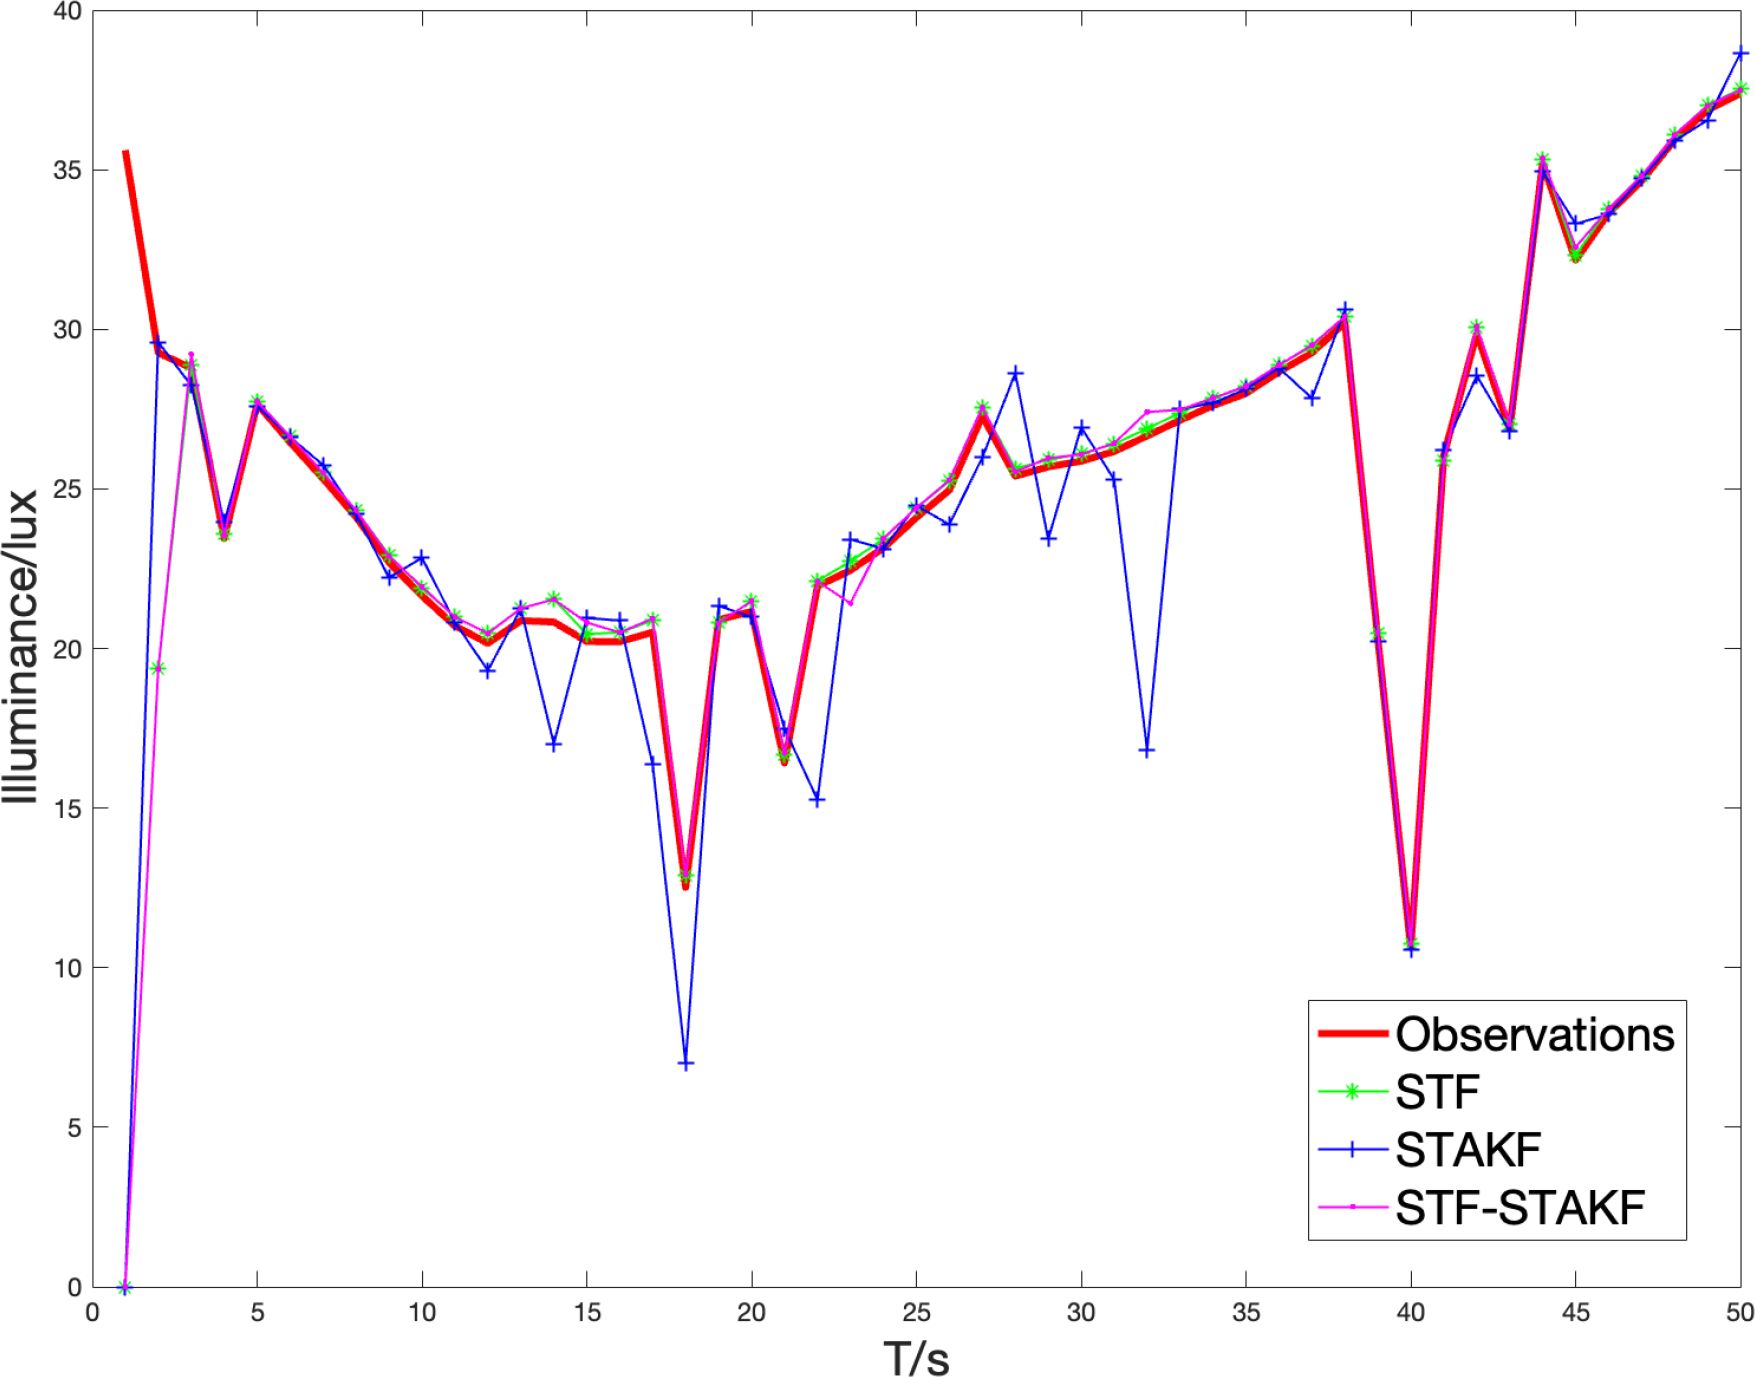
In rainy and foggy weather, the size of air particles changes, fog suddenly appears and disappears, natural illuminance suddenly increases and decreases, and the extinction coefficient changes abruptly. These factors lead to sudden changes in the observed values. Through the video surveillance system installed under the smart streetlight, the above factors and turbidity τ in rainy and foggy weather were estimated. Figure 10 shows the change curve of the observation data of streetlight illumination and the filtered curve during rainy and foggy conditions over a short period.
As shown in Figure 11, when the observation data is abrupt, the tracking effect of STF is better than that of STAKF, and the combined filtering has a conservative tracking effect, positioned between STF and STAKF at this time. According to Table 2, the overall estimation error of the combined filter is better than that of STF when observed mutations occur. From this, it can be predicted that when multiple observations undergo mutations, the estimation error of combined filtering will increasingly approach and exceed the current optimal filtering.
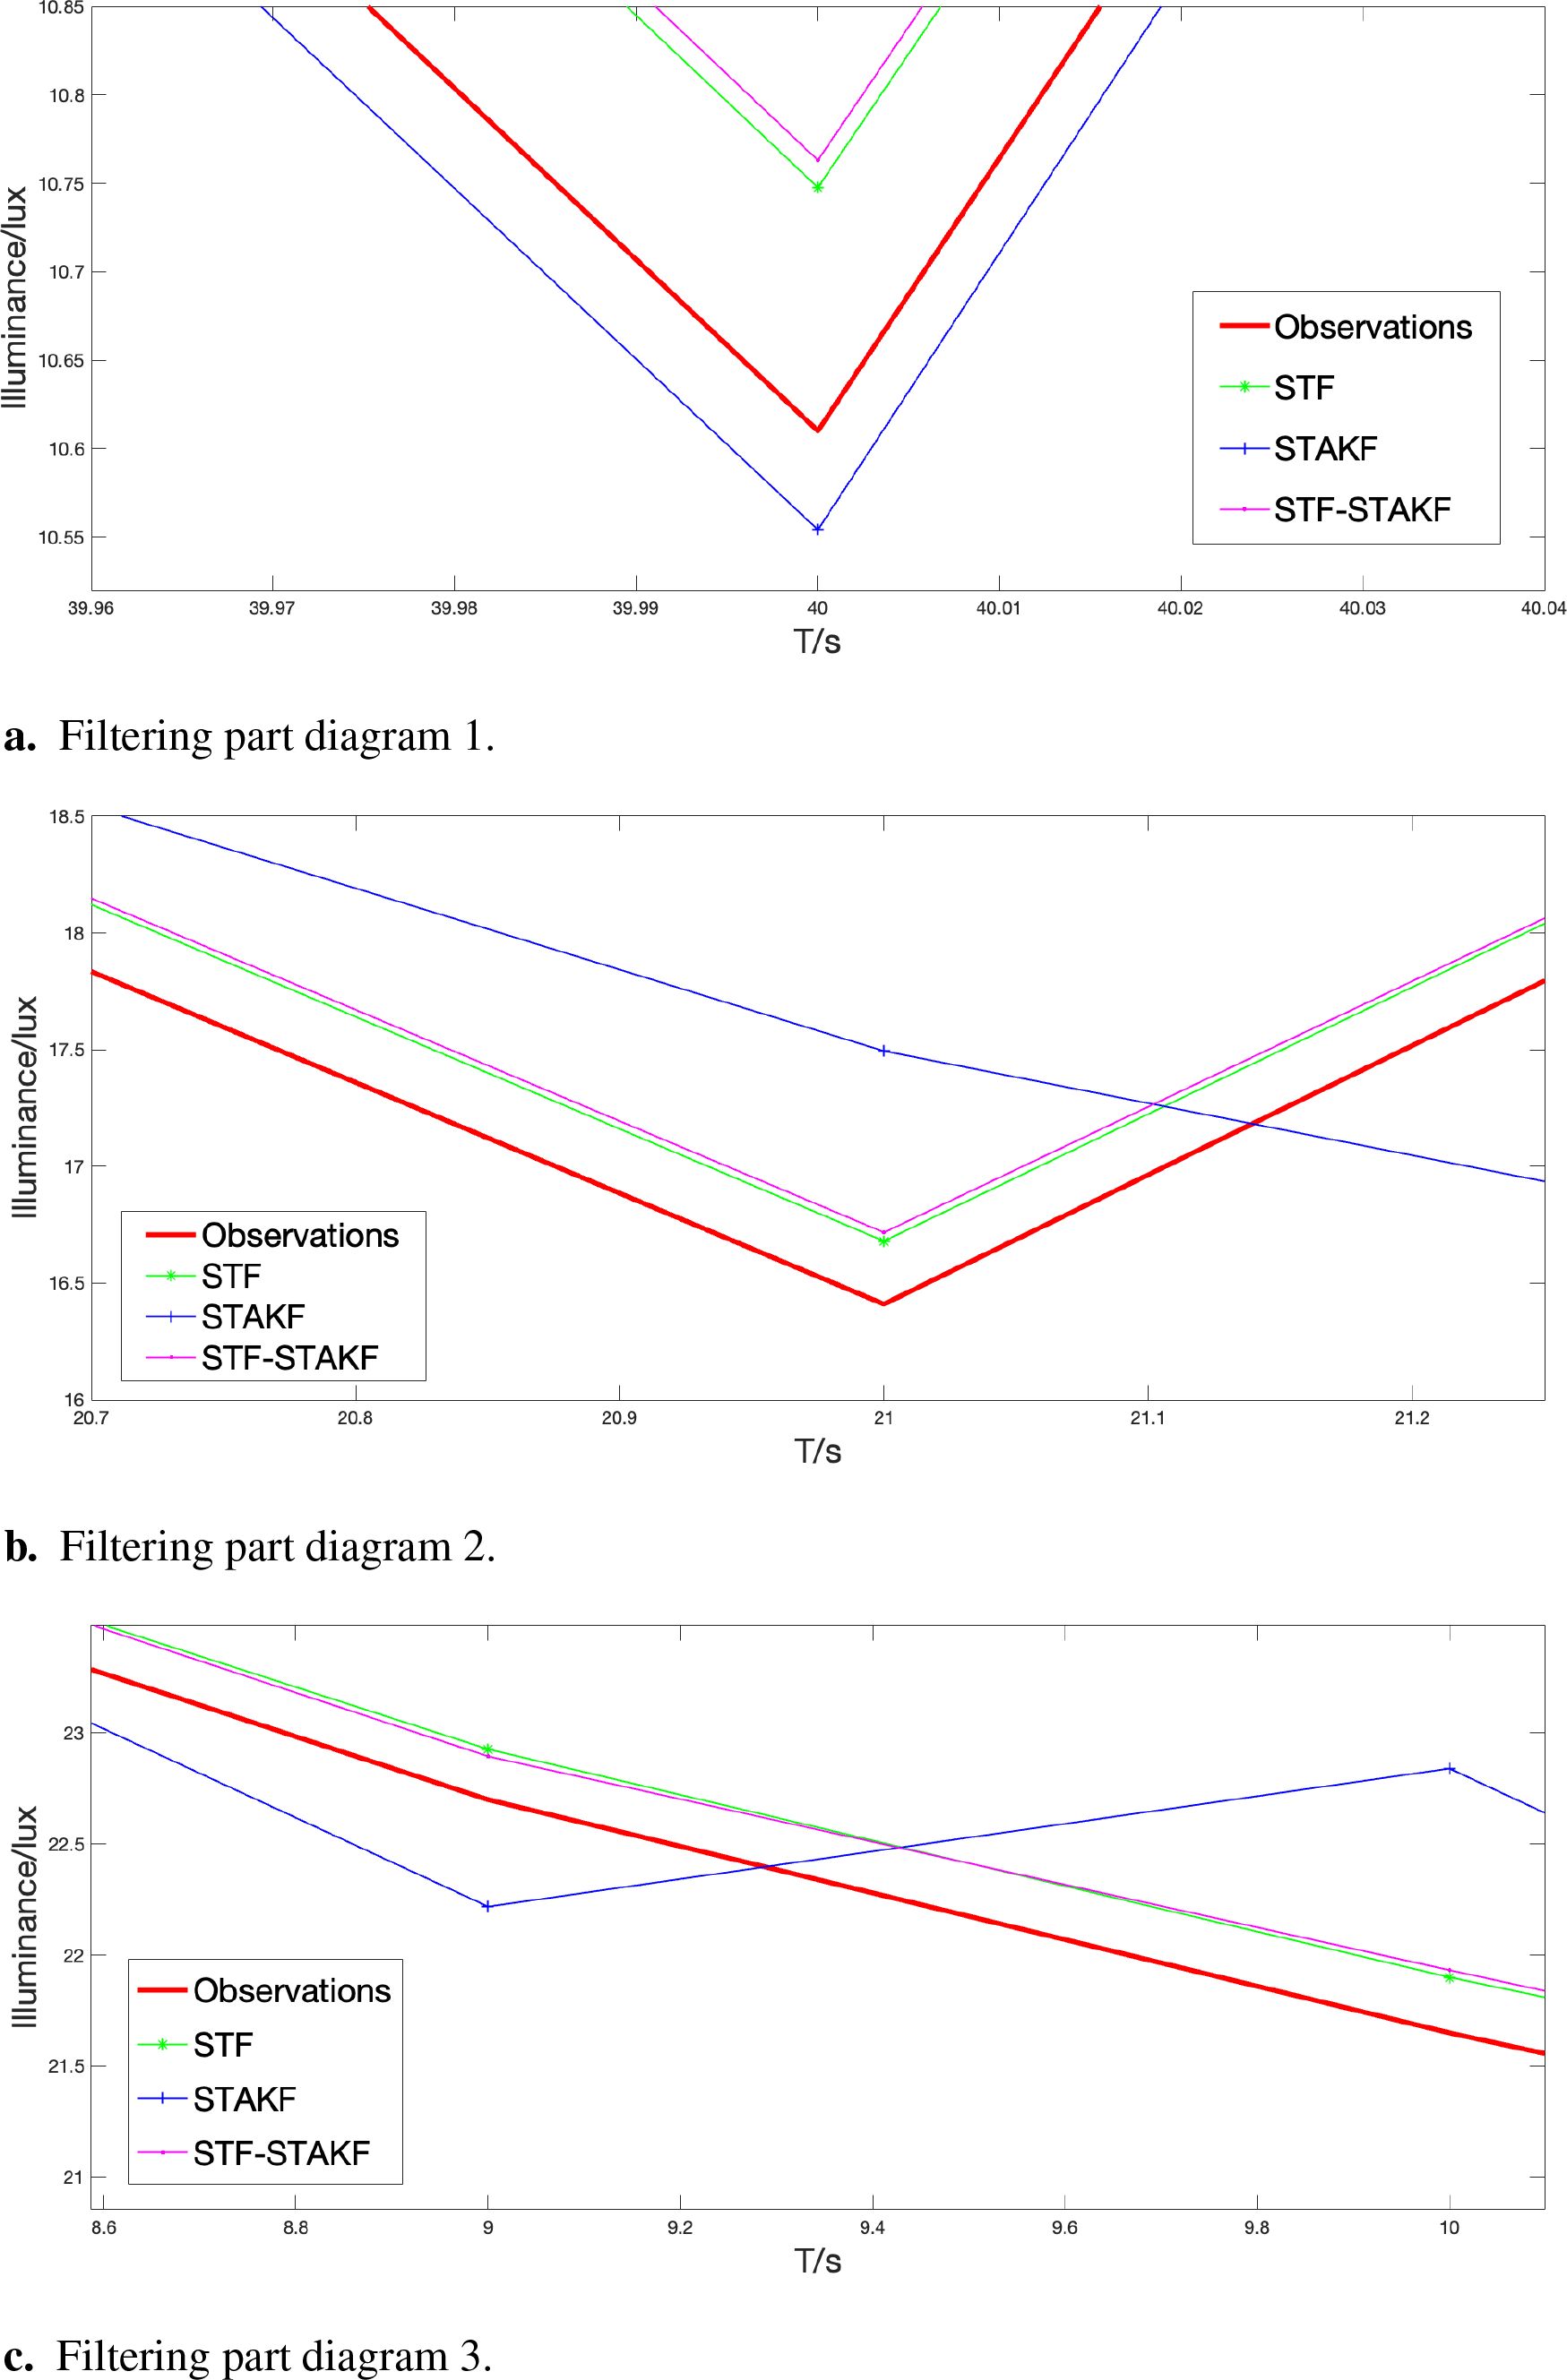
Figure 11. Filtering part diagram. (A) Filtering part diagram 1. (B) Filtering part diagram 2. (C) Filtering part diagram 3.
This experiment verifies that the estimation error of STF is smaller than that of STAKF in the case of sudden changes in extreme weather observation data, with STF showing better tracking performance at that time. The combined filtering curve lies between the STF and STAKF curves during abrupt changes (as shown in Figure 11), and the overall root mean square error of the combined filtering (see Table 2) is better than that of STF, achieving improved tracking effects.
5.2.2 Multiple streetlights
Since, in extreme oceanic weather conditions, any possible situation is unpredictable, data exchange between multiple port streetlights may sometimes fail to work for special reasons, preventing effective communication of the average illumination of the surrounding environment. Under this assumption, three adjacent streetlights are dimmed and tracked using the same method as described in section 5.2.1, and the noise parameters are as follows (This data is sourced from Guangdong Ocean University, and the relevant parameters were obtained by collecting hardware information from three adjacent smart streetlights):
Through preprocessing and noise simulation of the actual data collected, each streetlight is independently estimated based on the processed data, and its observational data is dynamically affected by the dimming of other streetlights. When both the observational data and noise are abrupt, the dimming error of the three filters after 50 Monte Carlo simulations is shown in Figure 12 and Table 3, with the error of combined filtering being significantly smaller than that of STF and STAKF. This demonstrates that in extreme oceanic climate conditions, whether it is a single-head streetlight under data interconnection or multiple streetlights under data interconnection, combined filtering exhibits a certain effectiveness and versatility, effectively addressing the impacts of extreme weather.
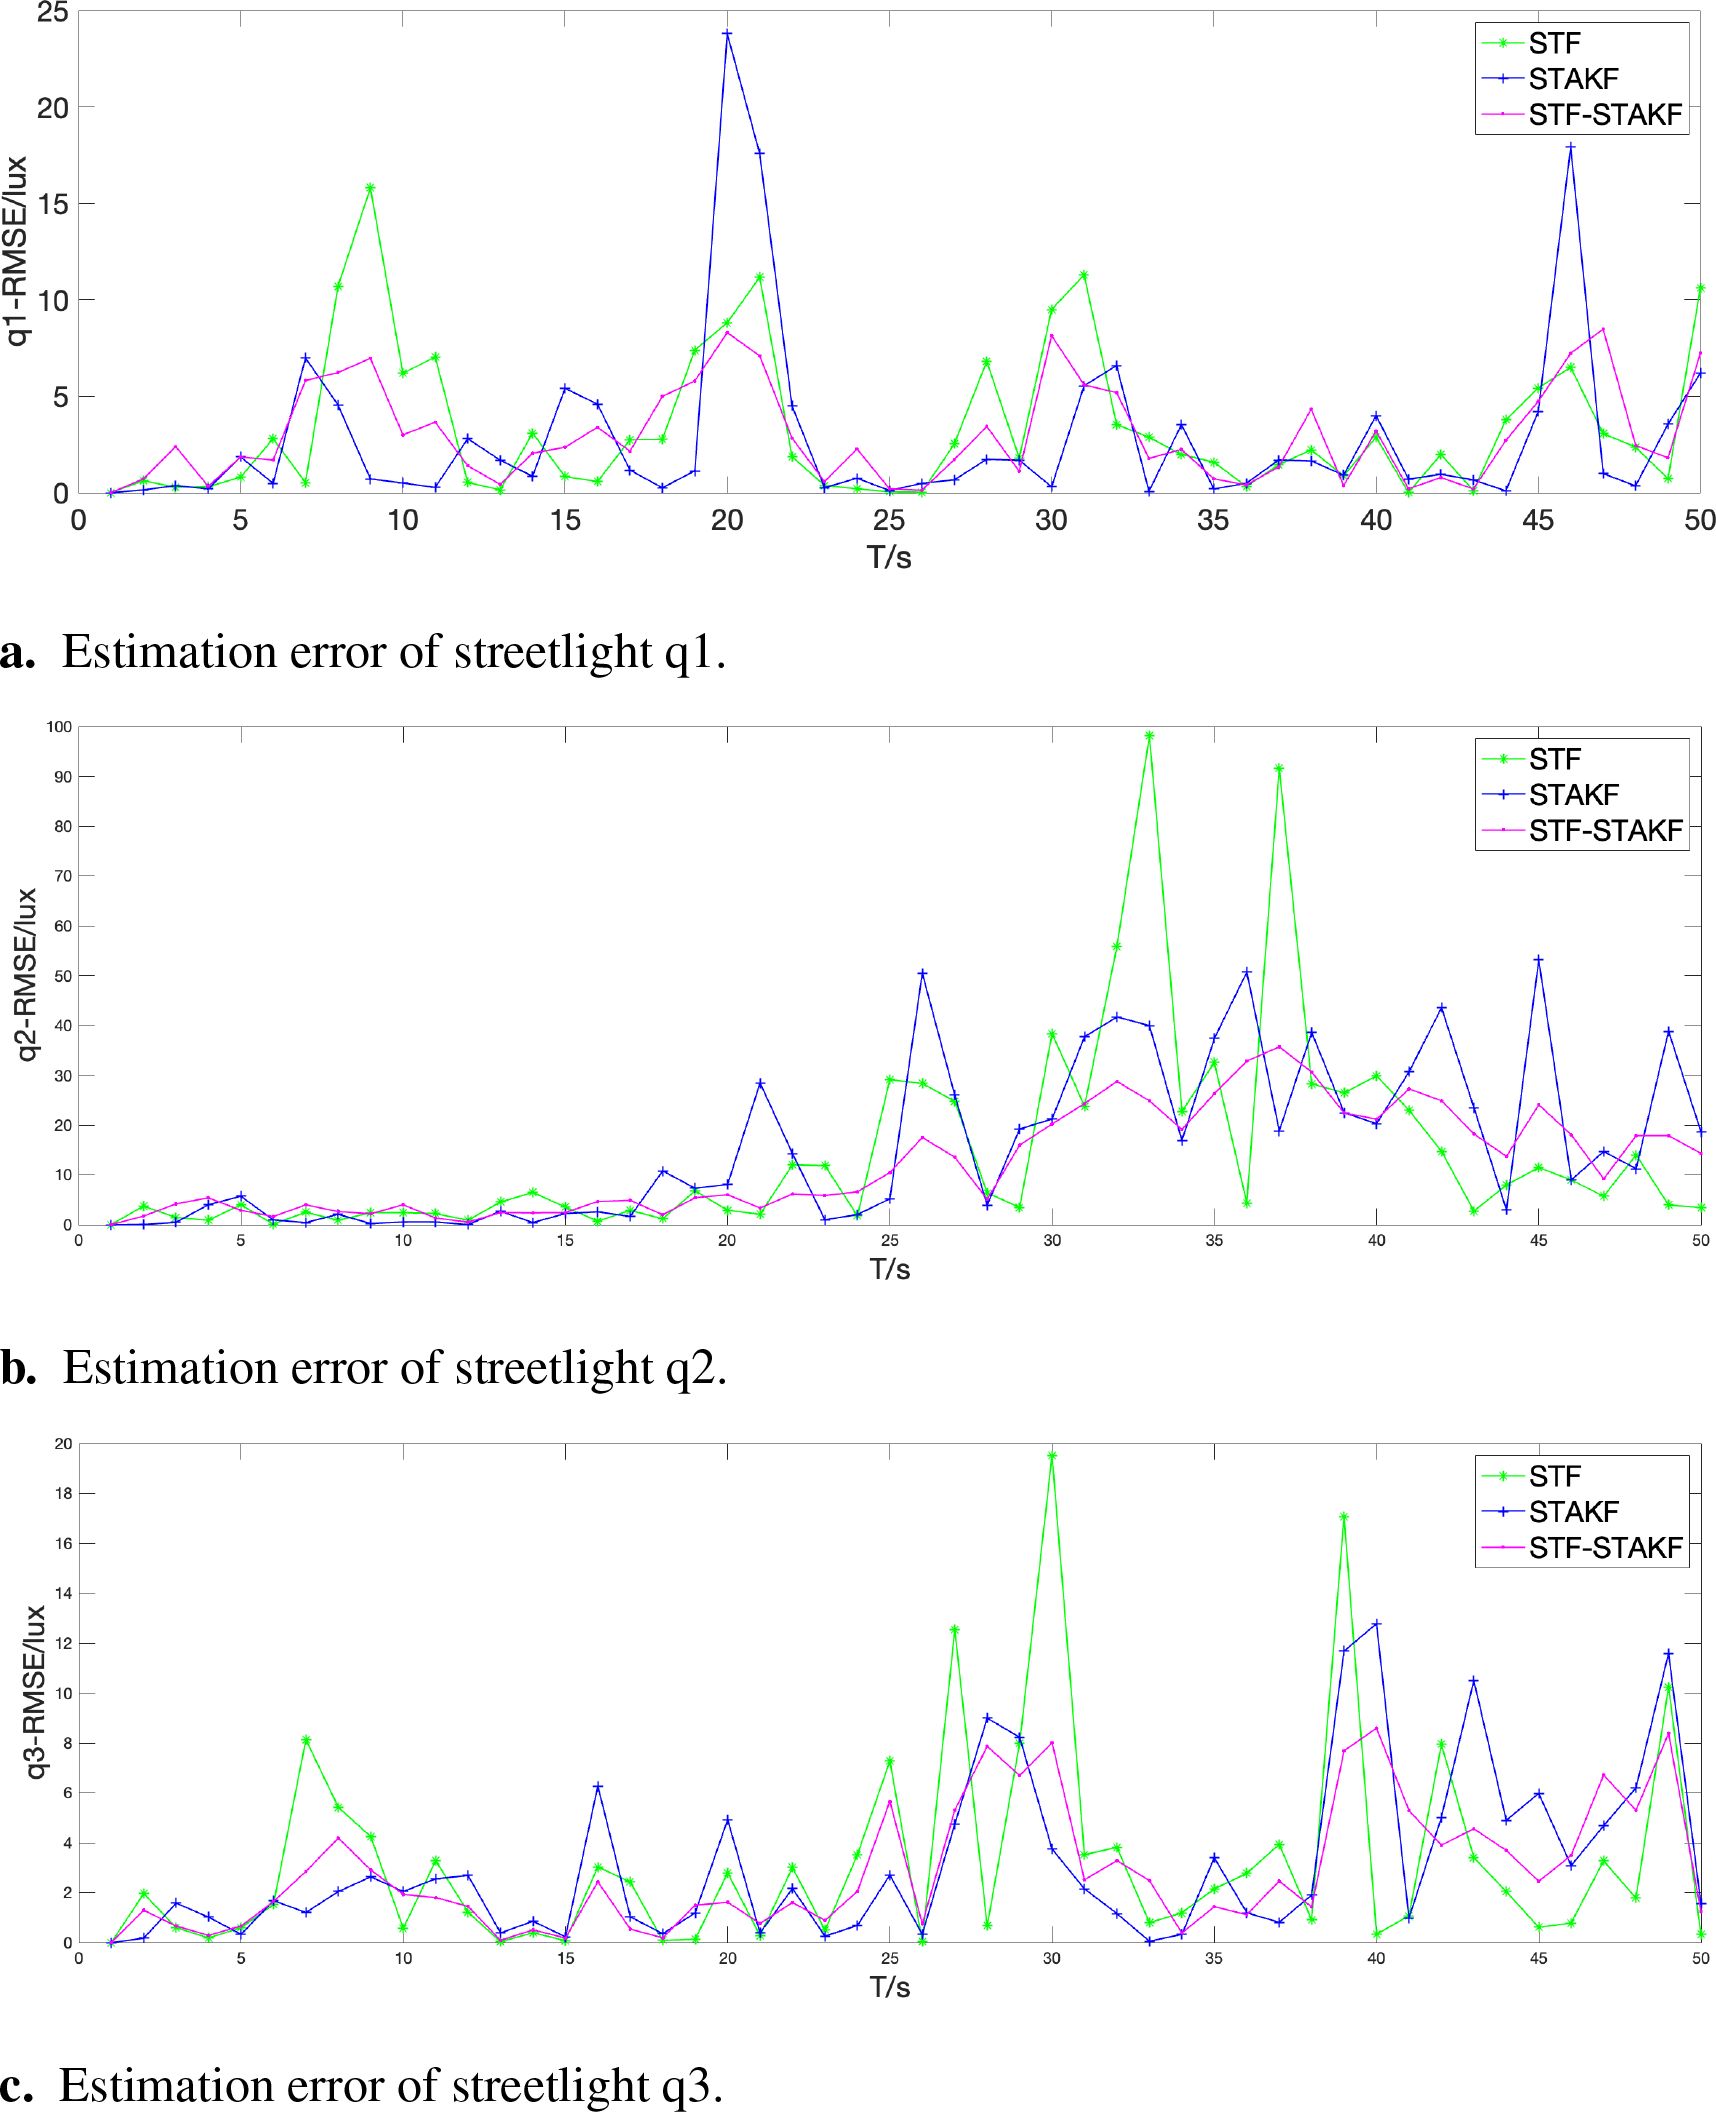
Figure 12. Estimation error of streetlight. (A) Estimation error of streetlight q1. (B) Estimation error of streetlight q2. (C) Estimation error of streetlight q3.
6 Conclusions
Under challenging conditions influenced by various factors, the causes of visibility mutations in coastal ports typically stem from the weather’s impact on the environment surrounding the port streetlights. When the mutation arises from process noise, STF-STAKF can closely approximate the current optimal STF in real-time and outperform STF in most states. When the mutation arises from the state value itself, observation noise, and process noise, the combined filtering approach can dynamically approach and surpass the current optimal tracking performance of STAKF. Experimental data from STF-STAKF demonstrate its overall real-time tracking performance, closely approximating and exceeding the current optimal filtering method. This tracking performance is highly suitable for scenarios with unknown mutations in extreme oceanic climate conditions. Moreover, due to limited computational resources at the edge of the port streetlight network, the proposed STF-STAKF approach can effectively utilize edge computing power to implement adaptive dimming at the edge. Considering that the dimming basis of port streetlights in actual projects will be based on regulations and standards stipulated by the state, the dimming standards should be set according to the environmental regulations of the streetlights. In practical engineering, the calculation methods for pavement materials, reflection coefficients, and brightness distribution have been studied in more detail, allowing for more accurate initial estimates and calibration judgments. However, these corrections do not affect the core idea of this paper, and it can be considered to further improve accuracy by combining and comparing more actual data in larger-scale application processes.
Data availability statement
The raw data supporting the conclusions of this article will be made available by the authors, without undue reservation.
Author contributions
HJ: Funding acquisition, Investigation, Methodology, Resources, Writing – review & editing. XZ: Conceptualization, Data curation, Formal analysis, Project administration, Software, Writing – original draft, Writing – review & editing. ZZ: Supervision, Writing – review & editing. JJ: Validation, Writing – review & editing.
Funding
The author(s) declare financial support was received for the research, authorship, and/or publication of this article. The work was supported in part by the National Natural Science Foundation of China under Grant 62272109.
Acknowledgments
We would like to thank Guangdong Ocean University and Qiandao Lake Research Institute for their support and contributions to this study.
Conflict of interest
The authors declare that the research was conducted in the absence of any commercial or financial relationships that could be construed as a potential conflict of interest.
Publisher’s note
All claims expressed in this article are solely those of the authors and do not necessarily represent those of their affiliated organizations, or those of the publisher, the editors and the reviewers. Any product that may be evaluated in this article, or claim that may be made by its manufacturer, is not guaranteed or endorsed by the publisher.
References
Al-Behadili A. A., Al-Taai O. T., Al-Muhyi A. H. A. (2023). “Impact of weather on marine vessel accidents in the Iraqi port of umm qasr, a case study of the salihiah tugboat accident,” in IOP Conference Series: Earth and Environmental Science, Vol. 1158. 032008 (Bristol, UK: IOP Publishing).
Bojesomo A., Al-Marzouqi H., Liatsis P., Cong G., Ramanath M. (2021). “Spatiotemporal swin-transformer network for short time weather forecasting,” in Proceedings of the (CIKM) 2021 Workshops co-located with 30th (ACM) International Conference on Information and Knowledge Management (CIKM 2021), Gold Coast, Queensland, Australia, November 1-5, 2021. (Gold Coast, Australia: Central Europe (CEUR) Workshop).
Bowden K. A., Heinselman P. L. (2016). A qualitative analysis of nws forecasters’ use of phased-array radar data during severe hail and wind events. Weather Forecasting 31, 43–55. doi: 10.1175/WAF-D-15-0089.1
Bruce C. W., Yee Y. P., Jennings S. (1980). In situ measurement of the ratio of aerosol absorption to extinction coefficient. Appl. Optics 19, 1893–1894. doi: 10.1364/AO.19.001893
Cao C., Bao L., Gao G., Liu G., Zhang X. (2024). A novel method for ocean wave spectra retrieval using deep learning from sentinel-1 wave mode data. IEEE Trans. Geosci. Remote Sens. 62, 1–16. doi: 10.1109/TGRS.2024.3369080
Clarke B., Otto F., Stuart-Smith R., Harrington L. (2022). Extreme weather impacts of climate change: an attribution perspective. Environ. Res.: Climate 1, 012001. doi: 10.1088/2752-5295/ac6e7d
Claser R., Nascimento V. H. (2021). On the tracking performance of adaptive filters and their combinations. IEEE Trans. Signal Process. 69, 3104–3116. doi: 10.1109/TSP.2021.3081045
De Paz J. F., Bajo J., Rodr´ıguez S., Villarrubia G., CorChado J. M. (2016). Intelligent system for lighting control in smart cities. Inf. Sci. 372, 241–255. doi: 10.1016/j.ins.2016.08.045
Galbraith D., Grosjean L. (2019). “Wind-alarm systems: Emerging observing technologies for port operations,” in Australasian Coasts and Ports 2019 Conference: Future directions from 40 [degrees] S and beyond, Hobart, 10-13 September 2019: Future directions from 40 [degrees] S and beyond, Hobart, 10-13 September 2019 (Hobart: Engineers Australia), 418–423.
Gao G., Bai Q., Zhang C., Zhang L., Yao L. (2023a). Dualistic cascade convolutional neural network dedicated to fully polsar image ship detection. ISPRS J. Photogrammetry Remote Sens. 202, 663–681. doi: 10.1016/j.isprsjprs.2023.07.006
Gao G., Dai Y., Zhang X., Duan D., Guo F. (2023b). Adcg: A cross-modality domain transfer learning method for synthetic aperture radar in ship automatic target recognition. IEEE Trans. Geosci. Remote Sens. 61, 1–14. doi: 10.1109/TGRS.2023.3313204
Gao G., Yao B., Li Z., Duan D., Zhang X. (2024). Forecasting of sea surface temperature in eastern tropical pacific by a hybrid multiscale spatial–temporal model combining error correction map. IEEE Trans. Geosci. Remote Sens. 62, 1–22. doi: 10.1109/TGRS.2024.3353288
Gao C., Zhang X., Xu Y., Wang Z., Melgosa M., Quesada-Molina J. J., et al. (2018). Theoretical consideration on convergence of the fixed-point iteration method in cie mesopic photometry system mes2. Optics Express 26, 31351–31362. doi: 10.1364/OE.26.031351
Gao G., Zhang C., Zhang L., Duan D. (2023c). Scattering characteristic-aware fully polarized sar ship detection network based on a four-component decomposition model. IEEE Trans. Geosci. Remote Sens. 61, 1–22. doi: 10.1109/TGRS.2023.3336300
Ge Q., Shao T., Duan Z., Wen C. (2016). Performance analysis of the kalman filter with mismatched noise covariances. IEEE Trans. Automatic Control 61, 4014–4019. doi: 10.1109/TAC.2016.2535158
Gledhill R. (1962). Particle-size distribution determination by turbidimetry. J. Phys. Chem. 66, 458–463. doi: 10.1021/j100809a021
Han C., Zhu H., Duan Z. (2006). Multi-source Information Fusion (Beijing, China: Tsinghua University Press).
He R., Wan C., Jiang X. (2021). “Risk management of port operations: A systematic literature review and future directions,” in 2021 6th International Conference on Transportation Information and Safety (ICTIS). (Wuhan, China: IEEE), 44–51.
Ito K., Kang Y., Zhang Y., Zhang F., Biljecki F. (2024). Understanding urban perception with visual data: A systematic review. Cities 152, 105169. doi: 10.1016/j.cities.2024.105169
Izaguirre C., Losada I. J., Camus P., Vigh J. L., Stenek V. (2021). Climate change risk to global port operations. Nat. Climate Change 11, 14–20. doi: 10.1038/s41558-020-00937-z
Jaskowski P., Tomczuk P., Chrzanowicz M. (2022). Construction of a measurement system with gps rtk for operational control of street lighting. Energies 15, 9106. doi: 10.3390/en15239106
Li Z., Xu G., Cheng Y., Wang Z., Wu Q., Yan F. (2020). Spatially adaptive hybrid variational model for temperature-dependent nonuniformity correction of infrared images. Optical Eng. 59, 123103–123103. doi: 10.1117/1.OE.59.12.123103
Liu R., Liang Z., Yang K., Li W. (2022). Machine learning based visible light indoor positioning with single-led and single rotatable photo detector. IEEE Photonics J. 14, 1–11. doi: 10.1109/JPHOT.2022.3163415
Muhamad M., Ali M. M. (2018). “Iot based solar smart led street lighting system,” in TENCON 2018 - 2018 IEEE Region 10 Conference. (Jeju, Korea (South): IEEE), 1801–1806.
Or B., Bobrovsky B.-Z., Klein I. (2021). Kalman filtering with adaptive step size using a covariancebased criterion. IEEE Trans. Instrumentation Measurement 70, 1–10. doi: 10.1109/TIM.19
Pham T. Y. (2023). A smart port development: Systematic literature and bibliometric analysis. Asian J. Shipping Logistics 39, 57–62. doi: 10.1016/j.ajsl.2023.06.005
Prousalidis J., Kanellos F., Lyridis D., Dallas S., Spathis D., Georgiou V., et al. (2019). “Optimizing the operation of port energy systems,” in 2019 IEEE International Conference on Environment and Electrical Engineering and 2019 IEEE Industrial and Commercial Power Systems Europe (EEEIC / I&CPS Europe). (Genova, Italy: IEEE), 1–6.
Saeik F., Avgeris M., Spatharakis D., Santi N., Dechouniotis D., Violos J., et al. (2021). Task offloading in edge and cloud computing: A survey on mathematical, artificial intelligence and control theory solutions. Comput. Networks 195, 108177. doi: 10.1016/j.comnet.2021.108177
Shao T., Duan Z., Tian Z. (2021). Performance ranking of kalman filter with pre-determined initial state prior. IEEE Signal Process. Lett. 28, 902–906. doi: 10.1109/LSP.2021.3071979
Sifakis N., Kalaitzakis K., Tsoutsos T. (2021). Integrating a novel smart control system for outdoor lighting infrastructures in ports. Energy Conversion Manage. 246, 114684. doi: 10.1016/j.enconman.2021.114684
Sun Q. (2019). Opening time control method of port building lighting based on artificial intelligence. J. Coast. Res. 93, 335–340. doi: 10.2112/SI93-044.1
Wang A., Xiang M., Chen W., Chen D. (2019). Exploration into the development of smart cities and the application of smart light poles (Zhao, Xiaolong, Trans). Light Lighting 43, 33–37. doi: CNKI:SUN:LAMP.0.2019-01-009
Yang Z., Kagawa S., Li J. (2021). Do greenhouse gas emissions drive extreme weather conditions at the city level in China? evidence from spatial effects analysis. Urban Climate 37, 100812. doi: 10.1016/j.uclim.2021.100812
Yau K.-L. A., Peng S., Qadir J., Low Y.-C., Ling M. H. (2020). Towards smart port infrastructures: Enhancing port activities using information and communications technology. IEEE Access 8, 83387–83404. doi: 10.1109/ACCESS.2020.2990961
Zhang C., Lu Y. (2021). Study on artificial intelligence: The state of the art and future prospects. J. Ind. Inf. Integration 23, 100224. doi: 10.1016/j.jii.2021.100224
Zhang C., Zhang X., Gao G., Lang H., Liu G., Cao C., et al. (2024). Development and application of ship detection and classification datasets: A review. IEEE Geosci. Remote Sens. Magazine, 2–36. doi: 10.1109/MGRS.2024.3450681
Zhou Y. (2018). Urban management based on the internet of lights (Zhao, Xiaolong, Trans). Shanghai Informatization 05, 48–52. doi: CNKI:SUN:SHXX.0.2018-05-014
Keywords: extreme weather, port streetlights, Internet of Things (IoT), combined filtering, adaptive dimming
Citation: Jiang H, Zhao X, Zhang Z and Ji J (2024) Research on adaptive dimming management methods for intelligent lighting systems in port traffic based on ocean weather perception. Front. Mar. Sci. 11:1493275. doi: 10.3389/fmars.2024.1493275
Received: 08 September 2024; Accepted: 28 October 2024;
Published: 20 November 2024.
Edited by:
Yu Jiang, Jilin University, ChinaReviewed by:
Alberto Alberello, University of East Anglia, United KingdomGui Gao, Southwest Jiaotong University, China
Copyright © 2024 Jiang, Zhao, Zhang and Ji. This is an open-access article distributed under the terms of the Creative Commons Attribution License (CC BY). The use, distribution or reproduction in other forums is permitted, provided the original author(s) and the copyright owner(s) are credited and that the original publication in this journal is cited, in accordance with accepted academic practice. No use, distribution or reproduction is permitted which does not comply with these terms.
*Correspondence: Xiaolong Zhao, MjEwMzIxMDUwMzQ5QHN0dS5oYXVzdC5lZHUuY24=
†These authors have contributed equally to this work and share first authorship
 Haoyu Jiang
 Xiaolong Zhao
 Zeguo Zhang1