- 1Remote Sensing Detection Technology Center, Donghai Laboratory, Zhoushan, Zhejiang, China
- 2Ocean College, Zhejiang University, Zhoushan, Zhejiang, China
- 3Zhejiang Ecological Environment Monitoring Center, Hangzhou, Zhejiang, China
- 4State Key Laboratory of Satellite Ocean Environment Dynamics, Second Institute of Oceanography, Ministry of Natural Resources, Hangzhou, Zhejiang, China
Introduction: The Geostationary Ocean Color Imager-II (GOCI-II), launched on February 19, 2020, offers increased observation times throughout the day and higher spatial resolution compared to its predecessor, the Geostationary Ocean Color Imager (GOCI), launched in 2010. To ensure the reliability of GOCI-II data for practical applications, the accuracy of remote sensing products needs to be validated. This study uses in situ data from Lake Taihu for validation.
Methods: We assessed the accuracy of GOCI-II remote sensing products, including remote sensing reflectance derived using two atmospheric correction algorithms: ultraviolet (UV) and near-infrared (NIR). The study also evaluated the accuracy of derived parameters, such as chlorophyll-a (Chl-a) concentration, total suspended matter (TSM) concentration, and phytoplankton absorption coefficient (aph), based on these atmospheric correction algorithms. In situ measurements from Lake Taihu were used as ground truth data for validation.
Results: Our results revealed that the UV atmospheric correction algorithm provided higher accuracy in Lake Taihu compared to the NIR algorithm. The average absolute percentage deviations (APDs) for remote sensing reflectance across different bands were: 25.17% (412 nm), 29.69% (443 nm), 22.27% (490 nm), 19.38% (555 nm), 36.83% (660 nm), and 33.0% (680 nm). Compared to NIR-derived products, the UV algorithm showed improved accuracy for Chl-a concentration, TSM concentration, and aph, with reductions in APD values by 16.92%, 3.32%, and 10.91%, respectively. When applying UV correction, the 412 nm band performed better than the 380 nm band, likely due to a lower signal-to-noise ratio at 380 nm and smaller extrapolation errors at 412 nm.
Discussion: While the NIR algorithm is suitable for open ocean waters, the UV algorithm demonstrated higher accuracy in turbid environments such as Lake Taihu. Therefore, a combined UV-NIR atmospheric correction algorithm may be more effective for handling various types of water environments. Additionally, further research is needed to develop more suitable retrieval algorithms for Chl-a concentration and aph in eutrophic waters to improve accuracy.
1 Introduction
Launched on February 19, 2020, the Geostationary Ocean Color Imager-II (GOCI-II) exhibits an observation coverage of 2,500×2,500 km2, with observation times from 7:15 AM to 4:15 PM (Beijing time), thereby offering hourly observations. The observation center is positioned at (130°E, 36°N) (Yang et al., 2018; Shin et al., 2021; Kang et al., 2022; Kim et al., 2023). Compared with its predecessor, the Geostationary Ocean Color Imager (GOCI) launched in 2010 (Ding et al., 2024; Li H. et al., 2020; Hu et al., 2019), the GOCI-II provides extended observation durations (10 observations daily), an increased spatial resolution (250 m × 250 m), and an expanded spectral range from 8 to 12 bands (Kim et al., 2022; Ahn and Park, 2020), thus offering greater support for monitoring diurnal variations in the water environment.
To ensure the reliability of GOCI-II data for practical applications, rigorous accuracy verification for remote sensing products is essential. Ahn and Park (2020) evaluated the accuracy of three atmospheric correction algorithms via the spectral relationships between the near-infrared (NIR) bands of 620 nm and 709 nm and the intrinsic optical parameters on the basis of measured data for turbid water bodies off the coast of South Korea. Their validation outcomes demonstrated that the atmospheric correction model based on the inherent optical properties exhibited robust retrieval performance across various suspended particulate matter concentration levels, yielding average absolute percentage error reductions of approximately 12% and 16% compared with traditional NIR atmospheric correction models. The algorithm, which is based on the 709 nm spectral relationship, demonstrated satisfactory retrieval performance solely within specific suspended particulate matter concentration ranges. Kim and Park (2021) conducted an analysis study using data from concurrent missions of the GOCI and GOCI-II from October 2020 to March 2021, aiming to evaluate the inversion accuracy of GOCI-II fog products. The findings revealed minimal root mean square error (RMSE) values (0.01) and a high correlation coefficient (0.988) between the GOCI and GOCI-II fog products. In a related study, Lee et al. (2021) leveraged the overlapping observation periods of the GOCI-II and GOCI in geostationary orbit to construct an aerosol lookup table tailored for the East Asian region. The constructed aerosol lookup table exhibited a consistent spatial distribution with that of the GOCI data. Additionally, the authors compared GOCI and GOCI-II aerosol optical thickness products, revealing a high degree of consistency between the two satellites, thus suggesting that the accuracy of the GOCI-II data is comparable to that of the GOCI data. Park et al. (2021) assessed the accuracy of corresponding GOCI-II products, thereby utilizing GOCI chlorophyll a (Chl-a) concentration, chromophoric dissolved organic matter (CDOM), and remote sensing reflectance (Rrs) products as references. The findings revealed a consistent distribution of the GOCI-II Chl-a data with that of the GOCI data across the Yellow Sea, Korea Strait, and Ulleung Basin. Notably, in summer in the Ulleung Basin, a small RMSE value (0.07) between the GOCI and GOCI-II products confirmed the reliability of the GOCI-II data. However, the GOCI-II Chl-a data were overestimated in regions with high values. This overestimation bias was also notable for the CDOM product. The spectral curves exhibited no significant deviation or error (RMSE~0) at 490 or 550 nm for Rrs. Nevertheless, underestimation of Rrs at 443 nm resulted in overestimation of Chl-a and CDOM in the GOCI-II data for the Yellow Sea and Korea Strait. Furthermore, the authors revealed that the overestimation of Rrs in the GOCI-II data at 660 nm compared with the GOCI data might induce biases in total suspended matter (TSM) concentrations.
Overall, the validation of GOCI-II remote sensing products has been extensively researched. However, relatively few studies have focused on the accuracy of GOCI-II remote sensing products in eutrophic waters. With the increase in human activities, inland lakes are exhibiting severe eutrophication (Zhang et al., 2018; Dokulil and Teubner, 2011; Lu et al., 2019). The GOCI-II offers high temporal and spatial resolutions, facilitating frequent observations of the environmental characteristics of inland lakes. Therefore, ensuring the accuracy of its products for eutrophic waters is important. Lake Taihu, with an area of approximately 2,338 km² and a shoreline length of approximately 393 km (Qiao et al., 2012; Huang et al., 2016; Zhang et al., 2022; Xu et al., 2018), exhibits a maximum depth of 3 m and an average depth of only 1.89 m, rendering it a typical turbid water body (Zhao et al., 2022; Han et al., 2023; Lian et al., 2018). During the summer and autumn seasons, widespread blooms of blue–green algae occur, and Lake Taihu demonstrates low water mobility (Zhai et al., 2010; Li J. et al., 2020; Song et al., 2010), with some areas showing high eutrophication levels (Liang et al., 2017; Fu, 2016; Guo et al., 2019). In this study, using in situ observations from various water types within Lake Taihu in China, including water remote sensing reflectance, Chl-a concentration, TSM concentration, and phytoplankton absorption coefficient (aph) data, we conducted accuracy verification for GOCI-II remote sensing products. By validating GOCI-II data in Lake Taihu, we aim to ensure that the results are applicable to a wide range of water conditions, including other turbid and eutrophic inland waters.
2 Data and methods
2.1 In situ data
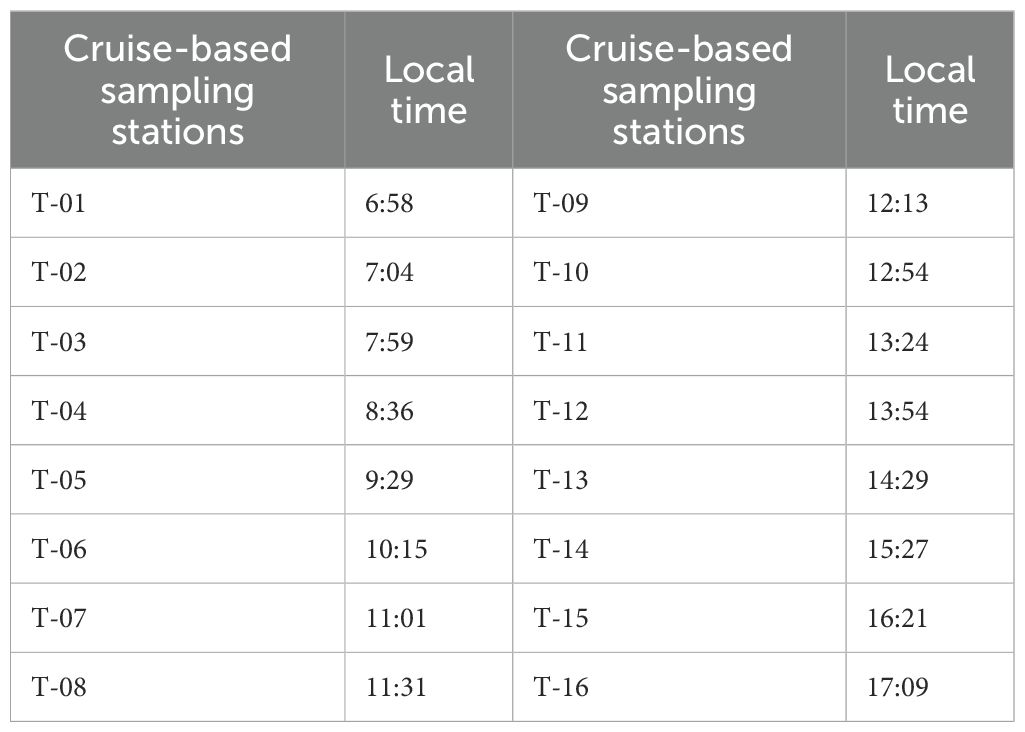
To assess the accuracy of GOCI-II remote sensing products in eutrophic waters, in situ measurements were conducted in Lake Taihu. Lake Taihu was segmented into 10 subareas, with the lake center area exhibiting a better water quality and less disruption from human activities, whereas the southwestern area is more significantly influenced by human activities, causing rapid changes in Chl-a (Xu et al., 2019; Zhang et al., 2019; Duan et al., 2009). Consequently, time-series measurements within a day were conducted in both the lake center and southwestern areas, along with cruise-based sampling throughout the entire Lake Taihu region. The distribution of the voyage stations is shown in Figure 1A, where the red dots denote the two time-series stations operating on August 29 and September 1, 2022 (in a total of 20 measurements). The black dots denote the cruise-based sampling stations operating on September 6, 2022 (in a total of 16 measurements). Specific measurement times were aligned with GOCI-II observation times, which included 10 satellite measurements per day from 7:15 AM to 4:15 PM local time, encompassing parameters such as Rrs, TSM concentration, Chl-a concentration, and aph.
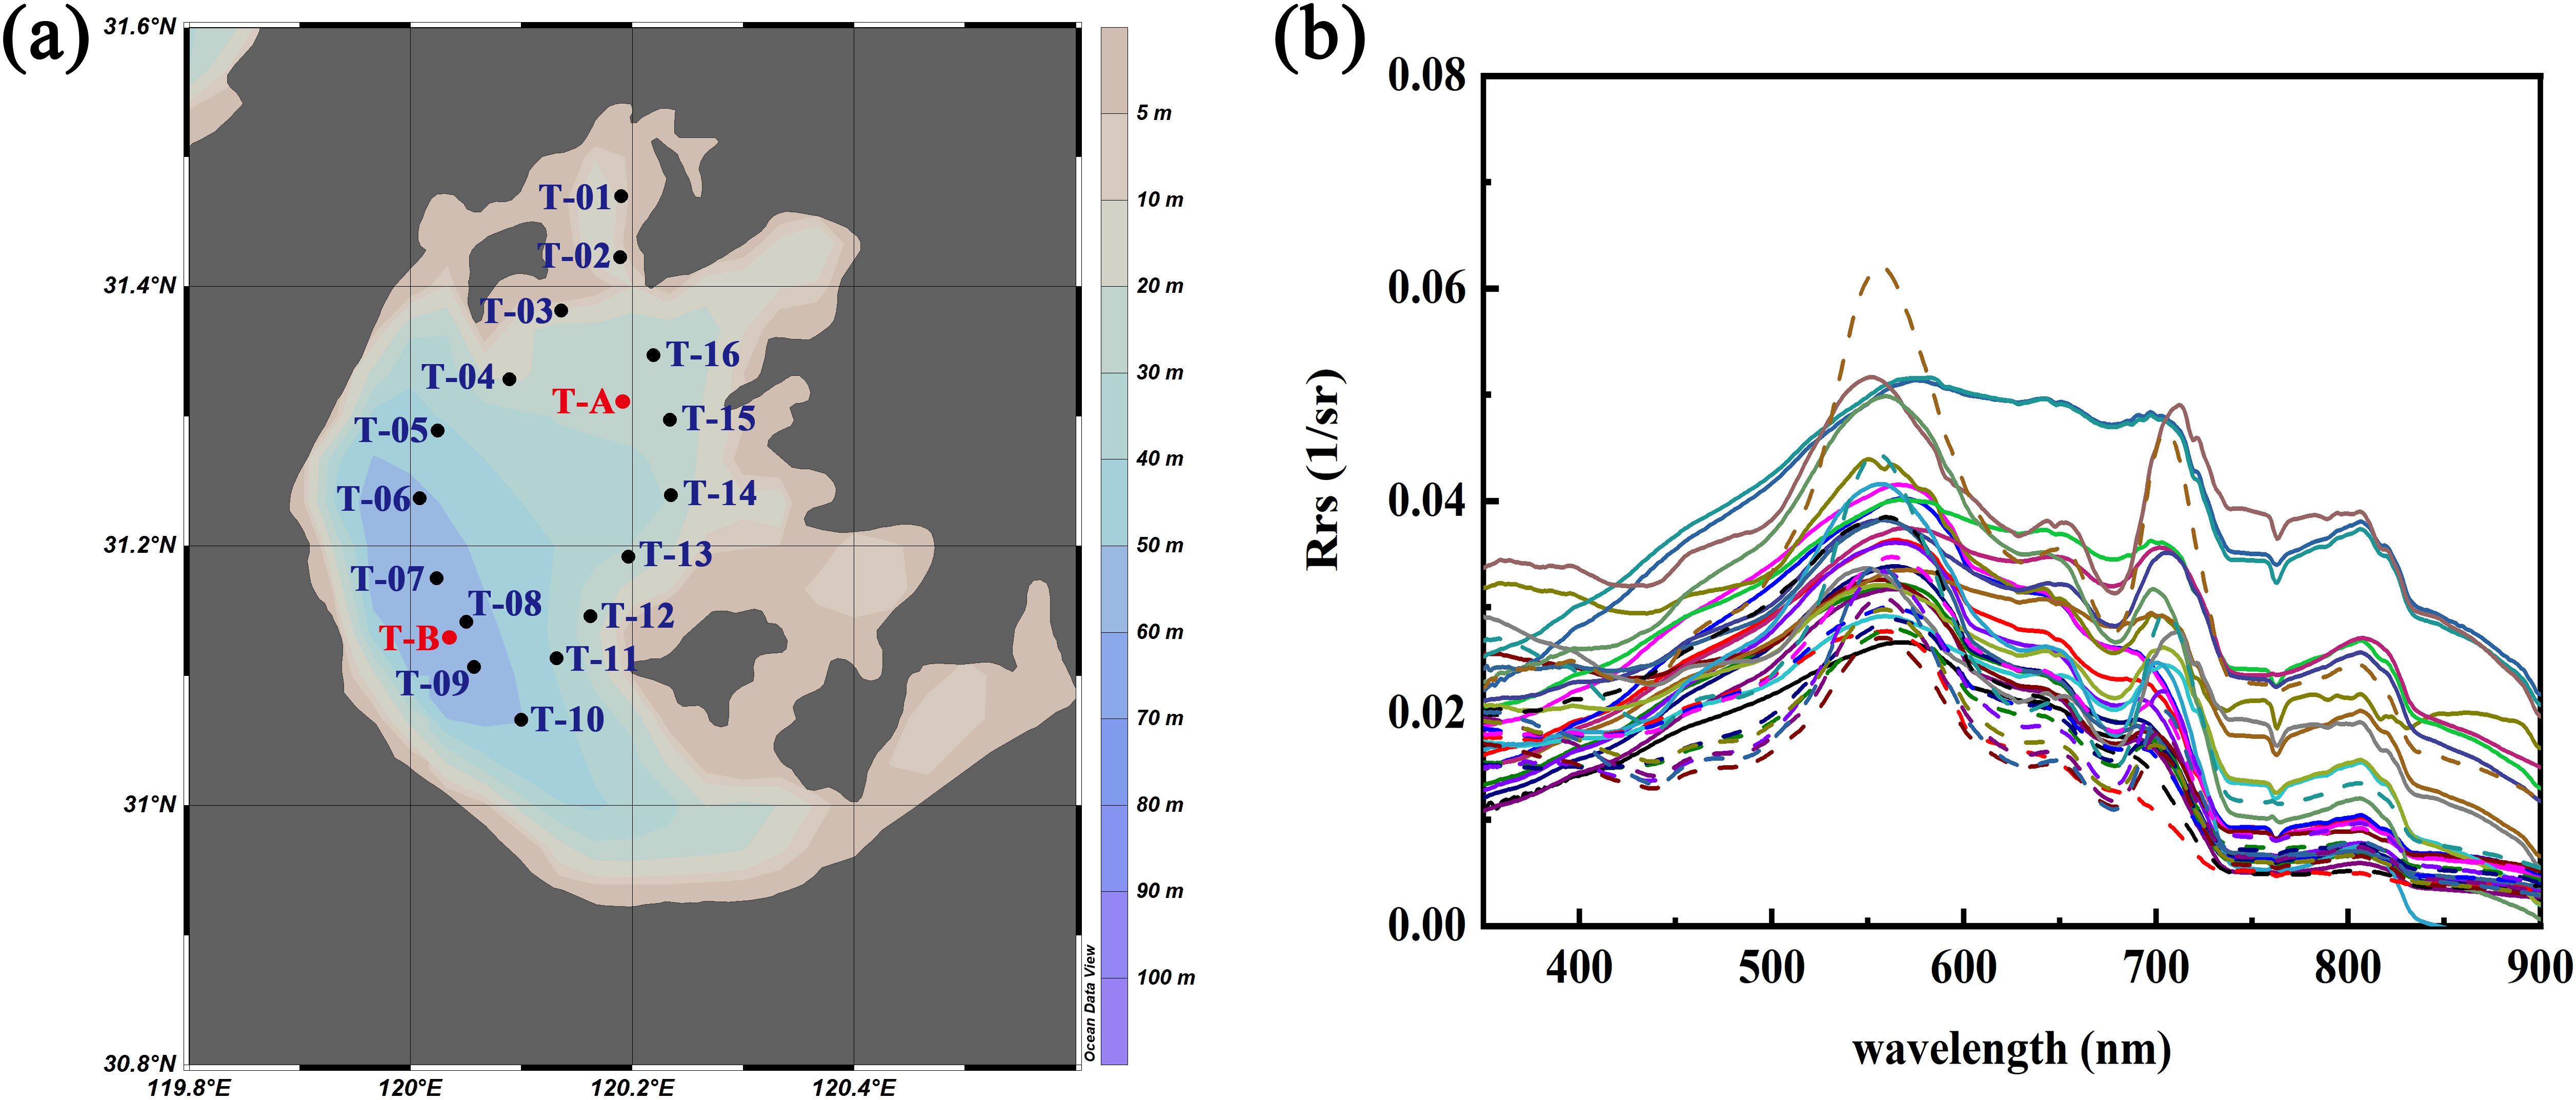
Figure 1. Distribution of the stations during the 2022 cruise in Lake Taihu (A) and spectral curves of the remote sensing reflectance obtained during the cruise (B) (In Figure 1A, the red dots denote the two continuous stations operating on August 29 and September 1, 2022, and the black dots denote the cruise-based sampling stations operating on September 6, 2022).
Rrs was measured via a portable spectrometer manufactured by the American ASD company (spectral range: 350–2,500 nm; spectral resolution: 3 nm). The implementation of the spectrometer measurement method followed the specifications outlined in the Ocean Optics Protocol established by the National Aeronautics and Space Administration (NASA) (Mueller and Fargion, 2023). Each day, the upward radiance at the water surface and the downward sky radiance, along with the upward radiance from a reference gray panel, were simultaneously measured. During these measurements, the viewing azimuth angle of the ASD probe was adjusted to form a 135-degree angle with the direction of direct sunlight, while the zenith angle was set at 45 degrees to minimize the influence of sun glint. The Rrs can be calculated as follows:
where denotes the upward radiance above the water surface, denotes the downwelling sky radiance, r denotes the diffuse reflectance factor, denotes the upward radiance from the reference gray panel, and ρ denotes the water surface reflectance, which was set to 0.028 as the wind speed during the spectral measurements was below 4 m/s (He et al., 2013). Figure 1B displays the spectral curves of the Rrs values obtained during the Lake Taihu cruise, while Table 1 lists the measurement times.
During the cruise, the Chl-a concentration in water was measured via a Turner fluorometer manufactured by Turner Biosystems. Chl-a samples were obtained by filter membrane samples, thereby employing Whatman GF/F glass fiber filter membranes, with a diameter of 25 mm and a pore size of 0.7 µm. Each sample was measured three times, and the average value was determined (Holm-Hansen et al., 1965). Moreover, aph was measured via glass fiber filter membranes following the same filtration method as that used for Chl-a determination. The filter membranes were subsequently collected and stored in a freezer at -17°C, and measurements were conducted in the laboratory via an Ultraviolet-visible spectrophotometer (Lambda750S). The TSM concentration was measured via filter membrane samples. Before sampling, the sample acetate fiber membranes (diameter: 47 mm; pore size: 0.7 μm) were weighed in the laboratory. Then, they were transported to the experimental site for onsite filtration of water samples at each station. The filter membranes were then collected and stored in a freezer at -17°C, and measurements were conducted in the laboratory. Via repeated drying in a muffle furnace until a stable weight was reached, the weight of the total suspended matter membrane was subtracted from the weight of the corresponding blank membrane to obtain the weight and concentration of suspended particulate matter. In total, 128 sets of data were obtained, including TSM, Chl-a, and aph data and Rrs data.
2.2 Satellite data
Hourly GOCI-II Level-1B data for August 29, September 1, and September 6, 2022, were obtained from the Korea National Ocean Satellite Center (https://www.nosc.go.kr/eng/main.do). The data comprised 10 observations per day. Two types of atmospheric correction algorithms were subsequently applied to derive the Rrs in various GOCI-II bands, including an ultraviolet (UV)-based atmospheric correction algorithm and the official NIR-based atmospheric correction algorithm used by the GOCI-II.
The Moderate Resolution Imaging Spectroradiometer (MODIS)-Aqua data used in this study were acquired from NASA’s Ocean Color Web. The MODIS-Aqua Level-1 data were downloaded from https://oceancolor.gsfc.nasa.gov/data/aqua/. The MODIS-Aqua satellite passes at approximately 1:30 PM, and it provides data with a spatial resolution of 1 km in the visible light spectrum. The visible band Rrs products used in this study were derived from Level-1 data via a NIR atmospheric correction model, with reference bands of 748 and 869 nm for atmospheric correction.
2.2.1 Near-infrared algorithm
The standard atmospheric correction method of the GOCI-II is based on the algorithm developed by Ahn et al. (2016; Ahn and Park, 2020). This algorithm relies on the spectral relationships of aerosol multiple scattering reflectances between different wavelengths (referred to as SRAMS). It aims to directly calculate the contribution of aerosol multiple scattering reflectance to the NIR bands for the selected aerosol model without residual errors. Subsequently, the SRAMS was used to extrapolate the reflectance contribution from the NIR spectrum to the visible spectrum. The reflectance fractions ( and ) can be calculated as follows:
where A, B, and C are polynomials. We used aerosol models (ML and MH) and their reflectance fractions (wML and wMH, respectively) to obtain ρam(VIS).
where D is the degree of the polynomial, and and denote the theoretical calculated values of , considering the aerosol models (ML and MH), geometry, and wavelength. Moreover, denotes the constants of the polynomial equation stored in the lookup table for each model (, , , and ). , , and are the solar zenith angle, sensor zenith angle, and relative azimuth angle, respectively.
To address the potential inaccuracy of the near-infrared atmospheric correction algorithm in highly turbid waters, Ahn and Park (2020) replaced the traditional 660 nm band with 709 nm, along with 745 nm and 865 nm for visible light extrapolation. The 709 nm band is minimally affected by chlorophyll absorption, and the optical saturation issue occurs at longer wavelengths as turbidity increases. By employing an iterative optimization process for aerosol correction, the accurate estimation of wn(709 nm) is achieved, thereby enhancing the atmospheric correction accuracy in turbid waters.
2.2.2 Ultraviolet algorithm
In addition to accuracy assessment for the official atmospheric correction algorithm products of the GOCI-II, the UV band (380 nm) of the GOCI-II was utilized. The UV atmospheric correction algorithm was used to process the GOCI-II L1B level data to obtain Rrs products. Through extensive in situ spectroscopy studies of turbid river mouth waters such as the Yangtze, Mississippi, and Orinoco rivers, He et al. (2012) reported that, owing to the high concentration of suspended matter in water, the water-leaving radiance significantly increases in the NIR bands. In contrast, the water-leaving radiance in the UV bands remains low and relatively stable. Therefore, atmospheric correction can be performed via UV bands, referred to as the UV algorithm. For the GOCI-II, the 412 nm and 380 nm bands were used to estimate aerosol scattering.
The specifics are as follows:
1) It is assumed that , where is the aerosol reflectance at 412 nm and 380 nm, and is the Rayleigh-corrected reflectance at 412 nm and 380 nm;
2) is used to calculate the aerosol scattering reflectance at 865 nm, where is the estimated aerosol reflectance ratio in the NIR band;
3) By assuming white aerosol (=1), the aerosol scattering reflectance for each band can be calculated.
2.3 Chlorophyll a and total suspended matter concentration retrieval models
The inversion algorithm used for Chl-a is the OCx algorithm (O’reilly et al., 1998), which is derived from the ratio of the fourth-order polynomial to the maximum Rrs value of the green band at 555 nm and the blue band. The expression is as follows:
where is the Chl-a concentration, and a0 to a4 are fitting coefficients specific to GOCI-II, with values of 0.3272, -2.9940, 2.7218, -1.2259, and -0.5683.
TSM can be estimated via the YOC (Yellow Sea Large Marine Ecosystem Ocean Color Project.) algorithm of Siswanto et al. (2011) as follows:
where c0 to c2 are fitting coefficients specific to GOCI-II, with values of 0.649, 25.623, and 0.646.
In this work, the absorption coefficient of phytoplankton pigments was calculated via a semianalytical method based on a bio-optical model, namely, the quasi-analytical algorithm (QAA), which was proposed by Lee et al. (2002). The QAA can be expressed as:
where is the total absorption coefficient, is the absorption coefficient of gelbstoff and detritus, and is the absorption coefficient of pure seawater. Where can be calculated as follows:
Notably, , ζ, ξ, and the spectral slope S can be obtained as follows:
And can be calculated as follows:
2.4 Match-up procedure
The in situ and satellite data were matched spatiotemporally by averaging the valid pixels within a 3×3 pixels box centered on the in situ point, with a time window of available data of ±1 hour (Bailey and Werdell, 2006). Additionally, the following conditions must be met:
1. Spatial Averaging: A 3×3 pixel box centered on the in situ point was selected. This size was chosen to balance the need for spatial averaging to account for potential misalignments between satellite and in situ points, while still maintaining a reasonable local representation of water properties.
2. Temporal Window: The data were matched within a ±1 hour time window around the in situ observation. This time window was selected based on the trade-off between minimizing temporal differences and ensuring the availability of satellite data. Considering that both water properties and atmospheric conditions can change rapidly, a narrower window (e.g., 30 minutes) could risk excluding too many matches, whereas a larger window could introduce temporal discrepancies.
3. Data Selection Criteria:
● Valid Pixel Percentage: At least 50% of the pixels within the 3×3 box had to be valid (i.e., free from land contamination, cloud cover, and sensor anomalies). This threshold ensures that the calculated mean and standard deviation are based on a representative sample of pixels, reducing noise in the match-up data.
● Outlier Detection: The mean and standard deviation of the valid Rrs values within the 3×3 box were calculated. Pixels with Rrs values that deviated by more than ±1.5 times the standard deviation were excluded to mitigate the influence of anomalous or erroneous readings that could distort the accuracy assessment.
● Spatial Homogeneity: The coefficient of variation (CV) was computed for the remaining valid pixels, with a threshold of CV < 0.15. This ensures that the selected box represents a relatively homogeneous area, as significant spatial heterogeneity could lead to inaccurate comparisons with point-based in situ measurements.
By employing these selection criteria, we aimed to ensure that the matched satellite data were both spatially representative and temporally close to the in situ measurements, minimizing the impact of spatial heterogeneity and temporal mismatch on the accuracy assessment.
2.5 Accuracy assessment
The accuracy of remote sensing products was assessed via various statistical parameters, namely, the root mean square deviation (RMSD), absolute percentage deviation (APD), and relative percentage deviation (RPD), which can be calculated as:
where Yi, Xi, and N are the algorithm inversion value, the measured value, and the sample size, respectively. RPD is a predictive indicator of the systematic error or average relative deviation, and APD reflects the absolute accuracy of the inversion product relative to the measured data.
3 Results
3.1 Validation of the GOCI-II Rrs products based on the NIR atmospheric algorithm
Figure 2 shows the distribution of Rrs(443 nm) in Lake Taihu on September 6, 2022, obtained via the NIR atmospheric correction algorithm with the GOCI-II data. Owing to the clear weather conditions on that day, a large amount of valid data was obtained. As shown in the figure, the value of Rrs(443 nm) varied significantly during the observation period, showing characteristics of higher Rrs(443 nm) values around noon and abnormally lower values close to dawn and dusk.

Figure 2. Distribution of effective Rrs (443 nm) data for Lake Taihu obtained from GOCI-II data using the NIR-correct atmospheric correction algorithm on September 6, 2022. Figures (A–J) represent the results from local time 07:15 to 16:15.
Table 2 provides the statistical results for the comparison of Rrs values across various bands between the NIR algorithm-retrieved and in situ data. The APD across the 6 bands ranged from 20.96% to 31.52%, with the smallest APD value occurring at 555 nm and the largest APD value occurring at 680 nm. This finding is similar to the results obtained by Kim et al. (2016), who validated inversion values against measured data for low-turbidity waters via voyage data from 2010 to 2011, with APD values ranging from 18% to 35%.
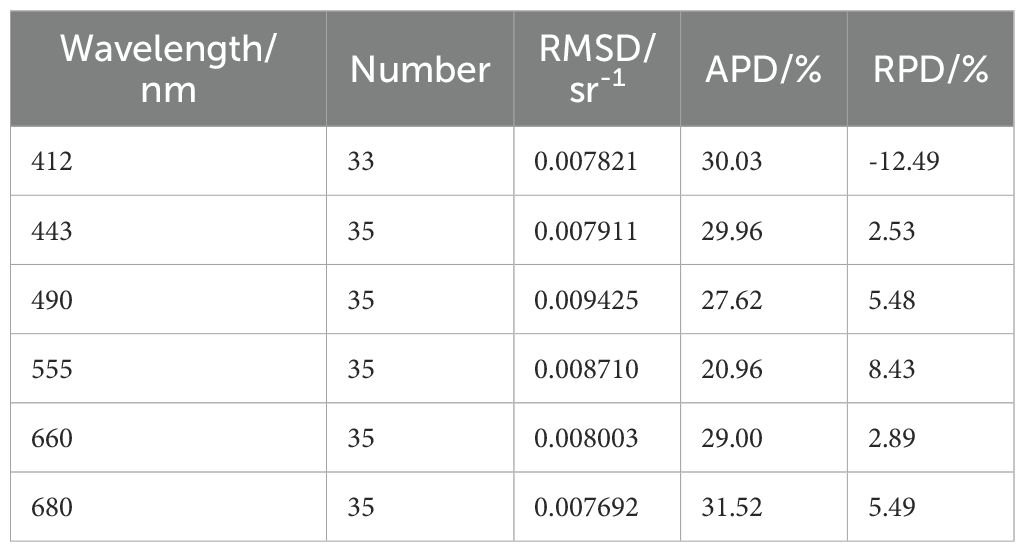
Table 2. Statistical results of the comparison between the Rrs values for each wavelength band obtained through the GOCI-II data via the NIR-correct atmospheric correction algorithm and the measured Rrs values for each wavelength band.
Figure 3 shows a comparison between the Rrs values for various bands derived from the GOCI-II data via the NIR algorithm and the in situ data. The scatter plot is relatively dispersed and the inverted values are slightly lower than the measured values, especially at higher Rrs values, suggesting underestimation by the NIR algorithm.
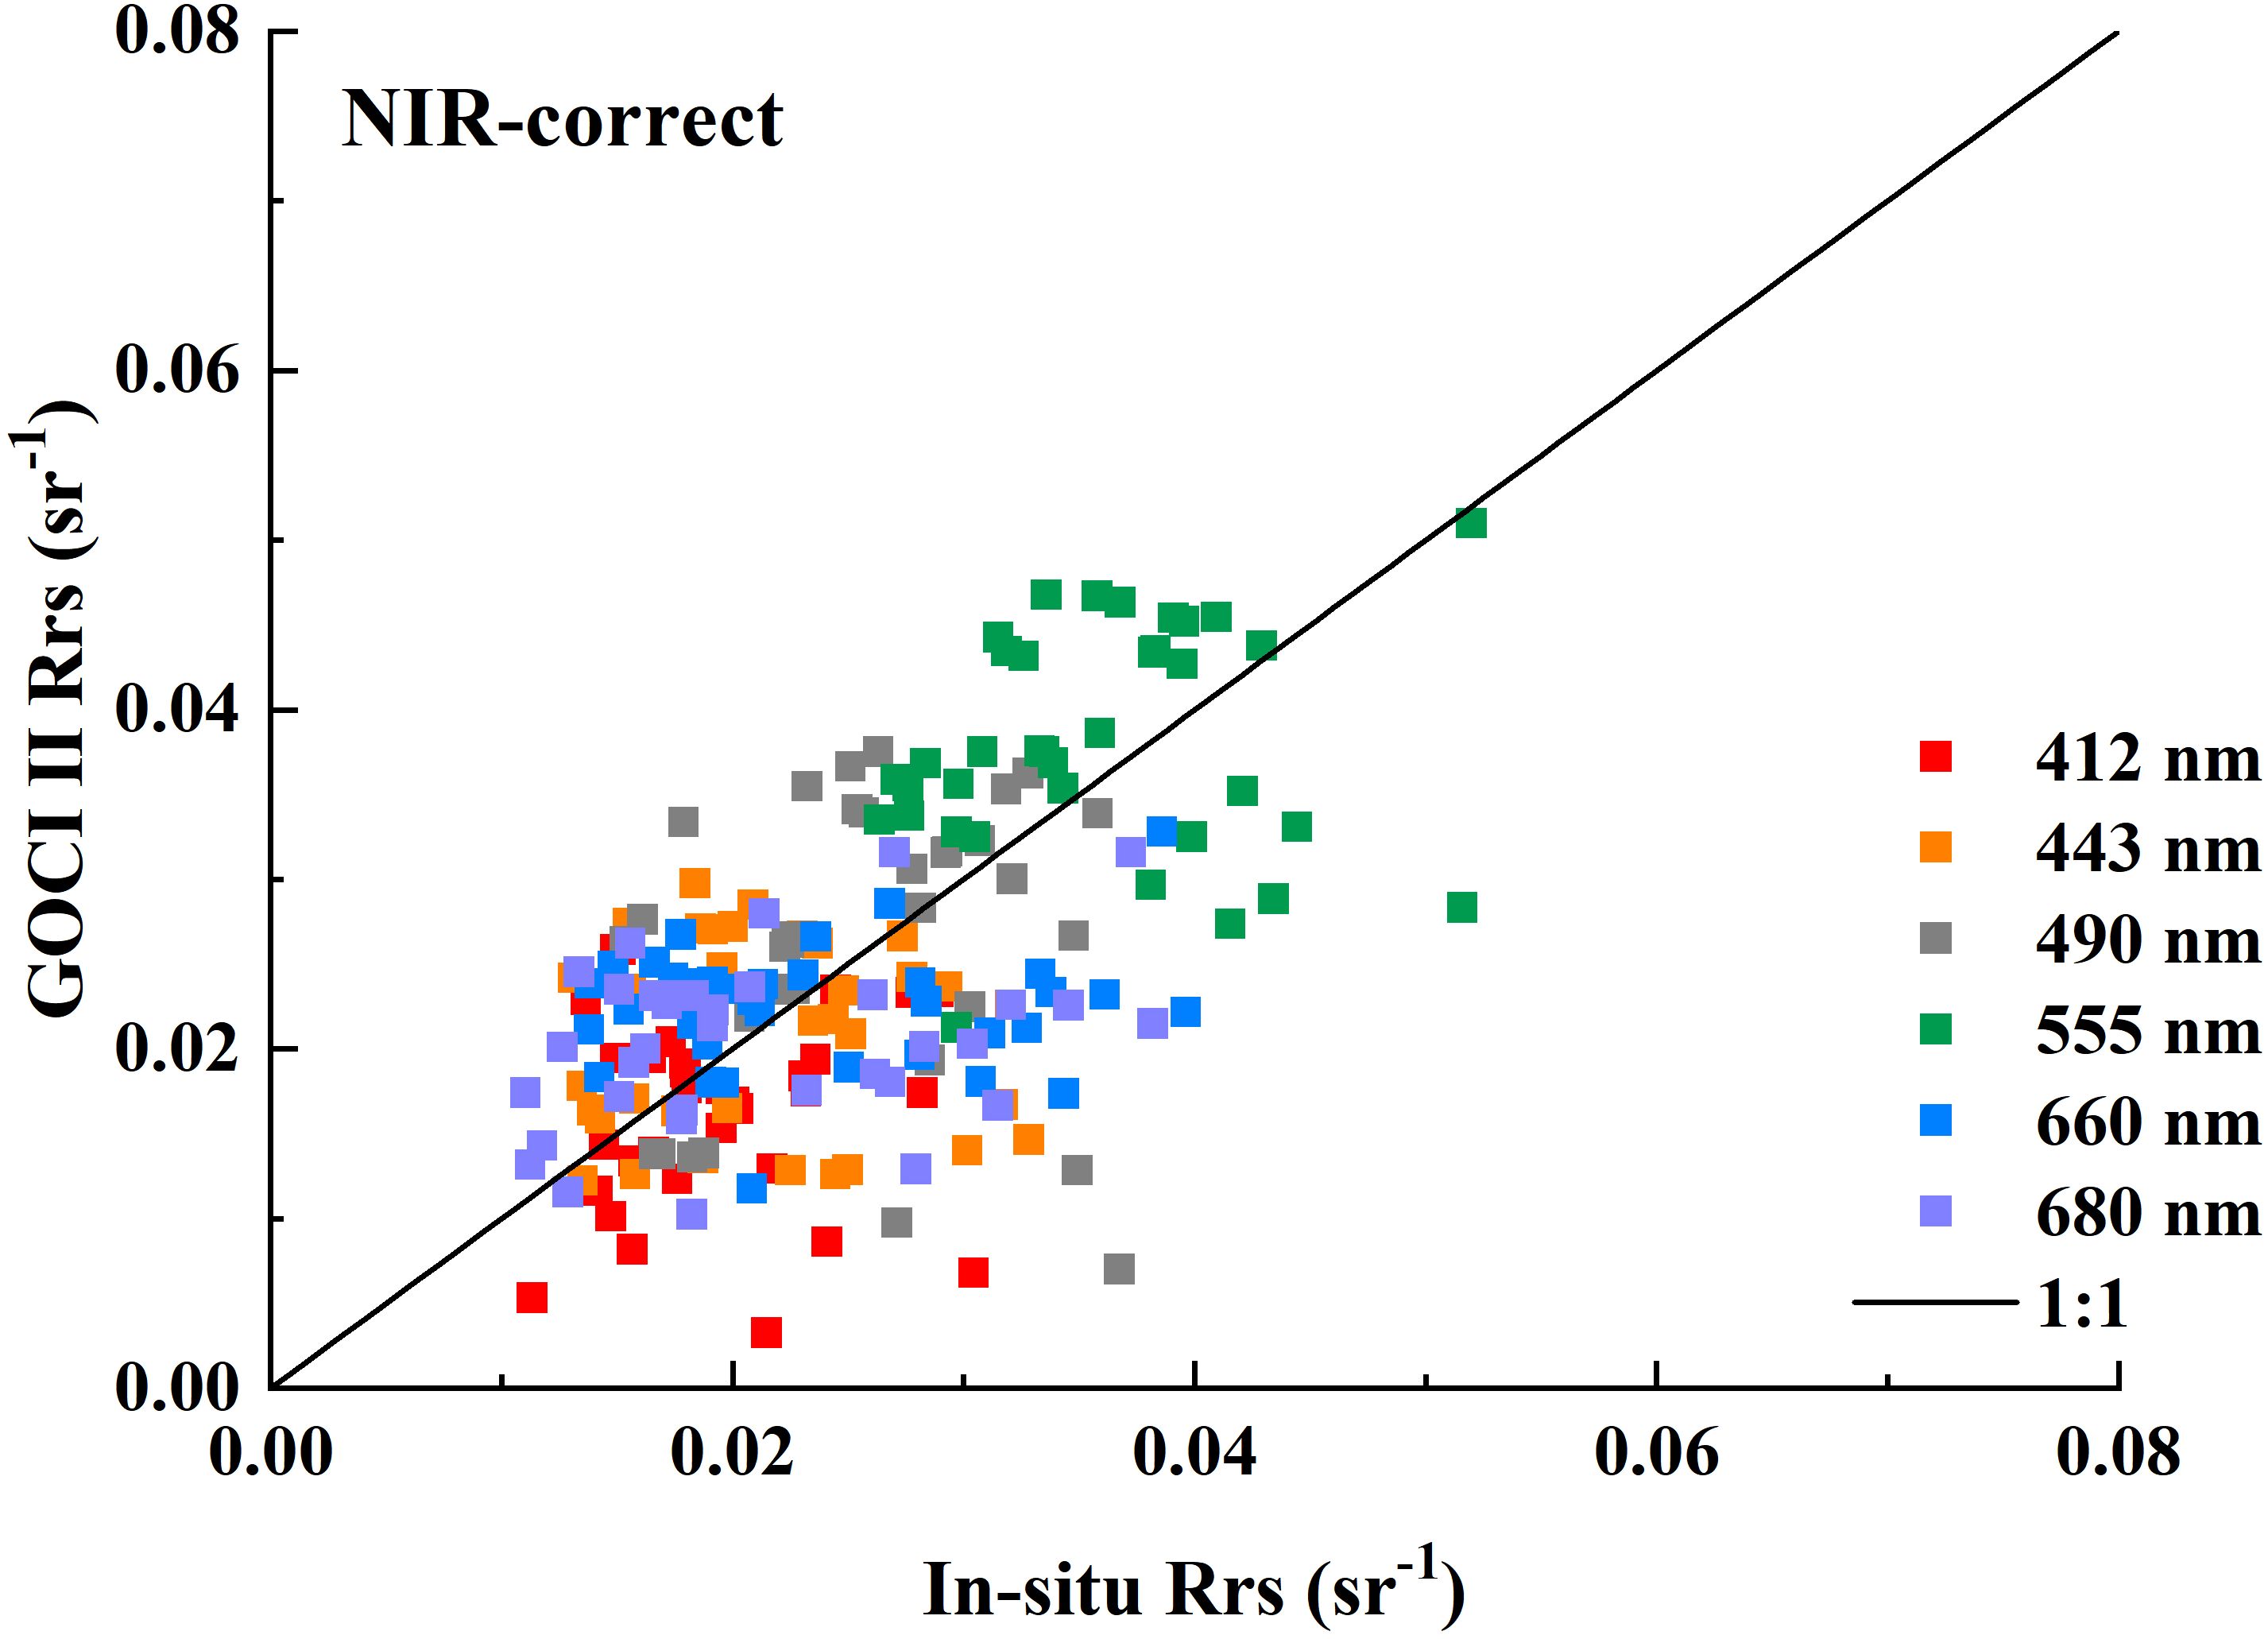
Figure 3. Comparison of the Rrs values for each wavelength band obtained via inversion with the NIR-correct atmospheric correction algorithm and the measured Rrs values for each wavelength band.
3.2 Assessment of the GOCI-II Rrs products via UV atmospheric correction algorithm
In the Rrs results inverted via the NIR-correct atmospheric correction algorithm, the APD values for the 555 nm band Rrs data were relatively small, indicating high accuracy. However, for the Rrs results of the 412 nm and 443 nm bands, the APD values were relatively large. This difference may be attributed to the use of the NIR-correct atmospheric correction method for extrapolating aerosol scattering from the NIR spectrum to the visible light spectrum, yielding larger inversion errors in the blue light spectrum, which is farther from the NIR spectrum (Abbott et al., 1999). In addition, Lake Taihu is a moderately turbid water body, thus, the water-leaving radiance in the NIR spectrum cannot be neglected, and the assumption of dark pixels in the NIR used by the NIR atmospheric correction algorithm is not appropriate for the turbid waters. Considering the high absorption capacity for UV wavelengths of eutrophic water bodies, it can assume that the water-leaving radiance signal at UV wavelengths could be neglected. Leveraging the advantage of the GOCI-II sensor with a 380 nm UV band, UV atmospheric correction algorithms were employed to improve the inversion performance.
Figures 4, 5 show the distributions of the retrieved Rrs (443 nm) data for Lake Taihu on September 6, 2022, obtained via the use of the UV380nm-correct (taking 380 nm band as reference band) and UV412nm-correct (taking 412nm band as reference band) atmospheric correction algorithms, respectively. Compared with the Rrs (443 nm) results inverted via the NIR-correct atmospheric correction algorithm (as shown in Figure 2), the Rrs (443 nm) values inverted via the UV atmospheric correction algorithms were generally greater. The temporal variation in Rrs across the ten images captured throughout the day was minimal, but there was clear algorithm failure in the last two images of the day.
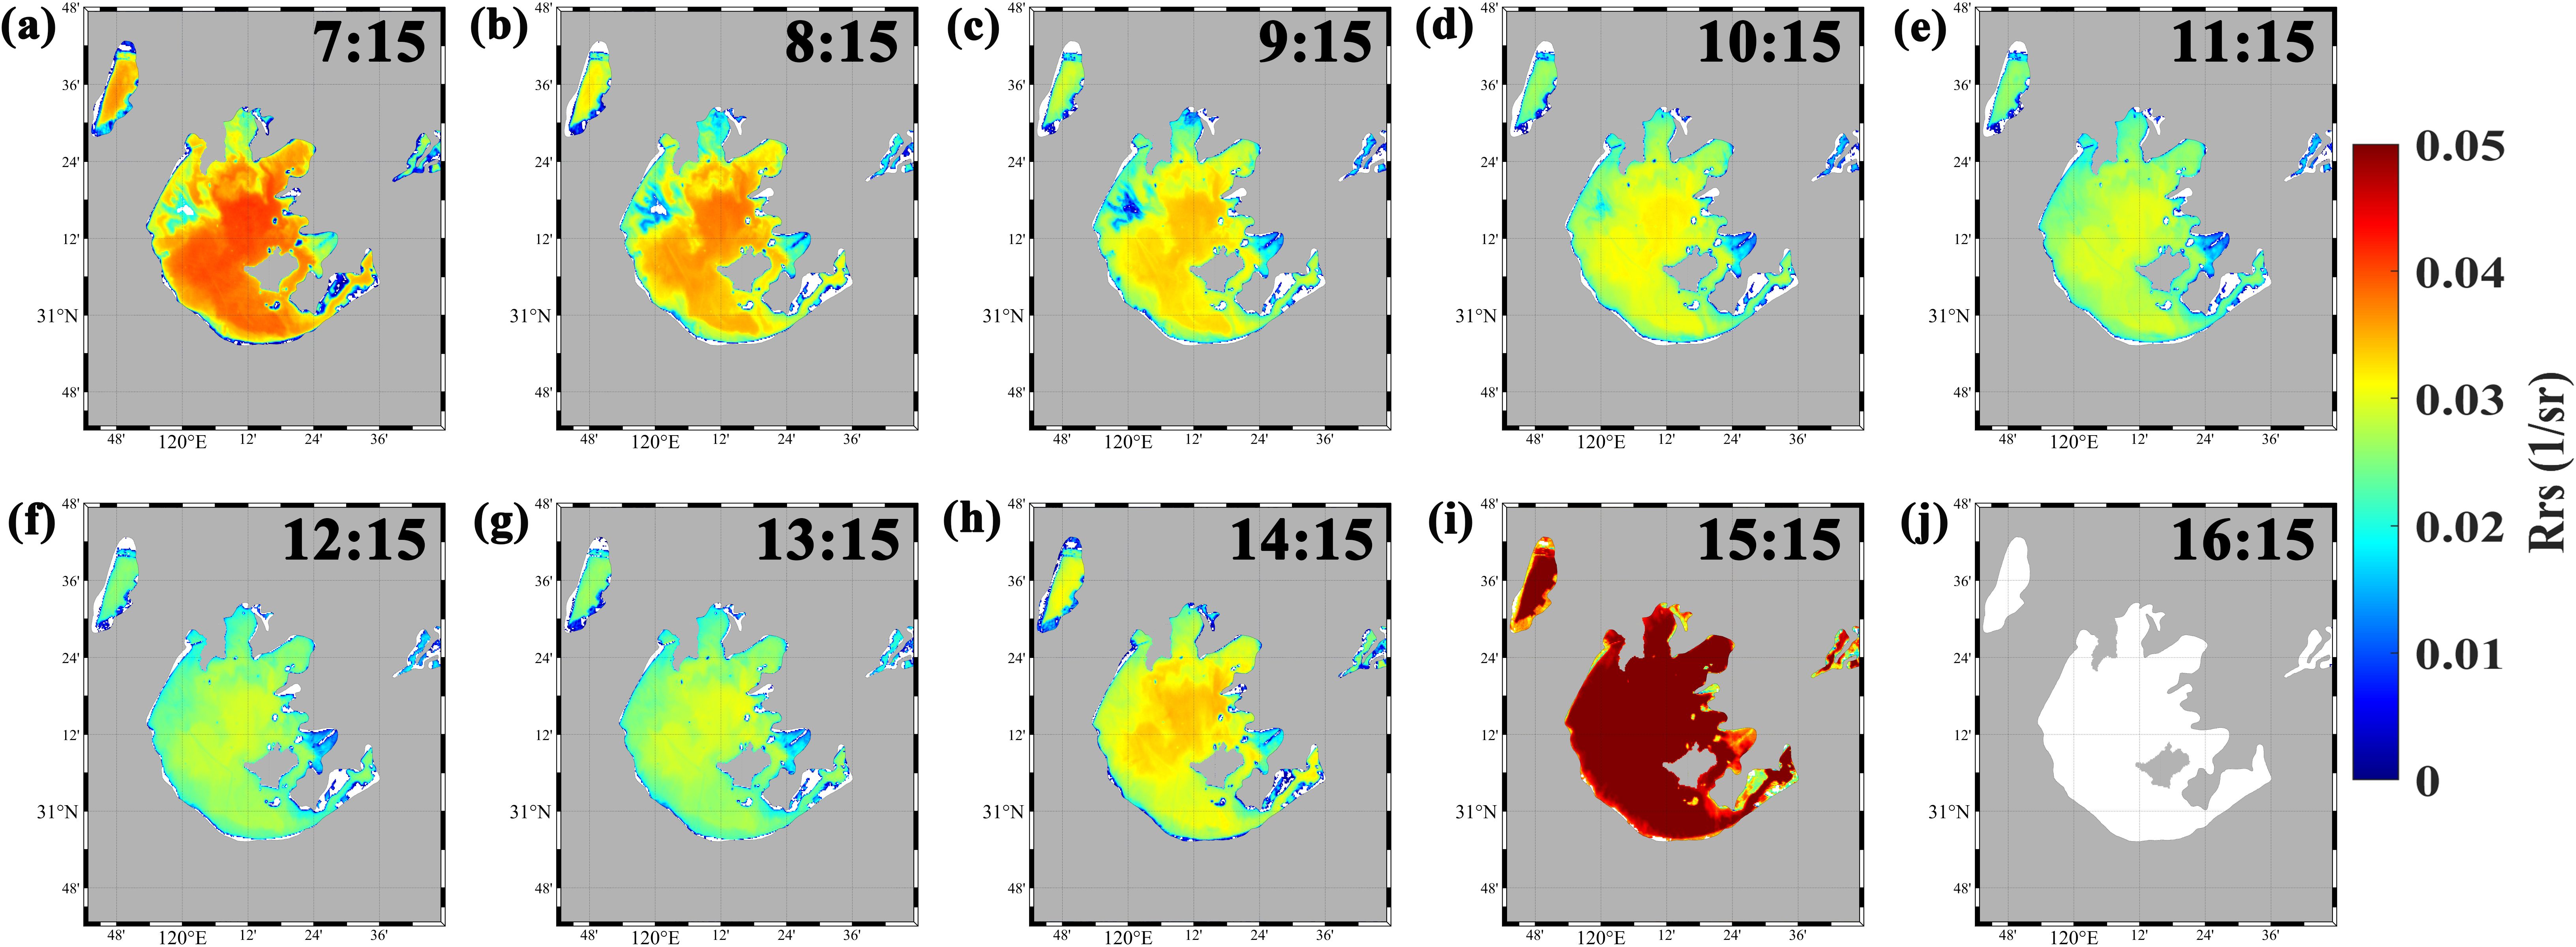
Figure 4. Distribution of the effective Rrs(443 nm) data for Lake Taihu on September 6, 2022, inverted via the UV380nm-correct atmospheric correction algorithm. Figures (A-J)represent the results from local time 07:15 to 16:15.
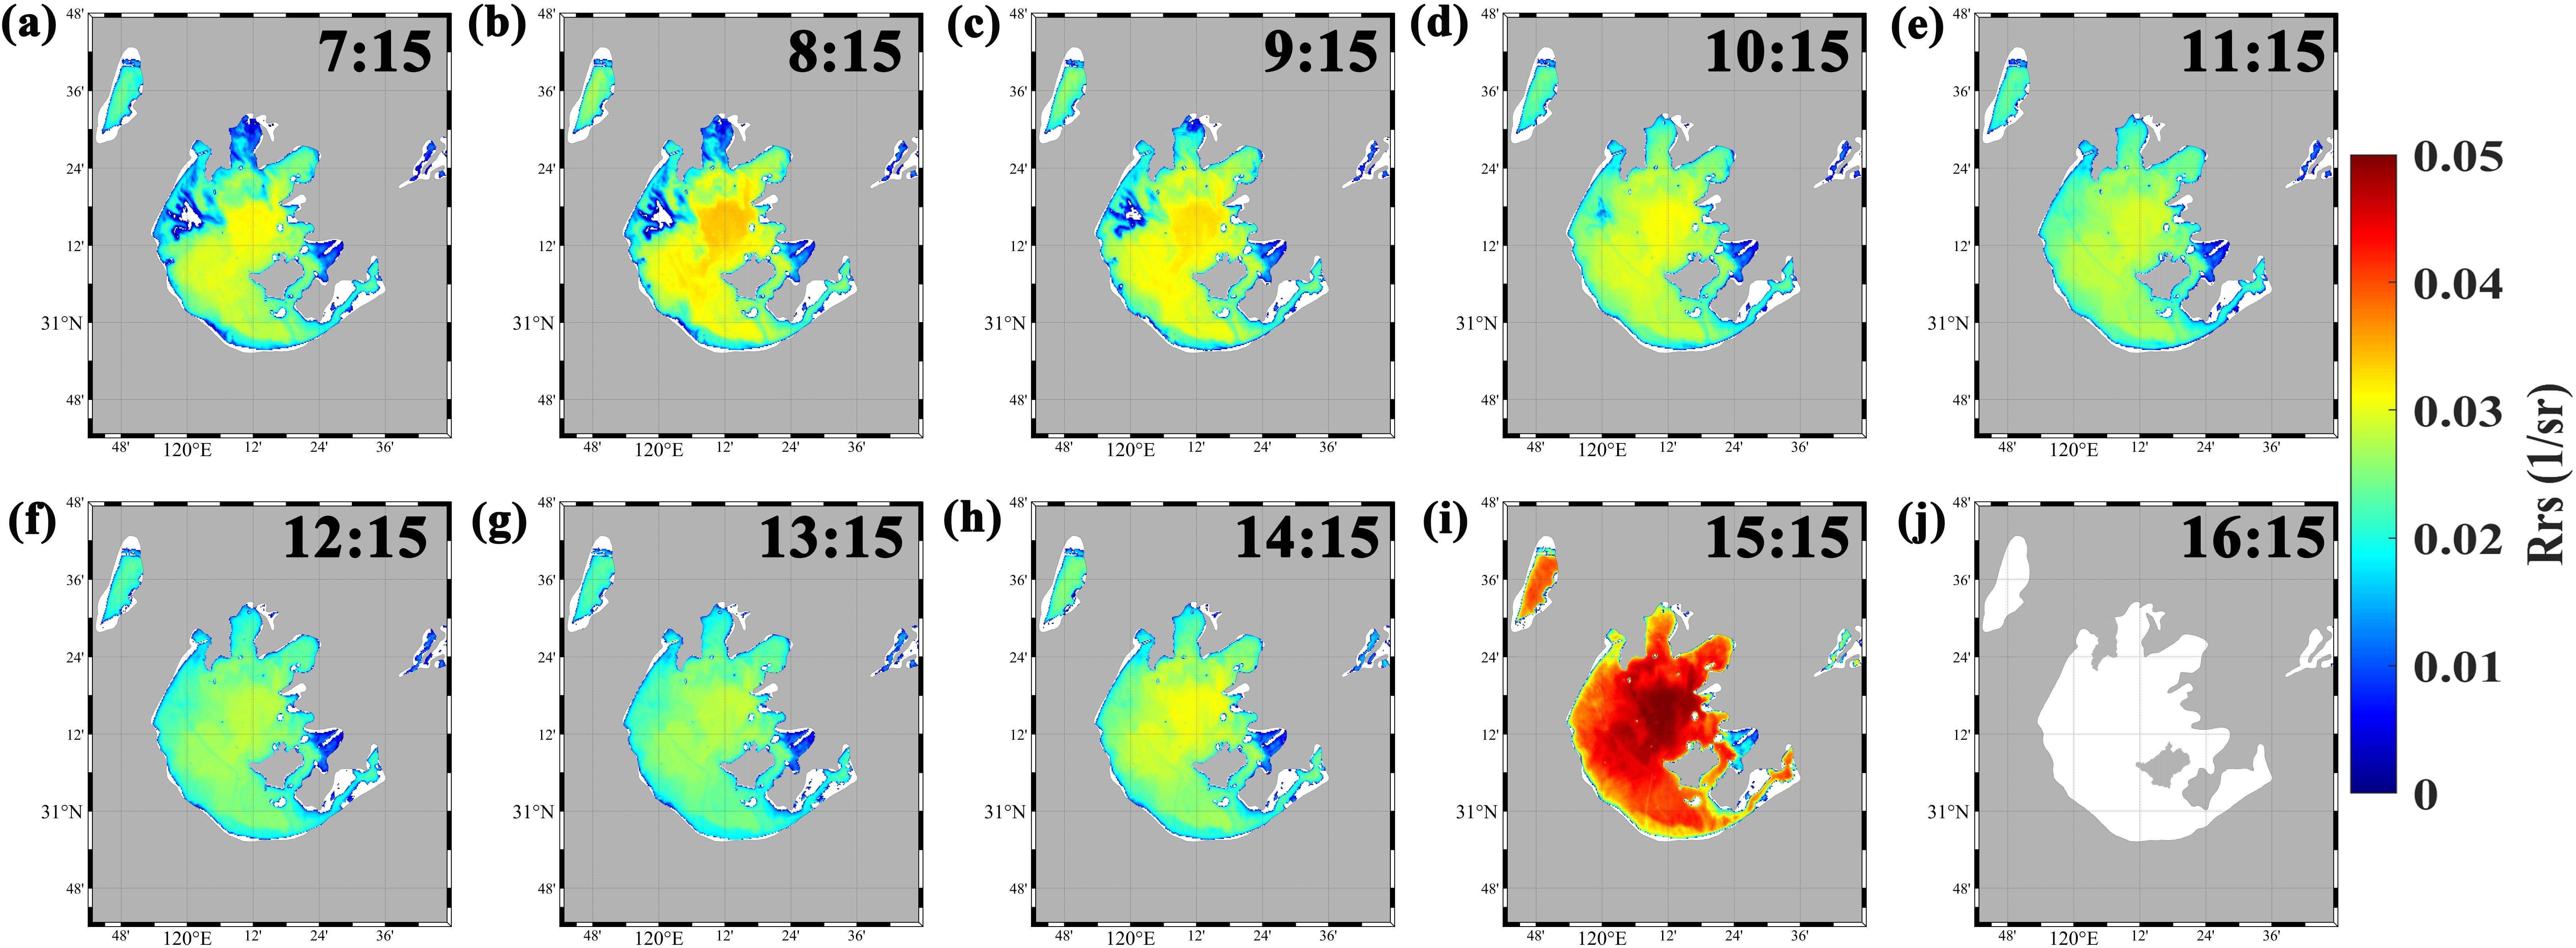
Figure 5. Distribution of the effective Rrs(443 nm) data for Lake Taihu on September 6, 2022, inverted via the UV412nm-correct atmospheric correction algorithm. Figures (A–J) represent the results from local time 07:15 to 16:15.
In this study, Rrs data were obtained from 33 in situ measurement stations matched with Rrs data inverted via UV atmospheric correction algorithms. Figure 6 shows scatter plots that provide a comparison of the Rrs values across various wavelengths obtained via the UV380nm-correct and UV412nm-correct atmospheric correction algorithms with in situ data. Figure 7 shows the comparison of remote sensing reflectance products derived from various inversion algorithms with measured values at certain stations. It is evident that the results from the UV412nm-correct atmospheric correction algorithm align closely with the trend of the measured spectral curves. Table 3 provides statistical results for the comparison of the inverted Rrs values across the different wavelengths with the Rrs values inverted via the two UV atmospheric correction algorithms. Compared with those of the NIR-correct atmospheric correction algorithm, the Rrs results inverted via the two UV atmospheric correction algorithms for shorter wavelengths of 412 nm, 443 nm, and 490 nm were closer to the 1:1 line, indicating better performance. As indicated in Table 3, the APD values for the Rrs results for the NIR wavelengths inverted via both UV atmospheric correction algorithms were higher, exceeding 30%. The APDs for the Rrs results at the 660 nm and 680 nm wavelengths inverted via the UV380nm-correct atmospheric correction algorithm were 42.47% and 51.56%, respectively. For the UV412nm-correct atmospheric correction algorithm, the APDs for the 660 nm and 680 nm wavelengths were 36.83% and 33.00%, respectively, indicating greater inversion performance in the NIR wavelengths. The statistical parameters revealed that the UV412nm-correct atmospheric correction algorithm performed better in correcting data for Lake Taihu waters, with the accuracy in the shorter wavelength bands surpassing that of the NIR-correct atmospheric correction algorithm. Both the UV380nm-correct and UV412nm-correct atmospheric correction algorithms could reproduce the spectral distribution of the measured Rrs data. Compared with the UV380nm-correct atmospheric correction algorithm, the UV412nm-correct algorithm slightly overestimated the aerosol scattering reflectance at NIR wavelengths because of the significant contribution of the water-radiance of water at 412 nm, but the overestimation of the aerosol scattering reflectance at 865 nm could compensate for the minor overestimation by the UV atmospheric correction algorithms due to the white aerosol assumption at short visible wavelengths. The lower accuracy of the UV380nm-correct algorithm may result from lower signal-to-noise ratios or calibration inaccuracies in the data obtained at the 380 nm wavelength by the GOCI-II. Lake Taihu is characterized by high aerosol optical depth (AOD) and varying water vapor content, which can influence the accuracy of the NIR algorithm. While the NIR-based atmospheric correction method is widely used, its performance is limited in turbid waters like Lake Taihu, where the high concentration of suspended matter can interfere with the near-infrared signal. In contrast, the UV algorithm may perform better under such conditions, as it is less affected by the water’s optical complexity.
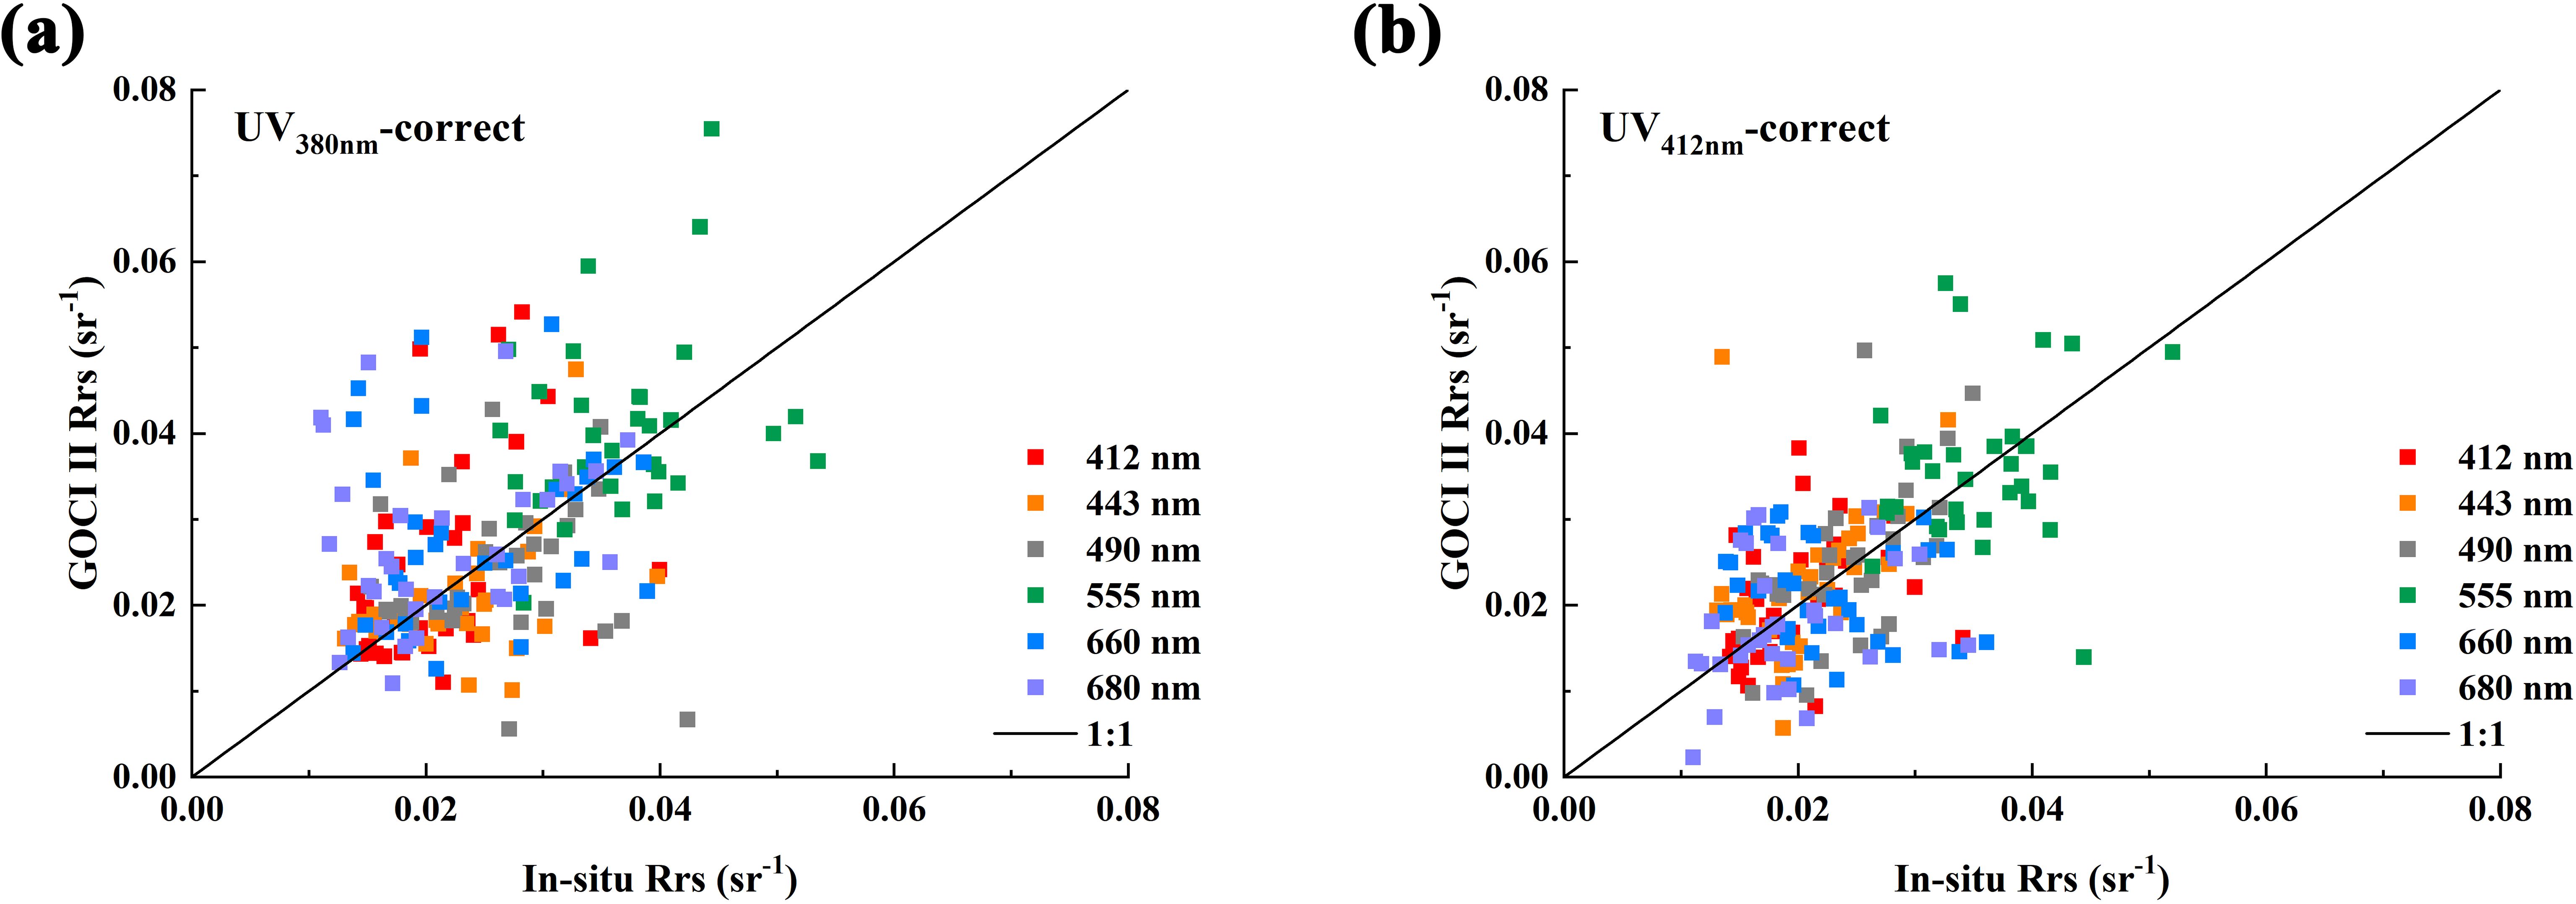
Figure 6. Comparison between the Rrs results of various bands inverted via the UV380nm-correct (A) and UV412nm-correct (B) atmospheric correction algorithms and the measured Rrs data.
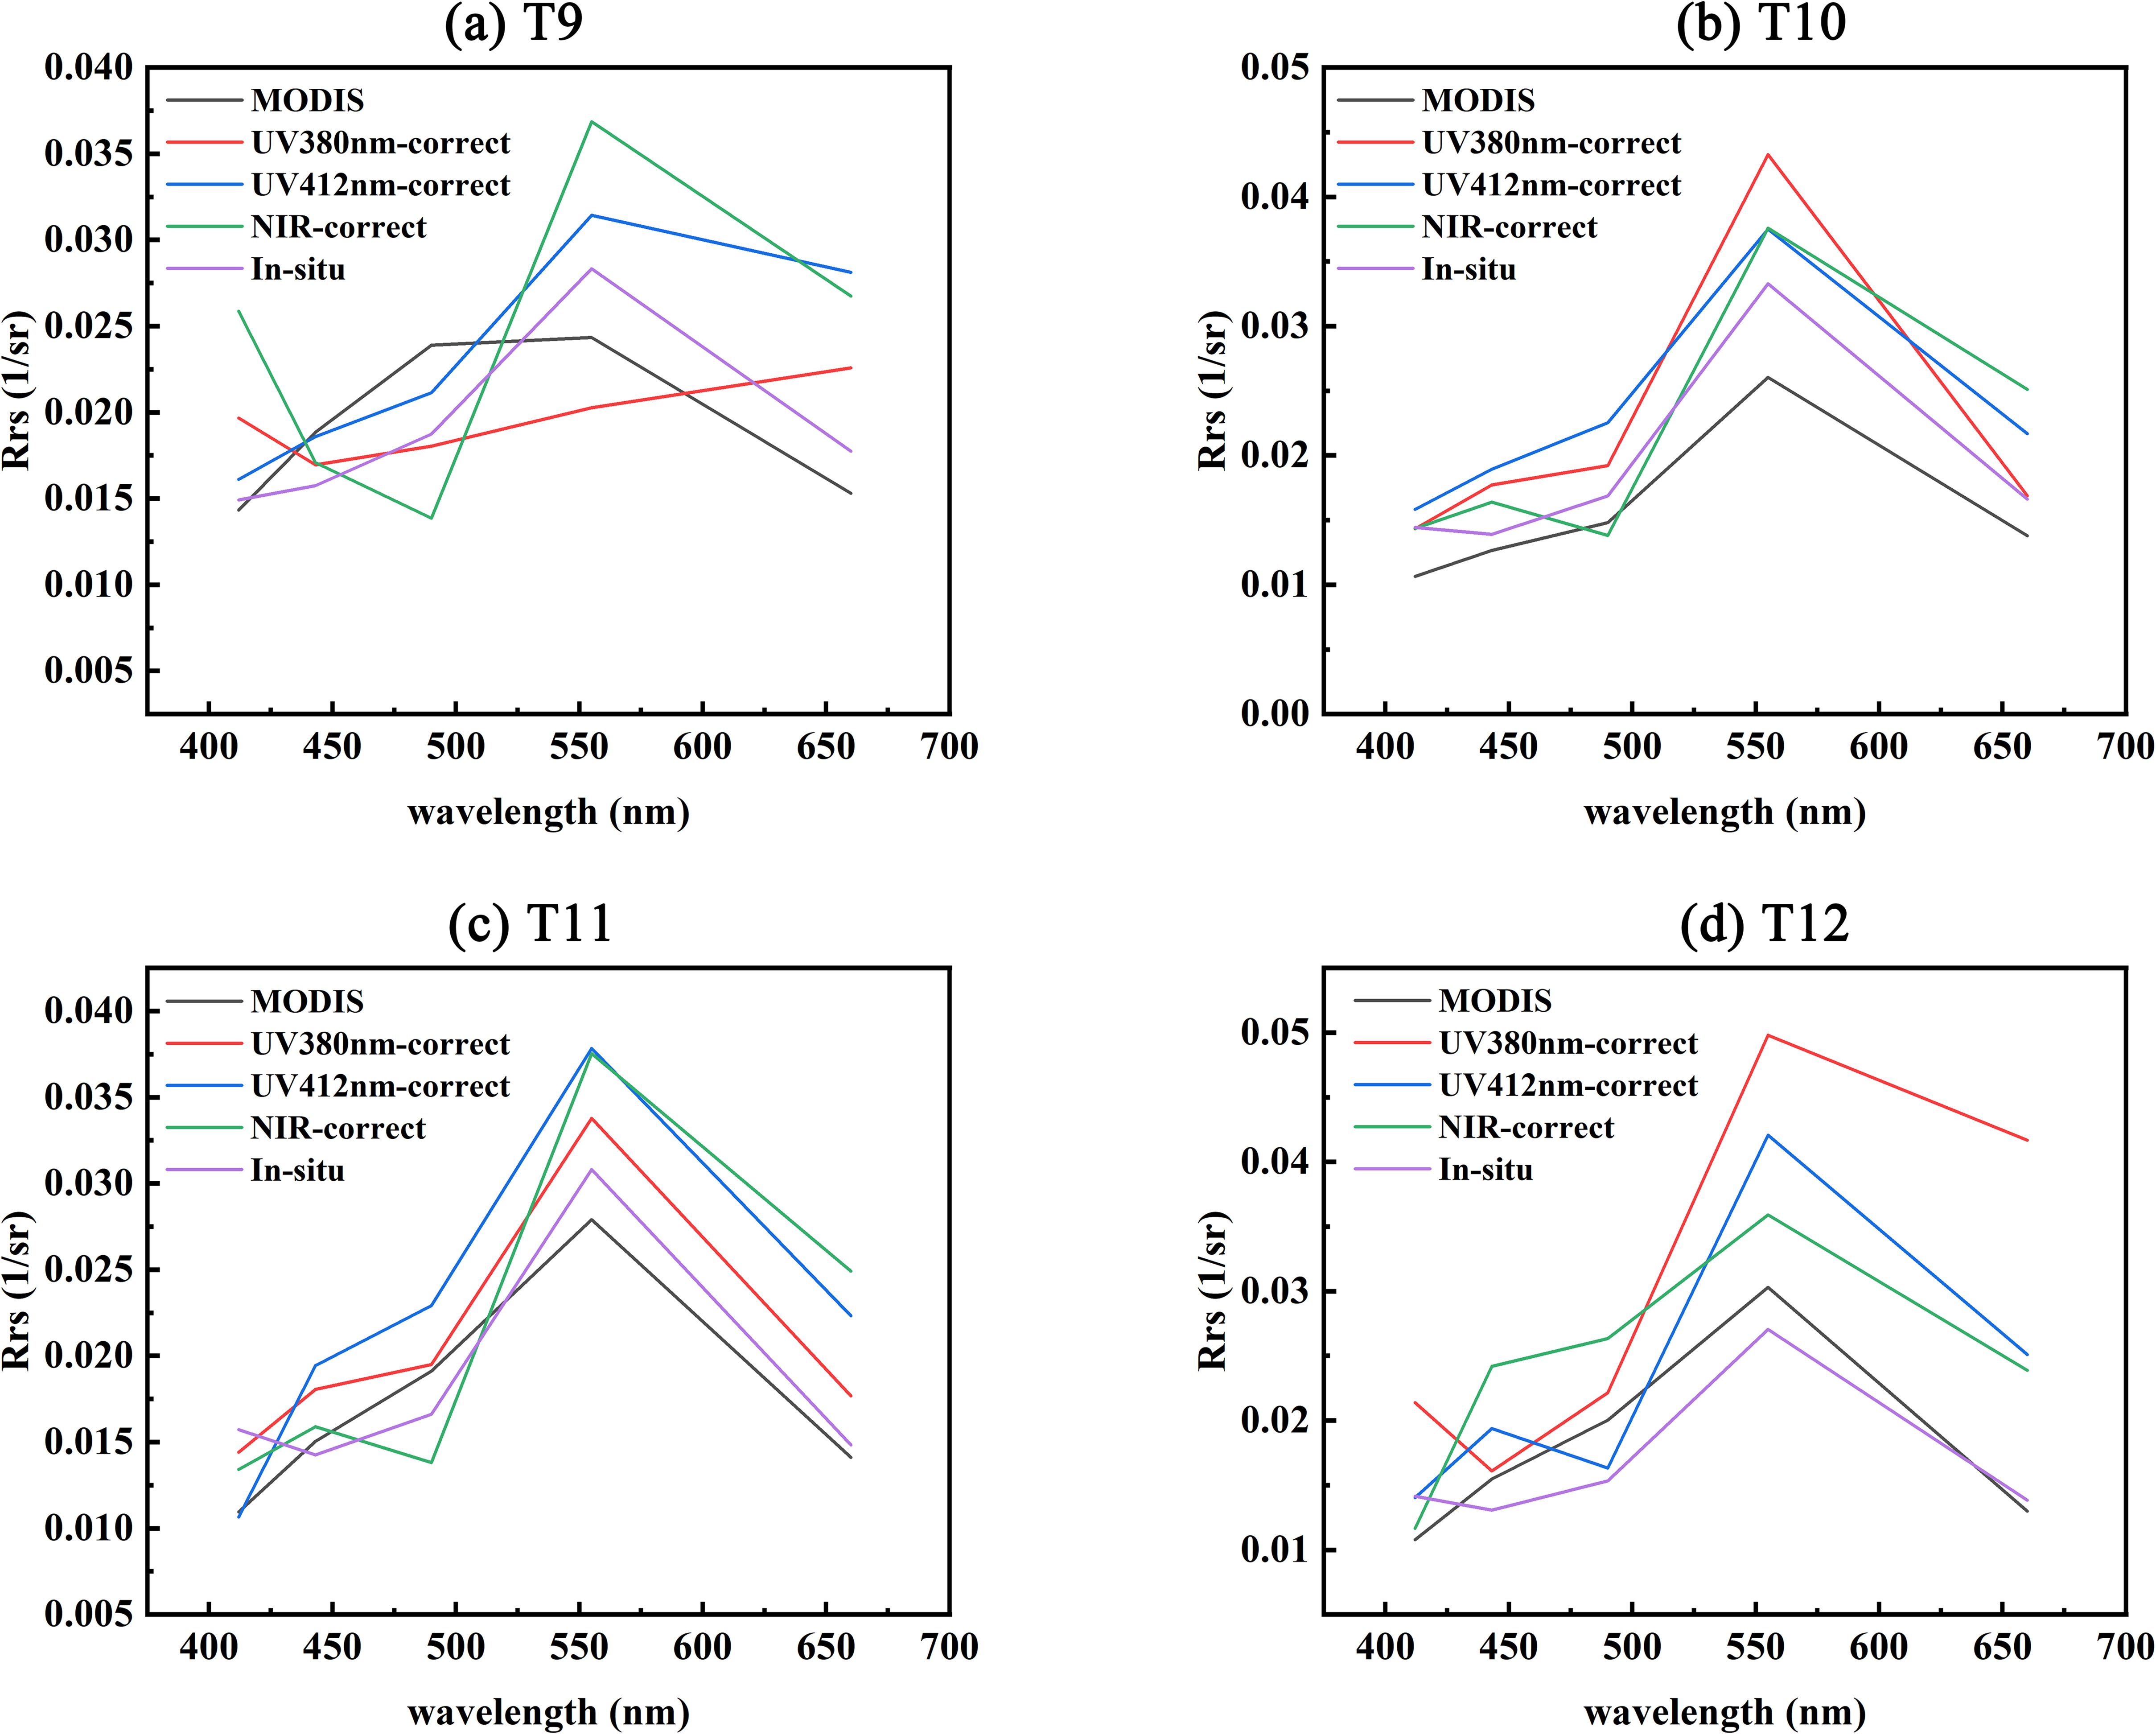
Figure 7. Comparison between the Rrs results of various bands inverted via the UV380nm-correct and UV412nm-correct atmospheric correction algorithms and the measured Rrs data. (A. Station T9; B. Station T10;C. Station T11; D. Station T12).
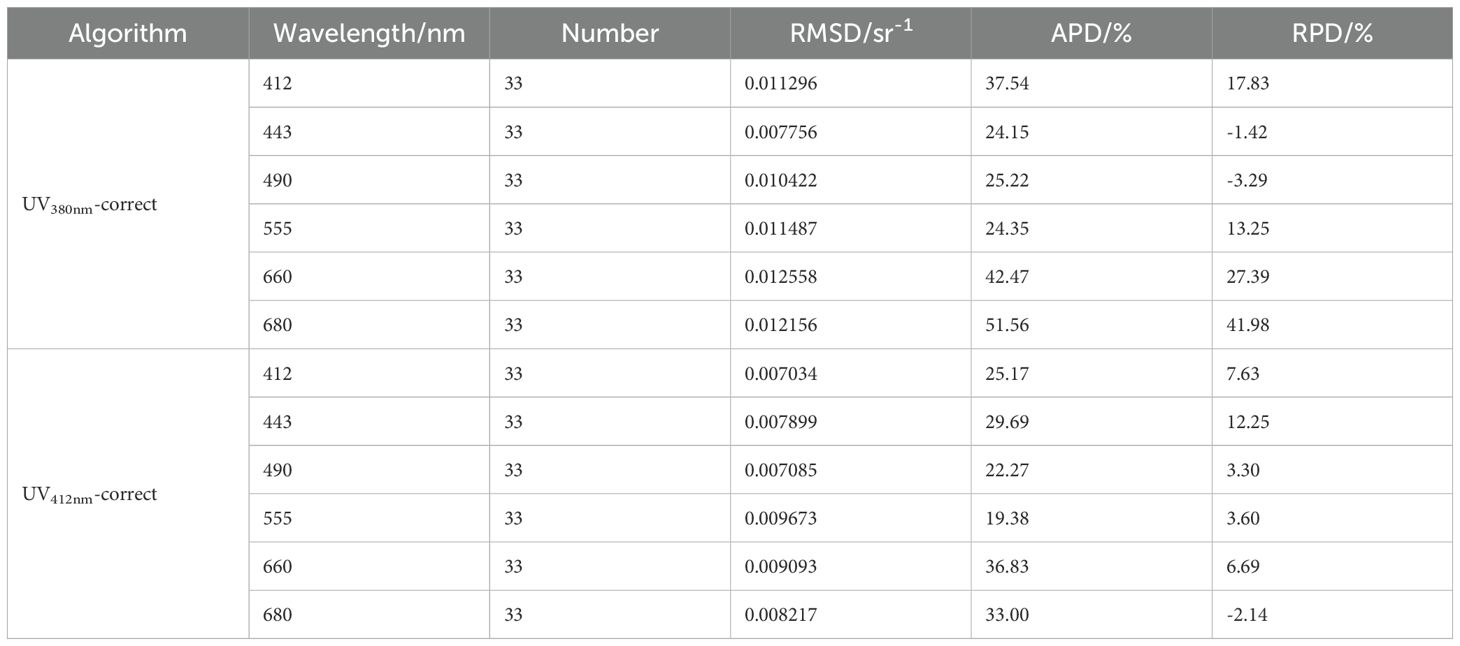
Table 3. Statistical results of the comparison between the Rrs values of various bands inverted via the two ultraviolet atmospheric correction algorithms and the measured Rrs values.
Table 4 provides the statistical results for the comparison of the Rrs values inverted via the three algorithms with the measured Rrs values. Overall, the results inverted via the UV412nm-correct atmospheric correction algorithm were the best. This occurred because UV atmospheric correction algorithms are designed primarily for highly turbid or eutrophic waters. Therefore, in Lake Taihu, UV atmospheric correction algorithms have better performance than the NIR atmospheric correction algorithm.
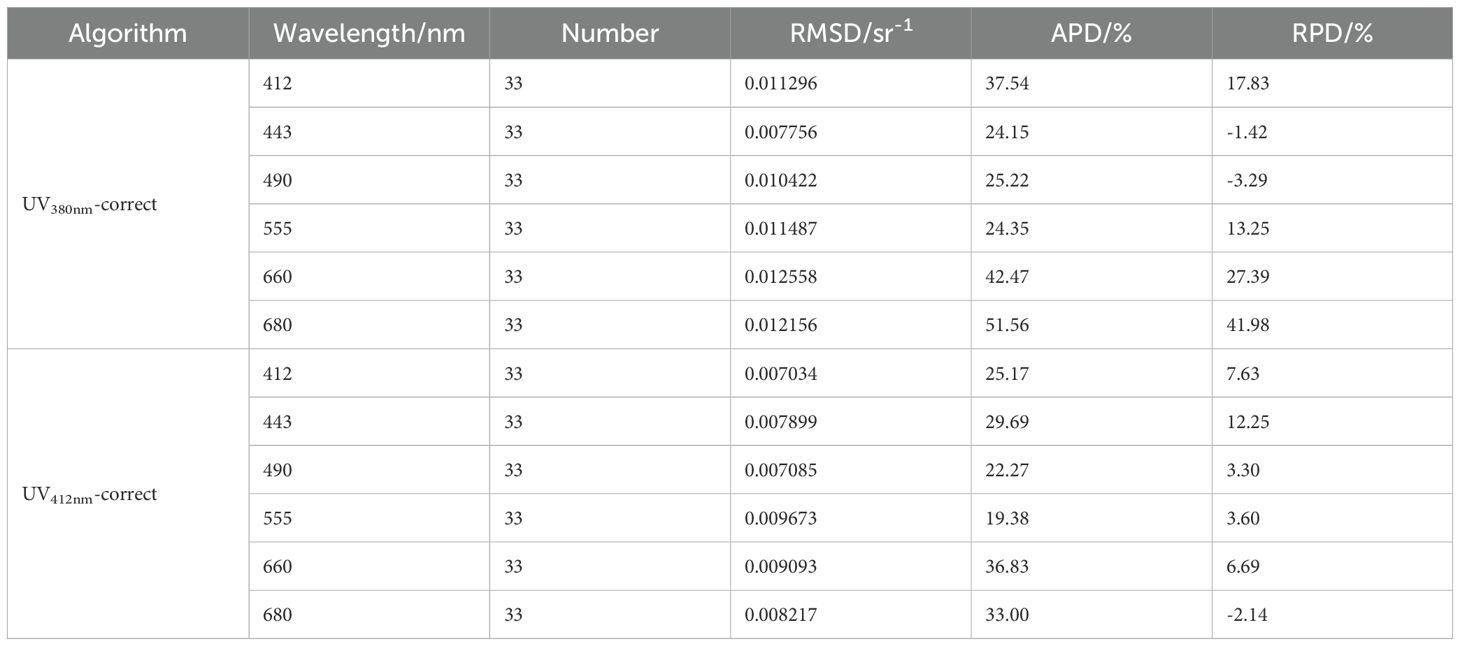
Table 4. Statistical results of the comparison of the Rrs values across all bands inverted via the three atmospheric correction algorithms with the measured Rrs data.
3.3 Assessment of the Rrs-derived products using two atmospheric correction algorithms
Figure 8 shows a comparison between the Chl-a, TSM, and aph values inverted via the NIR-correct atmospheric correction algorithm for the GOCI-II data and in situ values, with the corresponding statistical parameters also shown in Figure 8. There were 30 corresponding measured station data points matching the inverted Chl-a data, as shown in Figure 8A. At lower measured Chl-a values, the inverted GOCI-II results were greater than the measured values, whereas at higher measured Chl-a values, the inverted GOCI-II results were lower than the measured values. The overall RMSD was 16.301 mg/m³, with the APD of 45.76% and the RPD of 16.79%, indicating a significantly lower accuracy than that of the results for general open ocean waters. TSM inversion exhibited 25 corresponding measured station data matches, as shown in Figure 8B. When the TSM was greater than 55 mg/L, the inverted TSM values from the GOCI-II data were generally lower than the in situ values, and the scatter points were more dispersed. Owing to the Lake Taihu cruise being conducted only at two time-series stations (T-A and T-B) for sampling aph, there were fewer station data that could match the satellite observations, ultimately yielding 18 matching samples for the aph products. As shown in Figure 8C, similar to the scatter plot evaluation for the Chl-a product, when the measured value of aph was low (<0.7 m-¹), the scatter points occurred near the 1:1 line, whereas at higher measured values, the aph product inverted from the GOCI-II sensor data was significantly underestimated.

Figure 8. Comparison between the results of (A) the Chl-a concentration, (B) TSM concentration, and (C) aph inverted via the NIR-correct atmospheric correction algorithm and the measured data.
The Rrs products inverted via the UV412nm-correct atmospheric correction algorithm were used to estimate the Chl-a and TSM concentrations and aph. Figure 9 provide scatter plots and statistical parameters used to compare the inversion results of these three parameters with the in situ values. Compared with the inverted Chl-a values by the NIR-correct atmospheric correction algorithm, the inverted Chl-a values with the UV412nm-correct algorithm were more accurate (Figure 9A), with an APD of 28.84%. However, the underestimation issue at high Chl-a concentrations was not mitigated when this algorithm was used, primarily because of spectral band saturation attributed to high Chl-a concentrations, rendering the Chl-a inversion algorithm unsuitable. The accuracy of the TSM concentration calculated from the Rrs data inverted with the UV412nm-correct atmospheric correction algorithm also improved (Figure 9B), with results closer to the 1:1 line and a smaller APD value of 9.94%, which is lower than the value of 13.26% achieved with the NIR-correct atmospheric correction algorithm. Similar to Chl-a, the underestimation issue of aph at high values was not addressed. For eutrophic waters, there is a need to develop more suitable models for Chl-a and aph inversion algorithms.

Figure 9. Results of (A) the Chl-a concentration, (B) TSM concentration, and (C) aph inverted via the UV412nm-correct algorithm from the GOCI-II data compared with the actual measured results for these three parameters.
3.4 Stability of the GOCI-II retrieved hourly Rrs products
The GOCI-II obtains one observation per hour from 7:15 to 16:15 local time, providing a total of 10 observation images per day. Owing to the relatively high solar zenith angles during the first and second observations, as well as the ninth and tenth observations of the GOCI-II satellite, which can exceed 70° during the autumn and winter seasons, the stability of remote sensing products at different observation times must be examined. The comparison of the two observation periods depicted in Figure 10 reveals that the Rrs values inverted by the GOCI-II are closer to the measured Rrs values from 9:15 to 14:15, when the solar zenith angle is relatively low. The results for this period are clustered around the 1:1 line, whereas the results for other periods are more dispersed. The agreement between the Rrs values observed from 9:15 to 14:15 and inverted via the UV412nm-correct atmospheric correction algorithm was the best (Figure 10C). However, there was underestimation in the high-value areas for the inversion results of the 660 nm and 680 nm bands, whereas the results for the other bands were better. The Rrs results for the various bands from 9:15 to 14:15, as inverted via the UV380nm-correct atmospheric correction algorithm, were slightly worse than those inverted via the UV412nm-correct atmospheric correction algorithm. Among these bands, the results for the 660 nm and 680 nm bands were more scattered than those for the other bands were, but the results for the other bands were more accurate (Figure 10B). Similarly, the Rrs results for the various bands inverted via the NIR-correct algorithm between 9:15 and 14:15 showed that the results for the 660 nm and 680 nm bands were more scattered than those for the other bands were, and underestimation occurred when the Rrs value was high (Figure 10). Outside the period from 9:15 to 14:15, the inversion accuracies of the three atmospheric correction algorithms were poor, with very scattered data points.
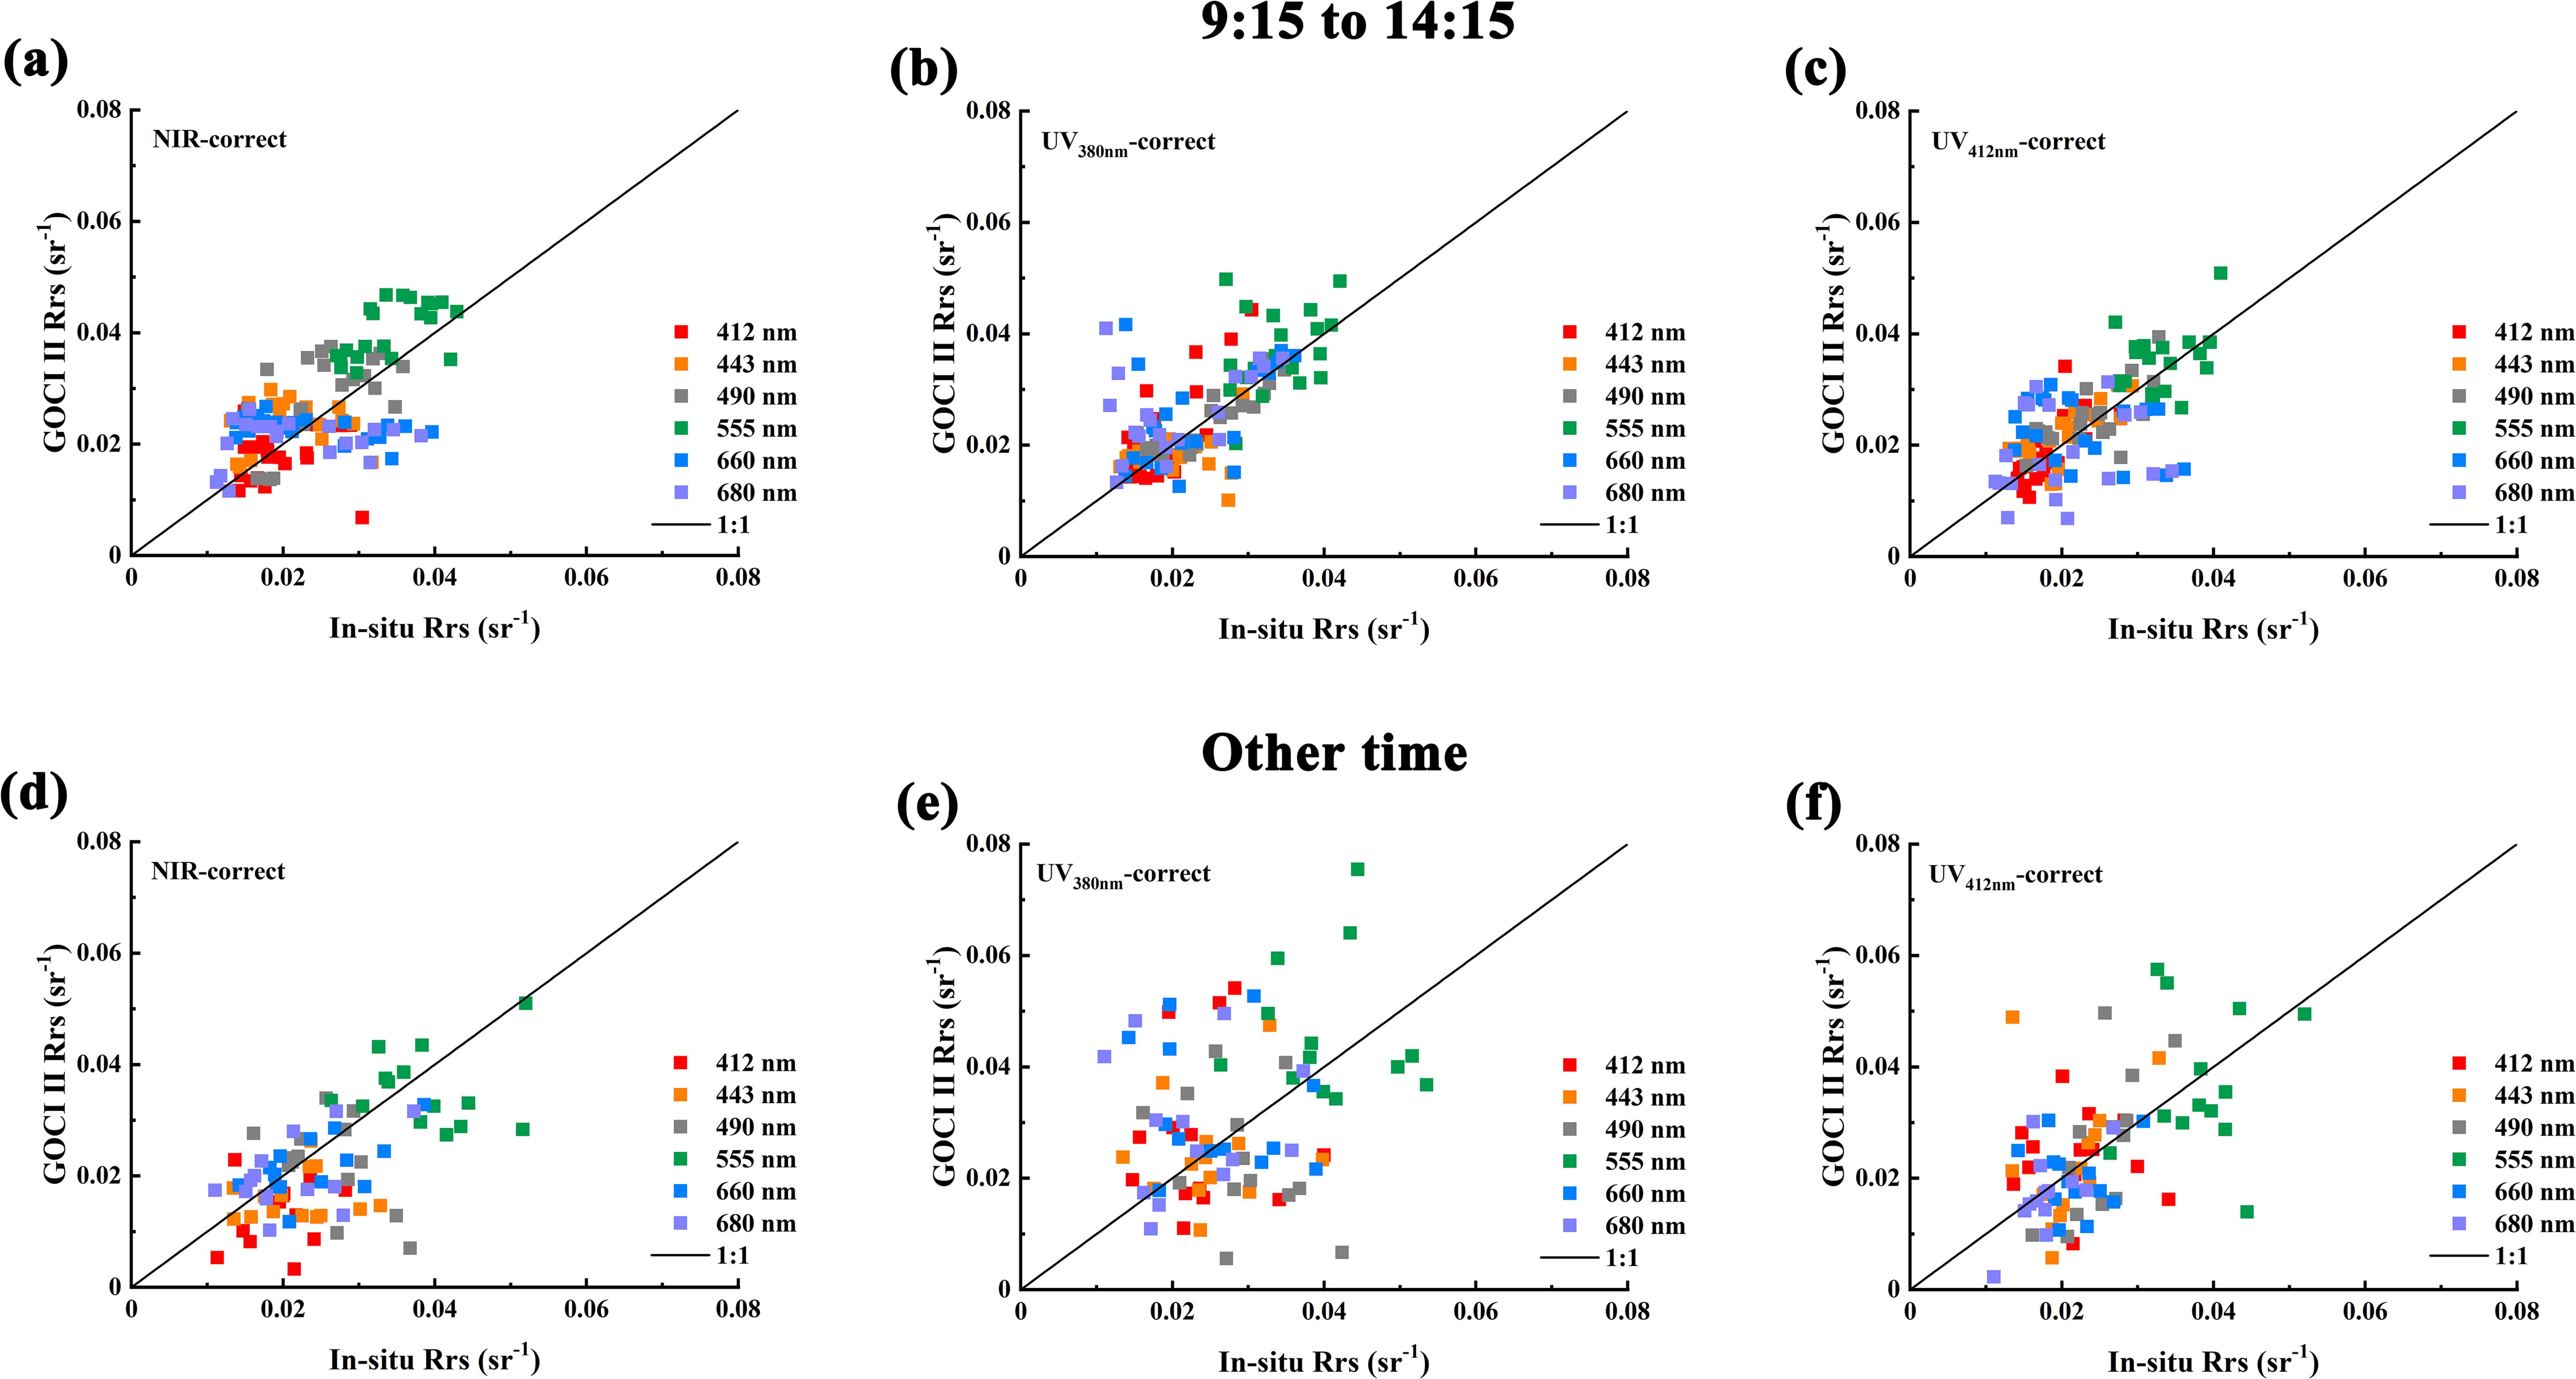
Figure 10. Comparison of the GOCI-II Rrs retrievals with in situ measurements for the two observation periods. (A–C) 9:15-14:15; (D–F) other time periods.
Tables 5, 6 provide the error statistics of the GOCI-II derived Rrs results for each band obtained via the different atmospheric correction algorithms across the two observation periods. The resutls indicate that for the NIR-correct atmospheric correction algorithm, the APD ranges from 20.80% to 31.37% at midday and from 20.68% to 41.63% at other times. The UV380nm-correct atmospheric correction algorithm yielded APD ranging from 11.12% to 25.08% at midday and from 32.66% to 56.73% at other times. Similarly, the UV412nm-correct atmospheric correction algorithm yielded APD ranging from 14.95% to 19.56% at midday and from 26.19% to 45.27% at other times. Overall, the APD range of the three algorithms at midday was much smaller than that at other times, indicating significantly better retrieval results at midday than during the dawn and dusk periods. This finding agrees with the validation results of ocean color remote sensing products from geostationary satellites reported by Lamquin et al. (2012) and Li et al. (2020).
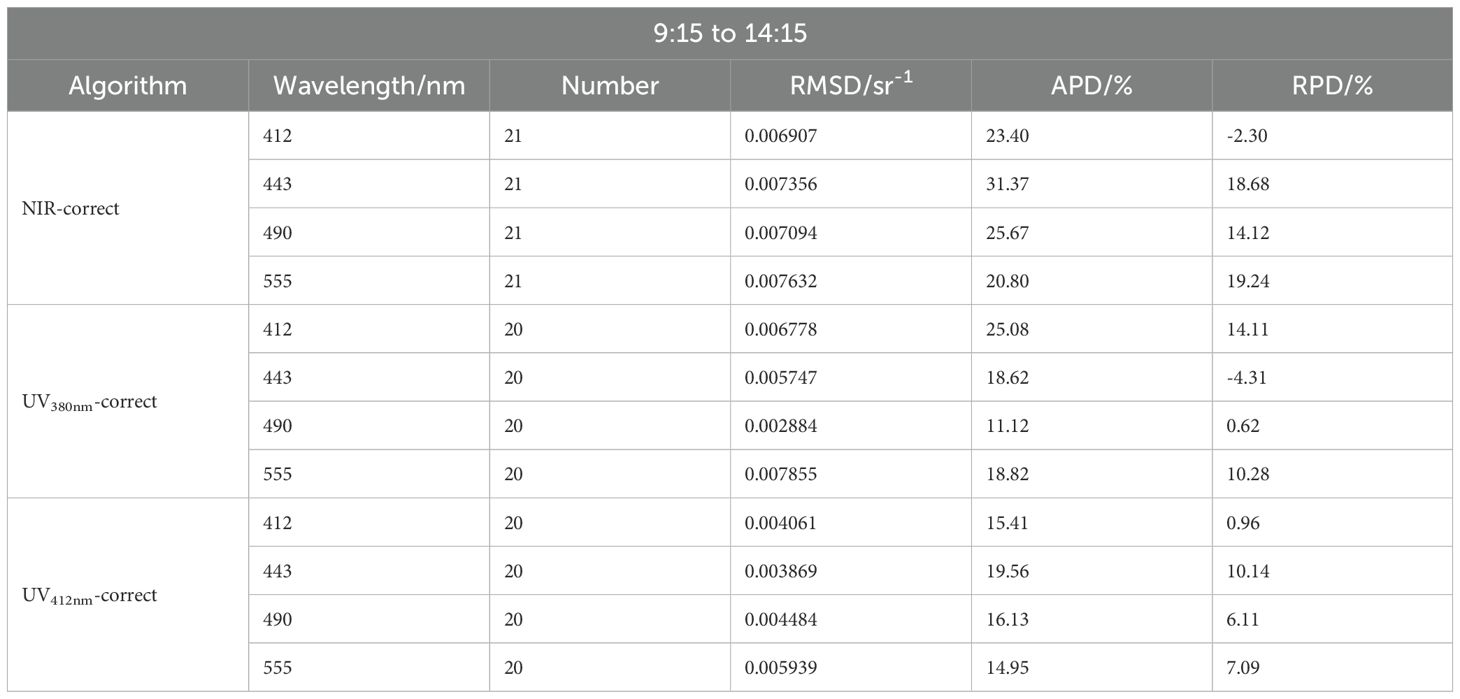
Table 5. Error statistics of the GOCI-II satellite Rrs results for each band obtained via the different atmospheric correction algorithms during the midday period from 9:15 to 14:15.

Table 6. Error statistics of the GOCI-II satellite Rrs results for each band obtained via the different atmospheric correction algorithms outside the period from 9:15 to 14:15.
3.5 Comparisons of the Rrs products between GOCI-II and MODIS
In addition to evaluating the accuracy of GOCI-II products using in situ data from Lake Taihu, we also conducted a cross-comparison with MODIS-Aqua products. The primary reason for this is that MODIS-Aqua products are widely recognized as a standard for ocean color remote sensing accuracy. This comparison highlights potential discrepancies between satellite products in eutrophic waters. The time window for matching MODIS and GOCI-II data is consistent with the matchup protocol, and spatially, we projected the data from both satellites onto a 0.04-degree resolution grid for comparison. Figure 11 shows the comparison of the Rrs products from the GOCI-II and MODIS satellite data in Lake Taihu on September 6, 2022. The figure reveals a notable difference in the Rrs products between the two satellites, despite a generally similar overall distribution. This observed difference could be attributed to variations in the spatial resolution, spectral bands, and atmospheric correction methodologies employed by the respective satellites. Previous research (Xiao et al., 2016) has emphasized a high level of agreement between the MODIS and GOCI products in oceanic environments, as well as between the GOCI and GOCI-II products. However, as shown in Figure 11, there was a significant lack of consistency between the satellite products in eutrophic waters, indicating a certain bias in the NIR atmospheric correction models when applied to such aquatic environments.
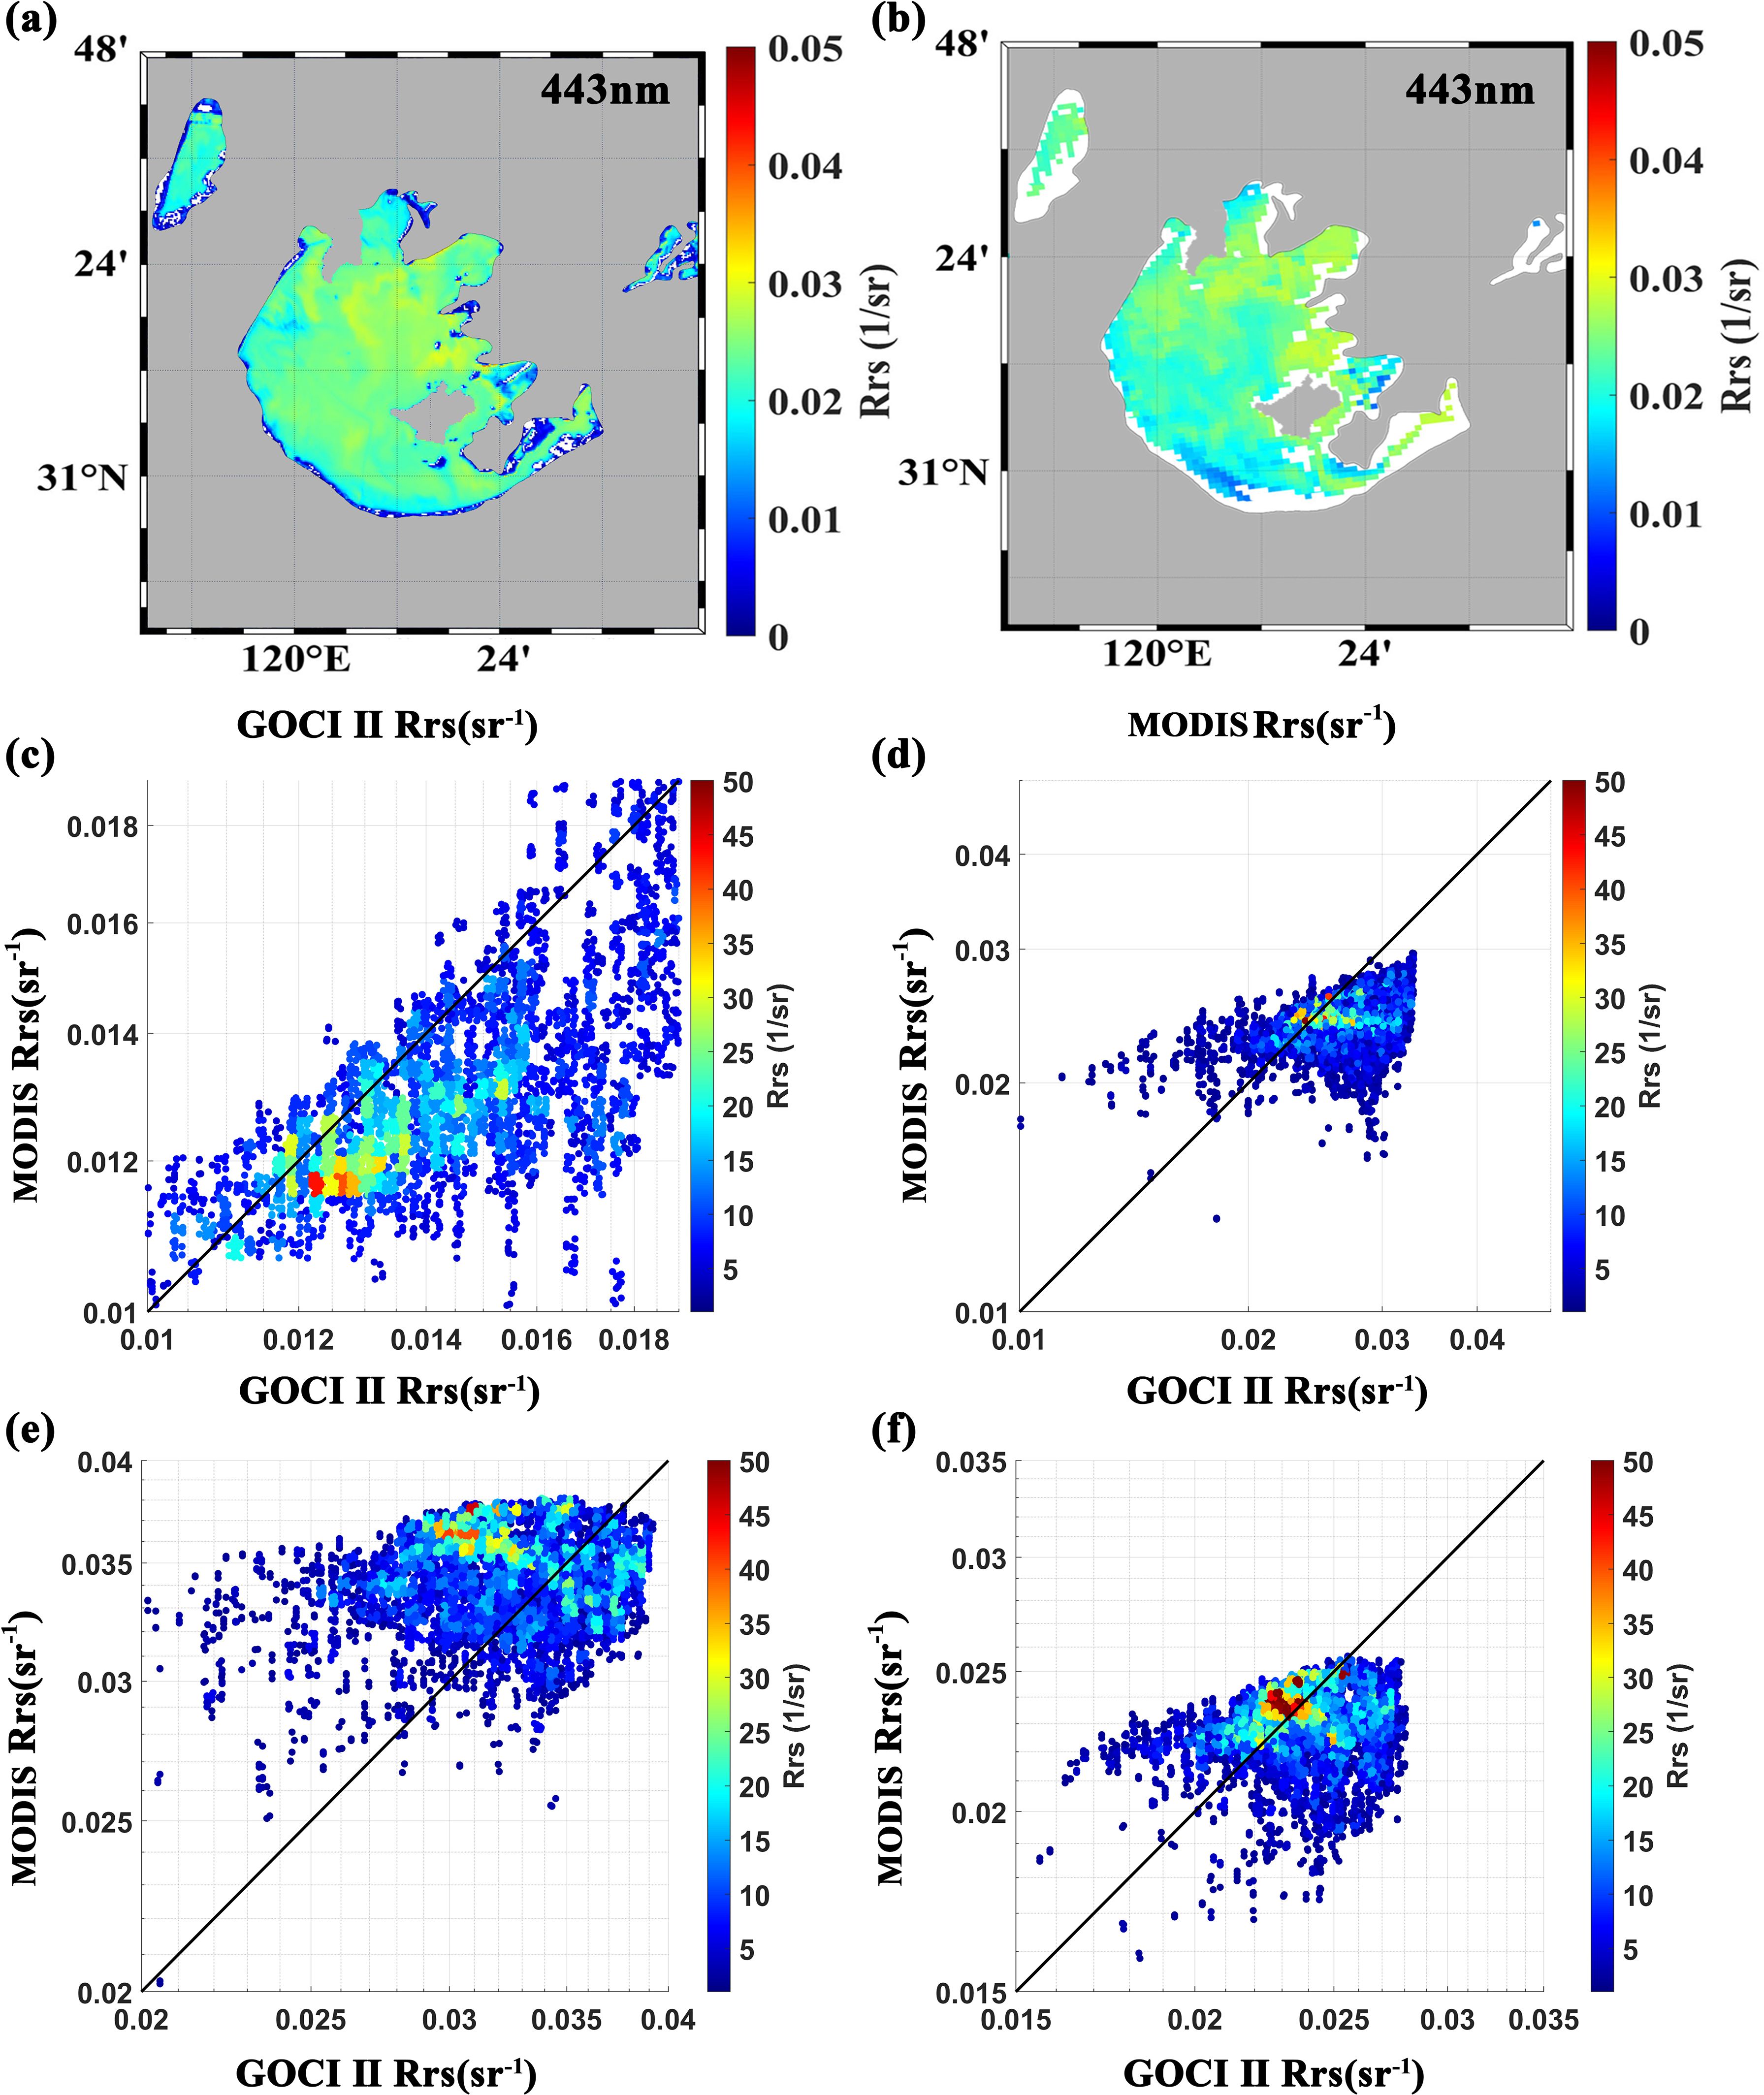
Figure 11. Comparison of the atmospheric correction results for Rrs of different bands of the GOCI-II and MODIS satellites over Lake Taihu on September 6, 2022. (A) Distribution of Rrs(443 nm) data from the GOCI-II satellite; (B) Same as (A), but for MODIS data; (C-F) Comparison of the atmospheric correction results for Rrs between the GOCI-II and MODIS satellite data. The color scales in (C–F) represent the number of overlapping pixels after matching.
4 Discussion
The evaluation of the GOCI-II atmospheric correction algorithm highlights key performance indicators in dynamic and eutrophic environments, such as Lake Taihu. The iterative optimization of the NIR algorithm falls short in effectively addressing atmospheric correction in extremely turbid waters. In contrast, the UV algorithm, which assumes a zero water-leaving radiance signal in the ultraviolet wavelength range, proves more suitable for these challenging conditions. Although theoretical considerations suggest that shorter wavelengths should exhibit stronger CDOM absorption, thereby making the zero water-leaving radiance assumption more justifiable, the findings of this study indicate that atmospheric correction utilizing the 412 nm band yields superior results. This enhancement may be attributed to the lower signal-to-noise ratio observed at the 380 nm band. Furthermore, atmospheric correction based on the 412 nm band can partially offset the overestimation of aerosol scattering in the near-infrared range, which arises from assuming white aerosols at shorter visible wavelengths. Consequently, the UV412 nm-corrected atmospheric correction algorithm produced the best results, particularly in the 490 nm and 555 nm bands. The NIR algorithm is well-suited for open ocean waters, while the UV algorithm is more effective for turbid coastal waters. Employing different atmospheric correction algorithms tailored to specific water types can significantly enhance the accuracy and efficiency of satellite data. Figure 12B illustrates the Rrs product at 443 nm from GOCI-II’s slot 10 on September 6, 2022, processed using a combined UV-NIR algorithm. This combined approach utilizes logistic regression to fit the proportions of turbid and clear waters, effectively avoiding stratification in the retrieved products. Compared to the results from the NIR algorithm shown in Figure 12A, the combined algorithm demonstrates a significant improvement in data efficiency.
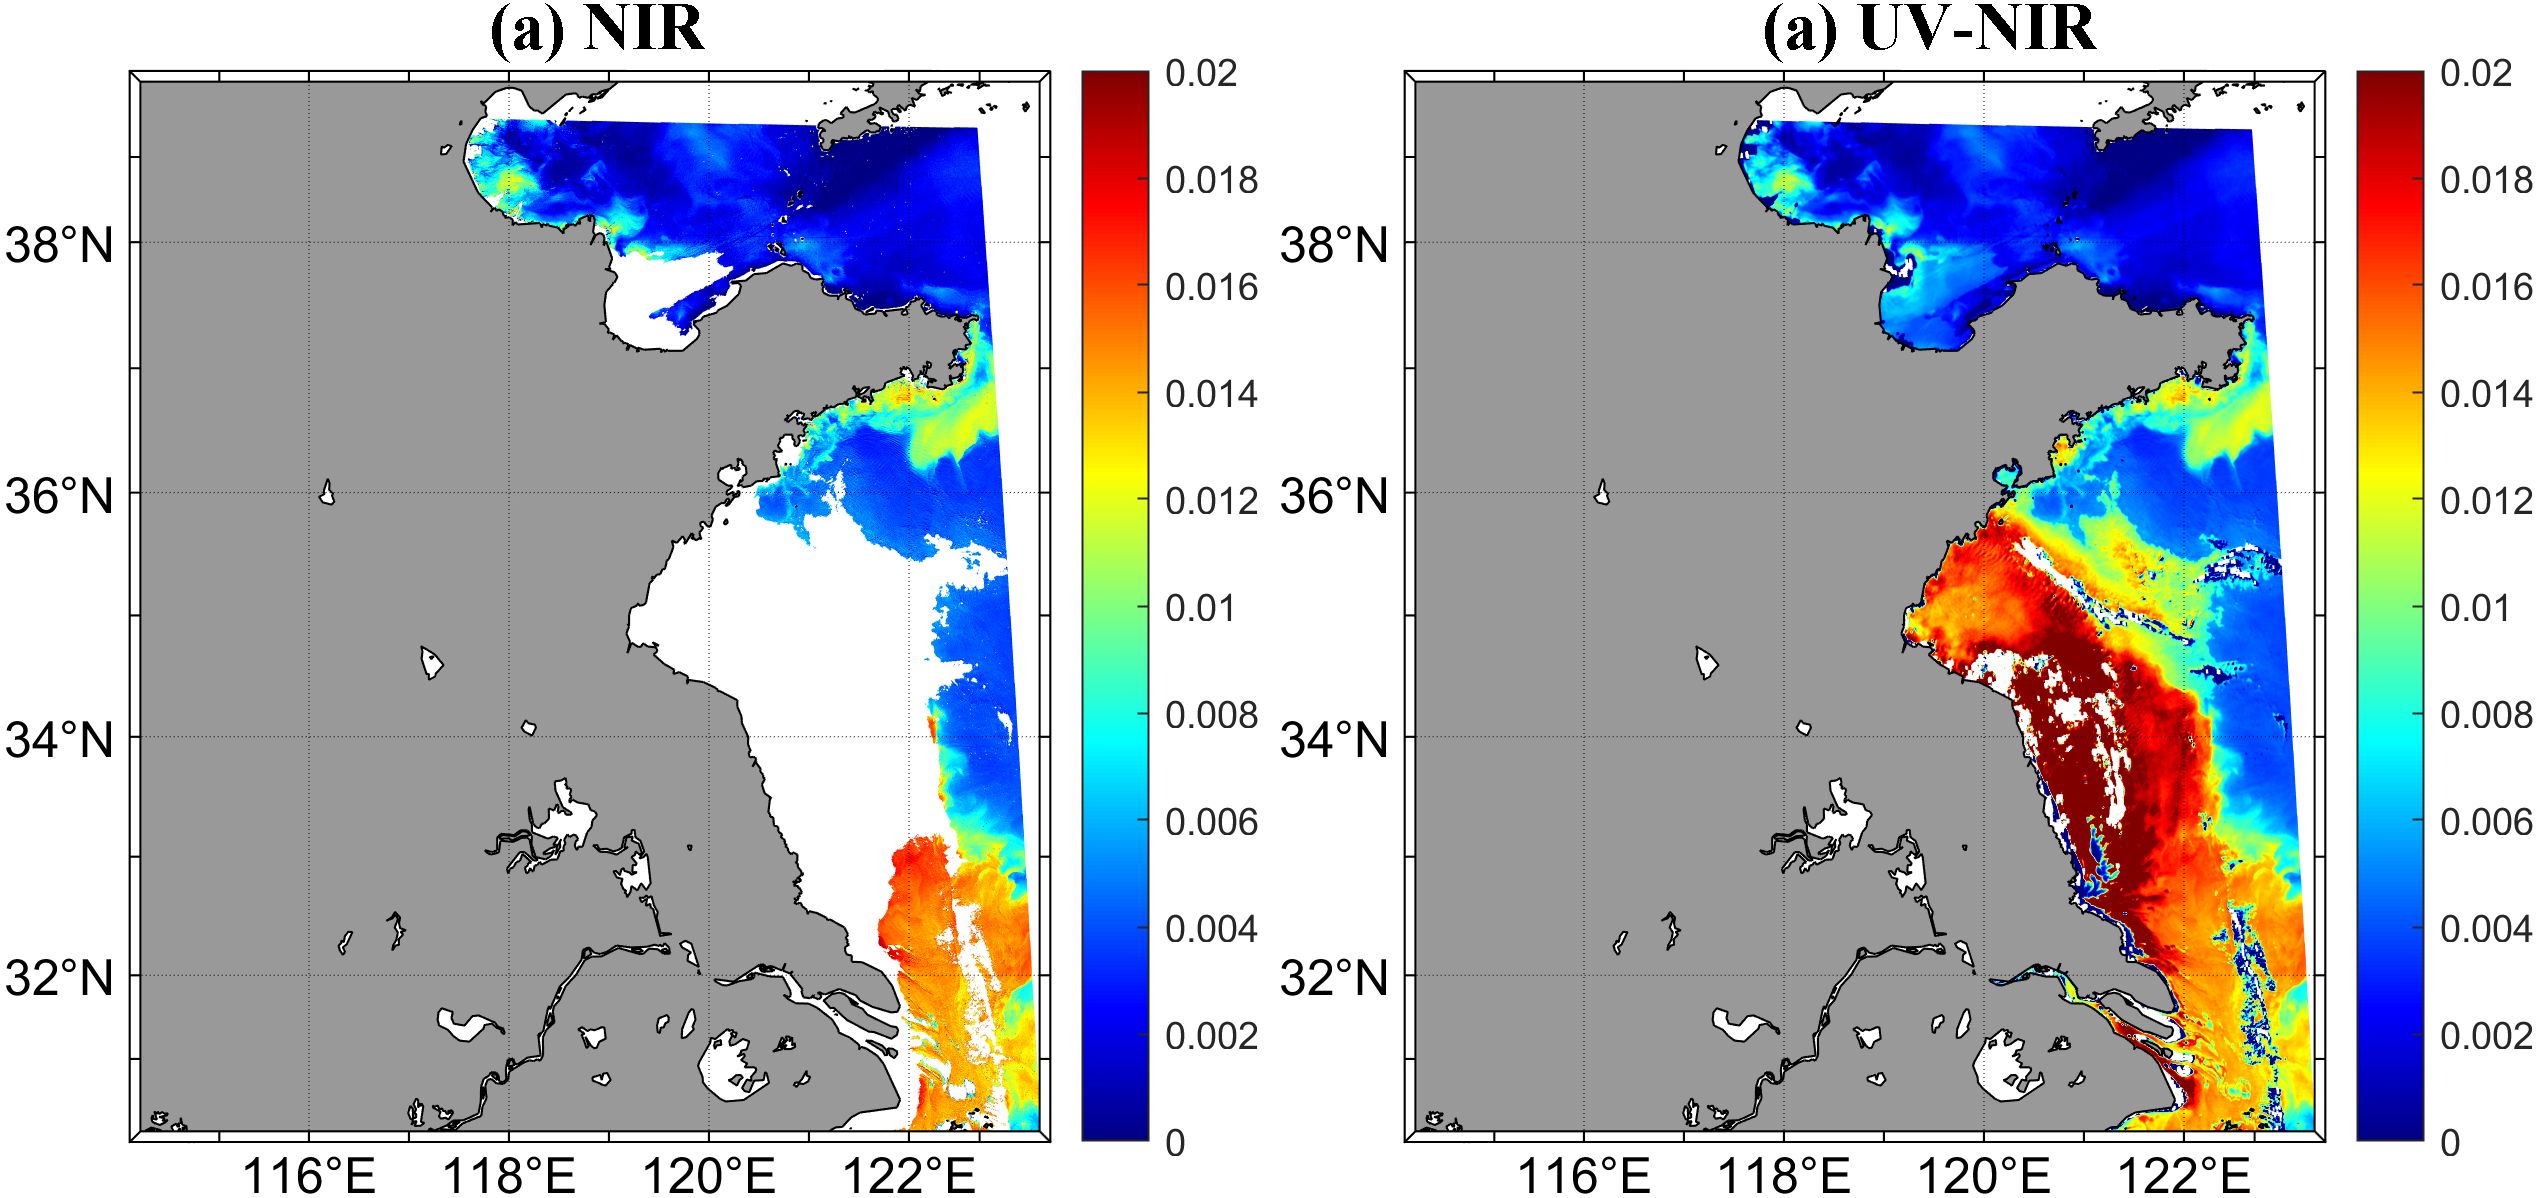
Figure 12. Rrs443 results processed with the NIR algorithm (A) and the combined UV-NIR algorithm (B) for GOCI-II slot 10 at 13:15 on September 6, 2022.
The inversion accuracy of near-infrared (NIR) and ultraviolet (UV) algorithms varies significantly over time. In particular, the UV algorithm is notably affected by observational conditions during sunrise and sunset, when the solar zenith angle is elevated. High solar zenith angles reduce illumination, increasing the optical path for Rayleigh and aerosol scattering, which in turn amplifies bidirectional reflectance effects. Furthermore, the influence of Earth’s curvature becomes more pronounced at high zenith angles, diminishing the effectiveness of traditional atmospheric correction models. Looking forward, enhancing the accuracy of satellite products will require leveraging the strengths of multiple atmospheric correction algorithms and tailoring specific correction methods for different water body types. Additionally, dedicated algorithms are needed for satellite data collected during dawn and dusk to effectively mitigate the impact of varying solar zenith angles on observational accuracy. Li et al. (2022) developed a neural network atmospheric correction algorithm for GOCI, which utilizes midday remote sensing reflectance products paired with Rayleigh-corrected radiance from dawn and dusk observations to construct a training dataset. The neural network model trained on this dataset can effectively handle satellite data from dawn and dusk. Figure 13 demonstrates this model’s results for Taihu Lake data on September 6, 2022, at 15:15, showing improvements compared to the anomalously high values in Figure 5 for this time interval.
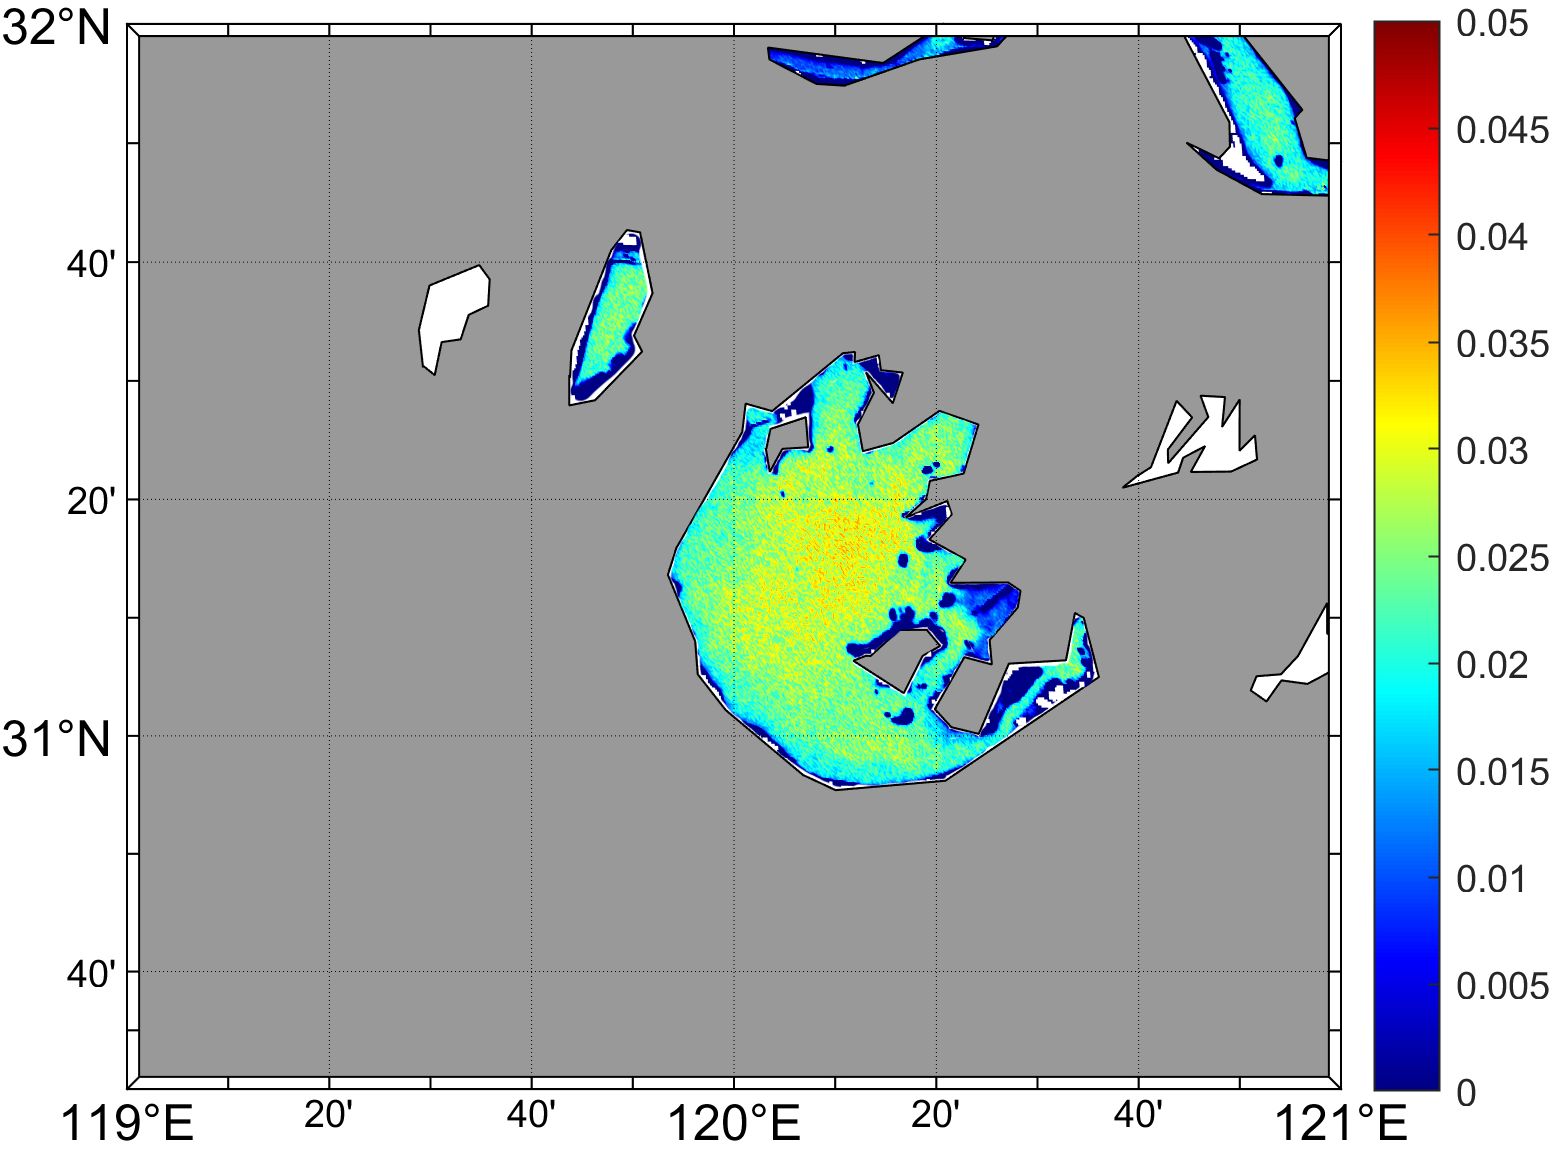
Figure 13. Rrs443 results for Lake Taihu on September 6, 2022, at 15:15, processed using the neural network atmospheric correction algorithm with GOCI-II data.
5 Conclusion
In this study, the accuracy of GOCI-II retrieval results was evaluated via in situ data obtained during cruises in Lake Taihu, and the Rrs products retrieved via three types of atmospheric correction algorithms, namely, UV380nm-correct, UV412nm-correct, and NIR-correct atmospheric correction algorithms, were investigated. The results revealed that the UV412nm-correct atmospheric correction algorithm performed better for the Lake Taihu, whereas the NIR atmospheric correction algorithm exhibited significant underestimation. Compared with the UV412nm-correct atmospheric correction algorithm, the UV380nm-correct atmospheric correction algorithm also performed better but yielded more scattered results. Overall, the UV412nm-correct atmospheric correction algorithm achieved the highest retrieval accuracy for Lake Taihu, with APDs of 25.17% (412 nm), 29.69% (443 nm), 22.27% (490 nm), 19.38% (555 nm), 36.83% (660 nm), and 33.00% (680 nm). Additionally, the Chl-a, TSM, and aph data obtained from the GOCI-II were comparatively analyzed via the NIR-correct and UV412nm-correct atmospheric correction algorithms. Notably, the 412 nm band outperformed the 380 nm band when using UV correction, likely due to the lower signal-to-noise ratio of the 380 nm band and smaller extrapolation errors when assuming a zero signal for the 412 nm band. A combined UV-NIR atmospheric correction algorithm may be more suitable for addressing various types of water environments. Additionally, more suitable retrieval algorithms are needed to improve the accuracy of chlorophyll concentration and phytoplankton absorption in eutrophic waters. The hourly stability of the Rrs retrieval results at different observation times of the GOCI-II was also analyzed. The results revealed that with the UV412nm-correct atmospheric correction algorithm, the TSM concentration data exhibited an APD value of 9.94%, and an RPD value of 1.46%; the Chl-a concentration data exhibited an APD value of 28.84%, and an RPD value of -7.04%; and the aph data exhibited an APD value of 29.22%, and an RPD value of -2.30%. The stability and quality of the GOCI-II satellite products during the six periods around noontime were significantly better than those during the other four periods close to dawn or dusk, indicating that more accurate atmospheric correction algorithm should be developed for the GOCI-II observations at dawn and dusk in Lake Taihu.
Data availability statement
The raw data supporting the conclusions of this article will be made available by the authors, without undue reservation.
Author contributions
MZ: Conceptualization, Writing – original draft. HuL: Investigation, Software, Writing – review & editing. HaL: Data curation, Methodology, Writing – original draft. XZ: Formal analysis, Project administration, Writing – original draft. XD: Formal analysis, Project administration, Writing – review & editing. FG: Funding acquisition, Resources, Writing – review & editing.
Funding
The author(s) declare financial support was received for the research, authorship, and/or publication of this article. We would like to thank the staff of the satellite ground station, satellite data processing and sharing center, and marine satellite data online analysis platform of the State Key Laboratory of Satellite Ocean Environment Dynamics, Second Institute of Oceanography, Ministry of Natural Resources (SOED/SIO/MNR) for their help with data processing. This research was funded by the National Key Research and Development Program of China (Grant #2023YFC3108101), the National Natural Science Foundation of China (Grant #U23A2037, #42206183), the “Pioneer” R&D Program of Zhejiang (2023C03011), the Zhejiang Provincial Natural Science Foundation of China (Grant #LDT23D06021D06, #LY24D060005), and the project of the Donghai Laboratory (Grant #L24QH013, #DH-2023QH0002).
Acknowledgments
We would like to thank the staff of the satellite ground station, satellite data processing and sharing center, and marine satellite data online analysis platform of the State Key Laboratory of Satellite Ocean Environment Dynamics, Second Institute of Oceanography, Ministry of Natural Resources (SOED/SIO/MNR) for their help with data processing. This research was funded by the National Key Research and Development Program of China (Grant #2023YFC3108101), the National Natural Science Foundation of China (Grant #U23A2037, #42206183), the “Pioneer” R&D Program of Zhejiang (2023C03011), the Zhejiang Provincial Natural Science Foundation of China (Grant #LDT23D06021D06, # LY24D060005), and the project of the Donghai Laboratory (Grant #L24QH013, #DH-2023QH0002).
Conflict of interest
The authors declare that the research was conducted in the absence of any commercial or financial relationships that could be construed as a potential conflict of interest.
Publisher’s note
All claims expressed in this article are solely those of the authors and do not necessarily represent those of their affiliated organizations, or those of the publisher, the editors and the reviewers. Any product that may be evaluated in this article, or claim that may be made by its manufacturer, is not guaranteed or endorsed by the publisher.
References
Abbott M. R., Letelier R. M. (1999). Decorrelation scales of chlorophyll as observed from bio-optical drifters in the California Current. Deep Sea Research Part II: Topical Studies in Oceanography, 45 (8-9), 1639–1667.
Ahn J. H., Park Y. J. (2020). Estimating water reflectance at near-infrared wavelengths for turbid water atmospheric correction: A preliminary study for GOCI-II. Remote Sens. 12, 3791. doi: 10.3390/rs12223791
Ahn J. H., Park Y. J., Kim W., Lee B. (2016). Simple aerosol correction technique based on the spectral relationships of the aerosol multiple-scattering reflectances for atmospheric correction over the oceans. Optics. Express. 24, 29660–29670. doi: 10.1364/oe.24.029659
Bailey S. W., Werdell P.J. (2006). A multi-sensor approach for the on-orbit validation of ocean color satellite data products. Remote Sens. Environ. 102.1-2, 12–23. doi: 10.1016/j.rse.2006.01.015
Ding X., Gong F., Li J., Zhao M., Li H., Bai R., et al(2024). High-frequency monitoring of Secchi-disk depth in Taihu Lake using Himawari-8/AHI data. Optics Express, 31 (10), 15966–15982.
Dokulil M. T., Teubner K. (2011). Eutrophication and climate change: present situation and future scenarios. Eutrophication.: Causes. Consequences. Control. 2011, 1–16. doi: 10.1007/978-90-481-9625-8_1
Duan H., Ma R., Xu X., Kong F., Zhang S., Kong W., et al. (2009). Two-decade reconstruction of algal blooms in China’s lake Taihu. Environ. Sci. Technol. 43, 3522–3528. doi: 10.1021/es8031852
Fu J. (2016). Issue of cyanobacteria blooms in Taihu lake, China. J. Environ. Sci. Manage. 19, 99–109. doi: 10.1016/j.cclet.2021.12.044
Guo C., Zhu G., Qin B., Zhang Y., Zhu M., Xu H., et al. (2019). Climate exerts a greater modulating effect on the phytoplankton community after 2007 in eutrophic Lake Taihu, China: Evidence from 25 years of recordings. Ecol. Indic. 105, 82–91. doi: 10.1016/j.ecolind.2019.05.034
Han Y., Liu Y., Rong X., Wang M., Xue Y., Dai H., et al. (2023). Exposure, distribution, and ecological risk of four new bisphenol analogs in the typical lake region of taihu lake. Exposure. Health. 16 (4), 1027–1037 doi: 10.1007/s12403-023-00608-2
He X., Bai Y., Pan D., Huang N., Dong X., Chen J., et al. (2013). Using geostationary satellite ocean color data to map the diurnal dynamics of suspended particulate matter in coastal waters. Remote Sens. Environ. 133, 225–239. doi: 10.1016/j.rse.2013.01.023
He X., Bai Y., Pan D., Tang J., Wang D. (2012). Atmospheric correction of satellite ocean color imagery using the ultraviolet wavelength for highly turbid waters. Optics. Express. 20, 20754–20770. doi: 10.1364/oe.20.020754
Holm-Hansen O., Lorenzen C. J., Holmes R. W., Strickland J. D. J. I. J. O. M. S. (1965). Fluorometric determination of chlorophyll. ICES. J. Mar. Sci. 30, 3–15. doi: 10.1093/icesjms/30.1.3
Hu Z., Qi Y., He X., Wang Y. H., Wang D. P., Cheng X. (2019). Characterizing surface circulation in the Taiwan Strait during NE monsoon from Geostationary Ocean Color Imager. Remote Sensing of Environment, 221, 687–694.
Huang L., Fang H., He G., Jiang H., Wang C. (2016). Effects of internal loading on phosphorus distribution in the Taihu Lake driven by wind waves and lake currents. Environ. pollut. 219, 760–773. doi: 10.1016/j.envpol.2016.07.049
Kang M., Ahn M. H., Ko D. H., Kim J., Nicks D., Eo M., et al. (2022). Characteristics of the spectral response function of geostationary environment monitoring spectrometer analyzed by ground and in-orbit measurements. IEEE Trans. Geosci. Remote Sens. 60, 1–16. doi: 10.1109/tgrs.2021.3091677
Kim D. W., Kim S. H., Baek J. Y., Lee J. S., Jo Y. H. (2022). GOCI-II based sea surface salinity estimation using machine learning for the first-year summer. Int. J. Remote Sens. 43, 6605–6623. doi: 10.1080/01431161.2022.2142080
Kim M., Park M. S. (2021). The GOCI-II early mission marine fog detection products: optical characteristics and verification. Korean. J. Remote Sens. 37, 1317–1328. doi: 10.7780/kjrs.2021.37.5.2.9
Kim W., Moon J. E., Park Y. J., Ishizaka J. (2016). Evaluation of chlorophyll retrievals from Geostationary Ocean Color Imager (GOCI) for the North-East Asian region. Remote Sens. Environ. 184, 482–495. doi: 10.1016/j.rse.2016.07.031
Kim Y. J., Han D., Jang E., Im J., Sung T. (2023). Remote sensing of sea surface salinity: challenges and research directions. GISci. Remote Sens. 60, 2166377. doi: 10.1080/15481603.2023.2166377
Lamquin N., Mazeran C., Doxaran D., Ryu J. H., Park Y. J. J. O. S. J. (2012). Assessment of GOCI radiometric products using MERIS, MODIS and field measurements. Ocean. Sci. J. 47, 287–311. doi: 10.1007/s12601-012-0029-z
Lee Z., Carder K. L., Arnone R. A. (2002). Deriving inherent optical properties from water color: a multiband quasi-analytical algorithm for optically deep waters. Appl. Optics. 41, 5755–5772. doi: 10.1364/AO.41.005755
Lee S., Kim J., Ahn J. H., Lim H., Cho Y. (2021). Exploiting GOCI-II UV channel to observe absorbing aerosols. Korean. J. Remote Sens. 37, 1697–1707. doi: 10.7780/kjrs.2021.37.6.1.17
Li H., He X., Bai Y., Shanmugam P., Park Y. J., Liu J., et al. (2020). Atmospheric correction of geostationary satellite ocean color data under high solar zenith angles in open oceans. Remote Sens. Environ. 249, 112022. doi: 10.1016/j.rse.2020.112022
Li J., Ma R., Xue K., Loiselle S. (2020). Drivers to spatial and temporal dynamics of column integrated phytoplankton biomass in the shallow lake of Chaohu, China. Ecol. Indic. 109, 105812. doi: 10.1016/j.ecolind.2019.105812
Li H., He X., Bai Y., Gong F., Wang D., Li T. (2022). Restoration of wintertime ocean color remote sensing products for the high-latitude oceans of the Southern Hemisphere. IEEE Transactions on Geoscience and Remote Sensing, 60, 1–12.
Lian H., Lei Q., Zhang X., Haw Y., Wang H., Zhai L., et al. (2018). Effects of anthropogenic activities on long-term changes of nitrogen budget in a plain river network region: A case study in the Taihu Basin. Sci. Total. Environ. 645, 1212–1220. doi: 10.1016/j.scitotenv.2018.06.354
Liang Q., Zhang Y., Ma R., Loiselle S., Li J., Hu M. (2017). A MODIS-based novel method to distinguish surface cyanobacterial scums and aquatic macrophytes in lake taihu. Remote Sens. 9 (2), 133. doi: 10.3390/rs9020133
Lu X., Lu Y., Chen D., Su C., Song S., Wang T., et al. (2019). Climate change induced eutrophication of cold-water lake in an ecologically fragile nature reserve. J. Environ. Sci. 75, 359–369. doi: 10.1016/j.jes.2018.05.018
Mueller J. L., Fargion G. S. (2003). Ocean optics protocols for satellite ocean color sensor validation, revision 3 (Vol. 210004). National Aeronautics and Space Administration, Goddard Space Flight Center.
O’reilly J. E., Maritorena S., Mitchell B. G., Siegel D. A., Carder K. L., Garver S. A., et al. (1998). Ocean color chlorophyll algorithms for SeaWiFS. J. Geophys. Research-Oceans. 103, 24937–24953. doi: 10.1029/98jc02160
Park M. S., Jung H. C., Lee S., Ahn J. H., Bae S., Choi J. K. (2021). The GOCI-II early mission ocean color products in comparison with the GOCI toward the continuity of chollian multi-satellite ocean color data. Korean. J. Remote Sens. 37, 1281–1293. doi: 10.7780/kjrs.2021.37.5.2.6
Qiao J., Yang L., Yan T., Xue F., Zhao D. (2012). Nitrogen fertilizer reduction in rice production for two consecutive years in the Taihu Lake area. Agric. Ecosyst. Environ. 146, 103–112. doi: 10.1016/j.agee.2011.10.014
Shin J., Lee J. S., Jang L. H., Lim J., Khim B. K., Jo Y. H. (2021). Sargassum detection using machine learning models: A case study with the first 6 months of GOCI-II imagery. Remote Sens. 13 (23), 4844. doi: 10.3390/rs13234844
Siswanto E., Tang J., Yamaguchi H., Ahn Y. H., Ishizaka J., Yoo S., et al. (2011). Empirical ocean-color algorithms to retrieve chlorophyll-a, total suspended matter, and colored dissolved organic matter absorption coefficient in the Yellow and East China Seas. J. Oceanogr. 67, 627–650. doi: 10.1007/s10872-011-0062-z
Song X., Liu Z., Yang G., Chen Y. (2010). Effects of resuspension and eutrophication level on summer phytoplankton dynamics in two hypertrophic areas of Lake Taihu, China. Aquat. Ecol. 44, 41–54. doi: 10.1007/s10452-009-9258-3
Xiao Q., Zhang H., Choi M., Li S., Kondragunta S., Kim J., et al. (2016). Evaluation of VIIRS, GOCI, and MODIS Collection 6 AOD retrievals against ground sunphotometer observations over East Asia. Atmos. Chem. Phys. 16, 1255–1269. doi: 10.5194/acp-16-1255-2016
Xu Y., Liu W., Song J., Yao L., Gu S. (2018). Dynamic monitoring of the lake area in the middle and lower reaches of the yangtze river using MODIS images between 2000 and 2016. IEEE J. Selected. Topics. Appl. Earth Observations. Remote Sens. 11, 4690–4700. doi: 10.1109/jstars.2018.2877390
Xu M., Liu H., Beck R., Lekki J., Yang B., Shu S. (2019). Regionally and locally adaptive models for retrieving chlorophyll-a concentration in inland waters from remotely sensed multispectral and hyperspectral imagery. IEEE Transactions on Geoscience and Remote Sensing, 57 (7), 4758–4774.
Yang H., Han H. J., Heo J. M., Jeong J., Lee T., Hu W., et al. (2018). “Ocean color algorithm development environment for high-speed data processing of GOCI-II,” in 38th IEEE International Geoscience and Remote Sensing Symposium (IGARSS), pp. 7968–7971.
Zhai S., Hu W., Zhu Z. (2010). Ecological impacts of water transfers on Lake Taihu from the Yangtze River, China. Ecol. Eng. 36, 406–420. doi: 10.1016/j.ecoleng.2009.11.007
Zhang Y., Chen J., Hu J., Lu P., Lv J., Chen X., et al. (2018). Extraction of cyanobacteria in Taihu Lake based on remote sensing image. In 2018 International Conference on Microwave and Millimeter Wave Technology (ICMMT) (pp. 1–3). IEEE.
Zhang X., Li B., Xu H., Wells M., Tefsen B., Qin B. (2019). Effect of micronutrients on algae in different regions of Taihu, a large, spatially diverse, hypereutrophic lake. Water Res. 151, 500–514. doi: 10.1016/j.watres.2018.12.023
Zhang H., Yang L., Li Y., Wang C., Zhang W., Wang L., et al. (2022). Pollution gradients shape the co-occurrence networks and interactions of sedimentary bacterial communities in Taihu Lake, a shallow eutrophic lake. J. Environ. Manage. 305, 114380. doi: 10.1016/j.jenvman.2021.114380
Keywords: geostationary ocean color imager-II (GOCI-II), remote sensing products, validation, atmospheric correction, Lake Taihu
Citation: Zhao M, Li H, Li H, Zhang X, Ding X and Gong F (2024) Assessment of GOCI-II satellite remote sensing products in Lake Taihu. Front. Mar. Sci. 11:1488219. doi: 10.3389/fmars.2024.1488219
Received: 29 August 2024; Accepted: 06 November 2024;
Published: 25 November 2024.
Edited by:
Jianwei Wei, Center for Satellite Applications and Research (STAR), United StatesReviewed by:
Srinivas Kolluru, University of Georgia, United StatesJunfang Lin, Plymouth Marine Laboratory, United Kingdom
Jae-Hyun Ahn, Korea Institute of Ocean Science and Technology (KIOST), Republic of Korea
Copyright © 2024 Zhao, Li, Li, Zhang, Ding and Gong. This is an open-access article distributed under the terms of the Creative Commons Attribution License (CC BY). The use, distribution or reproduction in other forums is permitted, provided the original author(s) and the copyright owner(s) are credited and that the original publication in this journal is cited, in accordance with accepted academic practice. No use, distribution or reproduction is permitted which does not comply with these terms.
*Correspondence: Huaming Li, bGlodWFtaW5nQHpqZW1jLm9yZy5jbg==
 Min Zhao
 Huaming Li3*
 Hao Li
 Xiaosong Ding