- 1Fuzhou Institute of Oceanography, Miniiang University, Fuzhou, China
- 2Fujian Provincial Key Laboratory of Environmental EngineeringProvincial Academy of Environmental Science, Fujian, Fuzhou, China
- 3Department of Water Resources and Harbor Engineering, Fuzhou University, Fuzhou, China
- 4College of Ocean and Earth Sciences, Xiamen University, Xiamen, China
Water discharge and sediment load are often controlled by a combination of factors. However, the relationship between water and sediment load changes and meteorological oscillations has rarely been explored for different river sizes. Explanations for the various responses of water-sediment changes to meteorological factors in different rivers is important for understanding global hydrology. In this study, we analyzed data from 2002-2022 using cross-wavelet and wavelet coherence in an attempt to characterize the effects of large-scale climatic oscillations on 10 rivers in eastern China. Comparing the results shows that water releases lag three months or more behind SST variations. It also oscillates interannually (mostly every 8-16 months). Most rivers runoff lags changes in PDO by three months or more. The impact of ENSO (El Niño-Southern Oscillation) on each river basin gradually decreases from south to north. The impacts on northern rivers such as the Yellow River, Huai Riverand Liao River are weaker. At the same time, the water discharge changes in the Pearl River and Minjiang River basins in southeastern China are extremely rapid and sensitive to ENSO events. Meanwhile, the impacts of ENSO on large rivers lasted throughout the study period, while the impacts of ENSO on smaller rivers had intermittent periods, and the response rates of geographically similar mountain and stream-type rivers were not the same. The effect of the PDO (Pacific Decadal Oscillation) warm and cold phases was different for each region. Our research contributes to understanding the relationship between rivers and climate oscillations, advancing Water-Sediment Balance and Global Sustainability—key goals of the United Nations 2030 Agenda for Sustainable Development.
1 Introduction
Climate change is affecting the changing characteristics and long-term trends of many rivers around the globe (Milly et al., 2005; Cohen et al., 2014), and some scholars have pointed out that climate change may exacerbate the extent of global flow decline in the future, triggering a water crisis (Zhang et al., 2023). The massive reduction of river sediment has caused a series of problems such as shoreline erosion and sediment retention (Milliman and Syvitski, 1992; Chen et al., 2010; Li et al., 2020; Dethier et al., 2022). Watersheds face great threats in ecological processes. Therefore, it is important to analyze the changes in climate on river water discharge and sediment load to better predict future river hydrological change.
In studying the evolution of water discharge and sediment transport, most studies have focused on individual watersheds that show varying results (Lai et al., 2017). Based on studies of the Mississippi River, it has been shown that basin seaward water discharge has trended upward over the past 90 years, that increases in river flow have been largely influenced by increases in precipitation across the basin, and that seaward sediment loads have generally trended downward (Blum and Roberts, 2009; Yin et al., 2023b). An evaluation of longer-term historical trends in measured water discharge from 395 climate-sensitive gauging stations in the United States revealed an increasing trend for most river water discharge in the United States (Lin et al., 2017). In contrast, during the last 30 to 50 years, the average annual water discharge of rivers in southern Canada showed a significant decreasing trend, with a decrease in water discharge in most months of the year, with the largest decreases in August and September (Zhang et al., 2019). In the study of Dongting Lake in the middle reaches of the Yangtze River, rainfall and water discharge fluctuated less, but sediment loads decreased significantly (Lai et al., 2021). River water discharge in the western region of Russia showed an increased trend (Minjiangville et al., 2008).
Precipitation is an important driver of river flow variability and interannual variability in most regions (Lu, 2004; Ionita et al., 2015). Temperature is also a major factor influencing the flux of seawater and sediment into rivers (Labat, 2004). As major components of the hydrologic cycle, watershed precipitation and temperature changes are often subject to a complex sea-air combination (Wang and Kumar, 2015; Nalley et al., 2019; Shi et al., 2020; Feng and Hao, 2021). The oceans cover 71% of Earth’s surface, and they play a major role in controlling surface and atmospheric heat exchange, which in turn affects the planet’s climate. The strongest interannual signal of global climate change is the El Niño and Southern Oscillation (ENSO), which are cyclical variations in sea surface temperature (SST) and overlying atmospheric pressure (OAP) in the equatorial Pacific Ocean. These variations are particularly significant drivers of global atmospheric circulation in the tropical Pacific and Indian Oceans. This has led to a great deal of research being done on the connection between weather and variations in the flow of water and sediment through watersheds. A single strong ENSO event can cause a 51% reduction in global annual water discharge to the sea by affecting precipitation (Wang et al., 2006).
A. Rossi’s study on the Mississippi River shows that ENSO has a significant effect on the short-term interannual fluctuations of precipitation and water discharge in the basin (Rossi et al., 2009). Sea-air variables like the Pacific Decadal Oscillation (PDO) and the Arctic Oscillation (AO), in addition to ENSO, have variable effects on the flows of entering water and sediment in basins all over the world. ENSO causes changes in precipitation patterns by influencing the East and Southeast Asian monsoon (Juneng and Tangang, 2005; Zhou et al., 2024). PDO is closely related to the climate of eastern China, and it is an important background for interannual climate variability, which moderates the impact of ENSO on climate (Feng et al., 2014; Wu and Jiang, 2024). Therefore, climate variability in East Asia is significantly affected by the anomalies of global sea-land-air interaction such as ENSO and PDO.
The effect of climate conditions on global river sediment has been the subject of numerous prior studies. Nevertheless, the majority of research has concentrated on studying specific rivers, and thorough comparative studies on the overall picture of long-term changes in water and sediment with climate conditions in various river basin sizes are still lacking. As a result, research on how various river sizes react to climatic fluctuations will advance our knowledge of world hydrology. Furthermore, there are still some unanswered questions regarding the ways in which rivers of the mountain stream type respond to variations in the local climate. Therefore, more research is required to fully illustrate the parallels and discrepancies in the response mechanisms of rivers in various geographical areas. In addition, our study used updated data, which is relevant for the assessment of hydrometeorological changes.
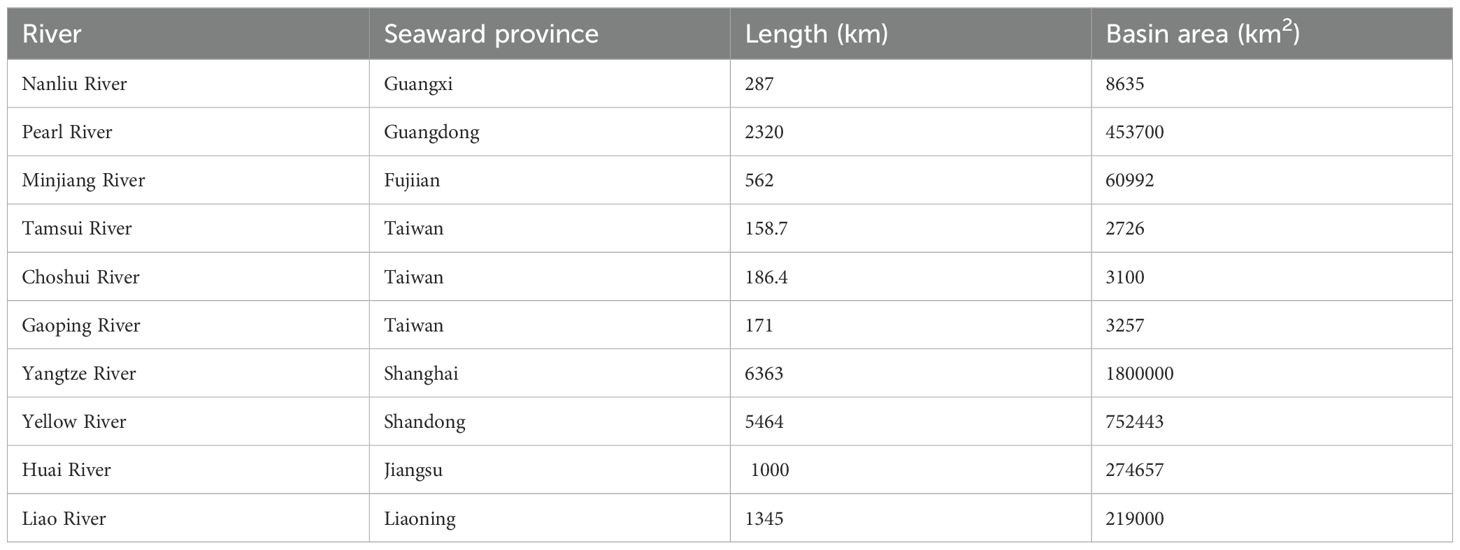
Although the term “small and medium-sized rivers” is not currently widely used, rivers that have a protected area of less than 200 km2 are typically classified as such based on the river classification concept. Taiwan’s rivers are all categorized as small to medium-sized rivers (Kao and Milliman, 2008), and the Nanliu River is also recognized as a small and medium-sized river. The purpose of this study was to characterize the effects of large-scale climate oscillations on the water discharge and sediment load of ten different rivers (Nanliu River, Pearl River, Minjiang River, Tamsui River, Choshui River, Gaoping River, Yangtze River, Yellow River, Huai River, and Liao River) in eastern China from the south to the north. We did this by using cross wavelet and wavelet coherence techniques to analyze the data from 2002 to 2022. Cross wavelet and wavelet coherence techniques are physical approaches used to determine the level of correlation between two time series. Wavelet coherence displays the consistency of periodic patterns across sequences, whereas cross wavelet shows regions of high common power and the strength of shared cycles between sequences (Yang and Xing, 2021; Hussain et al., 2024). The objective is to demonstrate the disparities in responses to climate change between large and small/medium sized rivers (Figure 1, Table 1).
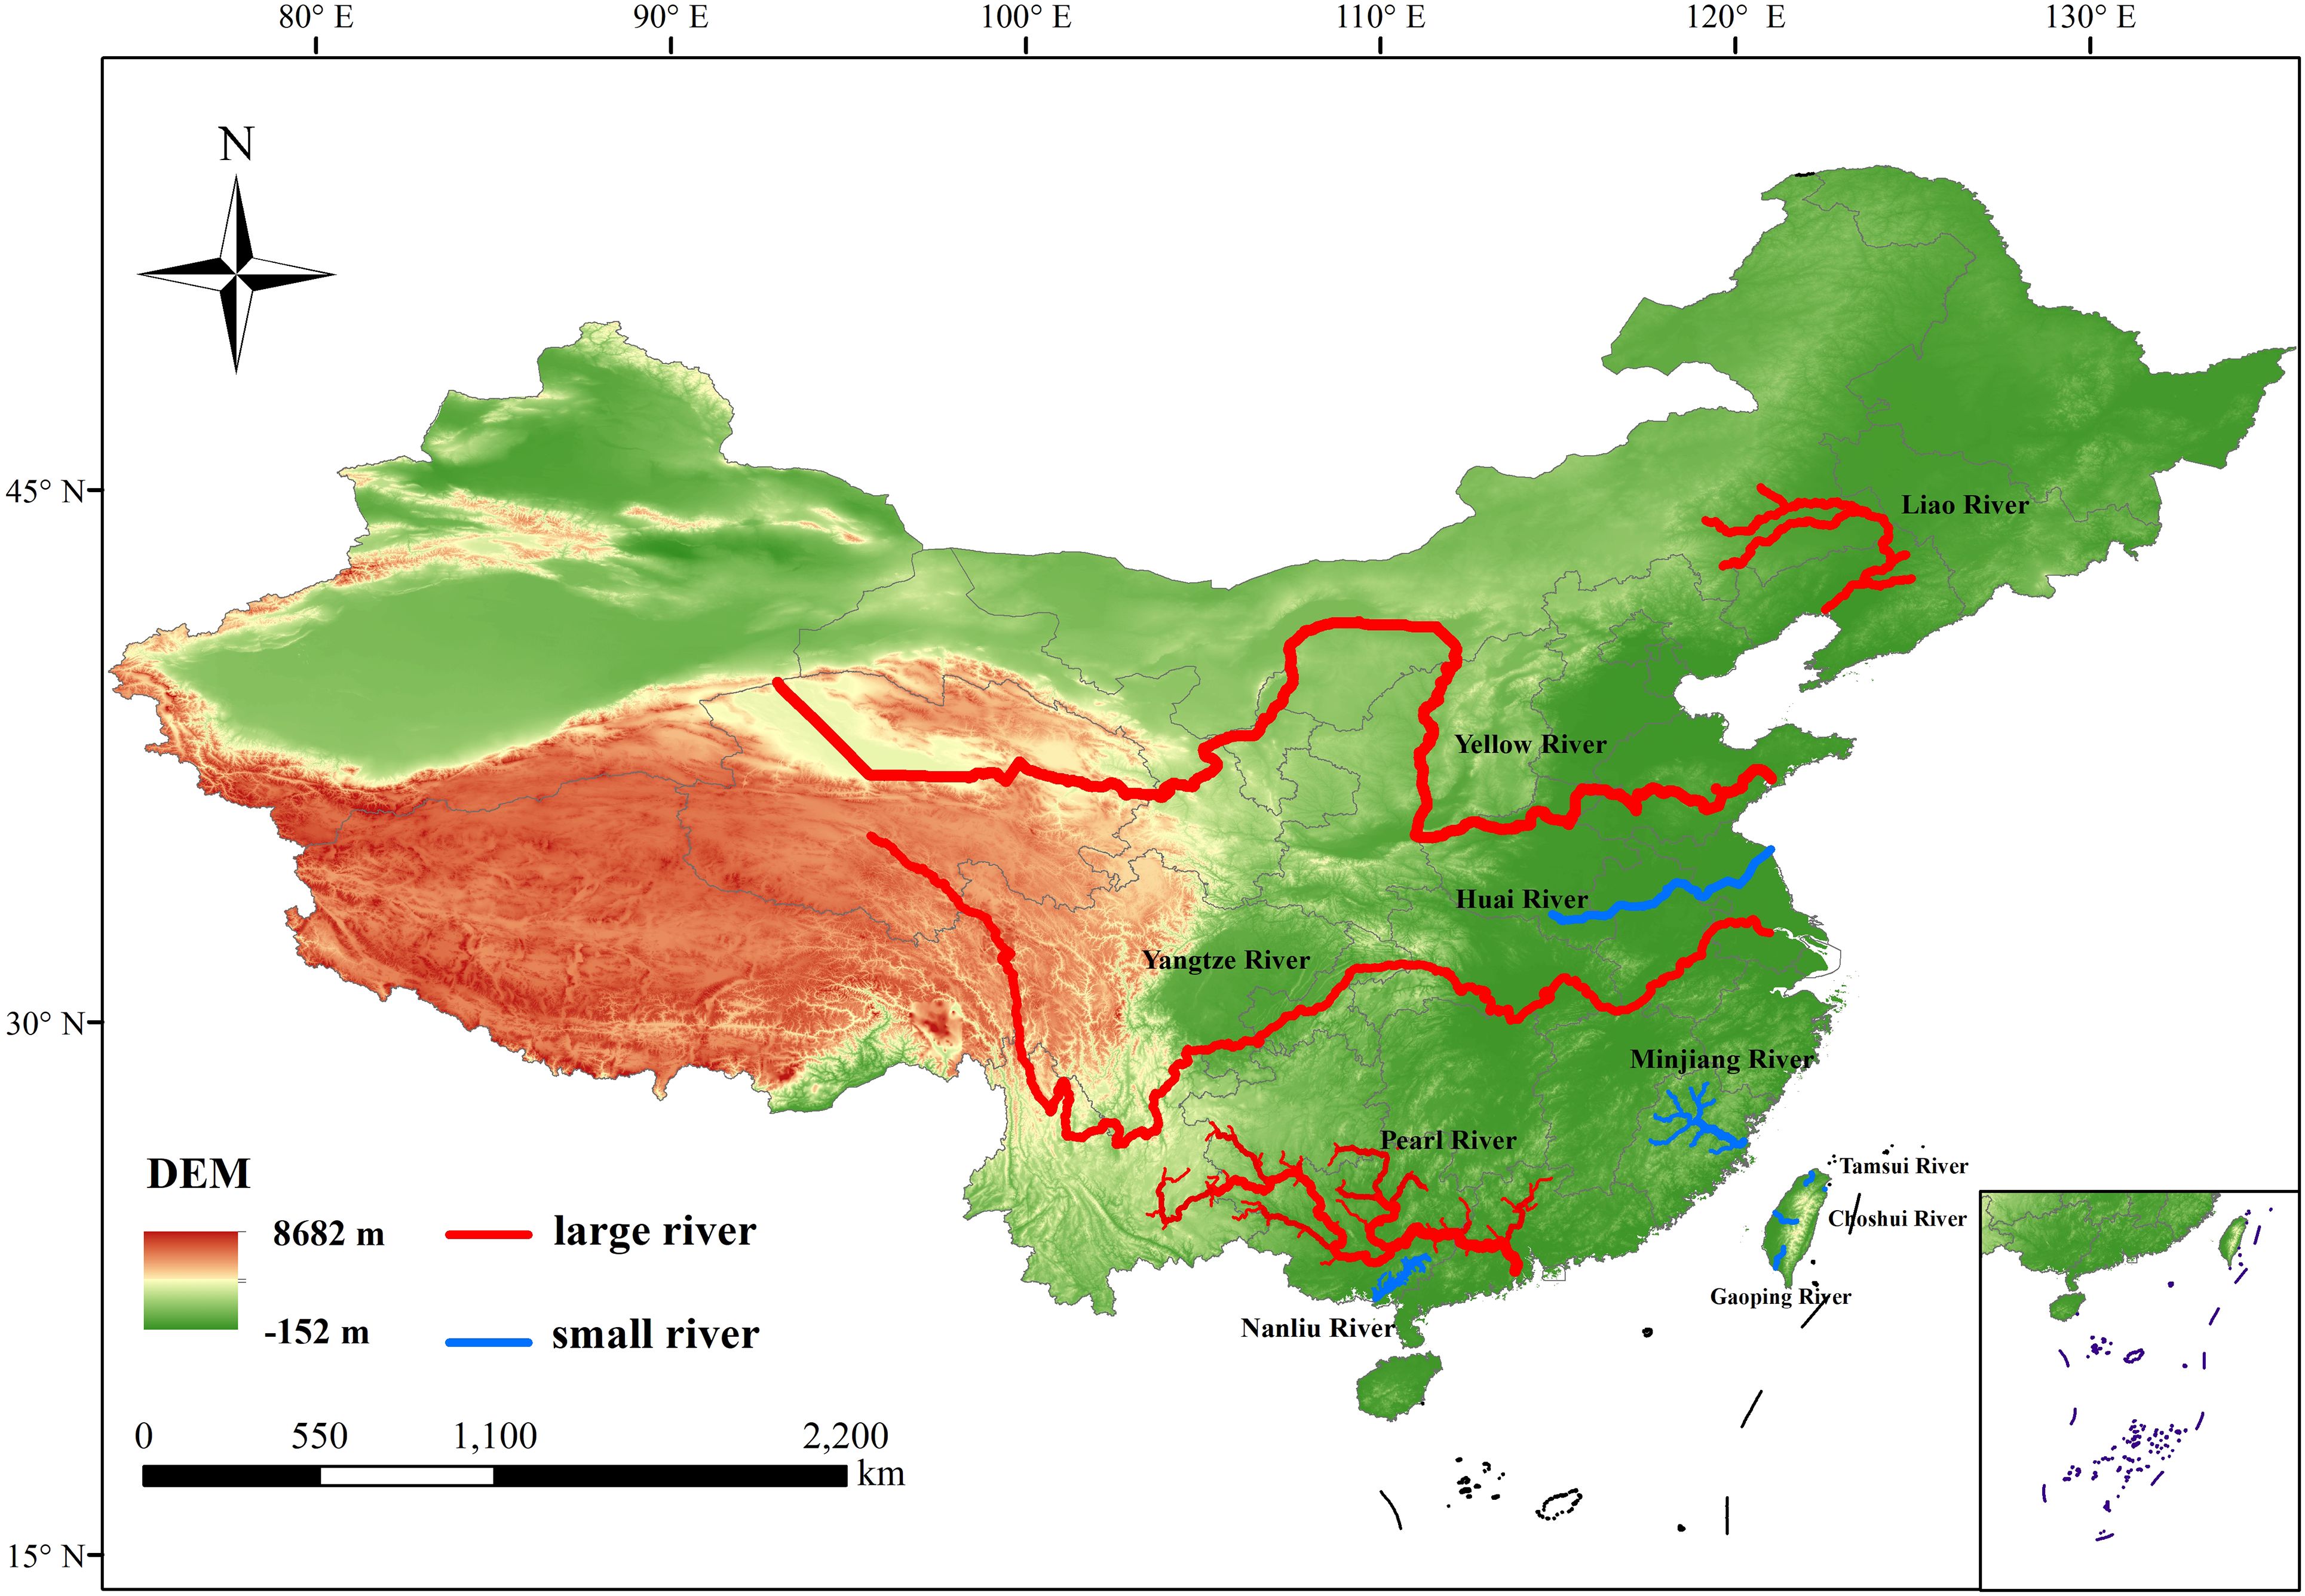
Figure 1. Geographic location of the 10 rivers, where the red line represents the direction of flow of large rivers and the blue line represents the direction of flow of small and medium-sized rivers.
2 Data and methods
2.1 Data sources
Monthly river water discharge data, sediment transport data, ENSO data, PDO data, and other information are the primary types of data used in this study.
The Water Resources Administration of Taiwan Province (http://www.wra.gov.tw/) provided monthly water discharge and sediment transport data for the Tamsui, Choshui, and Gaoping rivers in Taiwan. A portion of the chosen stations were absent during the study period. Therefore, they were updated or expanded by interpolation, utilizing the multi-year average data prior to usage as well as the correlation between the absent measured stations and nearby stations. The monthly hydrological data (2002-2022) of different rivers are from the Zhuki hydrographic station of the Minjiang River, Datong station of the Yangtze River, Lijin station of the Yellow River, Linqi station of the Huai River, and Liumafang station of the Liao River, while the hydrological data of the Pearl River inflow are selected from the data of the Gaoyao station of the Xijiang River, Shijiao station of the Beijiang River, and Boluo station of the Dongjiang River (http://www.mwr.gov.cn/). Nanliu River hydrological data are from the China Hydrological Yearbook and Guangxi River Sediment Bulletin. Monthly SST data, PDO data and other information are from the National Centers for Environmental Information (https://www.ncdc.noaa.gov/teleconnections/).
2.2 Methods
In this paper, the binary coherence between the hydrological data and the meteorological factors is calculated using the Crossed Wavelet Transform (XWT) and Wavelet Coherence (WTC).
Physical techniques for assessing the level of correlation between two time series include the XWT and WTC. While WTC indicates the consistency of periodic patterns across the sequences, XWT shows regions of high common power and the strength of shared cycles between the sequences. The degree of linear link between hydrologic variables and remotely correlated index sequences in the time and frequency domains is measured using coherence of the Crossed Wavelet Transform, a correlation coefficient localized in time and frequency space. The multiscale association between hydrologic data and meteorological parameters in the time-frequency domain was analyzed using XWT and WTC.
The cross-wavelet spectrum, a representation of the covariance between two time series, can be defined as follows (Torrence and Compo, 1998) given two time series X and Y and wavelet transforms and :
where the complex conjugate is denoted by ∗. The complex argument can be understood as the local relative phase between and in temporal frequency space, and can be characterized as cross-wavelet power.
Time series that exhibit correlation but do not necessarily have high power are identified in time frequency space by WTC, which also measures the correlation (Su et al., 2019). The wavelet coherence of two time series can be described as (Torrence and Compo, 1998):
where the wavelet type being utilized defines the smoothing operator S. has a value in the range of 0 and 1: A correlation of 1 shows that two time series are perfectly associated, while a correlation of 0 means that there is no association at all.
In this paper, the Monte Carlo statistical method is used to compute the wavelet (Yoon et al., 2015). A cone of influence (COI) with boundary effects is indicated by the thin black solid line in the cross-wavelet spectrum; a substantial correlation that passes the red noise test with 95% confidence is indicated by the thick black contour line. Hydrologic variables and distant correlation are correlated positively when indicated by right arrows; negatively when indicated by left arrows; hydrologic variables changed before remote correlation when indicated by down arrows; changes in remote correlation lag when indicated by up arrows.
3 Result
3.1 Water discharge and SST
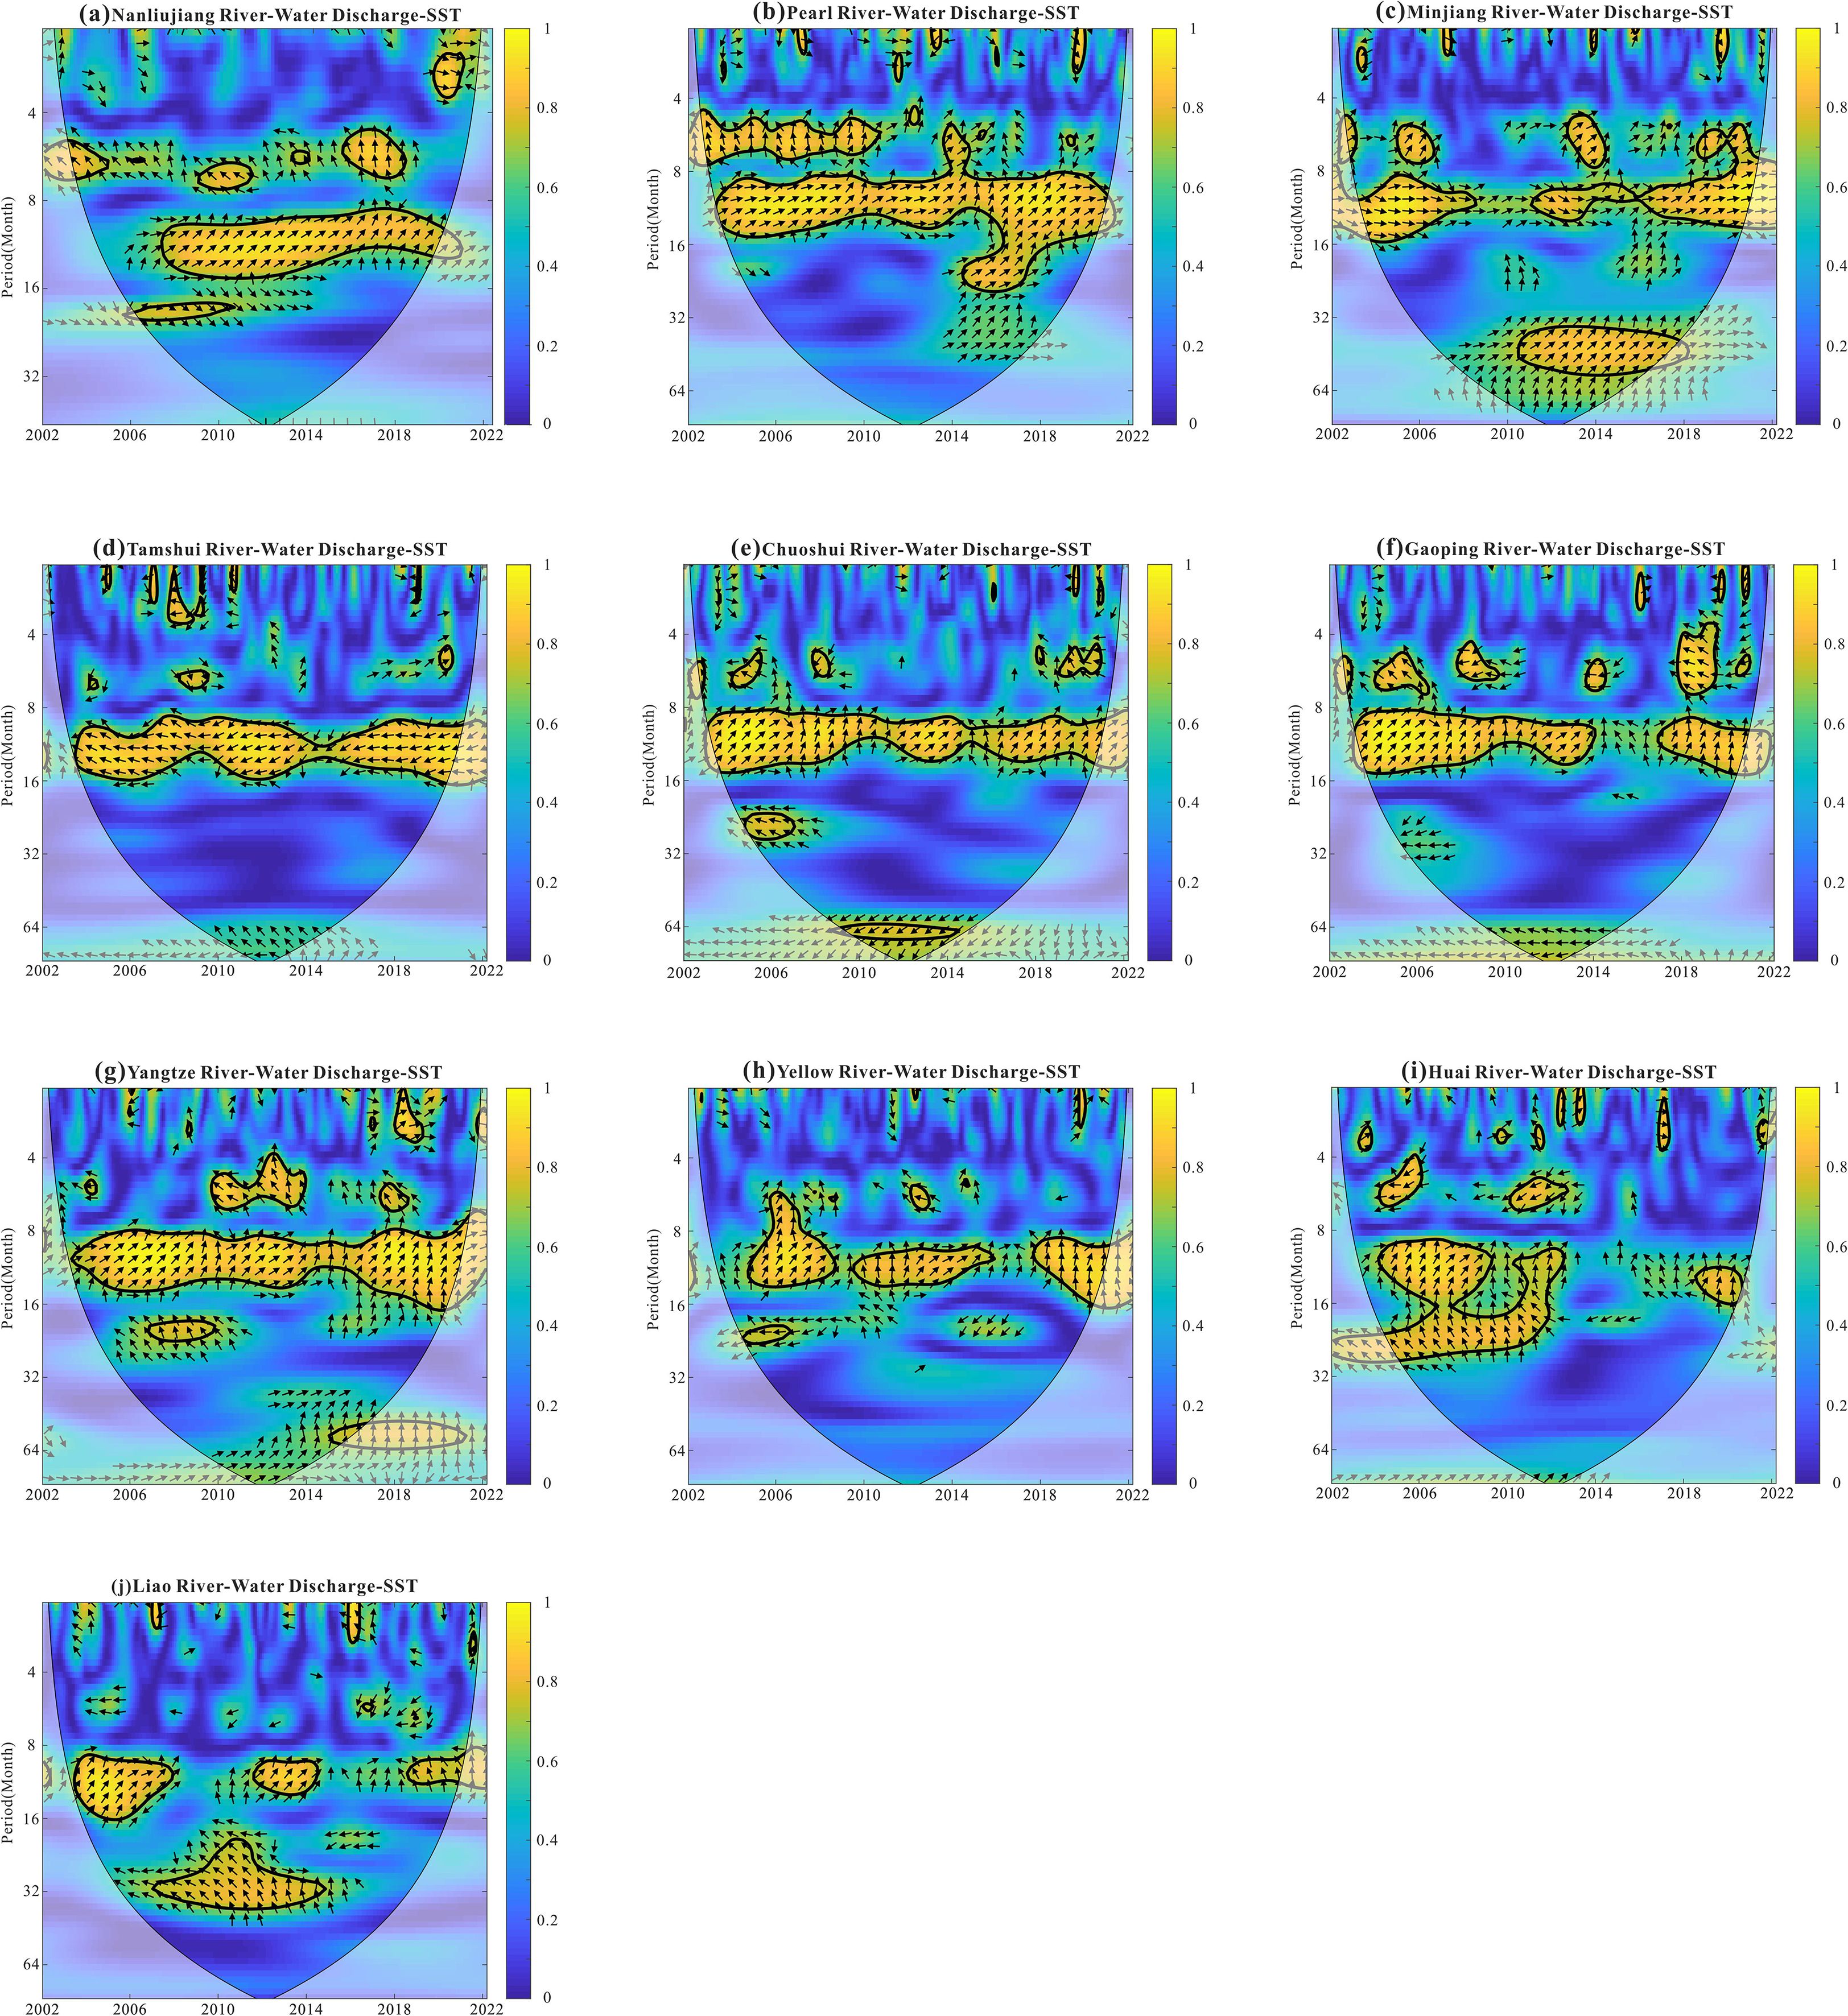
The findings demonstrate that the Niño 3.4 region SST and the Nanliu River’s water discharge (Figure 2A) both exhibit significant 10–16 months main resonance cycles over the course of the study period. Additionally, the phase relationship stays stable within this time frame, with an average phase angle of 45°, suggesting that changes in water discharge follow changes in SST by 1.5 months on average. Over the study period, there are notable cycles of 10–14 months for both Pearl River water discharge and Niño 3.4 region SST (Figure 2B). Also, the phase relationship is steady, with an average phase angle of 30°, suggesting that changes in water discharge occur one month after changes in SST.
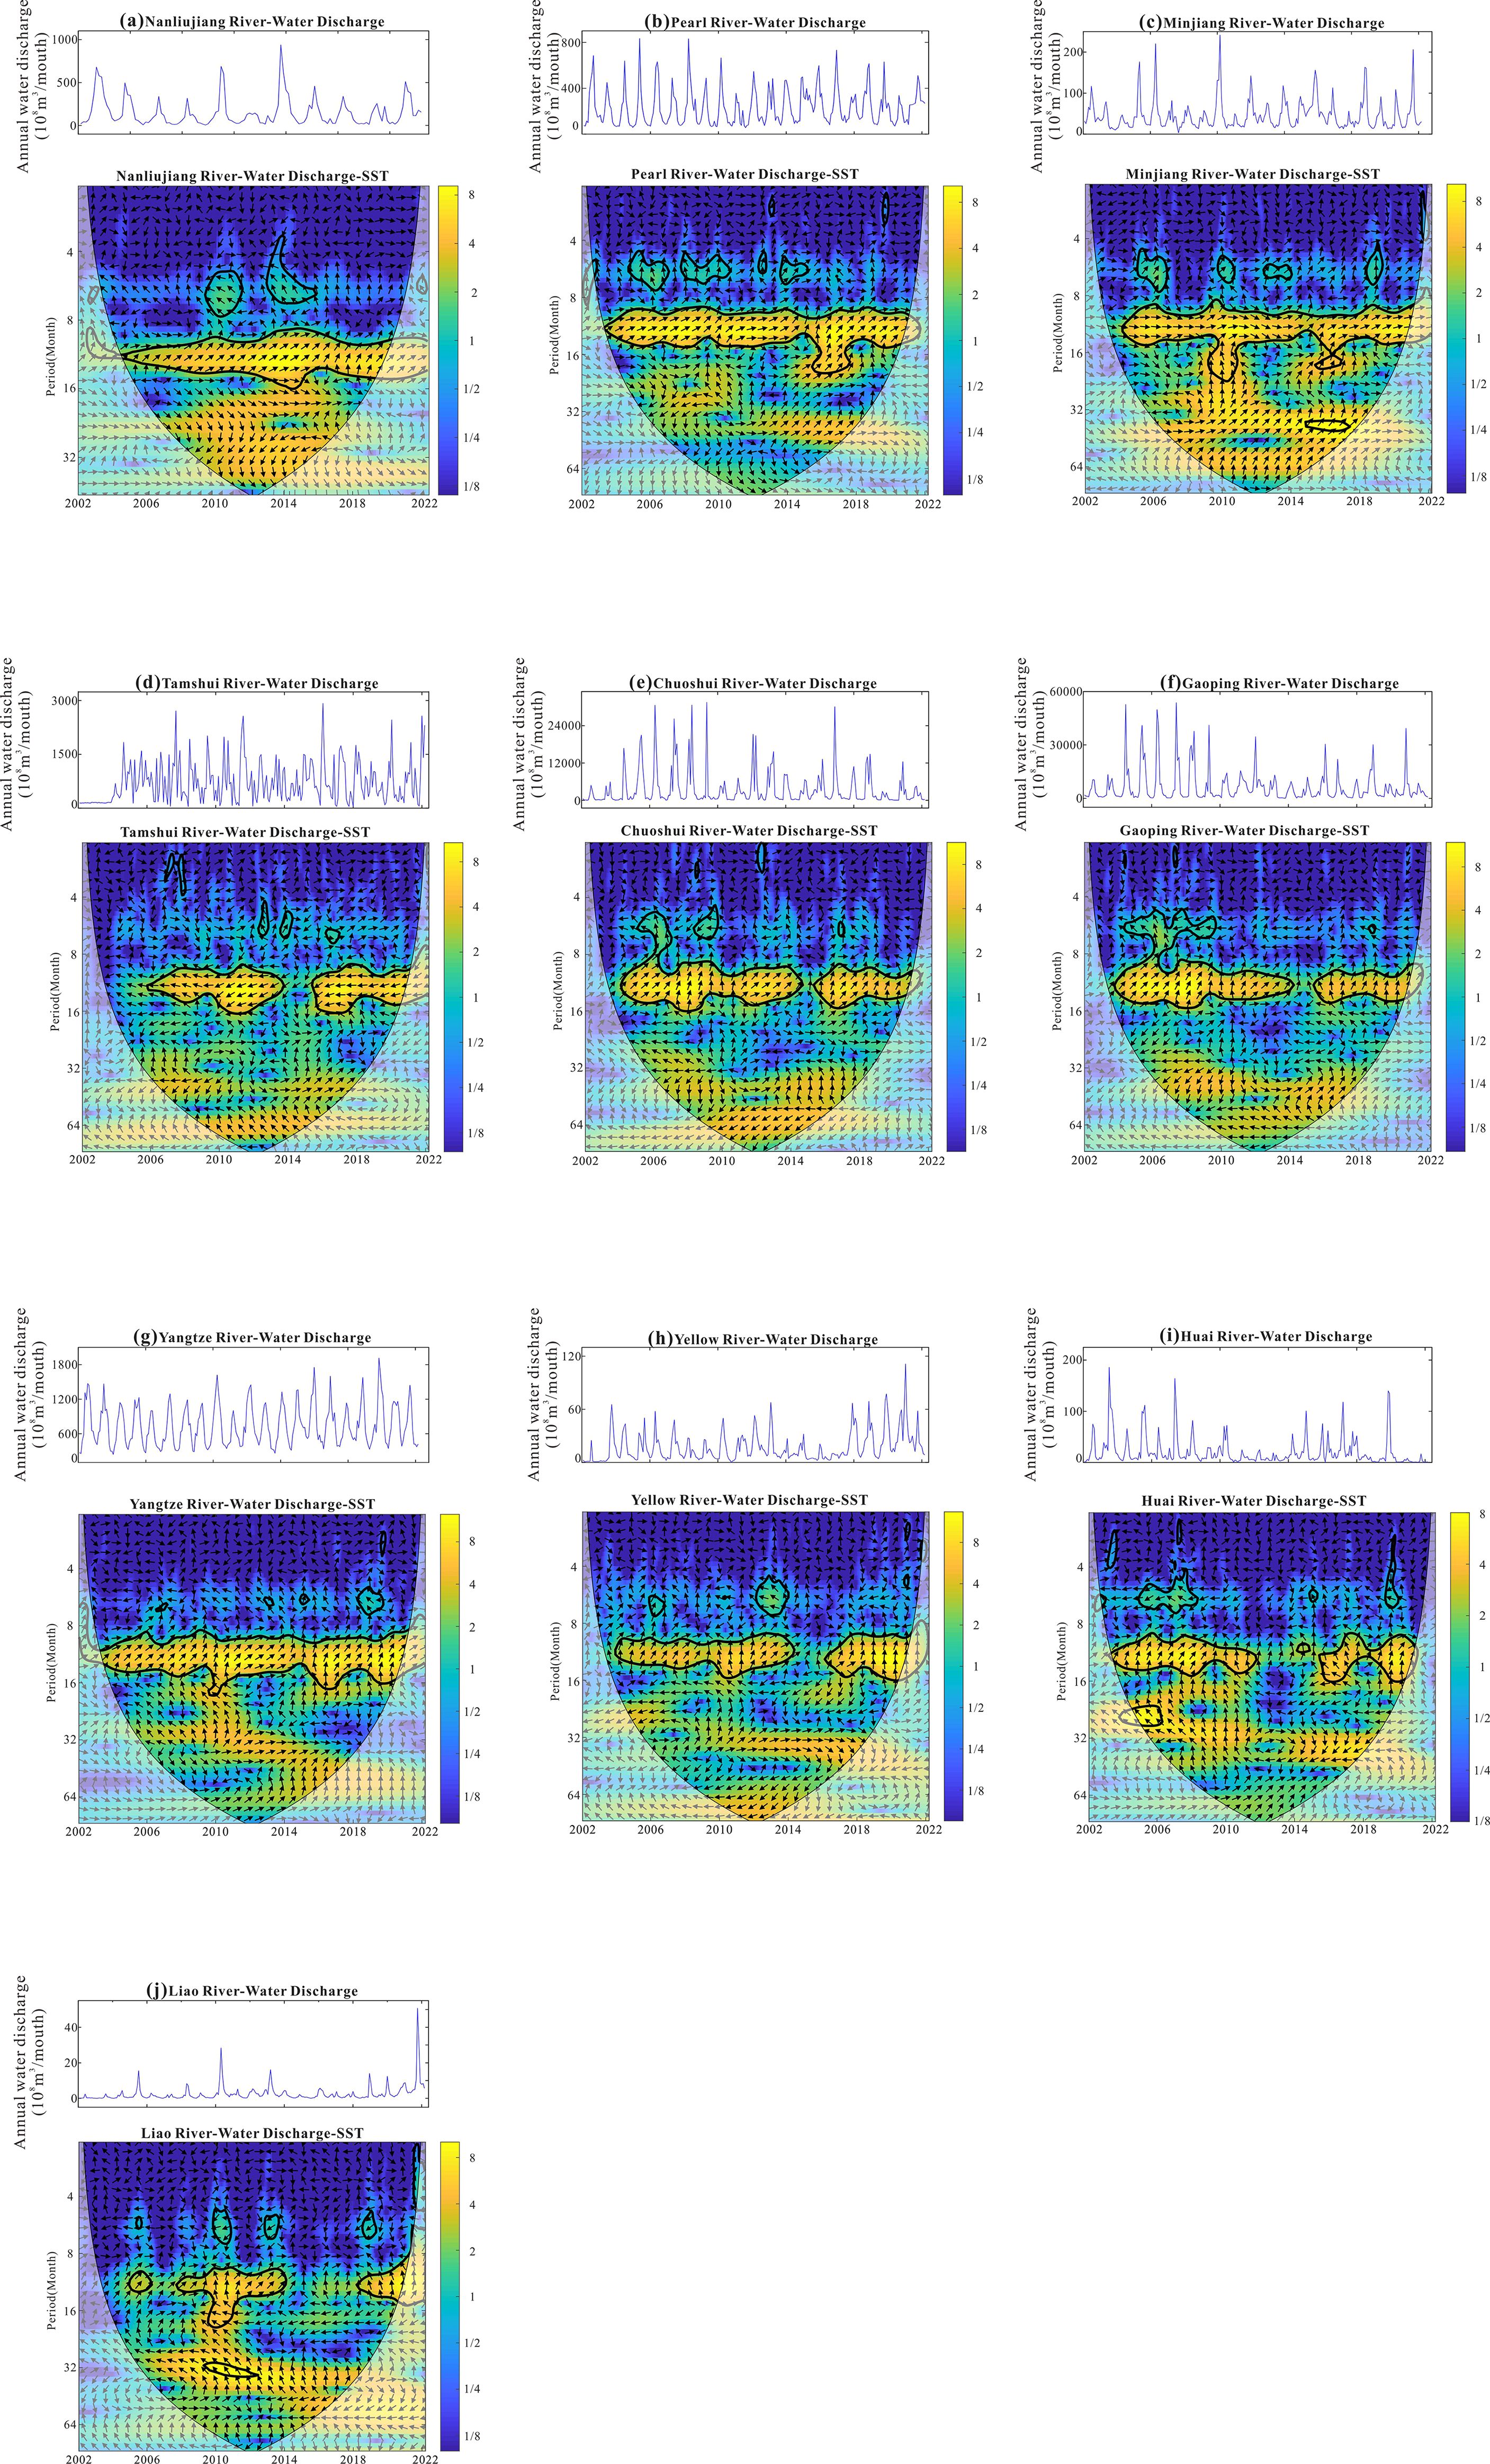
Figure 2. XWT: Cross-wavelet power spectrums between monthly water discharge time series and Nino3.4 SST. A thick black contour line delineates a 5% significance level against the red noise (yellow and blue represent stronger and weaker powers, respectively). The cone of influence (COI), which potentially can distort the picture around the edges, is shown by lighter shades. The arrows represent the relative phase relationship between the two time series. Right (left) pointing arrows show an in-phase (anti-phase) relationship, while vertically upward arrows show that ENSO leadsstreamflow by 3 month.
Water discharge changes are positively correlated and well synchronized with SST changes on an interannual scale, as indicated by the Minjiang River water discharge and Niño 3.4 SST showing a significant main resonance cycle of 10-14 months throughout the study time domain and a stable phase relationship with an average phase angle of 0° (Figure 2C). Around 2010, a notable resonance cycle of 16–32 months was seen in both the Niño 3.4 SST and the discharge from the Minjiang River (Figure 2C). This suggests that changes in SST changes were three months behind changes in water discharge.
The study revealed that the Tamsui River’s water discharge and Niño 3.4 regional SST exhibited significant 8-16 months principal resonance cycles (Figure 2D). Additionally, the phase relationship remained stable with an average phase angle of 180°, suggesting a negative correlation between changes in SST and water discharge. Meanwhile, the study found a large primary resonance cycle in the Niño 3.4 region SST and the Choshui River and Gaoping River’s water discharge, lasting 10–16 months (Figures 2E, F). Furthermore, the average phase angle of the phase relationship stayed constant at 45°, indicating that variations in the water discharge lagged behind variations in the SST by 1.5 months. Over the course of the study, the water discharge from the Yangtze River basin and the SST in the Niño 3.4 region shows significant 8–16 months main resonance cycles (Figure 2G). The phase relationship also remained stable, with an average phase angle of 45°, suggesting that changes in SST are 1.5 months behind changes in basin water discharge. Throughout the study period, there are noticeable but sporadic main resonance cycles between the Niño 3.4 region SST and the Yellow River water discharge (Figure 2H). The phase relationship is steady, with an average phase angle of 90°, suggesting that changes in the water discharge occur three months after changes in the SST.
The Huai River water discharge and Niño 3.4 regional SST show a significant but discontinuous 10-16 months main resonance cycle throughout the study time domain, and the phase relationship is relatively stable within the study time domain, with an average phase angle of 90°, indicating that the basin water discharge changes lag behind the SST changes by 3 months on the interannual scale (Figure 2I). The phase relationship is less stable within the study time domain, indicating that the water discharge changes in the basin are not well correlated with the SST changes on an interannual scale. In contrast, the water discharge of the Liao River basin, which has the highest latitude and the SST of Niño 3.4 region, exhibits a significant but intermittent main resonance cycle of 10–14 months throughout the study time domain. Its resonance cycle was more pronounced in 2008–2014 (Figure 2J).
The consequences of WTC on flow are shown in Figure 3, where the strong coherent zone is easily discernible. The coherence of SST with in all rivers is characterized on an annual basis by significant wavelet coherence. The yearly covariance of the ten rivers was significant during the course of the study, with a noteworthy major resonance period spanning eight to sixteen months. The water discharge of the Nanliu River, Pearl River, Choshui River, Gaoping River, Yangtze River, Yellow River, and Liao River exhibited an average phase angle of around 45° with respect to their predictor, the SST (Figures 3A, B, E–H, J). This suggests that the water discharge was approximately 1.5 months behind the SST. While the Minjiang River displayed an in-phase (positive) association with its predictor (Figure 3C), the Tamsui River shown a negative connection with SST (Figure 3D). Over the course of the study period, the river flow lagged behind the SST by approximately three months, as the SST lead the Huai River by around 90°(Figure 3I).
3.2 Sediment load and SST
The Nanliu River basin water discharge and Niño 3.4 region SST showed a significant 10-14 months main resonance cycle throughout the study time domain (Figure 4A). The phase relationship remained stable within the study time domain, with an average phase angle of 30°, indicating that changes in SST changed one month after changes in basin water discharge. This information was derived from a study of the relationship between sediment load and SST. During the study period, the Niño 3.4 area SST and Pearl River water discharge exhibit significant 10-14 month main resonance cycles (Figure 4B). The phase connection remains steady, with an average phase angle of 30°, indicating that changes in water outflow occur one month following changes in SST.
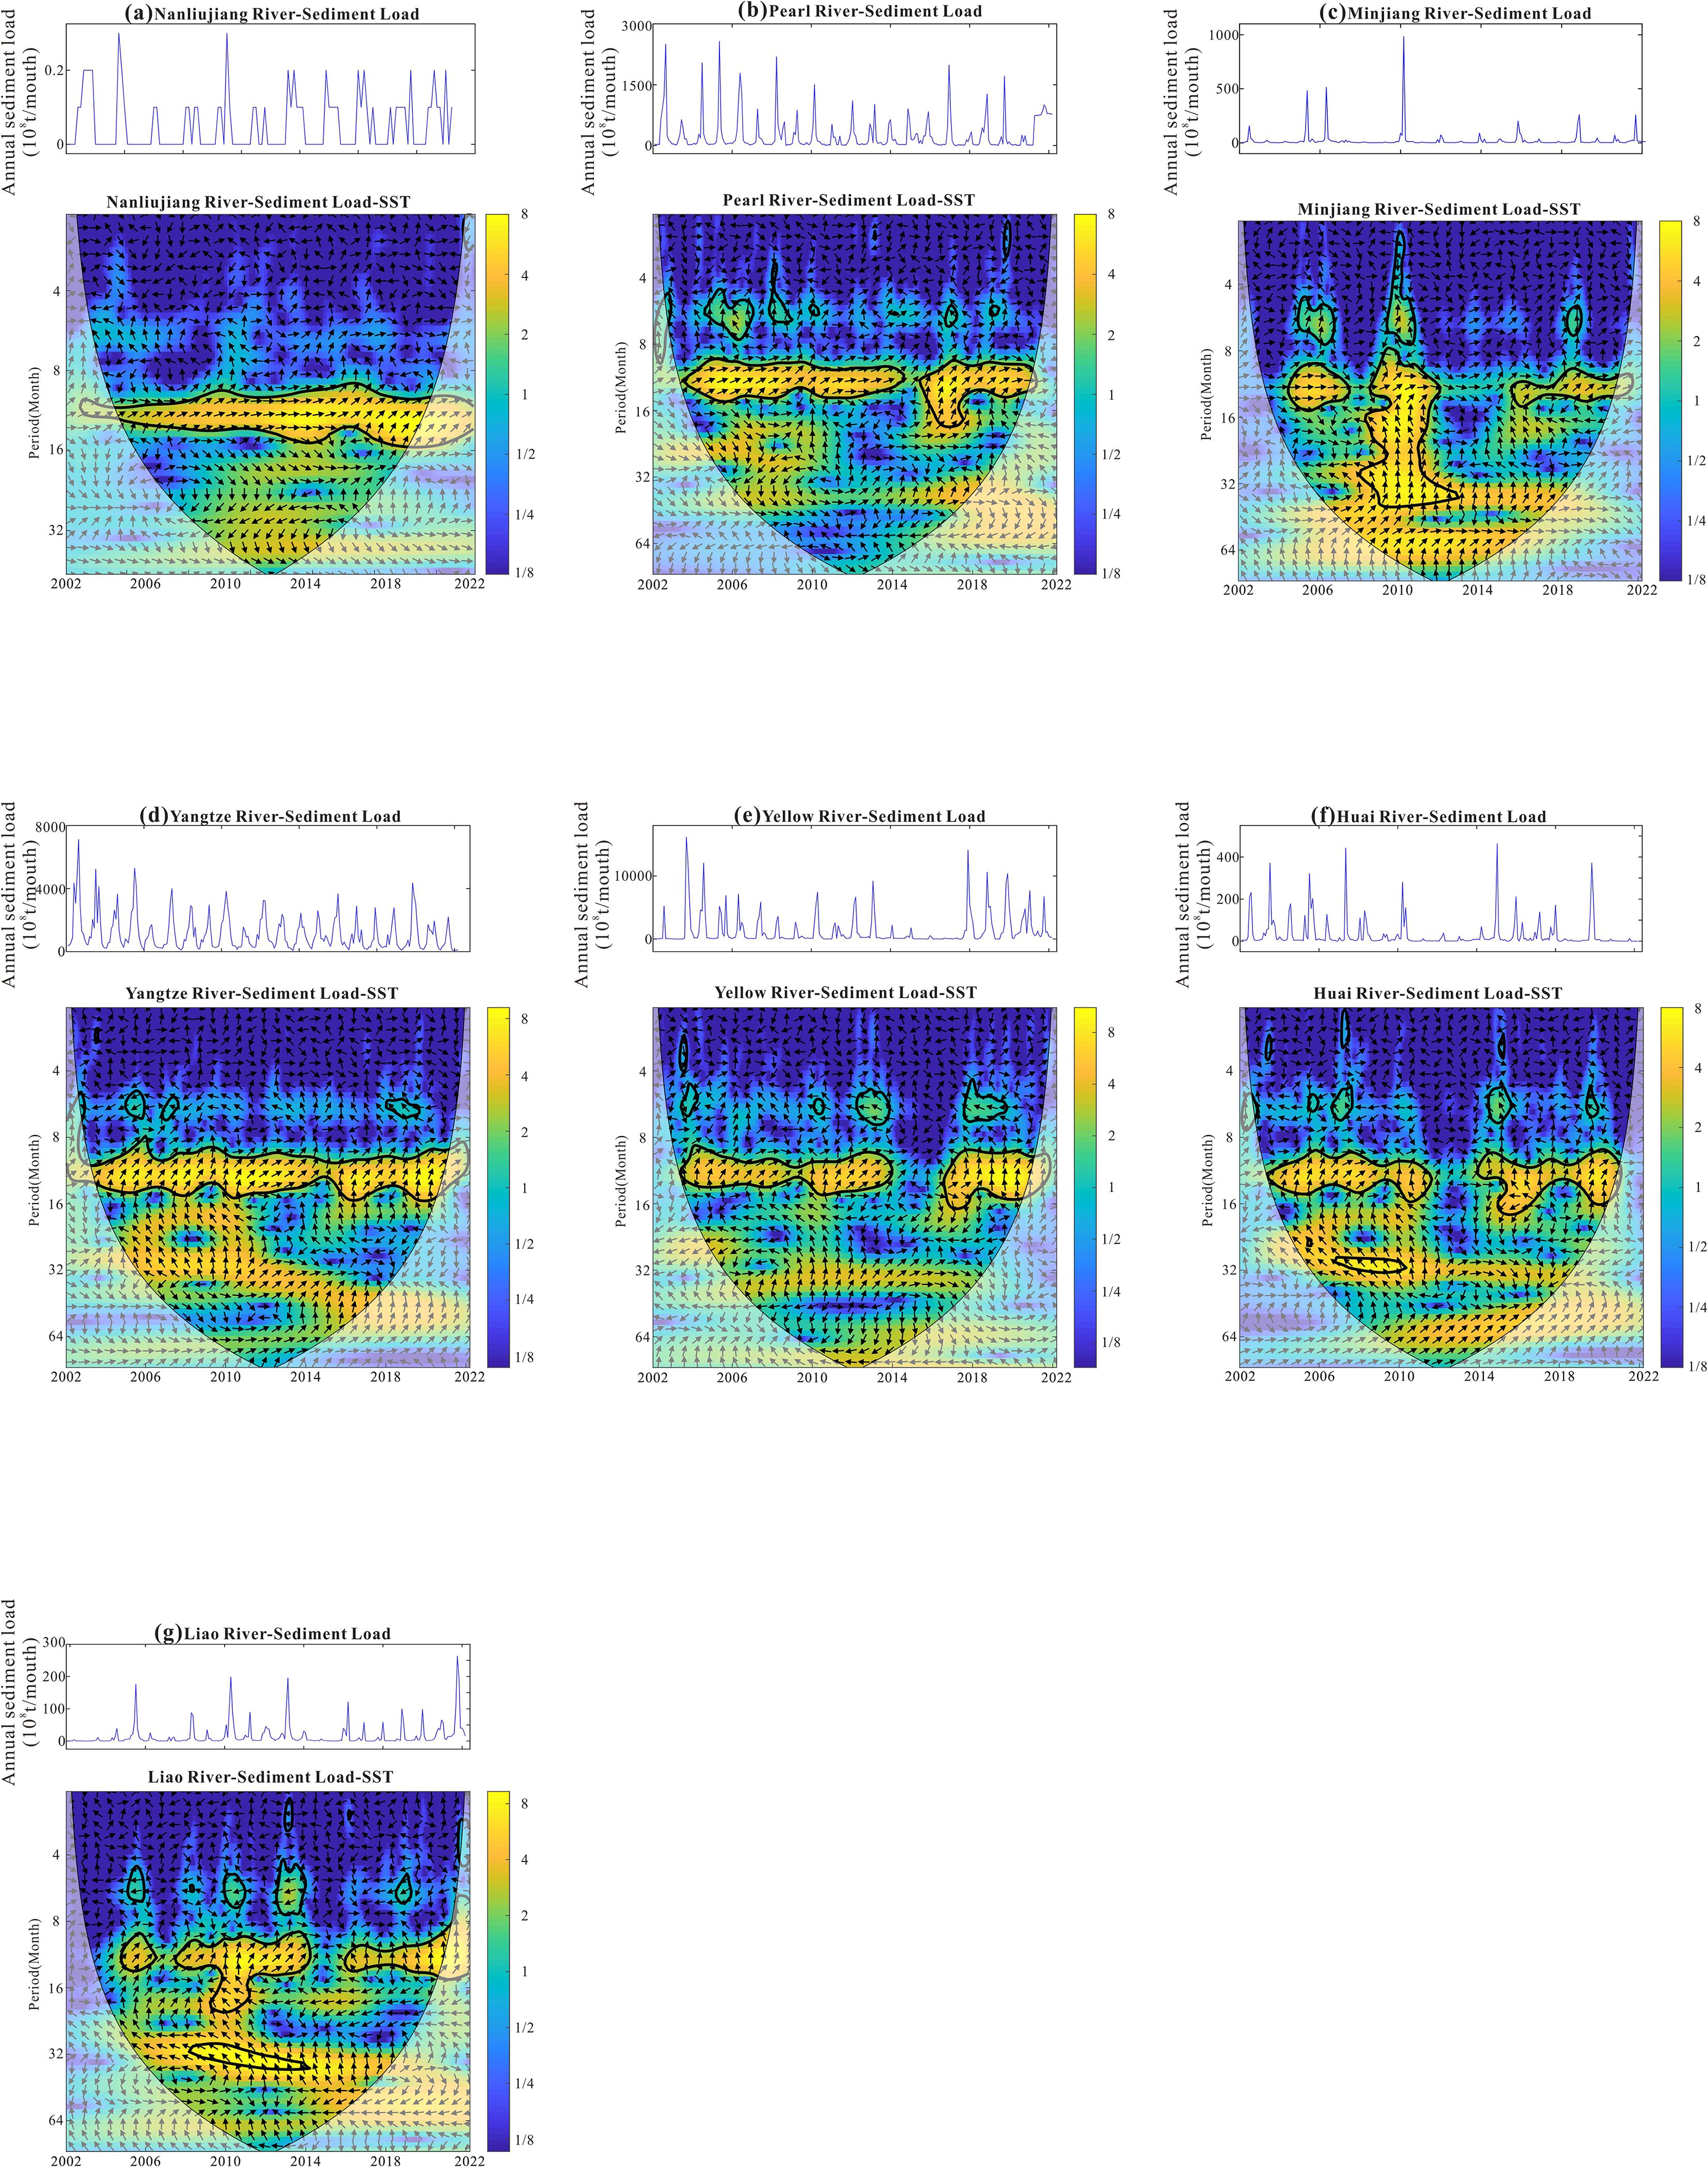
Figure 4. XWT: Crossed wavelet power spectrum between the monthly sediment load time series and the Nino3.4 SST.
From 2008 to 2012, there was a significant 10-48 month correlation between Minjiang River water discharge and Niño 3.4 region SST (Figure 4C). The phase relationship was stable throughout the study period, with an average phase angle of 90°, indicating that changes in water discharge lagged SST changes by 3 months.
The interaction between Yangtze River basin’s water discharge and Niño 3.4 region SST exhibits a significant main resonance cycle of 10-14 months throughout the time domain of the study (Figure 4D). The phase relationship remains stable within the time domain, with an average phase angle of 45°, indicating that basin water discharge changes lag SST changes by 1.5 months. In the Niño 3.4 zone, the Yellow River basin’s water discharge and SST have two resonance cycles with an average phase angle of 45° during 2003-2014 (Figure 4E). This suggests that changes in basin water discharge lag 1.5 months after changes in SST. Whereas, the 2016-2018 and phase relationship remained stable within the study time domain, with an average phase angle of 90°, indicating that water discharge changes lagged by 3 months compared to SST changes.
The Huai River’s water discharge and Niño 3.4 regional SST (Figure 4F) show a significant but discontinuous 10-16 months main resonance cycle throughout the study time domain, and the phase relationship is relatively stable within the study time domain, with an average phase angle of 45°, indicating that water discharge changes lag behind SST changes by 1.5 months on the interannual scale. On the other hand, the water discharge in the Liao River (Figure 4G), which has the highest latitude, and the SST in the Niño 3.4 region show intermittent main resonance cycles of 10-14 months throughout the time domain of the study, and the phase relationship is less stable within the time domain of the study, which indicates that the changes in water discharge correlate poorly with the changes in the SST on the interannual scale.
Figure 5 illustrates the WTC of sediment and SST analysis results. Among these, the Nanliu River, Pearl River, and Yangtze River have a robust association throughout the study period, with a considerable primary resonance phase lasting 8-16 months. However, the responses to SST varied, with the water discharge of the Nanliu River correlating with its SST in the same phase, whereas the water discharge of the Pearl River and Yangtze River trailed SST by 1.5 months. The Minjiang River, Yellow River, Huai River, and Liao River were identified as intermittent yearly oscillations with complex phase interactions.
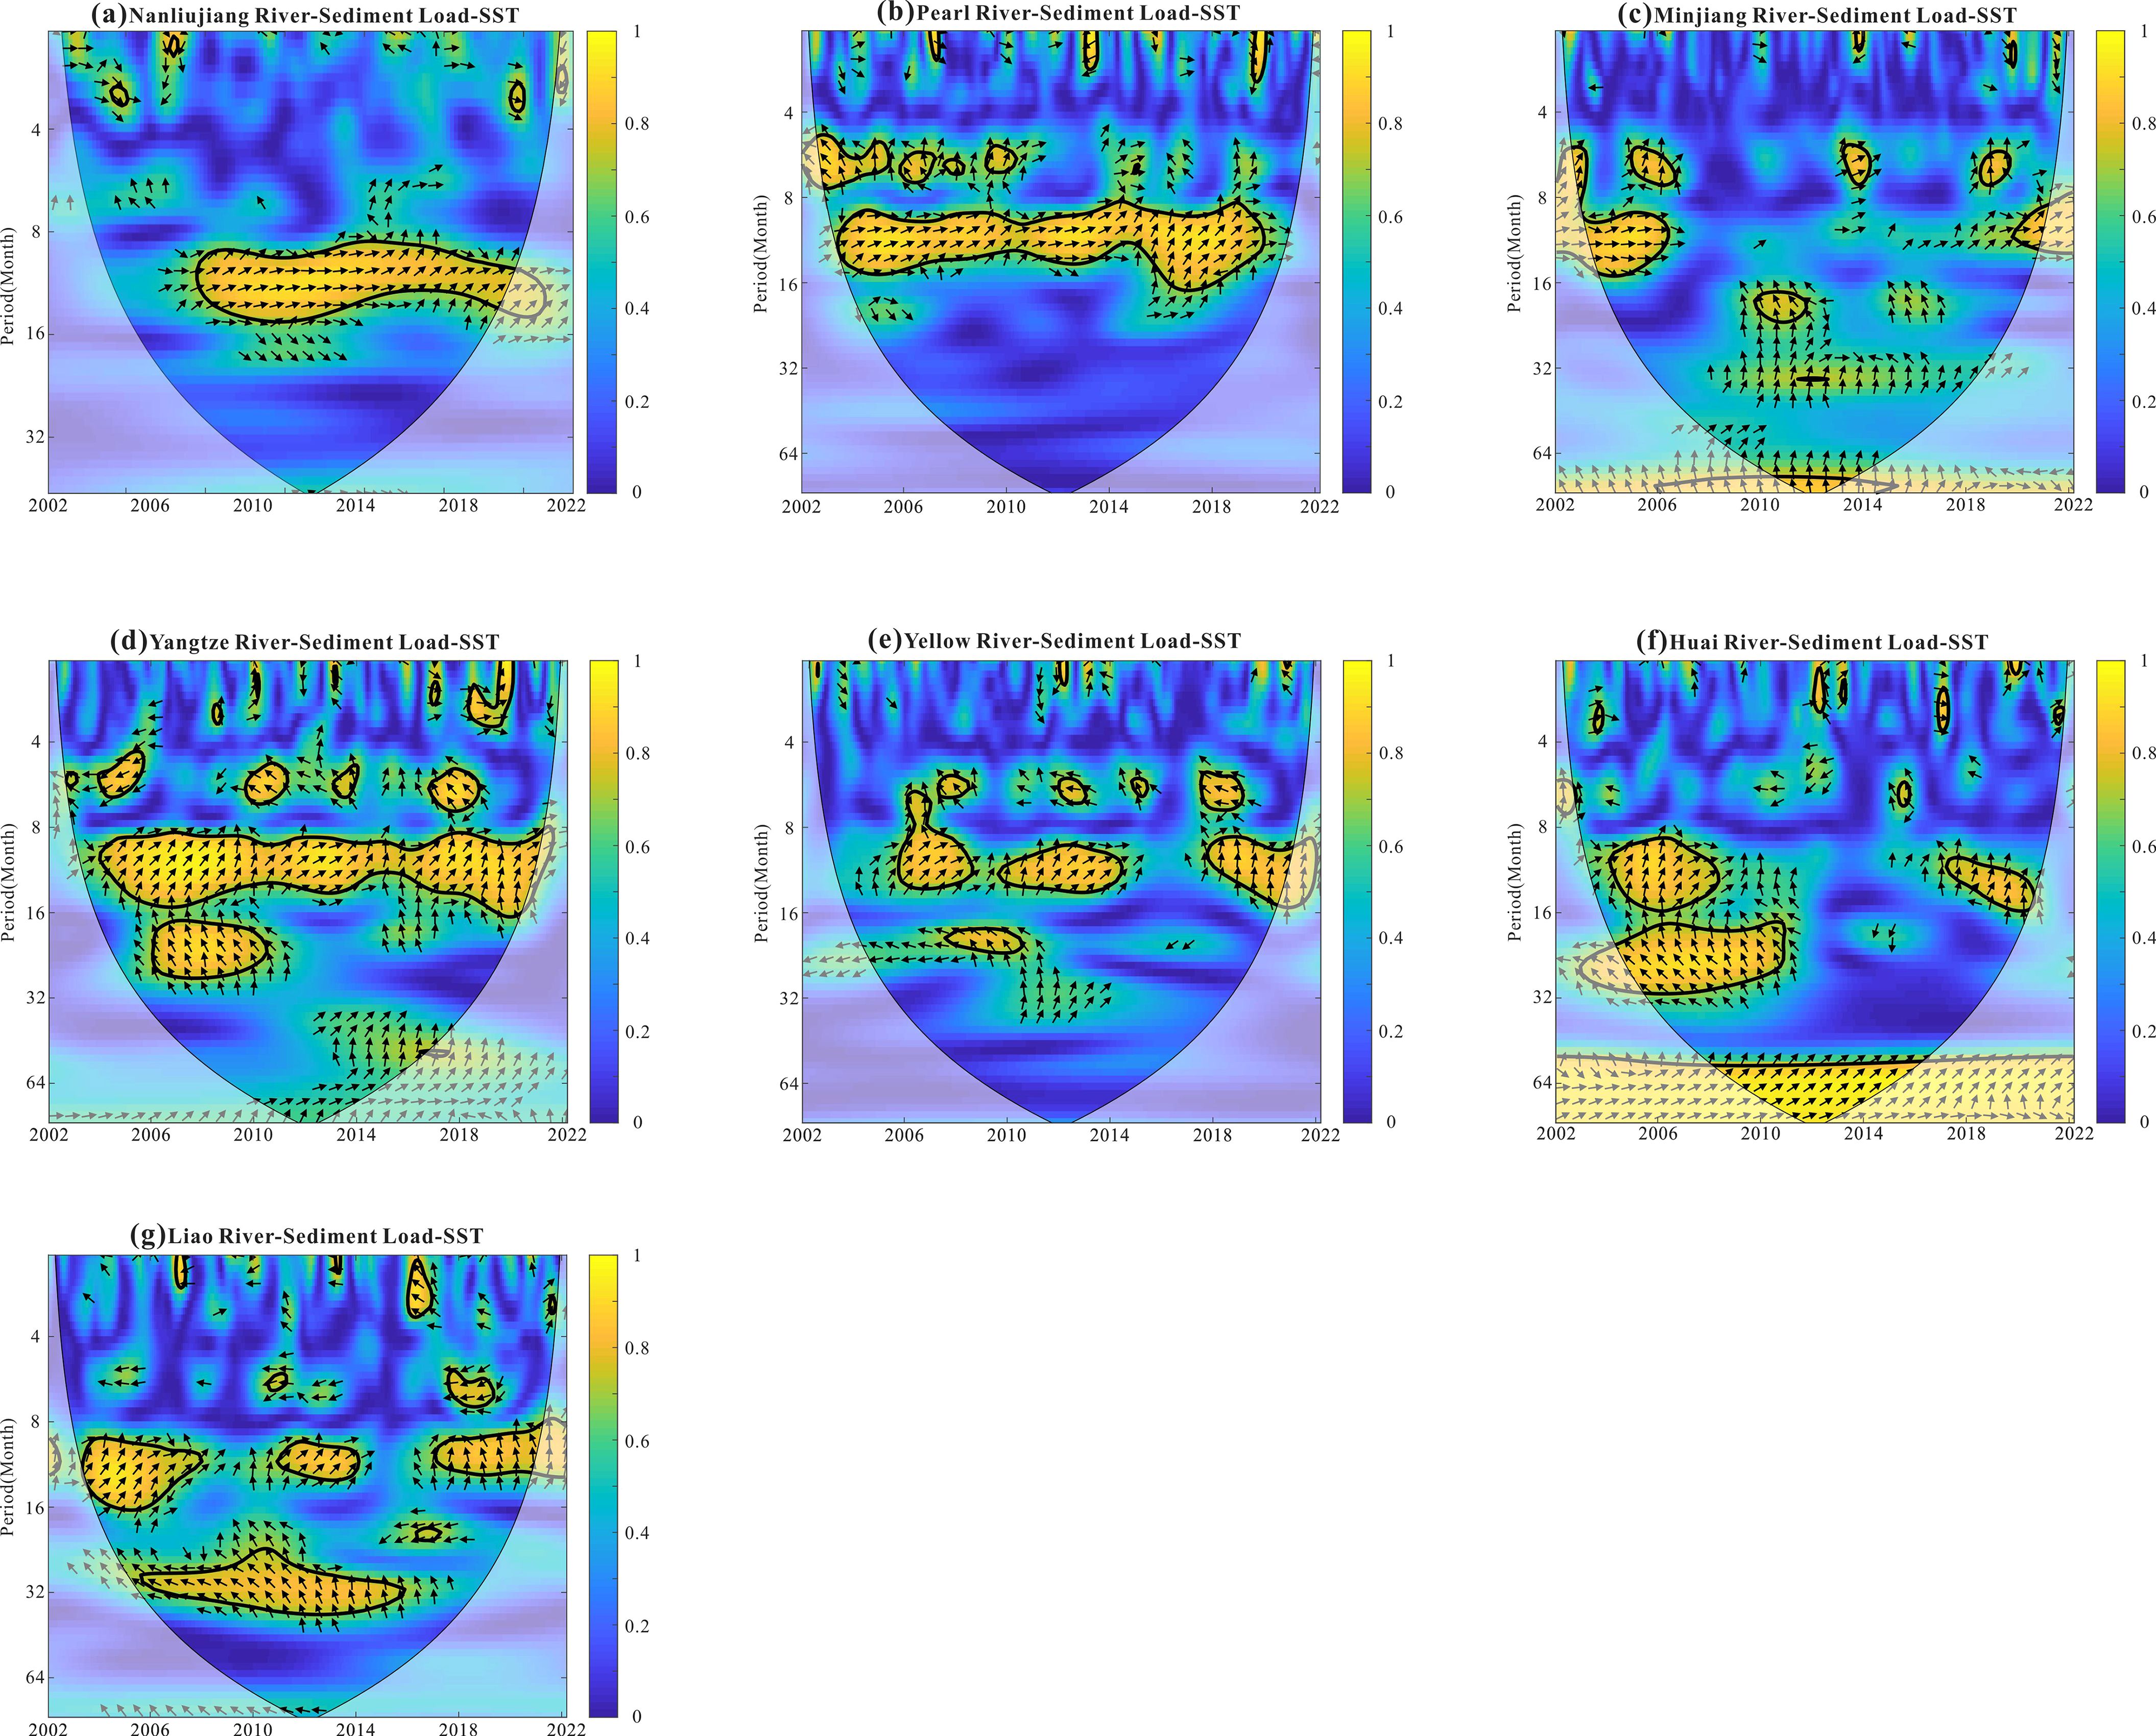
Figure 5. WTC: Wavelet coherent spectrums between the monthly sediment load time series and the Nino3.4 SST.
3.3 Water discharge, sediment load and PDO
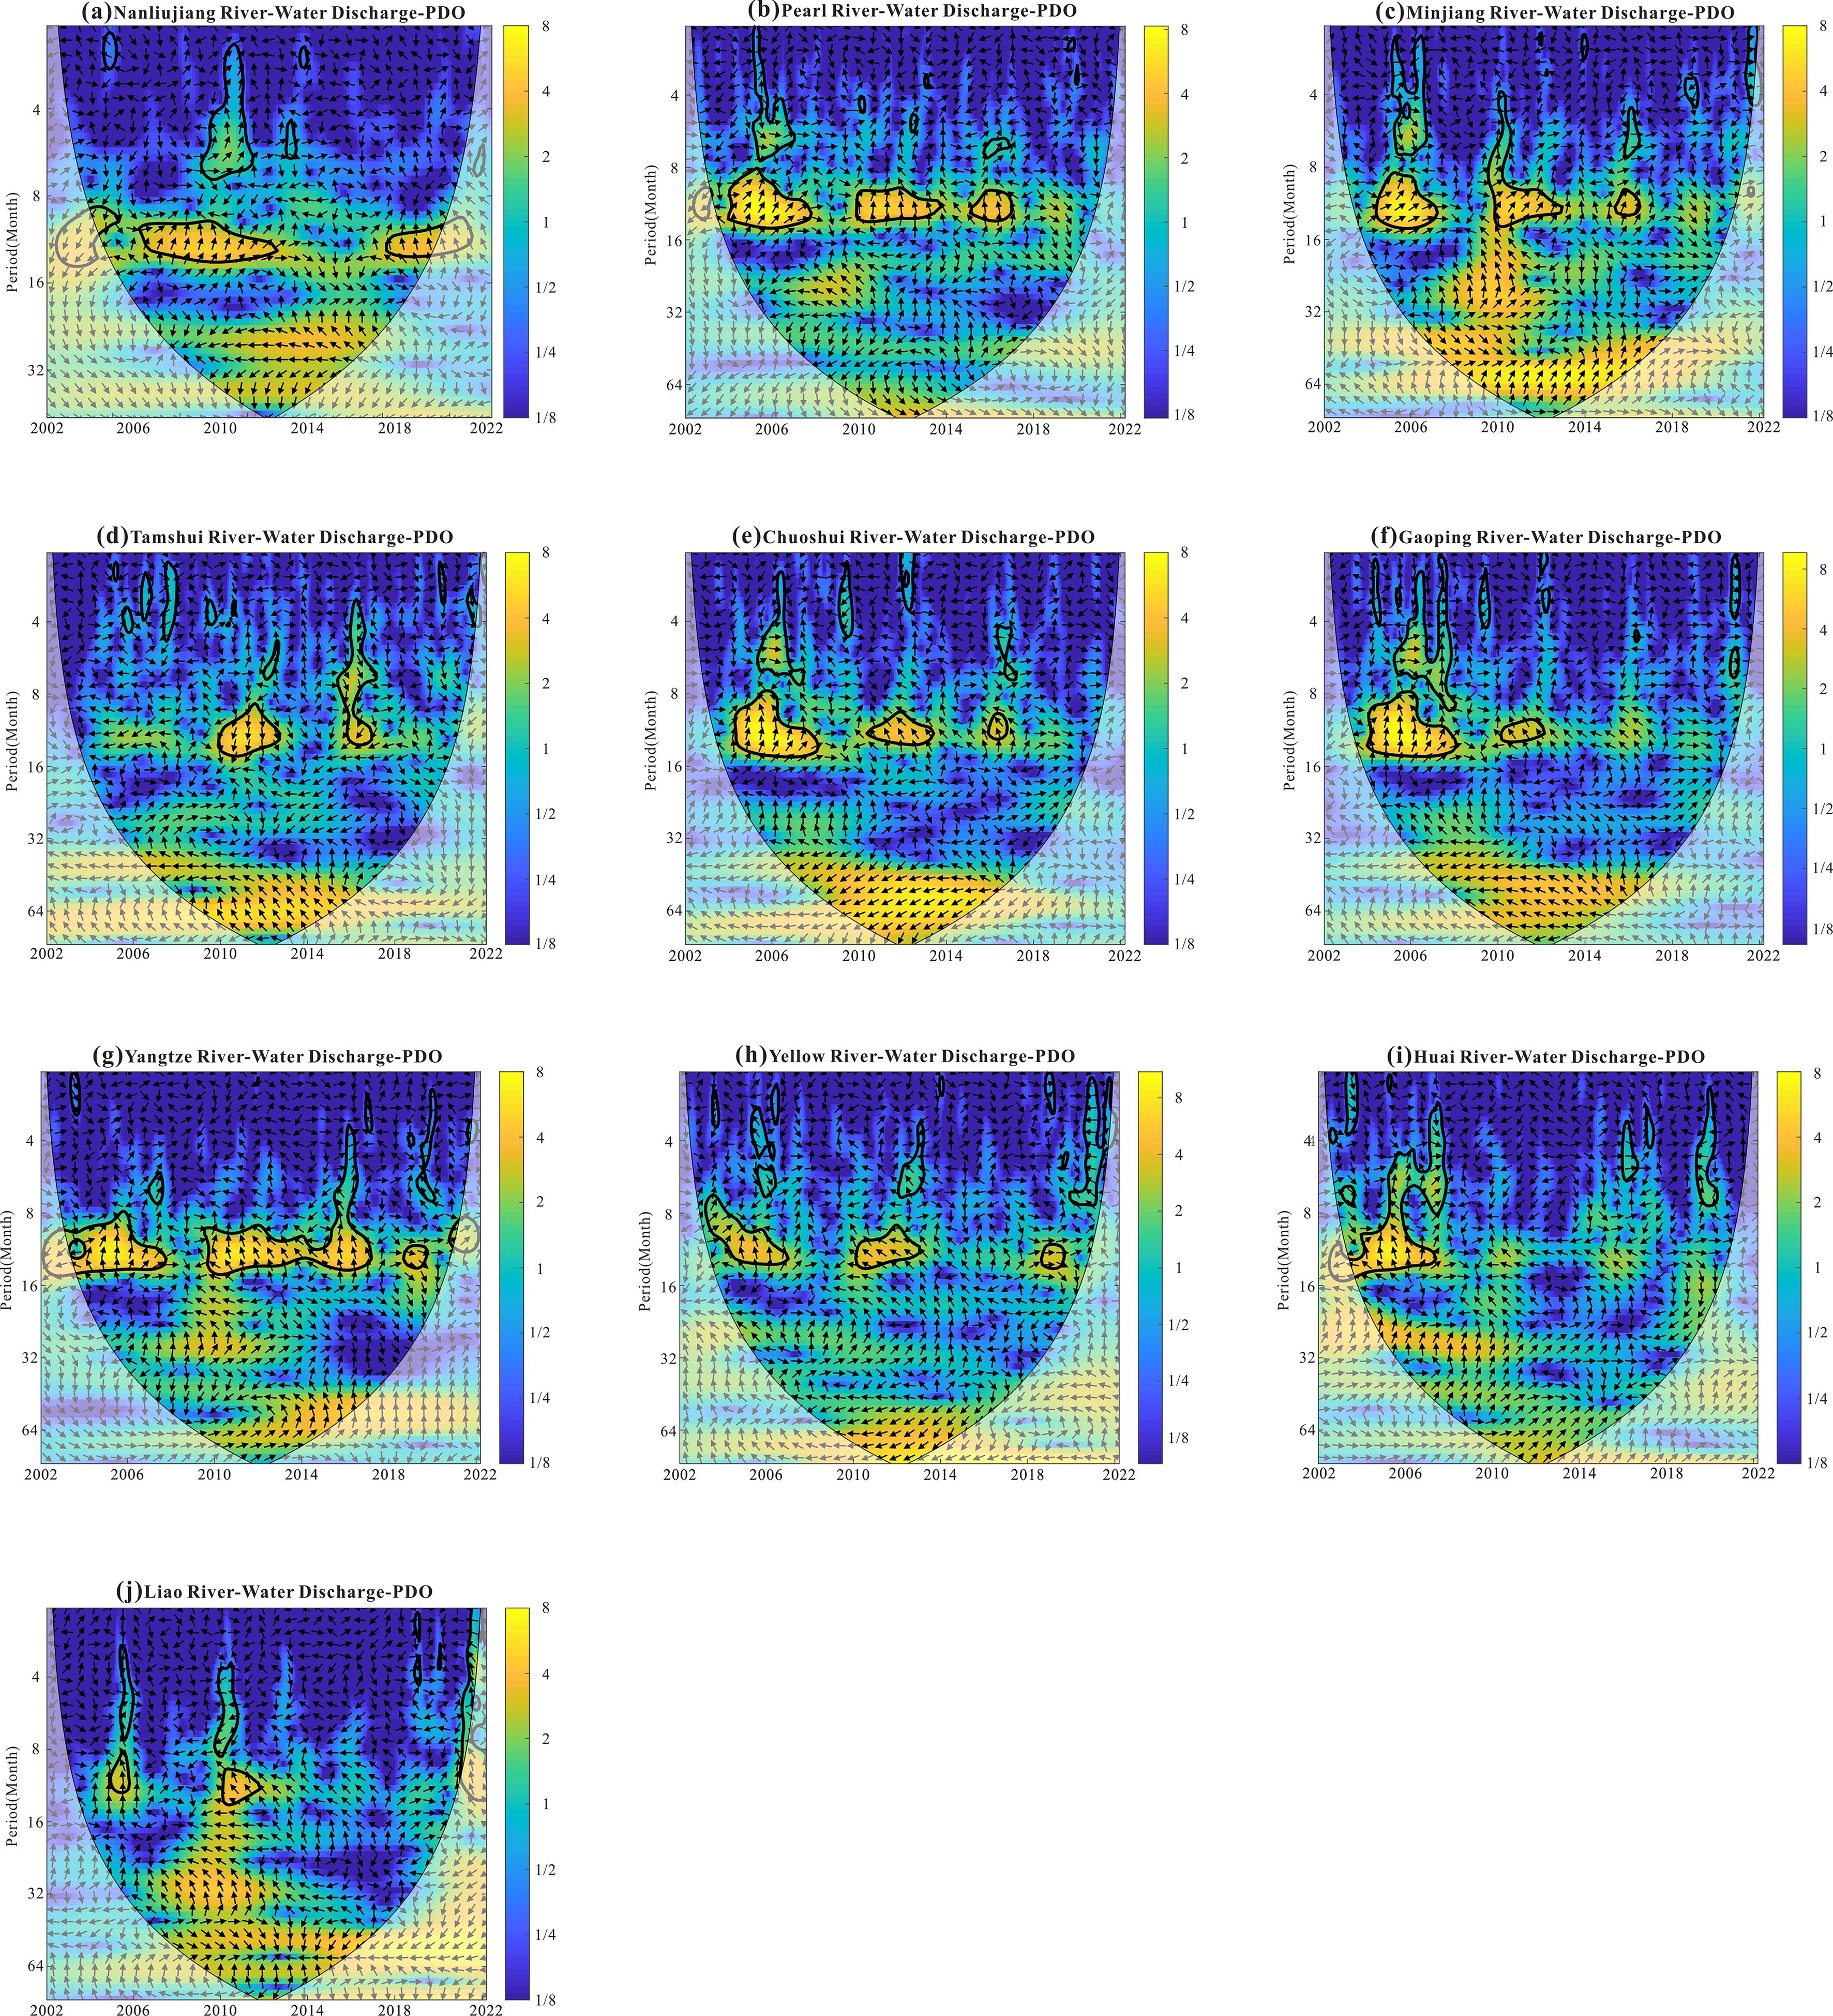
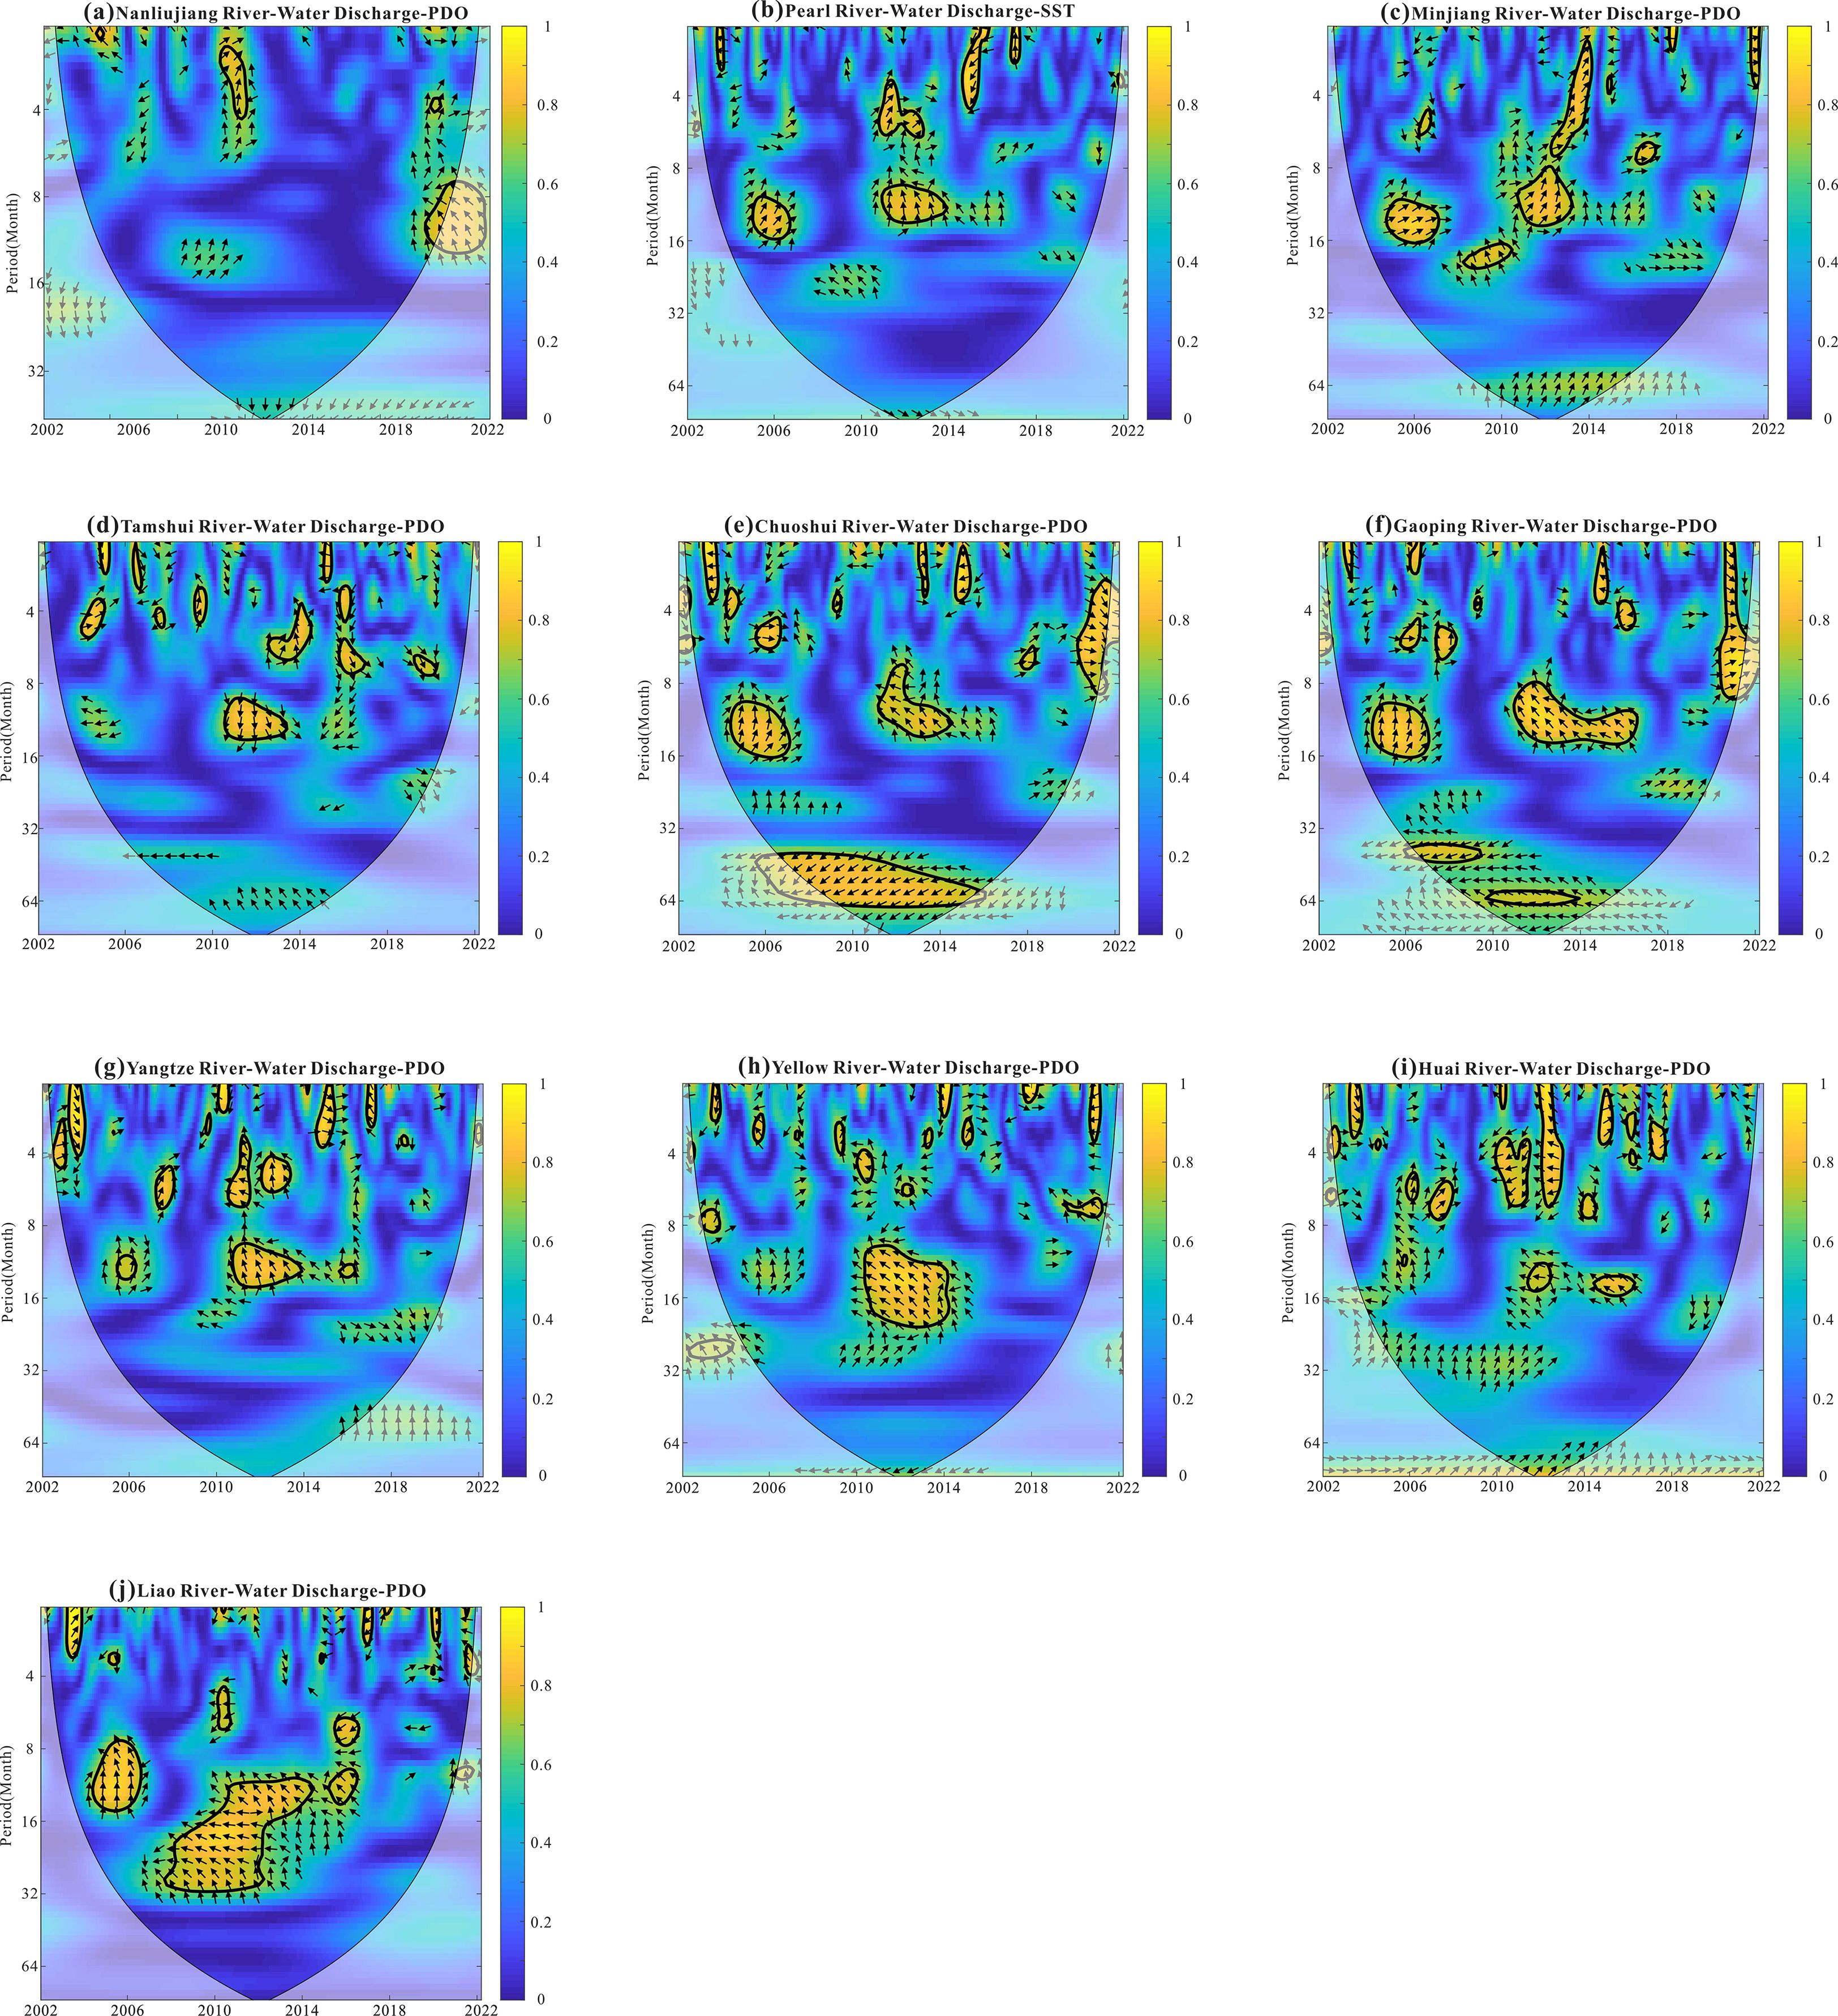
Figure 6 shows the flow of a single river with the XWT results prior to PDO. During the study period, the interannual cycle distributions of all rivers were scattered with complex phase relationships. interannual periodicity between flow and PDO was observed for the Pearl River, the Minjiang River, the Choshui River, and the Yellow River from 2004-2016. The water releases of the Nanliu River, Pearl River, Minjiang River, Choshui River, Gaoping River, Yangtze River, Yellow River, Huai River, and Liao River lag three months or more behind PDO variations. It also oscillates interannually (mostly every 8-16 months). It can be seen that PDO affects interannual scales to some extent in all rivers except Nanliu River.PDO has significant effects on interannual and interdecadal time scales from Figure 7. Coherence on annual scales was higher than that on intra-annual scales for the Pearl River, Minjiang River, Choshui River, Gaoping River, Yellow River, and Liao River. The continuous coherence between water discharge and PDO was not significant at any time scale throughout the study period.
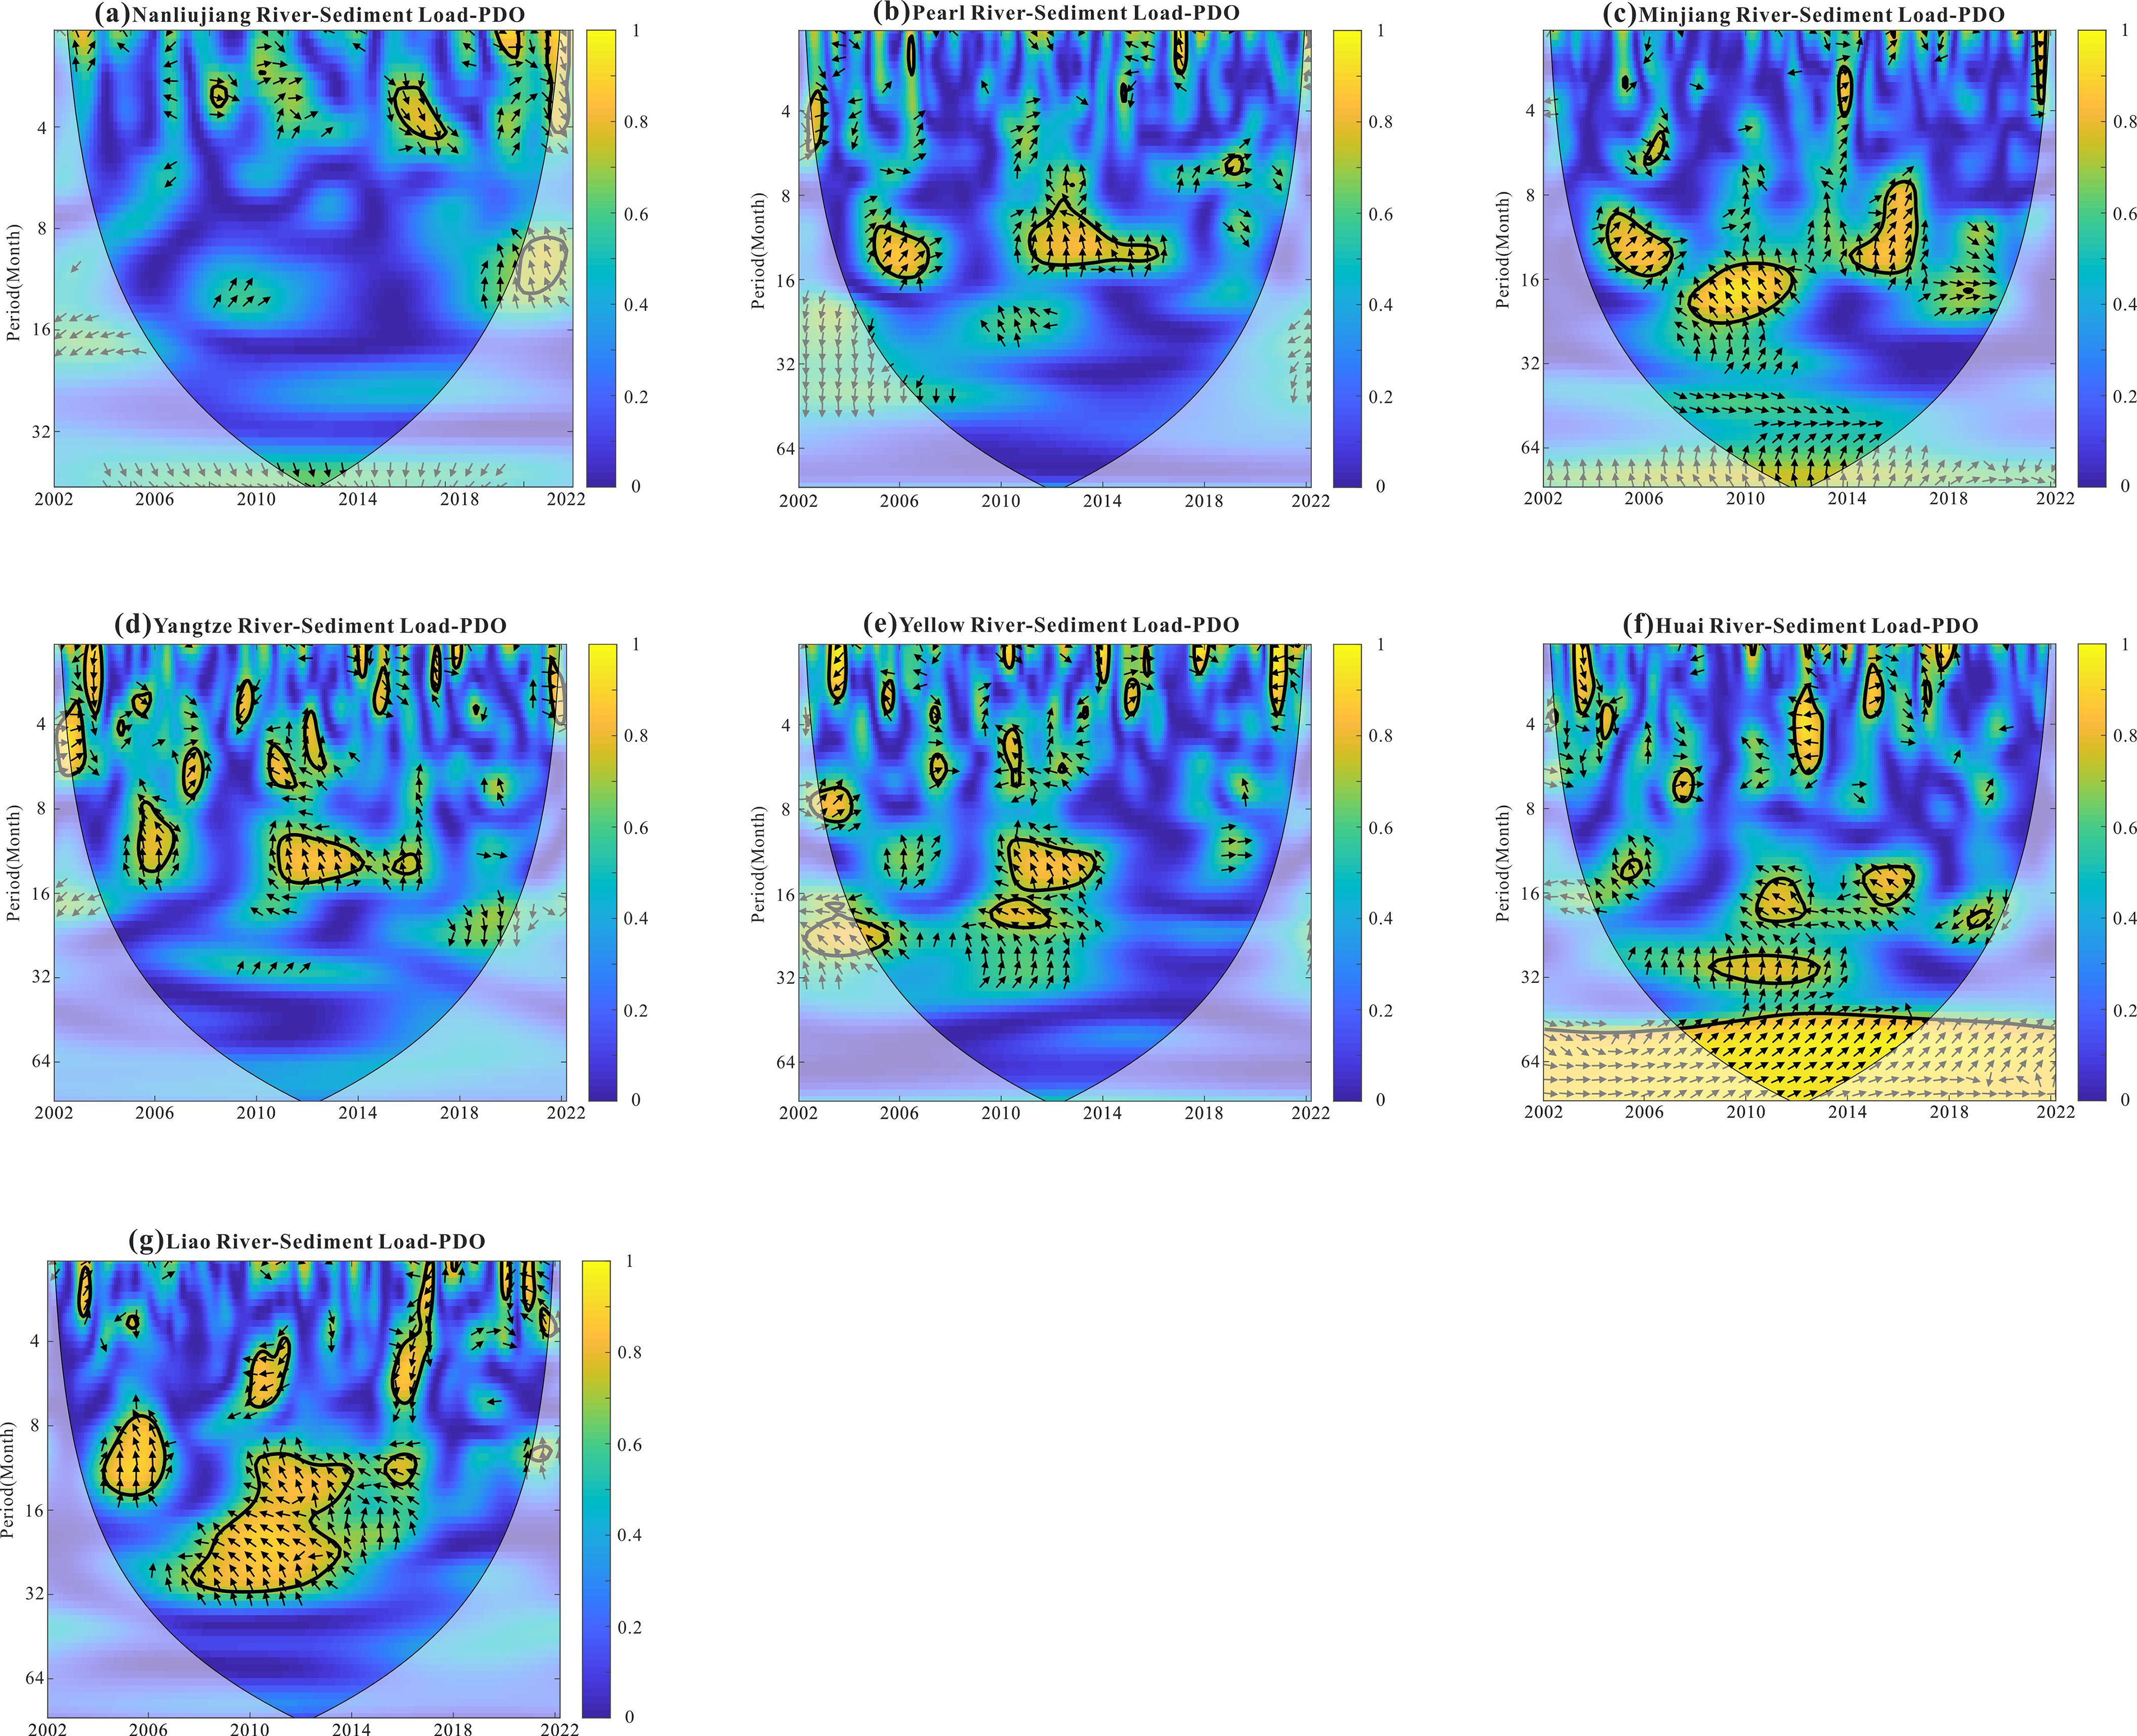
Figure 8 depicts potential link between sediment load and PDO in different rivers. The PDO altered each river’s sediment load about 2006. Both, and altogether, the sediment load of each river lagged behind the change in the PDO by approximately three months. There is no consistent relationship between sediment load and PDO.
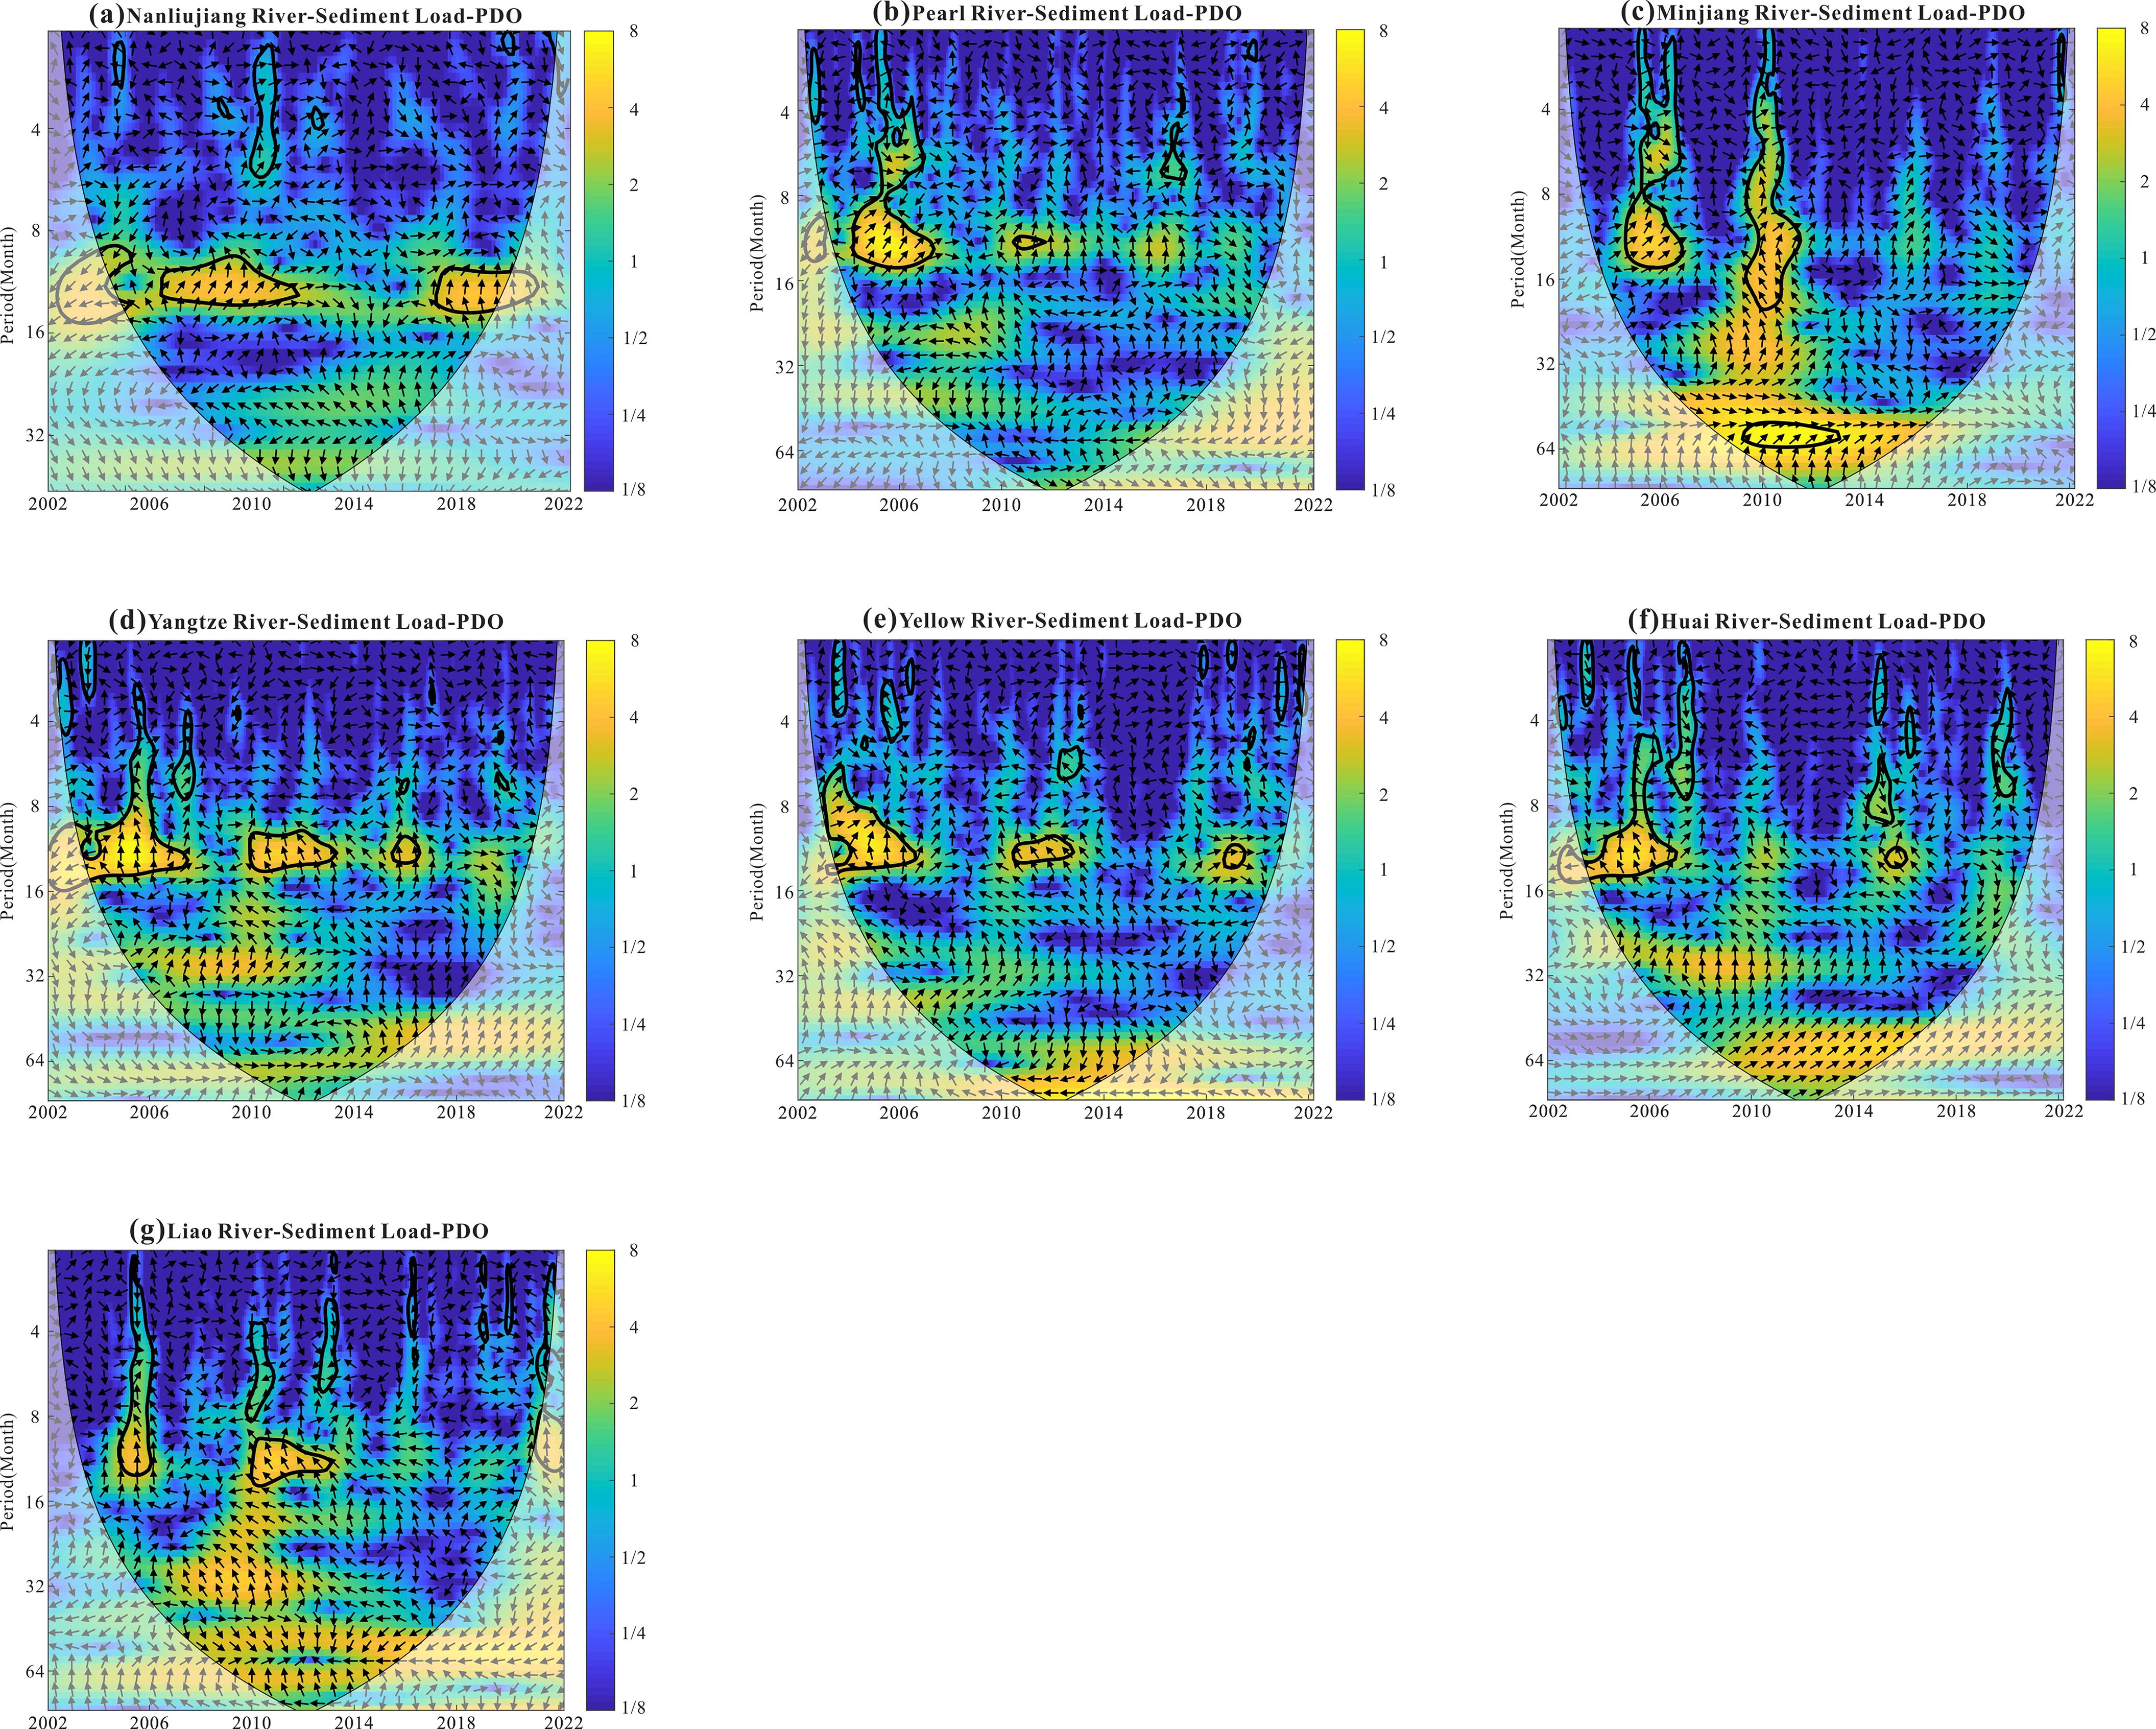
Figure 8. XWT: Crossed wavelet power spectrum between the monthly sediment load time series and the Nino3.4 SST.
Figure 9 shows that PDO had a major impact on the Yangtze River, Yellow River, Huai River, and Liao River on both intra- and inter-annual time frames.
4 Discussion
4.1 Linkages between climate oscillations
ENSO (El Niño and Southern Oscillation) has a cold phase and a warm phase, which are manifested in the ocean as El Niño (hot phase) and La Niña (cold phase) events. These two phases have significant impacts on precipitation variability in eastern China (Shi and Wang, 2019). The PDO’s spatial distribution is comparable to that of ENSO, and various studies have demonstrated that the two are inexorably linked.
Wang et al. (2008) pointed out that PDO affects and adjusts the background state of the tropical Pacific climate, which influences the spatial and temporal aspects of ENSO and creates inter-decadal variations, and in turn, ENSO controls the intensity of PDO on a variable range of 2-7 years. Kravtsov (2012) also discovered and shown that the inter-decadal fluctuation of ENSO variability is related to the climatic change component on the inter-decadal scale, which is incorporated into the PDO. Feng et al. (2014) revealed that the PDO can influence ENSO variability, as seen by the gradual decay of ENSO events in the positive phase and the rapid decay of ENSO events in the negative phase. Different phases of the PDO can regulate the occurrence frequency and amplitude size of ENSO.
In summary, the PDO influences the climate background state in the Pacific Ocean, modulating the amplitude, variability, and frequency of ENSO events, and ENSO, in turn, modulates the intensity of PDO events on a 2-7 years period. Because the phases of ENSO and PDO are not synchronized, the in-phase/out-of-phase relationship between ENSO and PDO has highly diverse effects on precipitation and water discharge in different areas.
4.2 Impacts of ENSO
Various PDO and ENSO events can influence the interannual variability of main precipitation patterns in China via atmospheric distant correlation (Sang et al., 2020; Chen et al., 2022). In turn, precipitation variations may result in increased discharge changes and associated sediment shifts, particularly for rivers with little glacial meltwater recharge (Legesse et al., 2010; Shi et al., 2013; Yin et al., 2023a).
The basin’s shorter interannual-scale cycle variations of water discharge and sediment load are significantly influenced by the anomalous interannual fluctuations of ENSO episodes. Among them, water discharge variations in the Pearl River and Minjiang River basins responded particularly quickly and sensitively to ENSO events, and they had the strongest link with SST changes, which were practically positively associated. This could be because the ENSO warm phase deflects low-level southwesterly winds from China’s southeast coast, which influences winter precipitation in southern China and consequently has an impact on water discharge (Wang et al., 2008).
Furthermore, despite the fact that Taiwan’s three mountain streams are physically close together, the phase connections between ENSO and water discharge differ. This may be due to the fact that when SST changes abnormally, the corresponding Walker Circulation, the position of the monsoon trough, and the subtropical high pressure will also change, which in turn will alter the large-scale circulation (Francisco et al., 2001; Echezuría et al., 2002). The location and path of tropical cyclone formation will be significantly affected by changes in thermodynamic factors, which include ocean surface temperature, mid-tropospheric relative humidity, and other dynamical factors influenced by it, such as low-level relative vorticity and vertical wind shear. Then the association with ENSO becomes less stable when small mountain streams are exposed to tropical cyclones, which can cause abrupt changes in water discharge.
When big rivers and mountain streams are compared, it can also be found that while the resonance period of water discharge and ENSO for large rivers like the Yangtze and Pearl Rivers extends throughout the entire study year, but it does not extend for the Tamsui, Choshui, and Gaoping rivers. This is likely because the rivers are shorter in length and produce relatively little water discharge annually, so a brief period during which one or more extreme rainfall events occur can contribute significantly to the annual water discharge and decouple the correlation between water discharge and ENSO changes in some years. The impact of ENSO shows a strong-weak trend from south to north, which is also supported by Ouyang et al. (2014).
4.3 Impacts of PDO
All rivers’ water discharge, with the exception of the Huai River, follows an interannual cycle of roughly ten years, which is consistent with the PDO’s cycle scale. Such a cycle results in an abundance/depletion changeover in the basin water discharge that coincides with the PDO’s cold/warm phase transition, indicating that the PDO is probably going to have an impact on the basin’s hydrological climate change. The sediment loads of the Nanliu River, Minjiang River, Yangtze River, Yellow River and Liao River are also similar to the interannual cycle of their water discharges. Analyzing the warm and cold phase phases of the PDO in combination with the water discharge and sediment load, It has been discovered that river water discharge south of the Yangtze River varies depending on whether the PDO is in its warm or cool phase. This could be because monsoon precipitation in southern China is heavily influenced by the Northwest Pacific Subtropical High Pressure (WNPSH). According to Zhu and Yang (2003), Precipitation in Northeast China is typically higher during the warm PDO than during the cold PDO due to the weakening of East Asian summer winds and the southward shift of the subtropical high pressure in the western Pacific Ocean, which increases summer precipitation in Northeast China during the warm PDO phase. In contrast, the reaction of yearly rainfall to warm and cold PDO phases in southern China differs from that in the north, with precipitation decreasing during the warm PDO phase and increasing during the cold PDO phase.
5 Conclusions
The current study examined how climate change affected the water discharge and sediment load of ten rivers in eastern China between 2002 and 2022. The following conclusions have been drawn:
1. ENSO and PDO have affected all rivers in eastern China, albeit to varying degrees.
2. The effects of ENSO on river basins varied from south to north, with weaker impacts on northern China’s Yellow River, Huai River and Liao River. Conversely, water discharge changes in the Pearl and Minjiang River basins in southeastern China were highly sensitive to ENSO events.
3. During the study period, ENSO had a consistent impact on major rivers, while smaller rivers experienced occasional impacts. The response rate of identical mountain and stream-type rivers varied.
4. Water flows south of the Yangtze River increased during the cold phase of the PDO, while discharges north of the river increased during the warm phase of the PDO.
Data availability statement
The original contributions presented in the study are included in the article/supplementary material. Further inquiries can be directed to the corresponding author.
Author contributions
FZ: Writing – original draft, Writing – review & editing. LZ: Validation, Writing – original draft, Writing – review & editing. YZ: Methodology, Writing – original draft, Writing – review & editing. HZ: Methodology, Writing – original draft, Writing – review & editing. XL: Supervision, Writing – original draft, Writing – review & editing. YX: Writing – original draft, Writing – review & editing.
Funding
The author(s) declare that financial support was received for the research, authorship, and/or publication of this article. This research was funded by the National Natural Science Foundation of China (No. 42301002), the Fujian Province Natural Science Foundation (No:2023J011573, 2023J011402), the Fujian science and technology Major special project (No:2022NZ033023), and the MJU Scientific Research Foundation for Talents (No: MJY22033, MJY23014).
Conflict of interest
The authors declare that the research was conducted in the absence of any commercial or financial relationships that could be construed as a potential conflict of interest.
Publisher’s note
All claims expressed in this article are solely those of the authors and do not necessarily represent those of their affiliated organizations, or those of the publisher, the editors and the reviewers. Any product that may be evaluated in this article, or claim that may be made by its manufacturer, is not guaranteed or endorsed by the publisher.
References
Blum M. D., Roberts H. H. (2009). Drowning of the Mississippi Delta due to insufficient sediment supply and global sea-level rise. Nat. Geosci. 2, 488–491. doi: 10.1038/ngeo553
Chen J., Zhao K., Wang Y., Cui Y., Liang Y., Shao Q., et al. (2022). ENSO effect on hydroclimate changes in southeastern China over the past two millennia. Quat. Sci. Rev. 285, 107539. doi: 10.1016/j.quascirev.2022.107539
Chen Z., Wang Z., Finlayson B., Chen J., Yin D. (2010). Implications of flow control by the Three Gorges Dam on sediment and channel dynamics of the middle Yangtze (Changjiang) River, China. Geology 38, 1043–1046. doi: 10.1130/G31271.1
Cohen S., Kettner A. J., Syvitski J. P. M. (2014). Global suspended sediment and water discharge dynamics between 1960 and 2010: Continental trends and intra-basin sensitivity. Glob. Planet. Change 115, 44–58. doi: 10.1016/j.gloplacha.2014.01.011
Dethier E. N., Renshaw C. E., Magilligan F. J. (2022). Rapid changes to global river suspended sediment flux by humans. Science 376, 1447–1452. doi: 10.1126/science.abn7980
Echezuría H., Córdova J., González M., González V., Méndez J., Yanes C. (2002). Assessment of environmental changes in the Orinoco River delta. Reg. Environ. Change 3, 20–35. doi: 10.1007/s10113-001-0038-4
Feng J., Wang L., Chen W. (2014). How does the East Asian summer monsoon behave in the decaying phase of El Niño during different PDO phases? J. Clim. 27, 2682–2698. doi: 10.1175/JCLI-D-13-00015.1
Feng S., Hao Z. (2021). Quantitative contribution of ENSO to precipitation-temperature dependence and associated compound dry and hot events. Atmos. Res. 260, 105695. doi: 10.1016/j.atmosres.2021.105695
Francisco Z.-A., Nagler P. L., Briggs M., Radtke D., Rodriquez H., Garcia J., et al. (2001). Regeneration of native trees in response to flood releases from the United States into the delta of the Colorado River, Mexico. J. Arid Environ. 49, 49–64. doi: 10.1006/jare.2001.0835
Hussain A., Hussain I., Rezaei A., Ullah W., Lu M., Zhou J., et al. (2024). Increasing monsoon precipitation extremes in relation to large-scale climatic patterns in Pakistan. Atmos. Res. 309, 107592. doi: 10.1016/j.atmosres.2024.107592
Ionita M., Scholz P., Chelcea S. (2015). Spatio-temporal variability of dryness/wetness in the Danube River Basin. Hydrol. Process. 29, 4483–4497. doi: 10.1002/hyp.10514
Juneng L., Tangang F. T. (2005). Evolution of ENSO-related rainfall anomalies in Southeast Asia region and its relationship with atmosphere–ocean variations in Indo-Pacific sector. Climate Dynam. 25, 337–350. doi: 10.1007/s00382-005-0031-6
Kao S. J., Milliman J. D. (2008). Water and sediment discharge from small mountainous rivers, Taiwan: the roles of lithology, episodic events, and human activities. J. Geol. 116, 431–448. doi: 10.1086/590921
Kravtsov S. (2012). An empirical model of decadal ENSO variability. Clim. Dyn. 39, 2377–2391. doi: 10.1007/s00382-012-1424-y
Labat D. (2004). Evidence for global water discharge increase related to climate warMinjiangg. Adv. Water Resour. 27, 631–642. doi: 10.1016/j.advwatres.2004.02.020
Lai X., Chen H., Hou Y., Finlayson B., Li M., Chen J. (2021). Lowering water level of Dongting lake of the Mid-Yangtze River in response to large-scale dam construction: a 60-year analysis. Geomorphology 391, 107894. doi: 10.1016/j.geomorph.2021.107894
Lai X., Yin D., Finlayson B. L., Wei T., Li M., Yuan W., et al. (2017). Will river erosion below the Three Gorges Dam stop in the middle Yangtze? J. Hydrol. 554, 24–31. doi: 10.1016/j.jhydrol.2017.08.057
Legesse D., Abiye T. A., Vallet-Coulomb C., Abate H. (2010). Streamflow sensitivity to climate and land cover changes: Meki River, Ethiopia. Hydrol. Earth Syst. Sci. 14, 2277–2287. doi: 10.5194/hess-14-2277-2010
Li L., Ni J., Chang F., Yue Y., Frolova N., Magritsky D., et al. (2020). Global trends in water and sediment fluxes of the world’s large rivers. Sci. Bull. 65, 62–69. doi: 10.1016/j.scib.2019.09.012
Lin F., Chen X., Yao H. (2017). Evaluating the use of Nash-Sutcliffe efficiency coefficient in goodness-of-fit measures for daily water discharge simulation with SWAT. J. Hydrol. Eng. 22, 05017023.1–05017023.9. doi: 10.1061/(ASCE)HE.1943-5584.0001580
Lu X. X. (2004). Vulnerability of water discharge of large Chinese rivers to environmental changes: an overview. Reg. Environ. Change 4, 182–191. doi: 10.1007/s10113-004-0080-0
Milliman J. D., Syvitski J. P. M. (1992). Geomorphic/tectonic control of sediment discharge to the ocean: the importance of small mountainous rivers. J. Geol. 100, 525–544. doi: 10.1086/629606
Milly P. C. D., Dunne K. A., Vecchia A. V. (2005). Global pattern of trends in streamflow and water availability in a changing climate. Nature 438, 347–350. doi: 10.1038/nature04312
Minjiangville M., Brissette F., Leconte R. (2008). Uncertainty of the impact of climate change on the hydrology of a Nordic watershed. J. Hydrol. 358, 70–83. doi: 10.1016/j.jhydrol.2008.05.033
Nalley D., Adamowski J., Biswas A., Gharabaghi B., Hu W. (2019). A multiscale and multivariate analysis of precipitation and streamflow variability in relation to ENSO, NAO and PDO. J. Hydrol. 574, 288–307. doi: 10.1016/j.jhydrol.2019.04.024
Ouyang R., Liu W., Fu G., Liu C., Hu L., Wang H. (2014). Linkages between ENSO/PDO signals and precipitation, streamflow in China during the last 100 years. Hydrol. Earth Syst. Sci. 18, 3651–3661. doi: 10.5194/hess-18-3651-2014
Rossi A., Massei N., Laignel B., Sebag D., Copard Y. (2009). The response of the Mississippi River to climate fluctuations and reservoirconstruction as indicated by wavelet analysis of streamflow and suspended-sediment load 1950–1975. J. Hydrol. 377, 237–244. doi: 10.1016/j.jhydrol.2009.08.032
Sang Y.-F., Fu Q., Singh V. P., Sivakumar B., Zhu Y., Li X. (2020). Does summer precipitation in China exhibit significant periodicities? J. Hydrol. 581, 124289. doi: 10.1016/j.jhydrol.2019.124289
Shi S., Shi J., Xu C., Leavitt S. W., Wright W. E., Cai Z., et al. (2020). Tree-ring δ18O from Southeast China reveals monsoon precipitation and ENSO variability. Palaeogeogr. Palaeoclimatol. Palaeoecol. 558, 109954. doi: 10.1016/j.palaeo.2020.109954
Shi H., Wang B. (2019). How does the Asian summer precipitation-ENSO relationship change over the past 544 years? Clim. Dyn. 52, 4583–4598. doi: 10.1007/s00382-018-4392-z
Shi C., Zhou Y., Fan X., Shao W. (2013). A study on the annual water discharge change and its relationship with water and soil conservation practices and climate change in the middle Yellow River basin. CATENA 100, 31–41. doi: 10.1016/j.catena.2012.08.007
Su L., Miao C., Duan Q., Lei X., Li H. (2019). Multiple-wavelet coherence of world’s large rivers with meteorological factors and ocean signals. J. Geophys. Res. Atmos. 124, 4932–4954. doi: 10.1029/2018JD029842
Torrence C., Compo G. P. (1998). A practical guide to wavelet analysis. Bull. Am. Meteorol. Soc 79, 61–78. doi: 10.1175/1520-0477(1998)079<0061:APGTWA>2.0.CO;2
Wang H., Kumar A. (2015). Assessing the impact of ENSO on drought in the U.S. Southwest with NCEP climate model simulations. J. Hydrol. Drought process. model. mitigation 526, 30–41. doi: 10.1016/j.jhydrol.2014.12.012
Wang H., Yang Z., Saito Y., Liu J. P., Sun X. (2006). Interannual and seasonal variation of the Huanghe (Yellow River) water discharge over the past 50years: Connections to impacts from ENSO events and dams. Glob. Planet. Change 50, 212–225. doi: 10.1016/j.gloplacha.2006.01.005
Wang H., Yang Z., Wang Y., Saito Y., Liu J. P. (2008). Reconstruction of sediment flux from the Changjiang (Yangtze River) to the sea since the 1860s. J. Hydrol. 349, 318–332. doi: 10.1016/j.jhydrol.2007.11.005
Wu B., Jiang D. (2024). Unstable interdecadal relationship between the Pacific Decadal Oscillation and eastern China summer precipitation in simulated warm interglacial epochs and twenty-first century. Global Planet. Change 237, 104458. doi: 10.1016/j.gloplacha.2024.104458
Yang R., Xing B. (2021). Possible linkages of hydrological variables to ocean-atmosphere signals and sunspot activity in the upstream Yangtze river basin. Atmosphere 12, 1361. doi: 10.3390/atmos12101361
Yin S., Gao G., Huang A., Li D., Ran L., Nawaz M., et al. (2023a). Streamflow and sediment load changes from China’s large rivers: Quantitative contributions of climate and human activity factors. Sci. Total Environ. 876, 162758. doi: 10.1016/j.scitotenv.2023.162758
Yin S., Gao G., Li Y., Xu Y. J., Turner R. E., Ran L., et al. (2023b). Long-term trends of streamflow, sediment load and nutrient fluxes from the Mississippi River Basin: Impacts of climate change and human activities. J. Hydrol. 616, 128822. doi: 10.1016/j.jhydrol.2022.128822
Yoon J.-H., Wang S.-Y. S., Gillies R. R., Kravitz B., Hipps L., Rasch P. J. (2015). Increasing water cycle extremes in California and in relation to ENSO cycle under global warMinjiangg. Nat. Commun. 6, 8657. doi: 10.1038/ncomms9657
Zhang Y., Zhao Q., Cao Z., Ding S. (2019). Inhibiting Effects of Vegetation on the Characteristics of Water discharge and Sediment Yield on Riparian Slope along the Lower Yellow River. Sustainability 11, 3685. doi: 10.3390/su11133685
Zhang Y., Zheng H., Zhang X., Leung L. R., Liu C., Zheng C., et al. (2023). Future global streamflow declines are probably more severe than previously estimated. Nat. Water 1, 261–271. doi: 10.1038/s44221-023-00030-7
Zhou F., Fang K., Ljungqvist F. C., Ou T., Cheng J., Zhang F., et al. (2024). ENSO weakens the co-variability between the spring persistent rains and Asian summer monsoon: Evidences from tree-ring data in southeastern China. J. Hydrol. 634, 131080. doi: 10.1016/j.jhydrol.2024.131080
Keywords: hydrological variability, climate oscillations, ENSO, PDO, wavelet transform
Citation: Zhang F, Zhang L, Zhong Y, Zou H, Lai X and Xie Y (2024) Linkage detection between climate oscillations and water and sediment discharge of 10 rivers in Eastern China. Front. Mar. Sci. 11:1484683. doi: 10.3389/fmars.2024.1484683
Received: 23 August 2024; Accepted: 09 December 2024;
Published: 24 December 2024.
Edited by:
Chunyan Li, Louisiana State University, United StatesReviewed by:
Mei Xuefei, East China Normal University, ChinaAzfar Hussain, Chinese Academy of Geological Sciences, China
Copyright © 2024 Zhang, Zhang, Zhong, Zou, Lai and Xie. This is an open-access article distributed under the terms of the Creative Commons Attribution License (CC BY). The use, distribution or reproduction in other forums is permitted, provided the original author(s) and the copyright owner(s) are credited and that the original publication in this journal is cited, in accordance with accepted academic practice. No use, distribution or reproduction is permitted which does not comply with these terms.
*Correspondence: Xiaohe Lai, bGFpeGlhb2hlQGZ6dS5lZHUuY24=
 Feng Zhang
 Li Zhang2
 Huangjie Zou
 Xiaohe Lai
 Yanshuang Xie