- 1College of Marine Science and Engineering, Shanghai Maritime University, Shanghai, China
- 2Shanghai Communications Construction Engineering Co., LTD. Engineering technology Department, Shanghai, China
- 3Translational Research Institute of Brain and Brain-Like Intelligence, Shanghai Fourth People’s Hospital, School of Medicine, Tongji University, Shanghai, China
- 4College of Harbour, Coastal and Offshore Engineering, Hohai University, Nanjing, China
The study of oceanic internal waves remains a critical area of research within oceanography. With the rapid advancements in oceanic remote sensing and deep learning, it is now possible to extract valuable insights from vast datasets. In this context, by building datasets using deep learning models, we propose a novel stripe segmentation algorithm for oceanic internal waves, leveraging synthetic aperture radar (SAR) images based on the SegFormer architecture. Initially, a hierarchical transformer encoder transforms the image into multilevel feature maps. Subsequently, information from various layers is aggregated through a multilayer perceptron (MLP) decoder, effectively merging local and global contexts. Finally, a layer of MLP is utilized to facilitate the segmentation of oceanic internal waves. Comparative experimental results demonstrated that SegFormer outperformed other models, including U-Net, Fast-SCNN (Fast Segmentation Convolutional Neural Network), ORCNet (Ocular Region Context Network), and PSPNet (Pyramid Scene Parsing Network), efficiently and accurately segmenting marine internal wave stripes in SAR images. In addition, we discuss the results of oceanic internal wave detection under varying settings, further underscoring the effectiveness of the algorithm.
1 Introduction
Oceanic internal waves comprise a wave phenomenon that extensively exists in the ocean. They contain vast energy, which could seriously threaten offshore engineering structures (Lavrova et al., 2014). Just as sea surface temperature (SST) is an essential parameter in studying ocean dynamics and climate change, the study by Gao et al. (2024a) provides new research ideas and technical means for predicting and analyzing SST related to marine meteorology. The effect of oceanic internal waves on the design of oil platforms and on ocean operations cannot be ignored, which makes accurately determining the locations of oceanic internal waves necessary.
With the rapid development of remote sensing, visible spectrum, altimeter, and synthetic aperture radar (SAR) have gradually become the main approaches for the observation of the inner ocean waves. The advantages of all-weather observations and high-resolution imaging lie mainly in microwave band SAR (Moreira et al., 2013). In addition, Gao et al. (2023b) proposed that spaceborne SAR satellites have a higher data rate, larger processing capacity, and more complex imaging algorithms than optical remote sensing satellites. SAR images contain a wealth of information and can observe various physical phenomena such as oceanic internal waves, wind waves, and ship vortex waves. These features of SAR are well reflected in ship target detection. Cao et al. (2024) proposed a deep learning model of ocean wave spectrum SAR 2 WV based on Pix2Pix by constructing a nonlinear mapping relationship between the SAR cross-spectrum and the ocean wave spectrum, which can significantly improve the inversion accuracy of the ocean wave spectrum and ocean wave parameters.
Oceanic internal waves appear as irregular streaks in SAR images, and this feature can easily be confused with features similar to other ocean phenomena. The amount of satellite remote sensing data is ever increasing; however, the traditional manual method of identifying the streaks of oceanic inland waves is error-prone and time-consuming. Therefore, to accurately determine the positions of oceanic internal waves, it is necessary to develop an automated segmentation method for oceanic internal waves in SAR images. Many scientists have studied the detection of oceanic internal waves. The detection and the feature description of oceanic internal waves in SAR images were realized based on wavelet transform (Rodenas and Garello, 1997). The two-dimensional wavelet transform was also used in a multi-scale gradient detection method to detect and locate oceanic internal waves (Ródenas and Garello, 1998). Li et al. (2020) used the optimized U-Net to obtain the stripes of oceanic internal waves from Himawari satellite images. A total of 120 of these images were randomly selected for training, and good results were achieved. Zhang et al. (2020) extracted 26 compact polarimetric (CP) features from fully polarimetric Advanced Land Observing Satellite-Phased Array-Type L-Band Synthetic Aperture Radar (ALOS-PALSAR) images to analyze the identification degree of internal waves using Jeffries and Euclidean distances and realized internal wave detection through the k-means clustering algorithm. Zheng et al. (2021c) classified SAR images and obtained oceanic internal waves based on support vector machine (SVM) and feature fusion. They then utilized Canny edges to detect the locations of the oceanic internal wave stripes. Moreover, Zheng et al. (2021b) proposed a segmentation algorithm for oceanic internal wave stripes in SAR images based on SegNet, which can be used to obtain the positions of the stripes and the relative positions of the light and dark stripes. Most recently, Zhang et al. (2024b) introduced a new SAR polarization measurement method that can detect man-made objects and ocean ice and indicate the motion of ship targets and ocean currents.
With the continuous development of deep learning technology, more and more scientists are attempting its use for the extraction of information from ocean remote sensing images. For example, in 2012, Hinton et al. (2006) adopted a deep learning model (AlexNet), which won the ImageNet competition; consequently, the deep learning algorithm gradually attracted the attention of the academic community. Subsequently, in 2020, Professor Li proposed the use of deep learning models to classify, segment, and align preprocessed remote sensing images to extract useful information. For ship detection at sea, Zhang et al. (2024c) summarized the existing ship detection and classification dataset resources and proposed the problems and challenges faced in ship datasets. Gao et al. (2023a) designed a scatter-sensing fully polarized SAR ship detection network (SCANet) based on the differences in the ship scattering characteristics and the powerful feature extraction capability of convolutional neural networks (CNNs). However, due to the inability of CNNs to effectively process sparse-labeled samples and unbalanced categories, Gao et al. (2023e) proposed a new attentional-intensive CycleGAN method, which enables attention-dense CycleGAN (ADCG) to solve the problems that CNNs cannot effectively process, i.e., sparse-labeled samples and unbalanced categories. To overcome the shortage of fully polarized SAR-labeled data, Gao et al. (2023d) proposed a polarization-driven binary cascade CNN (dualistic cascade CNN, DCCNN) algorithm for ship detection of fully polarized SAR data. For the problem of object classification in optical images, Gao et al. (2023c) proposed the lightweight adaptive task attention bi-prototype Brownian distance covariance (LATA-BP-BDC) to address the shortcomings of the current feature extraction and image discrimination capabilities. In 2024, Gao et al. (2024b) applied SAR in detecting ships at sea due to the ships in the SAR images having the characteristics of dense arrangement, arbitrary orientation, and diverse scale. The existing detection algorithms cannot effectively solve these problems. Therefore, a ship detection and classification method for SAR images based on YOLOV 8 was proposed. In addition, various detectors based on deep learning have also been applied for ship detection in SAR images. Zhang et al. (2024a) proposed a SAR image-directed ship detection network based on soft threshold and context information, which effectively suppressed ground noise interference and showed strong detection capability for offshore ships and small targets.
Semantic segmentation is an essential area of image processing that separates different semantic categories within images. Thanks to advances in natural language processing (NLP), a number of scientists have recently been using transformers in visual tasks. Dosovitskiy et al. (2020) achieved successful image classification with their proposed visual converter (vision transformer, ViT). Regarding semantic partitioning, Zheng et al. (2021a) proposed the segmentation transformer (SETR) model to demonstrate the functionality of transformers in image segmentation. Wang et al. (2021) developed a pyramid visual converter (PVT) suitable for the prediction of intensive tasks. The PVT is a pyramid structure made of ViT. This approach ignores the development of the decoder and instead mainly improves the transformer encoder. Following a previous work, Xie et al. (2021), the encoder and decoder, proposed a semantic segmentation framework (SegFormer) and provided satisfactory results.
This study proposed an algorithm for the segmentation of oceanic internal wave stripes based on SegFormer. Firstly, features with different resolutions were extracted using a hierarchical transformer encoder. Subsequently, a lightweight multilayer perceptron (MLP) encoder was employed to combine the multilevel features. Finally, a layer of MLP was utilized to segment the oceanic internal wave stripes, obtaining the locations of the oceanic internal waves in SAR images. The paper is divided into five sections. Section 2 introduces the datasets and the model used in this study. Sections 3 and 4 present the experimental results and provide the analysis and discussions. Section 5 presents the conclusions.
2 Data and methods
2.1 Data
2.1.1 Data sources
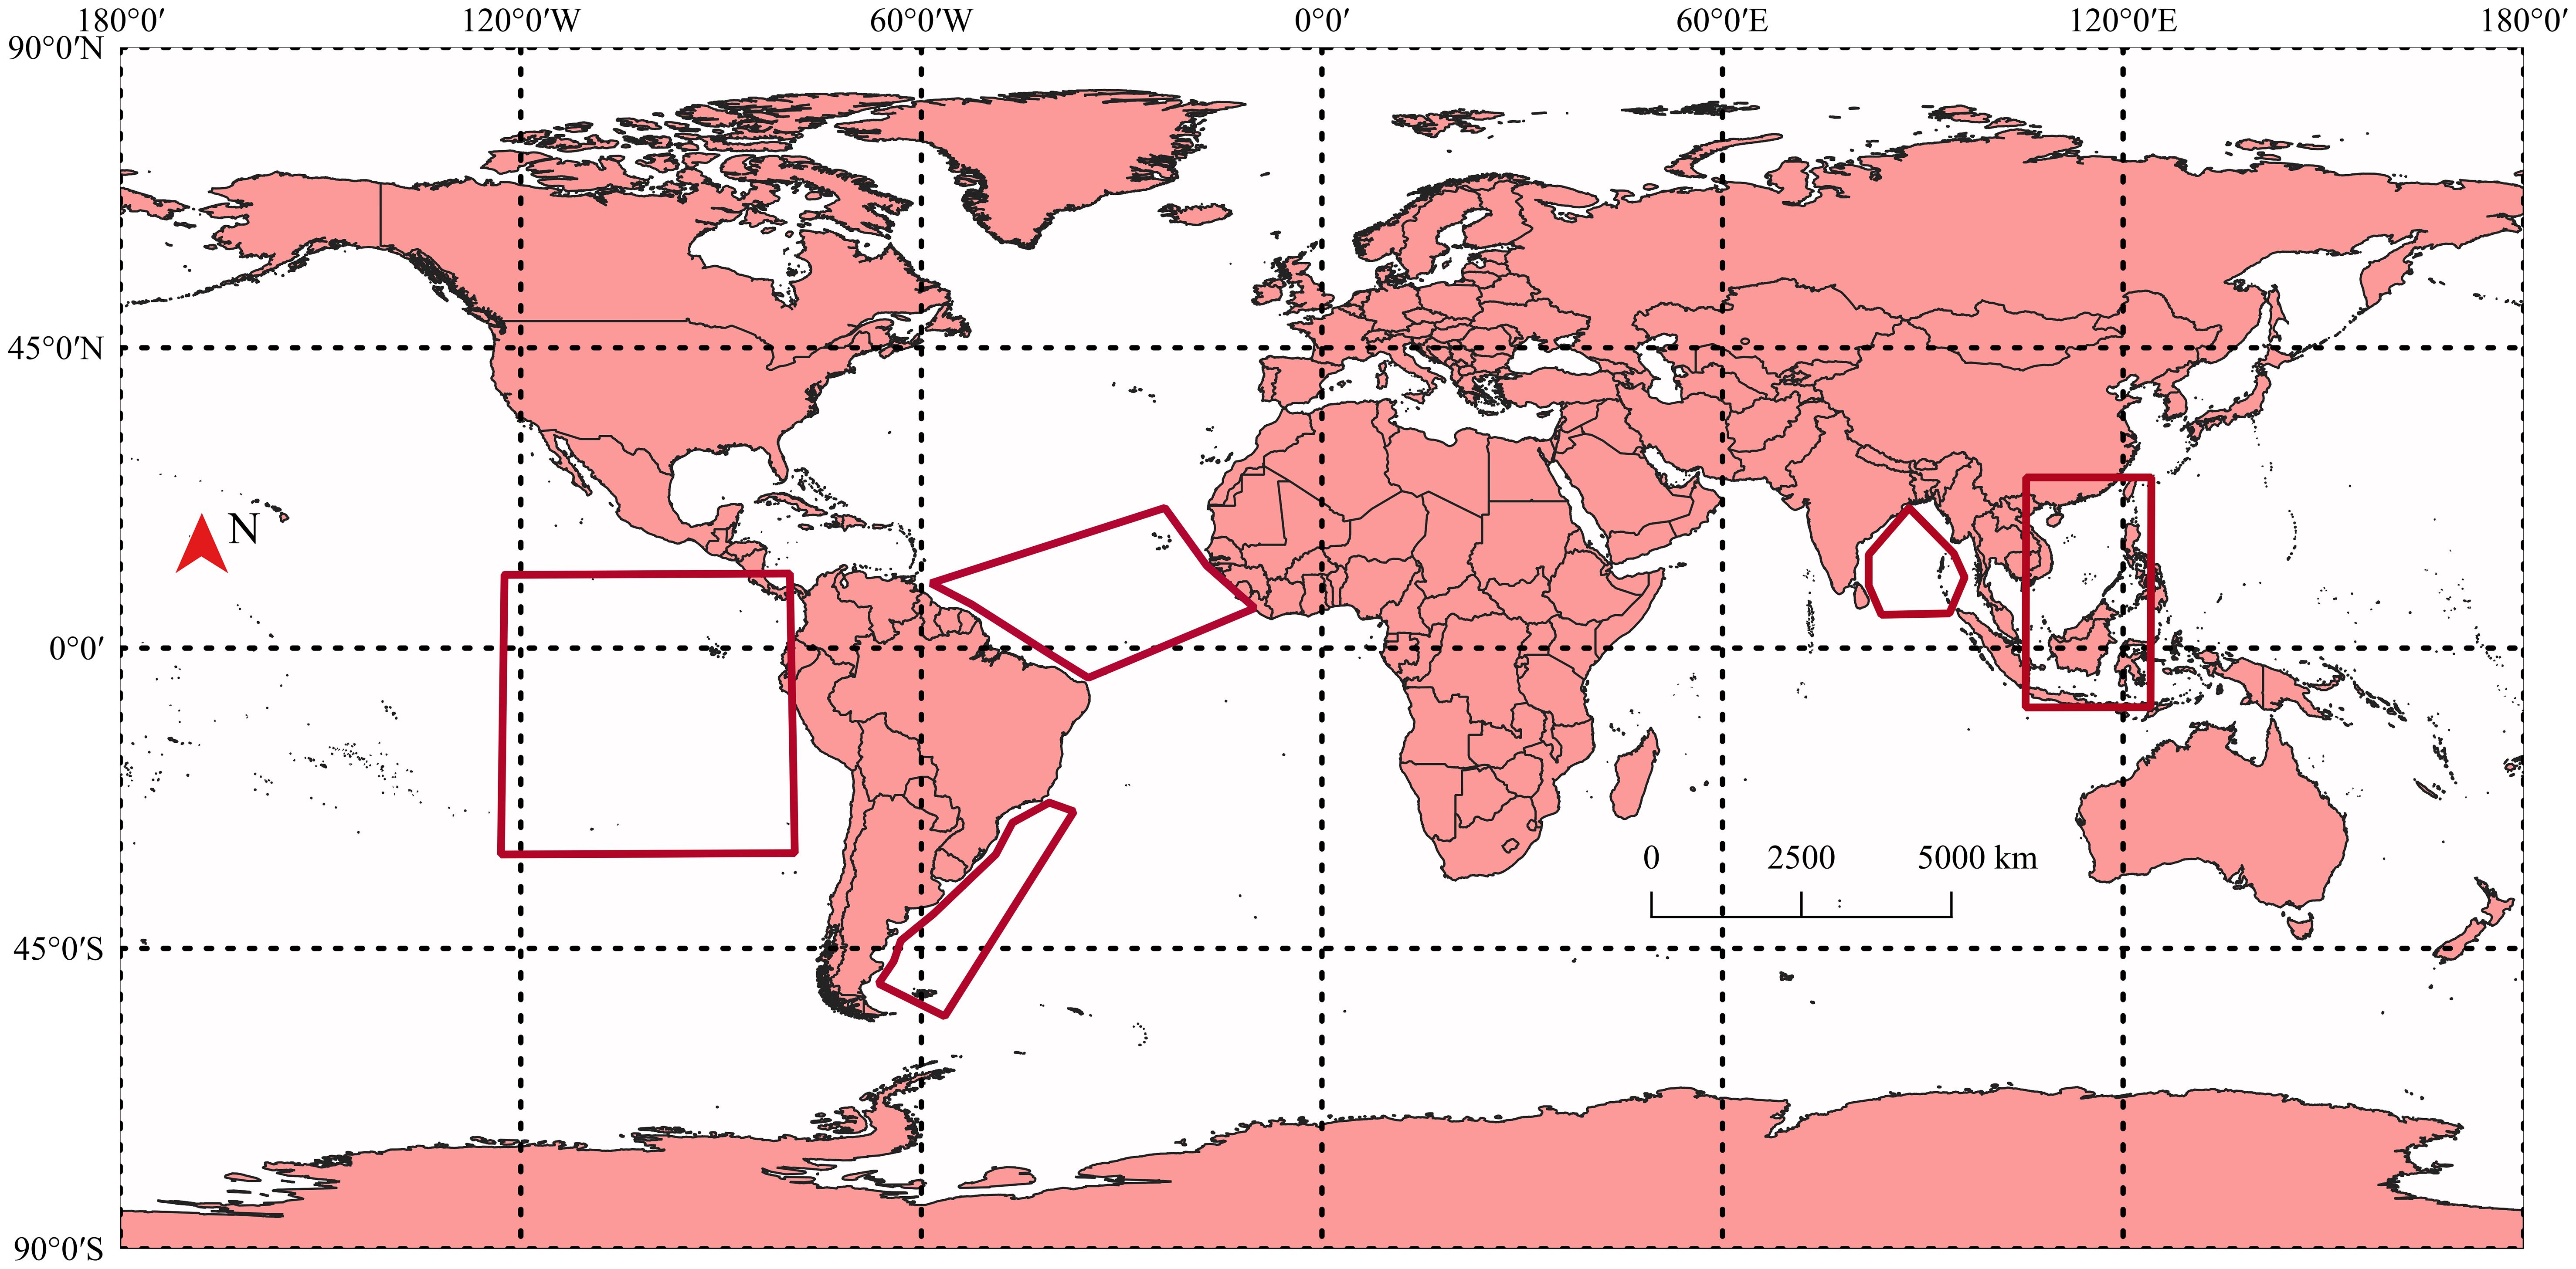
The study selected SAR image data from the Environmental Satellite (Envisat), Sentinel-1, the First European Remote Sensing Satellite (ERS-1), the Second European Remote Sensing Satellite (ERS-2), and the Advanced Land Observing Satellite (ALOS). The area of the downloaded data is depicted in the red polygon in Figure 1.
2.1.2 Dataset and annotation
The SAR image dataset with the oceanic internal waves and the corresponding label datasets were obtained through the following processes:
1. The SAR image corresponding to the red area was downloaded from the official website. The downloaded image is unprocessed and needs to be pre-processed.
2. The pre-processing of the original image data, including multi-view processing, can be used to improve the quality of the image and suppress the speckle noise in the picture. Filtering and geocoding can also be used for pre-processing.
3. To obtain the corresponding geographic information and the intensity value of the image, the image data were converted into the TIFF format.
4. All TIFF image data were randomly cropped for the purpose of data enhancement and were converted into the JPG format.
5. Labelme (Russell et al., 2007) software was used to manually mark the dataset in the JPG format and to generate JSON files in order to regenerate the label data in the PNG format.
Figure 2 shows a flowchart of the image data processing. Labelme software was used in this study to label each image pixel in the dataset. The labels were divided into two classes: internal wave and sea level. A total of 973 image labels were produced.
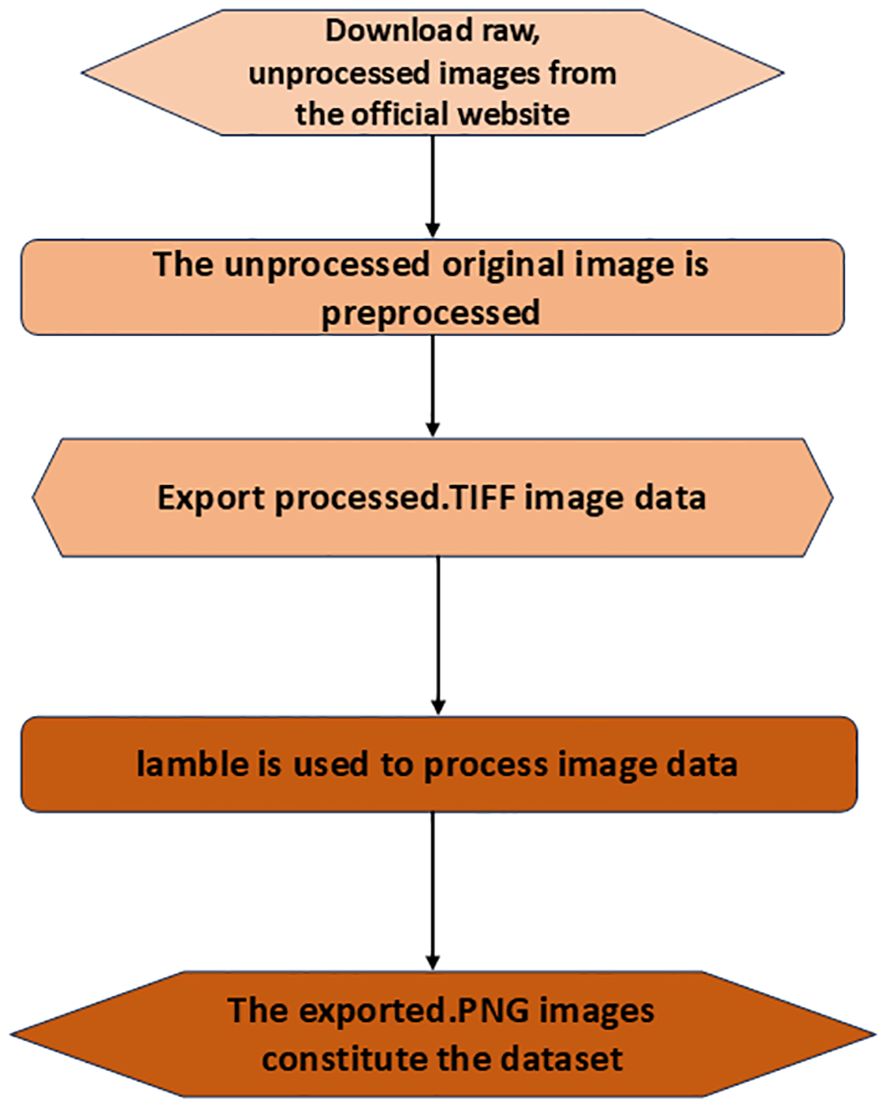
Figure 2. Steps for the collection of the oceanic internal wave synthetic aperture radar (SAR) datasets.
2.2 Method
Xie et al. (2021) proposed the SegFormer algorithm for semantic segmentation, a lightweight and efficient transformer framework. Compared with that in ViT (Dosovitskiy et al., 2020), SETR (Zheng et al., 2021), and Swin-Transforme (Liu et al., 2021), in SegFormer, the encoder was improved and the decoder redesigned. The structure diagram of the SegFormer model is shown in Figure 3. On one hand, the encoder in this study is a hierarchical transformer that does not require positional encoding. This allows handling images with arbitrary resolutions effectively. In addition, the hierarchical transformer can generate multilevel resolution features and make the extracted image feature richer. On the other hand, the lightweight MLP decoder fuses these multilevel features to produce the final optimization result. The decoder combines local and global attention by aggregating information from different layers. Therefore, the decoder is simple in structure and is powerful in performance.
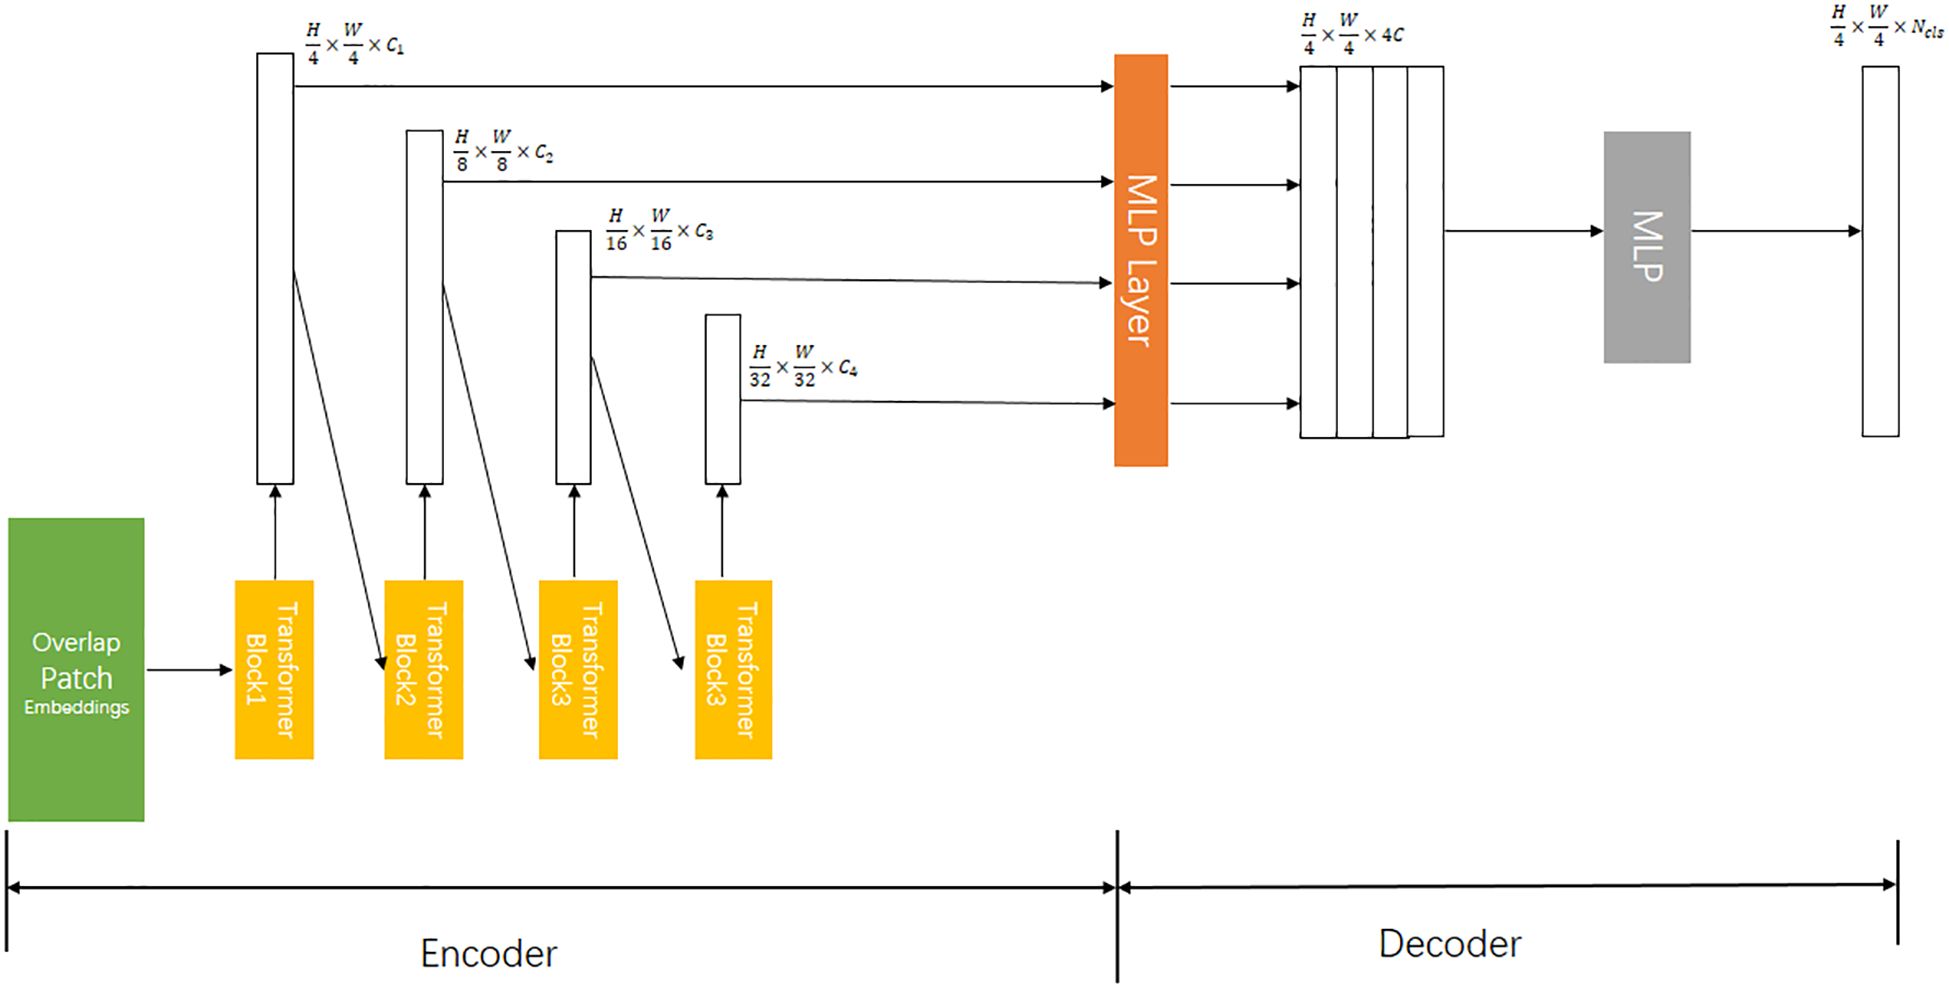
Figure 3. SegFormer framework (H、W represent the number of vertical and horizontal pixels of the image, while C denotes dimension. ——Split the number of categories).
2.2.1 Hierarchical transformer encoder
The SegFormer designed a series of MiT (mix transformer) encoders, including MiT-B0 to MiT-B5, which have the same architecture but different depths to facilitate training data of different scales. The hierarchical transformer encoder was designed to generate multilevel features. Given an input image resolution with a size of H × W × 3, the image is divided into patches of 4 × 4, and then the patches are merged into multilevel features by patch merging.
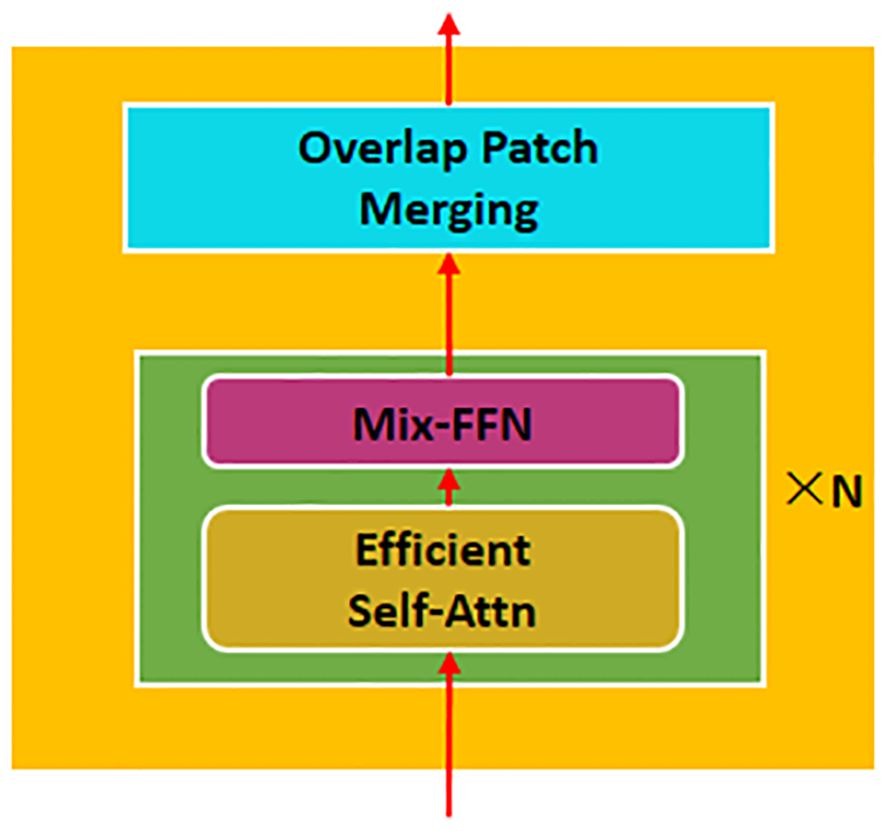
The encoder in the SegFormer network structure consists of four transformer blocks, as shown in Figure 4. Firstly, to reduce the computational cost, the efficient attention mechanism (Efficient Self-Attn) in the transformer block uses the sequence reduction process in the PVT (Xie et al., 2021). Subsequently, to alleviate the impact of positional encoding on accuracy, a mix feed-forward network (Mix-FFN) is introduced. It utilizes zero padding to record the location information (Islam et al., 2020) and a 3 × 3 convolution layer in the FFN. The 3 × 3 convolution can provide positional information for the transformer, reduce the number of parameters, and improve the computational efficiency. Finally, the patches are merged with overlap using the Overlapped Patch Merging to obtain the multilevel image features.
2.2.2 Lightweight all-MLP decoder
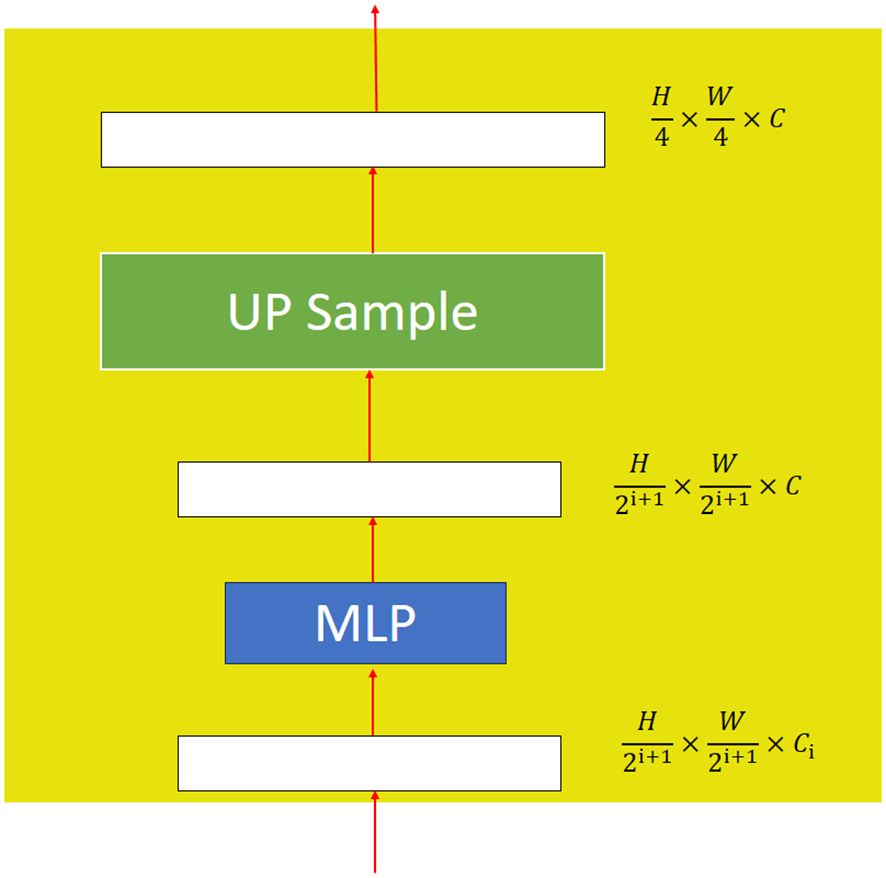
Xie et al. (2021) proposed a decoder architecture that consists of lightweight all-MLPs, as shown in Figure 5. Firstly, the multilevel features from the encoder use the MLP layer to unify the dimensions. Secondly, the feature maps are up-sampled to a uniform size and then merged. Thirdly, an MLP layer is used to fuse the combined features in order to obtain the feature F. Finally, another MLP layer is used to predict the segmentation mask M. A detailed structure of the MLP layer is shown in Figure 5.
2.2.3 Loss function
The loss function of SegFormer is the cross-entropy loss function, which is mainly used to evaluate the difference between the probability distribution obtained by the current training and the actual distribution. The formula is defined as follows:
where is the actual probability distribution, is the predicted probability distribution, and n is the total number of pixel samples.
3 Results and discussion
3.1 Implementation details
The image datasets were divided into the training, validation, and testing sets. The training set was utilized to train the model, the validation set was employed to configure the model parameters, and the test set was used to evaluate the generalization ability of the model. All experiments were trained using a single Nvidia RTX 3060 GPU. The operating system used was Windows, and the algorithm was implemented based on the MMSegmentation codebase and the Python platform, with Python version 3.7.11. The deep learning framework used was SegFormer. CUDA version 11.0 and cuDNN version 8.0.4 were utilized.
The input image size was 512 × 512. During the training process, data augmentation was performed, as follows: random resize (ratio, 0.5–2.0), random horizontal flip, and random cropping to a size of 128 × 128. For the basic network model, the Adam optimizer with a learning rate of 0.00006 and a weight decay of 0.01 was used for training. Table 1 shows the model training performance under different proportional datasets. It can be observed from the table that, when the ratio was 6:2:2, the cross-entropy of the testing set dropped to the lowest level, indicating the best performance of the model during testing.
3.2 Model evaluation
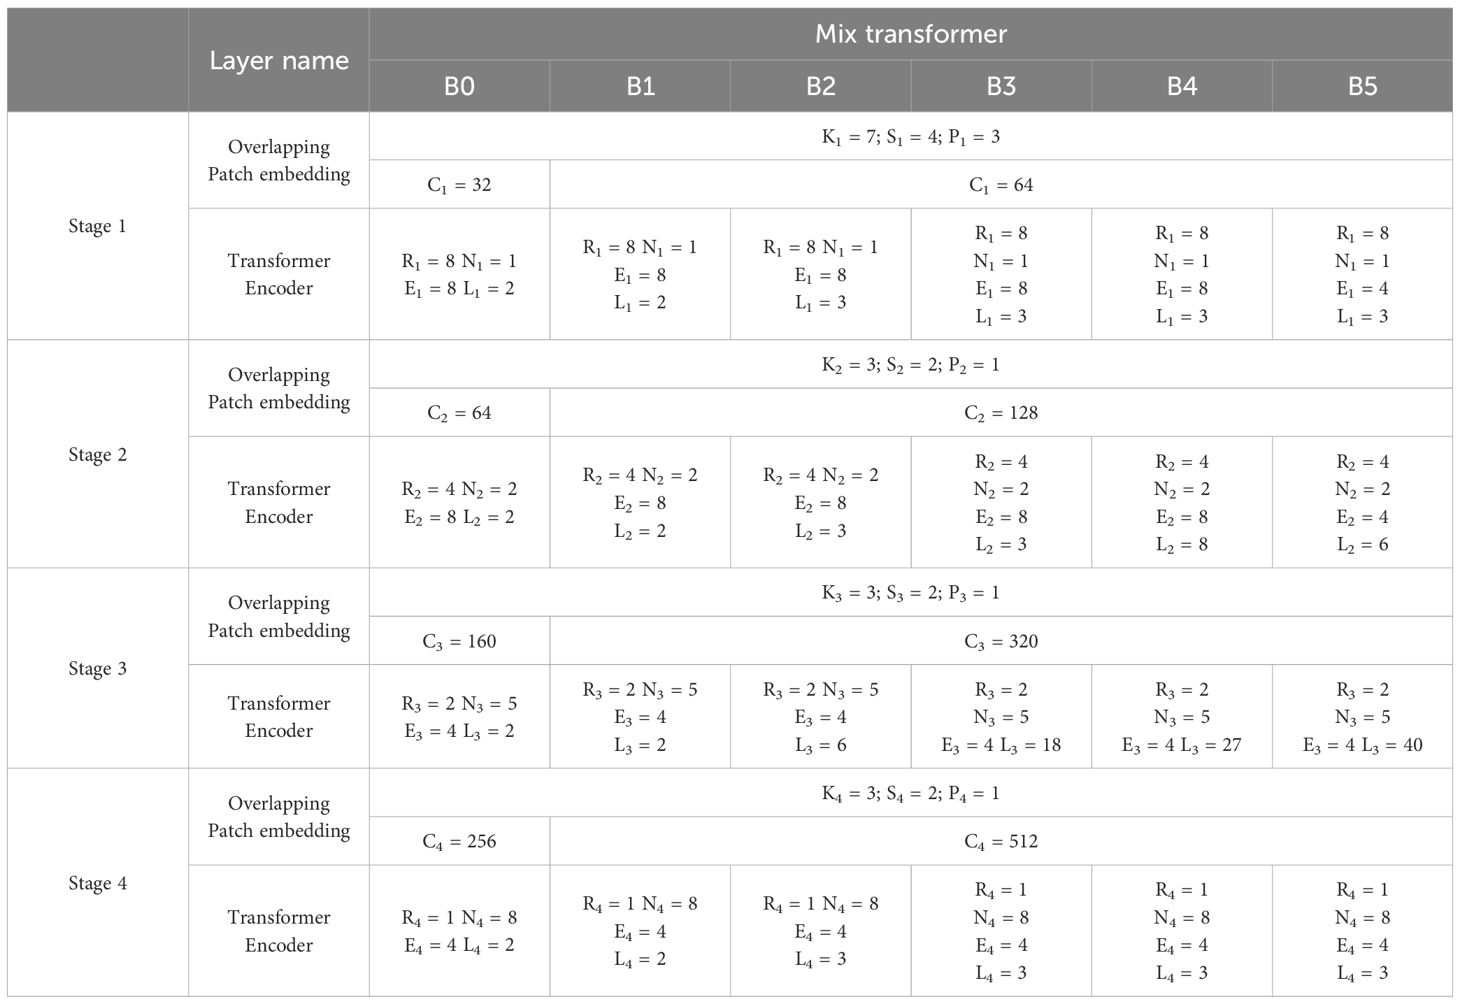
Based on the SegFormer model, the default patch size was 4 and the default number of training epochs was 16,000. The SegFormer model has six types of design, from MiT-B0 to MiT-B5, where the main change of the encoder is reflected in the deepening of the transformer layer, and the channel dimension in the MLP represents the changes in the decoder. When the C (channel) is 256, the model has better performance and lower computational cost. When C is more significant than 768, this can lead to a reduction in the model efficiency. The channel dimension of B0 and B1 was 256, while that of the others was 768. The detailed parameters are shown in Table 2.
This study analyzed the effect of encoder size on performance. Table 3 shows the performance analysis of the different models. As shown in the table, the parameters of the encoder increased with the scale, while the parameters of the decoder only accounted for a small part. With regard to the performance, the accuracy gradually increased with the rise of the encoder scale, and the calculation time also increased. For example, B5 took more than six times as long as B0. Therefore, it can be found that the lightweight MiT-B0 had high computational efficiency and good performance. In this study, the performance from MIT-B0 to MIT-B5 gradually increased. When there is a large amount of data, it is recommended to choose B5, which had the best performance. When there is a small amount of data, it is suggested to choose a lightweight model, such as MiT-B1, for prediction according to the demand in order to make more efficient use of the data resources and to achieve better prediction results.
3.3 Visual analysis
Four images with small scales were randomly selected from the testing set for prediction to evaluate the segmentation effect. The results were compared with those of U-Net, Fast Segmentation Convolutional Neural Network (Fast-SCNN), Ocular Region Context Network (ORCNet), and Pyramid Scene Parsing Network (PSPNet), as shown in Figures 6, 7. It can be observed from Figure 6II that the stripes of the oceanic internal waves segmented based on U-Net may fracture, and the stripe edges were too rough. In Figures 7V–VII, it can be observed that the oceanic internal wave stripes divided using the Fast-SCNN, ORCNet, and PSPNet frameworks were still connected and fuzzy. In Figures 6III, IV, however, it is indicated that the stripes of the oceanic internal waves segmented based on SegFormer were relatively complete and that the edge part was more refined, meaning that the superiority of the transformer in connecting global information was brought into full play. There were only a few lightweight MiT parameters, and the calculation efficiency was high. As mentioned above, it was demonstrated that SegFormer had the advantages of efficiency and accuracy in the stripe segmentation of oceanic internal waves.
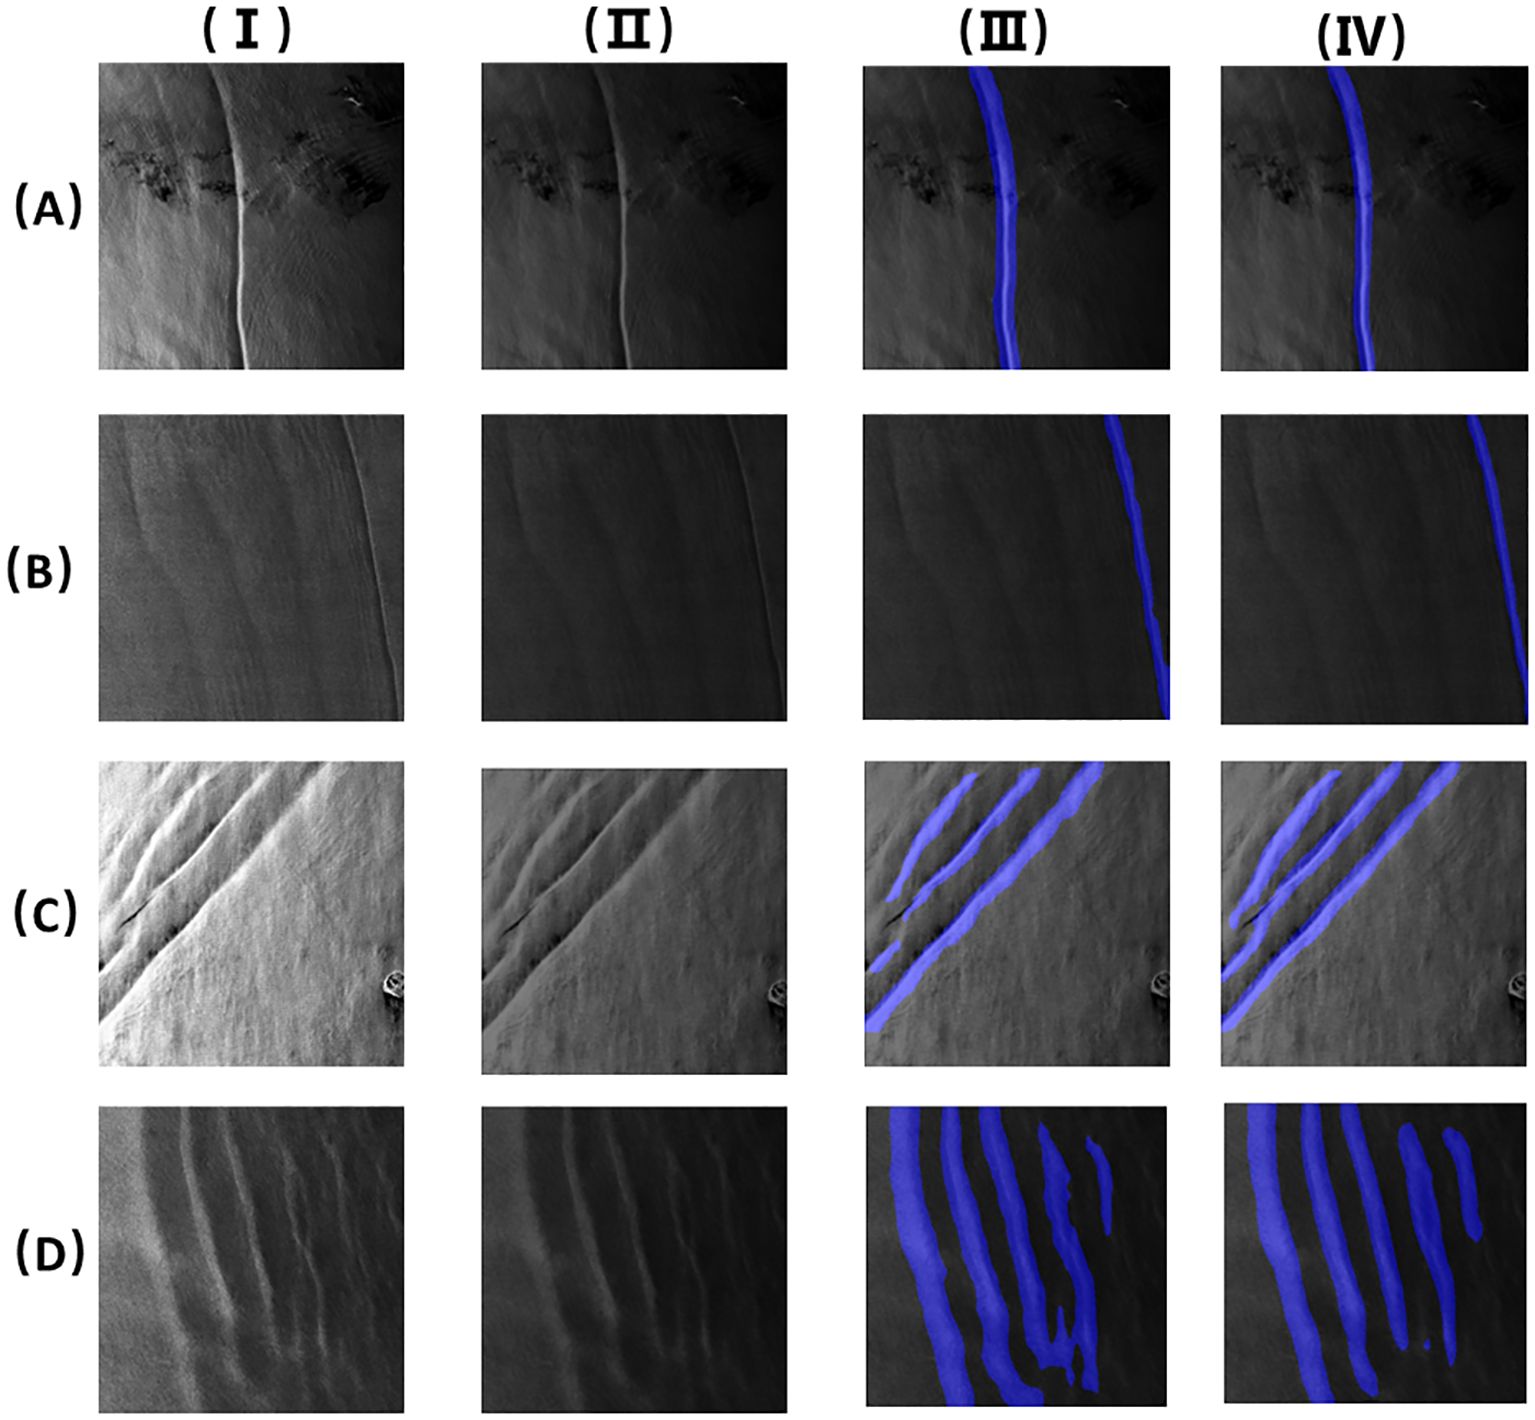
Figure 6. Stripes segmentation of oceanic internal wave of a small area (the four images (A–D) are the images of small-scale ocean internal waves. I. Original images; II. U-net segmentation results; III. Mit-B1 segmentation results; IV. Mit-B5 segmentation results).
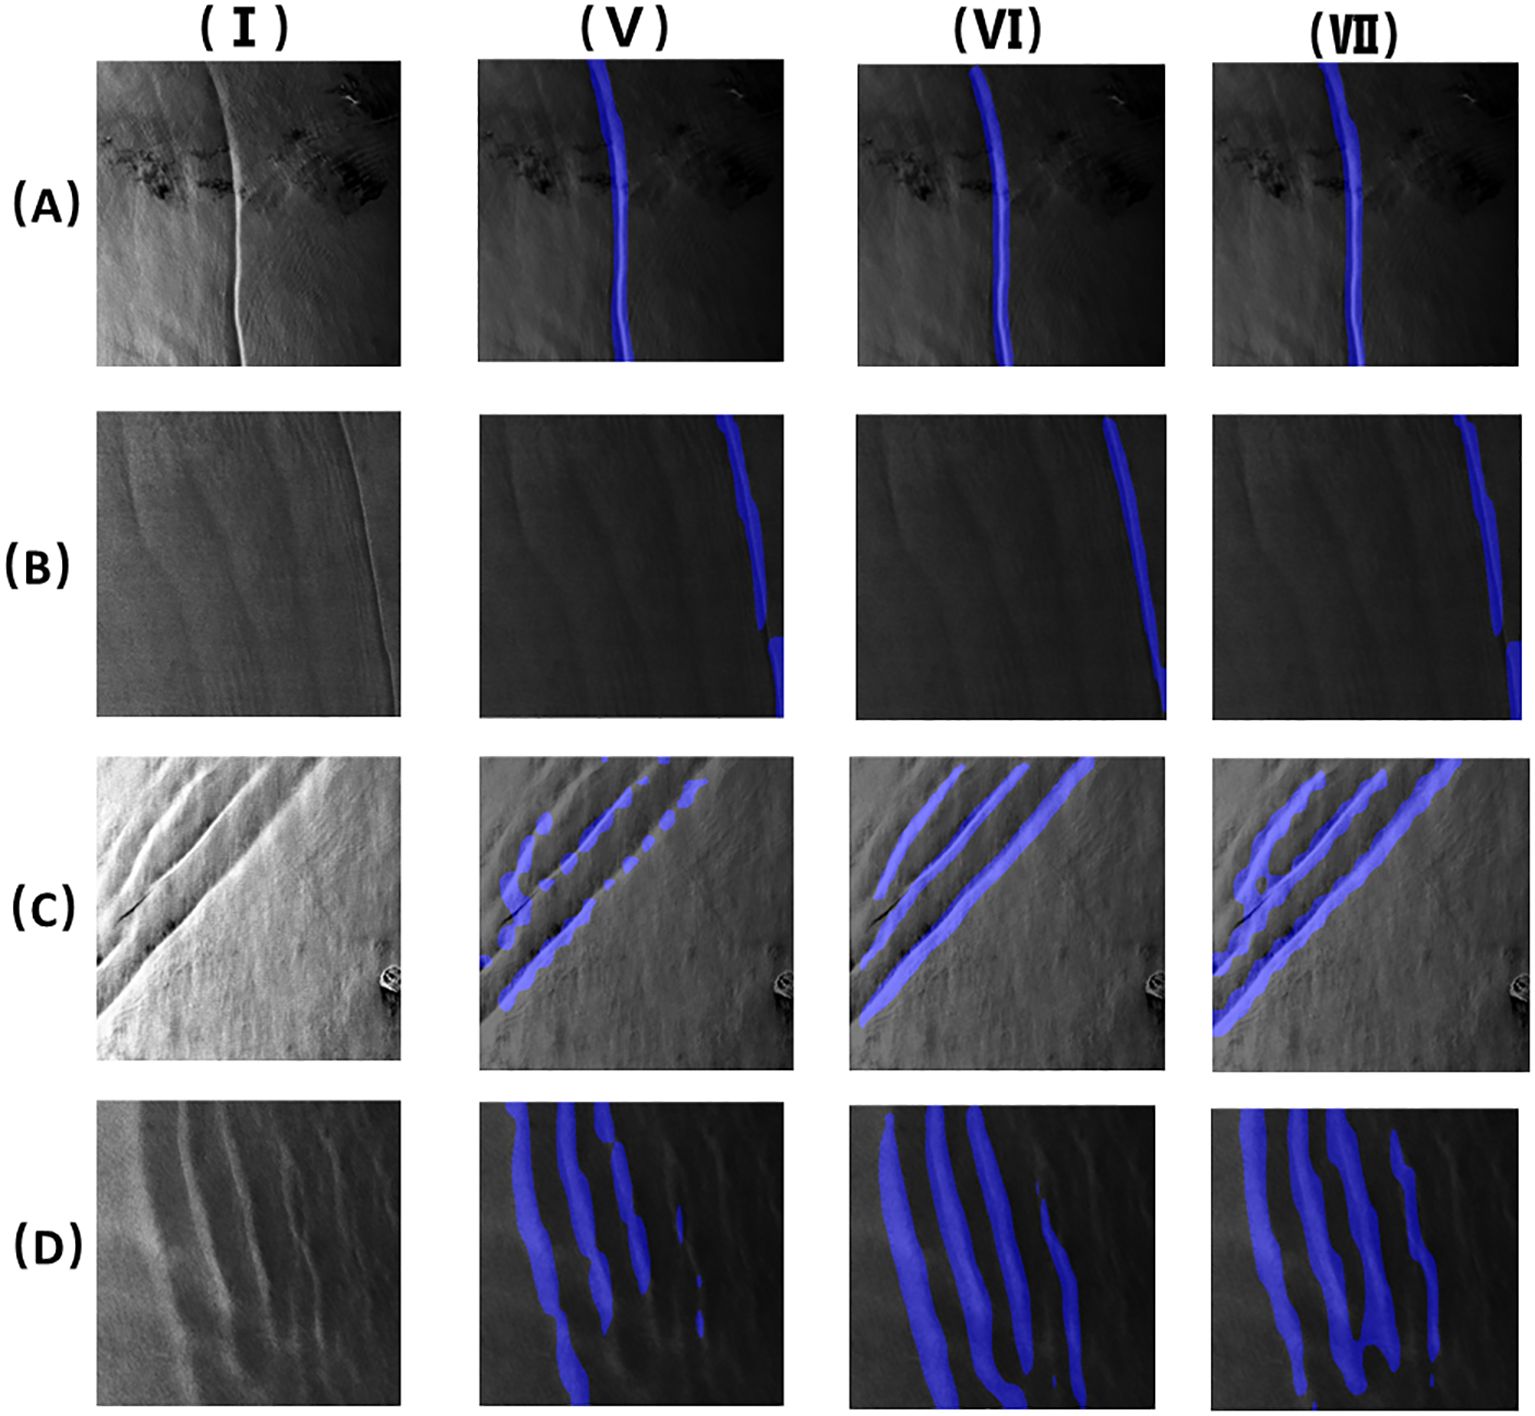
Figure 7. Stripes segmentation of oceanic internal wave of a small area (the four images (A–D) are the images of small area ocean internal waves. I. Original images; V. Fast-SCNN segmentation results; VI. OCRnet segmentation results; VII. PSPnet segmentation results).
By observing the stripe segmentation of oceanic internal waves of a small area, as shown in Figures 6, 7, the accurate locations and the approximate shape of the oceanic internal waves in SAR images can be obtained. However, it can be observed from Figures 6III, IV that a number of mis-segmentations were encountered when using MiT-B1 and MiT-B5, partly due to manual errors during labeling. For MiT-B5, in addition to the above, a small amount of data or too large a scale of the model could also a possible reason. These issues can be solved by expanding the amount of training sets or by using smaller models.
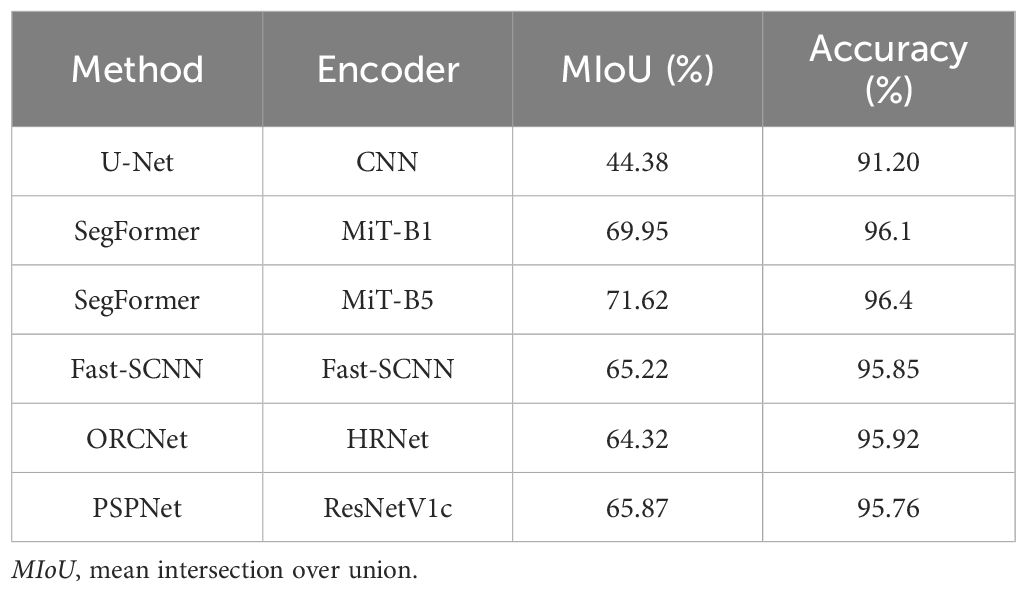
Table 4 analyzes the training performance of the U-Net, SegFormer-B1, SegFormer-B5, Fast-SCNN, ORCNet, and PSPNet models. It is shown in the table that the mean intersection over union (mIoU) of SegFormer-B1 was 25.57% higher than that of U-Net. The mIoU of SegFormer-B5 was 27.24% higher than that of U-Net, while the mIoU values of Fast-SCNN, ORCNet, and PSPNet were all lower than that of SegFormer. Tables 5–8 respectively represent the evaluation indicators of the different images under different models. On the whole, SegFormer-B5 showed certain superiority in the segmentation of marine internal wave stripes in small areas.

Table 5. Evaluative indices of small-area oceanic internal wave stripe segmentation under different models.

Table 6. Evaluative indices of small area oceanic internal wave stripe segmentation under different models.

Table 7. Evaluative indices of small-area oceanic internal wave stripe segmentation under different models.

Table 8. Evaluative indices of small-area oceanic internal wave stripe segmentation under different models.
The U-Net model is a CNN model used for image segmentation. Compared with that of the SegFormer series models, the model segmentation effect of U-Net was not as good, mainly due to its performance being largely dependent on the quality and the quantity of the training data, and the number of marine internal wave stripe images used in small areas cannot meet the number of U-Net training. Secondly, U-Net requires a lot of computing resources, and the computer parameters used here cannot fully meet its requirements; therefore, the final segmentation effect was affected. Fast-SCNN is a semantic segmentation algorithm suitable for high-resolution images. The resolution of the constructed images of the marine internal wave stripes in small areas was too low, or the labeled data cannot meet the training effect and cannot segment the marine internal wave stripes well. As a network model for semantic image segmentation, the performance of PSPNet largely depends on high-quality annotation data, parameter tuning, and the training difficulty. Its generalization ability may be challenged in complex scenarios, and the diversity of oceanic internal wave stripes makes it difficult for the model to obtain the necessary information, thus affecting the segmentation results. ORCNet uses high-resolution network (HRNet) as the backbone network. With limited resources and the environment, it may be difficult for ORCNet to achieve the ideal segmentation effect. At the same time, it is affected by several parameters, including the learning rate, the batch size, and the convolution kernel size. The optimization of these parameters requires a certain amount of experience, and an improper setting of parameters will lead to a degradation of the model performance.
The six groups of images above were compared and established. It is indicated that the predicted effect when using MiT-B5 with the more robust performance is better if large-scale data are available for training, while the lightweight model, such as MiT-B1, should be selected in order to use the data resources more efficiently and to obtain better prediction results if the amount of data is small. The results indicated that SegFormer is accurate in the segmentation of oceanic internal wave stripes.
The oceanic internal wave stripe segmentation of a large area is shown in Figure 8. The image in Figure 8E was taken on December 2, 2010, with central coordinates of 17°50′ N, 85°21′ E. The image in Figure 8F was taken on September 13, 2010, with central coordinates of 19°20′ N, 86°5′ E, Figure 8G was taken on February 8, 2007, with central coordinates of 7°29′ N, 96°23′ E, and the image in Figure 8H was taken on December 10, 2007, with central coordinates of 6°29′ N, 96°23′ E. All four images used the HH (horizontal–horizontal) polarization mode.
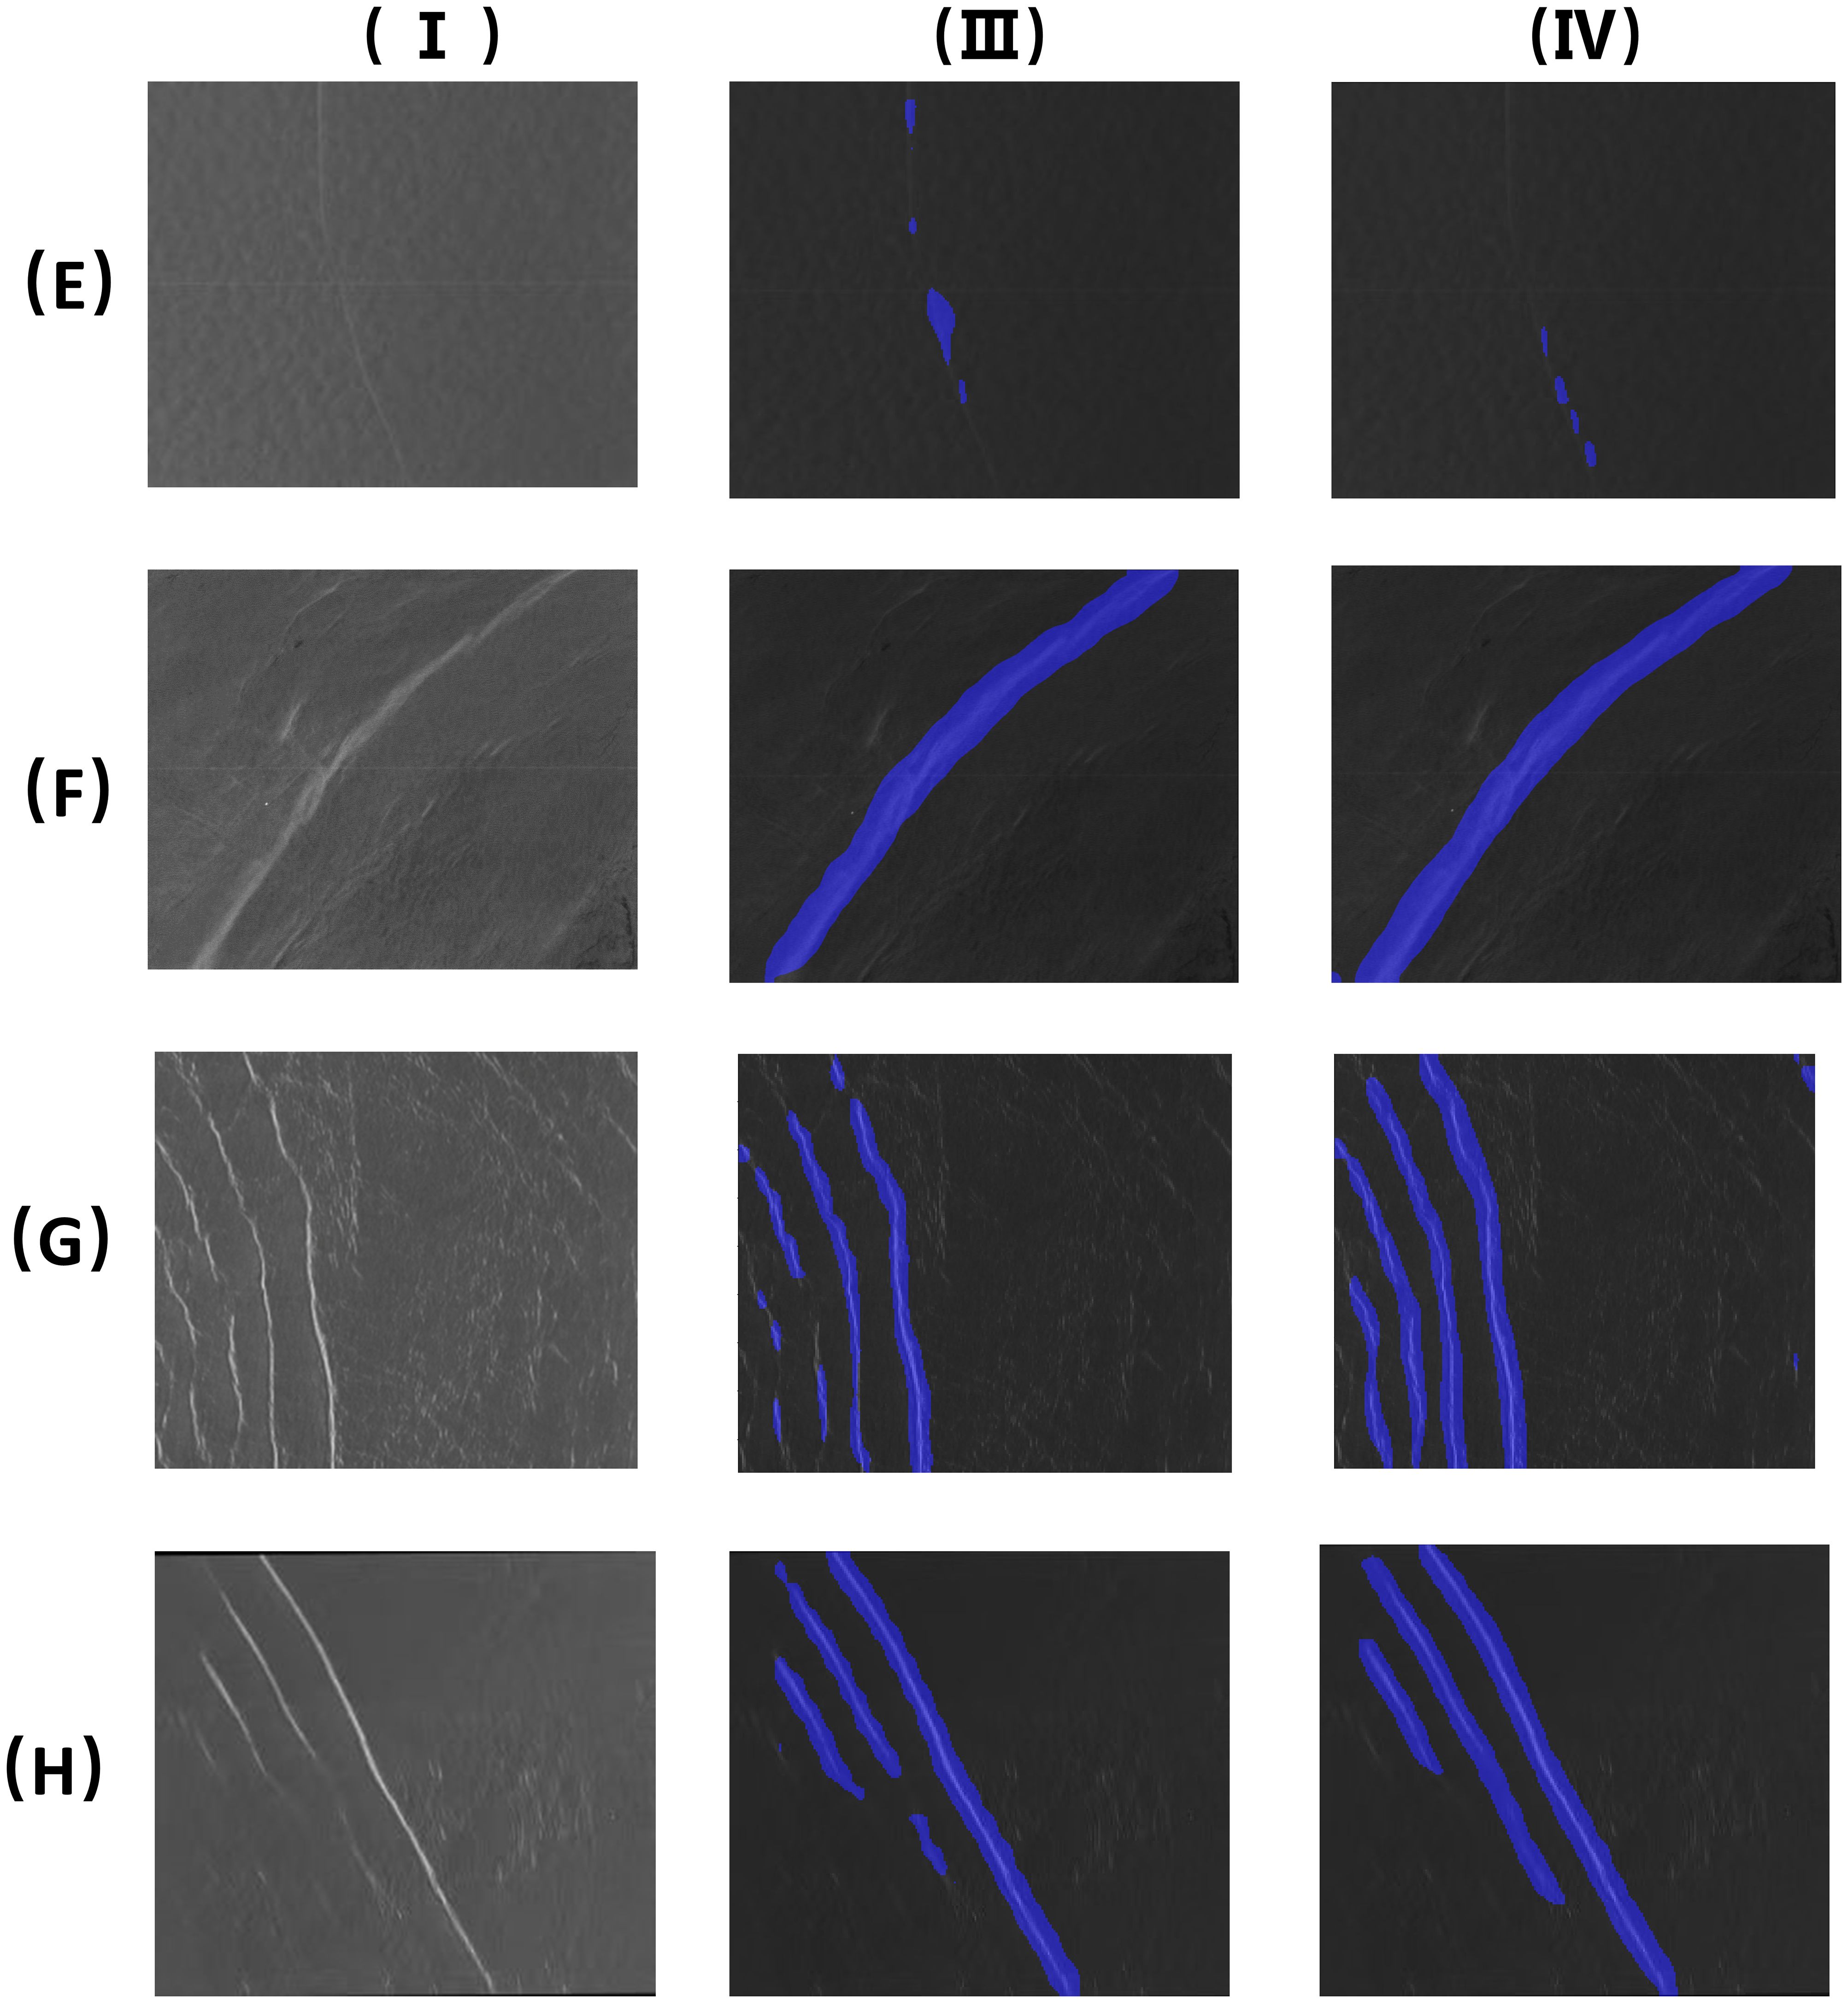
Figure 8. Oceanic internal wave stripes segmentation of a large area (the four images (E–H) are the images of large area ocean internal waves. I. Original images; III. Mit-B1 segmentation results; IV. Mit-B5 segmentation results).
It can be seen from the segmentation of oceanic internal wave stripes in small areas that SegFormer had high segmentation accuracy. Here, MiT-B1 and MiT-B5 were selected for the comparative experiments. Compared with the four sets of images, it can be observed that the use of MiT-B1 to segment the stripes resulted in a better segmentation effect for the stripes on the right side, while some subtle stripes on the left side cannot be accurately segmented. However, when MiT-B5 was used to segment the stripes, although the segmentation effect for the stripes on the right side was better, the segmentation accuracy was lower than that when using MiT-B1. Therefore, the segmentation effect using MiT-B1 was better than that of MiT-B5 when oceanic internal wave stripes of a large area are segmented. Moreover, for SAR images with a large area, the influence of image quality and the error caused by the use of the naked eye, which cannot accurately distinguish the fragmented internal wave stripes, can lead to the oceanic internal waves being identified inaccurately. Although some errors were encountered when using the method proposed in this study, these were acceptable. Suppose a more powerful computer is used to train the SAR images on a large scale. In this case, the segmentation accuracy will be greatly improved, which will be more beneficial to obtaining geographical information about oceanic internal waves.
4 Discussion
The development of deep learning has brought with it many opportunities for marine internal wave recognition in SAR images. Deep learning can extract SAR marine internal wave features based on manual labeling training of the dataset. For example, Yue et al. (2023) proposed a fast coastline detection algorithm for SAR images based on the seed point growth idea. Ma et al. (2023) proposed a two-stage segmentation algorithm of oceanic internal wave features for SAR images. The algorithm includes the classification stage of oceanic internal waves based on the fusion of bureau and decision and the stripe segmentation stage based on pixel attention U-Net. The algorithm can effectively extract the performance of oceanic internal wave signs from SAR images. Divya et al. (2020) preliminarily proposed an automatic internal wave detection system based on a particle swarm optimization algorithm, which combined image processing with machine learning to create an automatic internal wave detection method. Kang et al. (2008) used a two-dimensional empirical mode decomposition (2D-EMD) algorithm to identify oceanic internal waves in SAR images. Bao et al. (2019) used faster regions with convolutional neural network (Faster R-CNN) to detect oceanic internal waves in SAR images; however, the obtained results can only show approximate regions of oceanic internal waves. Zheng et al. (2021) proposed that the SETR model uses ViT as the encoder and multiple CNNs as the decoder. Although the SETR performs well, it still has disadvantages: 1) ViT produces single-scale feature maps as an output, and 2) there are too many ViT parameters, resulting in much computation.
The proposed model based on the effectiveness of SegFormer in segmenting oceanic internal wave stripes was evaluated. For the stripe segmentation of oceanic internal waves of a small scale, SegFormer can obtain the accurate locations and the approximate shape of the oceanic internal waves in SAR images, while for the stripe segmentation of oceanic internal waves of a large scale, SegFormer can segment the apparent stripes of oceanic internal waves, but cannot identify the subtle internal wave stripes. As can be seen in Figures 9 (I III), (I IV), 10 (L III), (L IV), the SegFormer model still has room for improvement with regard to the segmentation of oceanic internal wave stripes in large areas. In contrast, the segmentation effect for oceanic internal wave stripes in small areas was better. The training dataset in this paper comprised small-scale data. For the training of a large-scale training set, the computer performance needs to be improved, which is one of the directions for future research.
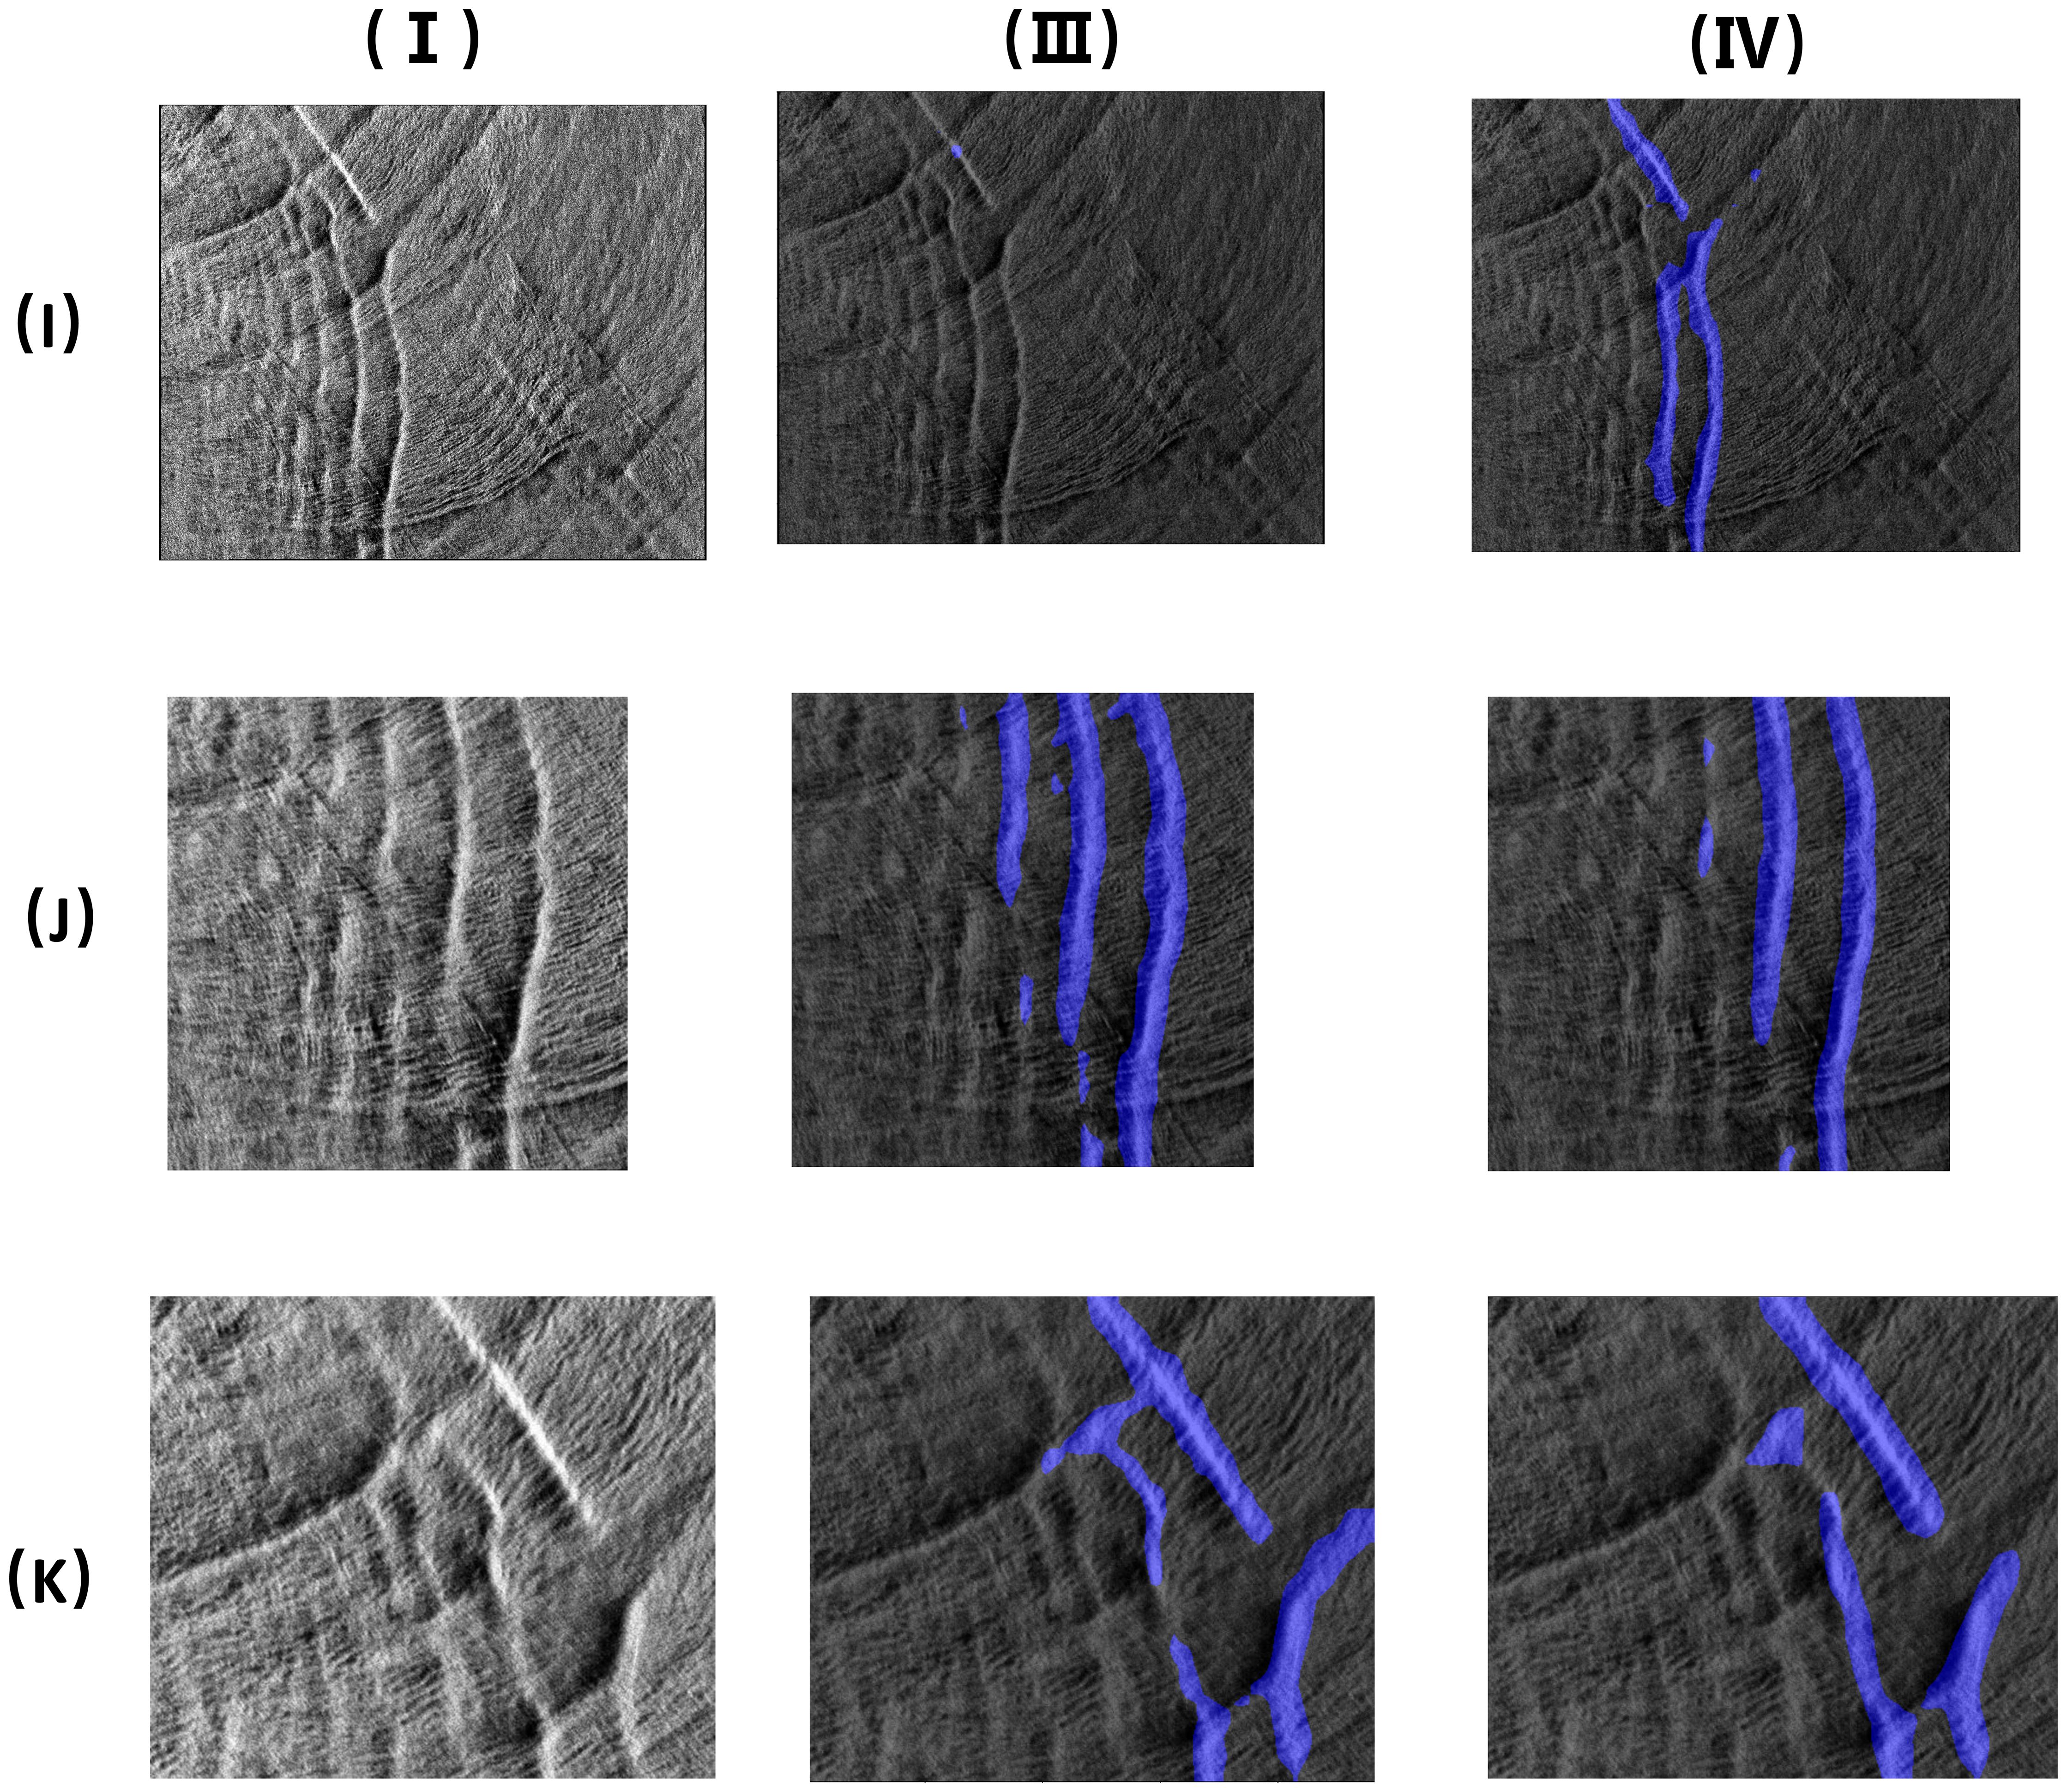
Figure 9. Oceanic internal wave stripes segmentation (the image (I) is a large area ocean internal waves; the two images (J, K) are the images of small area ocean internal waves. I. Original images; III. Mit-B1 segmentation results; IV. Mit-B5 segmentation results).
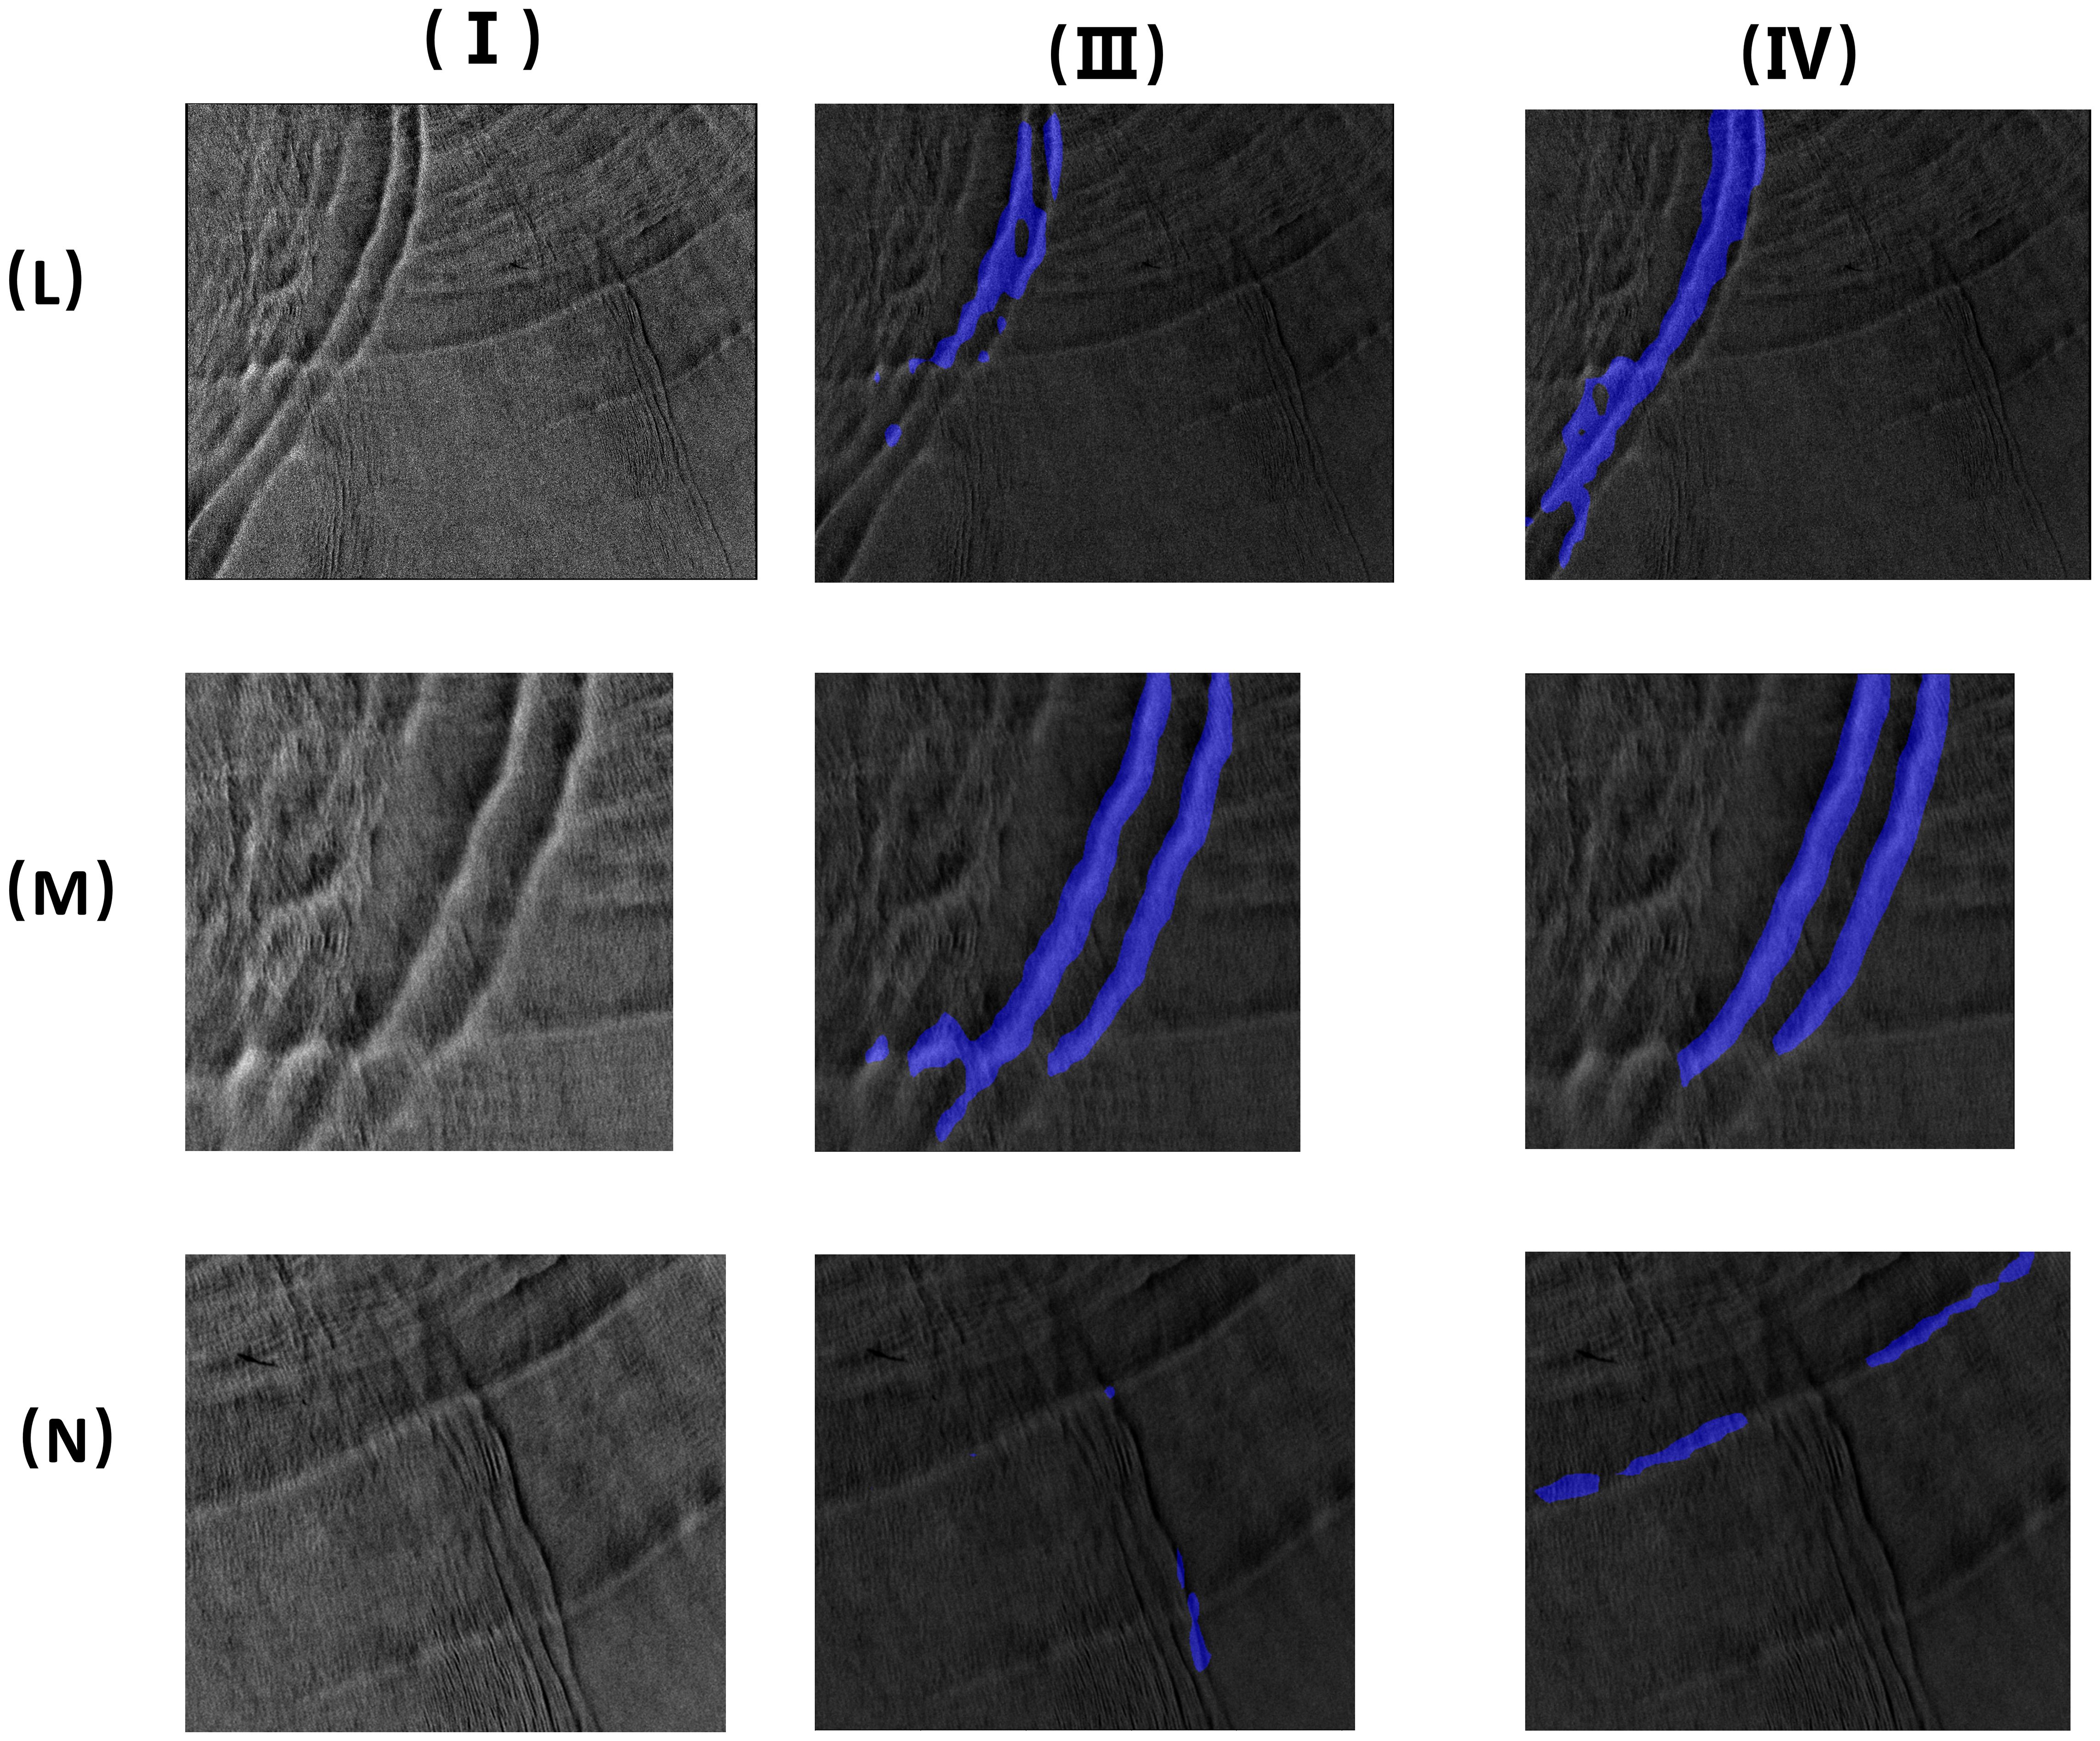
Figure 10. Oceanic internal wave stripes segmentation (the image (L) is a large area ocean internal waves; the two images (M, N) are the images of small area ocean internal waves. I. Original images; III. Mit-B1 segmentation results; IV. Mit-B5 segmentation results).
Compared with the U-Net framework, SegFormer has the following advantages:
1. It uses the lightweight MiT model, which has the advantage of high computational efficiency, particularly for large-scale datasets.
2. The SegFormer encoder introduces a hierarchical transformer structure, which can thus effectively utilize global information, and the segmented stripe results are completed without breaking. This optimization strategy dramatically improves the segmentation accuracy and robustness of the model.
3. SegFormer has a series of encoders, which means that the appropriate model can be selected to predict datasets of different scales. This type of diversified strategy for the selection of a model indicates that SegFormer has excellent potential in the stripe segmentation of oceanic internal waves.
In summary, the SegFormer model exhibits numerous benefits and holds great potential for the stripe segmentation of oceanic internal waves. Thus, it is expected to have wide-ranging applications in future research related to this field.
5 Conclusion
In this study, we proposed an oceanic internal wave stripe segmentation algorithm based on SegFormer and generated two different oceanic internal wave datasets. For the stripe segmentation of oceanic internal waves in a small area, if the amount of data is large, the MiT-B5 model, which is the more powerful model, is recommended for prediction. If the amount of data is small, the MiT-B1 model, which is lightweight, is then recommended for prediction to utilize the data resources more efficiently and obtain better prediction results. However, for the stripe segmentation of oceanic internal waves in a large area, the effect of using the MiT-B1 is significantly better than that of MiT-B5. In summary, a suitable model should be selected based on the actual scenario to take advantage of SegFormer for the stripe segmentation of oceanic internal waves to the maximum extent. As this method can obtain the specific position information of each oceanic internal wave in the image, it is beneficial for a more in-depth study of the oceanic internal waves in SAR images. With the further development of remote sensing imaging technology, the segmentation effect will be even better.
Data availability statement
Publicly available datasets were analyzed in this study. This data can be found here: Envisat (Environmental Satellite), Sentinel-1 (Sentinel-1), ERS-1 (The first European Remote Sensing Satellite) and ERS-2 (The SAR image data of the second European Remote Sensing Satellite and ALOS (Advanced Land Observing Satellite).
Author contributions
HZ: Conceptualization, Formal analysis, Funding acquisition, Resources, Supervision, Writing – review & editing. J-YS: Data curation, Validation, Writing – review & editing. K-TQ: Validation, Investigation, Writing – review & editing. Y-GZ: Conceptualization, Data curation, Methodology, Project administration, Software, Visualization, Writing – original draft, Writing – review & editing. J-JL: Validation, Writing – review & editing. YZ: Validation, Writing – review & editing.
Funding
The author(s) declare financial support was received for the research, authorship, and/or publication of this article. This research was funded by the National Natural Science Foundation of China (NSFC) (grant nos. 51679132, 52201321) and the Science and Technology Commission of Shanghai Municipality (grant nos. 21ZR1427000, 17040501600).
Acknowledgments
The authors are grateful for the websites of Envisat, Sentinel, and ASF used to collect SAR images of the world and the support of SNAP, QGIS, OpenCV, Python, and Matlab.
Conflict of interest
Author K-TQ was employed by the company Shanghai Communications Construction Contracting Co, Ltd.
The remaining authors declare that the research was conducted without any commercial or financial relationships that could be construed as a potential conflict of interest.
Publisher’s note
All claims expressed in this article are solely those of the authors and do not necessarily represent those of their affiliated organizations, or those of the publisher, the editors and the reviewers. Any product that may be evaluated in this article, or claim that may be made by its manufacturer, is not guaranteed or endorsed by the publisher.
References
Bao S. D., Meng J. M., Sun L. N., Liu Y. X. (2019). Detection of ocean internal waves based on Faster R-CNN in SAR images. J. Oceanology Limnology 38, 55–63. doi: 10.1007/s00343-019-9028-6
Cao C., Bao L., Gao G., Liu G., Zhang X. (2024). A novel method for ocean wave spectra retrieval using deep learning from sentinel-1 wave mode data. J. Geoscience Remote Sensing. 62, 1–16. doi: 10.1109/TGRS.2024.3369080
Divya C., Vasavi S., Sarma A. S. (2020). “Ocean internal wave detection from SAR images using particle swarm optimization”. in C. 2020 Third International Conference on Advances in Electronics, Computers and Communications (ICAECC), Bengaluru, India. 2020, 1–6. doi: 10.1109/ICAECC50550.2020.9339511
Dosovitskiy A., Beyer L., Kolesnikov A., Weissenborn D., Zhai X., Unterthiner T., et al. (2020). An image is worth 16x16 words: transformers for image recognition at scale. ArXiv abs/2010.11929.
Gao G., Bai Q., Zhang C., Zhang L., Yao L. (2023c). Dualistic cascade convolutional neural network dedicated to fully PolSAR image ship detection. J. Photogrammetry and Remote Sensing. 202, 663–681. doi: 10.1016/j.isprsjprs.2023.07.006
Gao G., Chen Y., Feng Z., Zhang C., Duan D., Li H., et al. (2024b). R-LRBPNet: A lightweight SAR image oriented ship detection and classification method. J. Remote Sensing. 16, 1533. doi: 10.3390/rs16091533
Gao G., Dai Y., Zhang X., Duan D., Guo F. (2023e). ADCG: A cross-modality domain transfer learning method for synthetic aperture radar in ship automatic target recognition. J. Geoscience Remote Sensing. 61, 1–14. doi: 10.1109/TGRS.2023.3313204
Gao G., Yao B., Li Z., Duan D., Zhang X. (2024a). Forecasting of sea surface temperature in eastern tropical pacific by a hybrid multiscale spatial–temporal model combining error correction map. J. Geoscience Remote Sensing. 62, 1–22. doi: 10.1109/TGRS.2024.3353288
Gao G., Yao L., Li W., Zhang L., Zhang M. (2023b). Onboard information fusion for multisatellite collaborative observation: summary, challenges, and perspectives. J. Geoscience Remote Sensing Magazine. 11, 40–59. doi: 10.1109/MGRS.2023.3274301
Gao G., Zhang C., Zhang L., Duan D. (2023a). Scattering characteristic-aware fully polarized SAR ship detection network based on a four-component decomposition model. J. Geoscience Remote Sensing. 61, 1–22. doi: 10.1109/TGRS.2023.3336300
Gao G., Zhou P., Yao L., Liu J., Zhang C., Duan D. (2023d). A bi-Prototype BDC metric network with lightweight adaptive task attention for few-shot fine-grained ship classification in remote sensing images. J. Geoscience Remote Sensing. 61, 1–16. doi: 10.1109/TGRS.2023.3321533
Hinton G. E., Osindero S., Teh Y. W. (2006). A fast learning algorithm for deep belief nets. Neural Comput. 18, 1527–1554. doi: 10.1162/neco.2006.18.7.1527
Islam M. A., Jia S., Bruce N. D. (2020). How much position information do convolutional neural networks encode? arXiv preprint arXiv:2001.08248.
Kang J., Zhang J., Song P., Meng J. (2008). The application of two-dimensional EMD to extracting internal waves in SAR images. C. Computer Science Software Engineering. 12–14.
Lavrova O. Y., Mityagina M., Serebryany A., Sabinin K., Kalashnikova N., Krayushkin E., et al. (2014). Internal waves in the Black Sea: satellite observations and in-situ measurements. SPIE Remote Sensing: SPIE. 9240.
Li X., Liu B., Zheng G., Ren Y., Zhang S., Liu Y., et al. (2020). Deep-learning-based information mining from ocean remote-sensing imagery. Natl. Sci. Rev. 7, 1584–1605. doi: 10.1093/nsr/nwaa047
Liu Z., Lin Y. T., Cao Y., Hu H., Wei Y. X., Zhang Z., et al. (2021). Swin transformer: hierarchical vision transformer using shifted windows. C. 2021 IEEE/CVF International Conference on Computer Vision (ICCV). 9992–10002.
Ma Y., Meng J., Sun L., Ren P. (2023). Oceanic internal wave signature extraction in the sulu sea by a pixel attention U-Net: PAU-Net. J. IEEE Geoscience and Remote Sensing Letters. 20, 1–5. doi: 10.1109/LGRS.2022.3230086
Moreira A., Prats-Iraola P., Younis M., Krieger G., Hajnsek I., Papathanassiou K. P. (2013). A tutorial on synthetic aperture radar. J. IEEE Geoscience and Remote Sensing Magazine. 1, 6–43. doi: 10.1109/mgrs.2013.2248301
Rodenas J. A., Garello R. (1997). Wavelet analysis in SAR ocean image profiles for internal wave detection and wavelength estimation. J. Geoscience Remote Sensing. 35 (4), 933–945. doi: 10.1109/36.602535
Ródenas J. A., Garello R. (1998). Internal wave detection and location in SAR images using wavelet transform. J. Geoscience Remote Sensing. 36, 1494–1507. doi: 10.1109/36.718853
Russell B. C., Torralba A., Murphy K. P., Freeman W. T. (2007). LabelMe: A database and web-based tool for image annotation. J. Computer Vision 77, 157–173. doi: 10.1007/s11263-007-0090-8
Wang W., Xie E., Li X., Fan D. P., Song K., Liang D., et al. (2021). “Pyramid vision transformer: A versatile backbone for dense prediction without convolutions”. In C. 2021 IEEE/CVF International Conference on Computer Vision (ICCV). (Montreal, QC, Canada), 548–558. doi: 10.1109/ICCV48922.2021.00061
Xie E. Z., Wang W. H., Yu Z. D., Anandkumar A., Álvarez J. M., Luo P. (2021). SegFormer: simple and efficient design for semantic segmentation with transformers. J. CoRR.
Yue G., Wei X., Liu X. (2023). “Research on coastline detection method of SAR image based on seed point growth,” in C. 2023 2nd International Conference on 3D Immersion, Interaction and Multi-sensory Experiences (ICDIIME), (Madrid, Spain). 2023, 444–447. doi: 10.1109/ICDIIME59043.2023.00091
Zhang C., Zhang X., Gao G., Lang H., Liu G., Cao C., et al. (2024c). Development and Application of Ship Detection and Classification Datasets: A review. J. Geoscience Remote Sensing Magazine. 12, 12–45. doi: 10.1109/MGRS.2024.3450681
Zhang X., Gao G., Chen S.-W. (2024b). Polarimetric autocorrelation matrix: A new tool for joint characterizing of target polarization and doppler scattering mechanism. J. Geoscience Remote Sensing. 62, 1–22. doi: 10.1109/TGRS.2024.3398632
Zhang C., Gao G., Liu J., Duan D. (2024a). Oriented ship detection based on soft thresholding and context information in SAR images of complex scenes. J. Geoscience Remote Sensing. 62, 1–15. doi: 10.1109/TGRS.2023.3340891
Zhang H., Meng J. M., Sun L. N., Zhang X., Shu S. J. (2020). Performance analysis of internal solitary wave detection and identification based on compact polarimetric SAR. J. IEEE Access 8, 172839–172847. doi: 10.1109/access.2020.3025946
Zheng S., Lu J., Zhao H., Zhu X., Luo Z., Wang Y., et al. (2021a). “Rethinking semantic segmentation from a sequence-to-sequence perspective with transformers,” in C. 2021 IEEE/CVF Conference on Computer Vision and Pattern Recognition (CVPR), (Nashville, TN, USA). 93, 6877–6886. doi: 10.1109/CVPR46437.2021.00681
Zheng Y. G., Zhang H. S., Qi K. T., Ding L. Y. (2021b). Stripe segmentation of oceanic internal waves in SAR images based on SegNet. J. Geocarto International 37, 8567–8578. doi: 10.1080/10106049.2021.2002430
Keywords: oceanic internal waves, SAR, deep learning, stripe segmentations, SegFormer
Citation: Zhang H-S, Sun J-Y, Qi K-T, Zheng Y-G, Lu J-J and Zhang Y (2025) Stripe segmentation of oceanic internal waves in SAR images based on SegFormer. Front. Mar. Sci. 11:1456294. doi: 10.3389/fmars.2024.1456294
Received: 28 June 2024; Accepted: 10 December 2024;
Published: 17 January 2025.
Edited by:
Xi Zhang, Ministry of Natural Resources, ChinaReviewed by:
Gui Gao, Southwest Jiaotong University, ChinaJingsong Yang, Ministry of Natural Resources, China
Copyright © 2025 Zhang, Sun, Qi, Zheng, Lu and Zhang. This is an open-access article distributed under the terms of the Creative Commons Attribution License (CC BY). The use, distribution or reproduction in other forums is permitted, provided the original author(s) and the copyright owner(s) are credited and that the original publication in this journal is cited, in accordance with accepted academic practice. No use, distribution or reproduction is permitted which does not comply with these terms.
*Correspondence: Hong-Sheng Zhang, aHN6aGFuZ0BzaG10dS5lZHUuY24=; Ying-Gang Zheng, aW5nb3Byb0BxcS5jb20=
 Hong-Sheng Zhang
 Ji-Yu Sun
 Kai-Tuo Qi2
 Ying-Gang Zheng