
94% of researchers rate our articles as excellent or good
Learn more about the work of our research integrity team to safeguard the quality of each article we publish.
Find out more
ORIGINAL RESEARCH article
Front. Mar. Sci., 17 June 2024
Sec. Ocean Observation
Volume 11 - 2024 | https://doi.org/10.3389/fmars.2024.1416590
This article is part of the Research TopicBest Practices in Ocean ObservingView all 85 articles
 José Antonio Moreira Lima1*
 William Soares Filho2*
 Fabio C. Xavier2
 Thiago Pires de Paula3
 Angela Spengler3
 Fernando Gonçalves de Almeida3Diogo Peregrino Correa Pereira3
 Valéria Souza Rego3
 Cátia Galotta2
 Carlos Corrêa Junior2Alexandre Bazyl2
This paper describes the Santos Basin Underwater Soundscape Monitoring Project (PMPAS-BS), a Brazilian ocean soundscape monitoring initiative. The main objective of the project is to quantify and assess hydroacoustic noise of anthropogenic origin in a large sedimentary basin extending from 23° S to 28° S on the southeastern Brazilian continental margin of the South Atlantic Ocean. Noise associated with oil and gas (O&G) exploration and production activities is the primary target, but this oceanic region also has busy shipping lanes for commercial, military, and fishing vessels. The two main hubs of Brazil’s export and import of goods by sea are located in this region: Santos and Rio de Janeiro ports. The project has three measurement components: mobile monitoring based on gliders and drifting acoustic profilers, fixed shallow-water monitoring based on acoustic measurements at coastal stations near shipping lanes associated with exploration and production activities in the Santos Basin, and fixed oceanic monitoring based on deep-water mooring lines equipped with passive autonomous acoustic recorders near production units, shipping lanes, and areas with lower intensity of O&G activities (pristine or reference sites). Numerical modeling of anthropogenic underwater acoustic noise has also been included as a fourth project component. The PMPAS-BS covers an area of more than 251,000 km2 and uses several instruments with different methods and sensors for acoustic measurements. Its results provide current sound levels over a very large region of the western South Atlantic, both in areas more and less affected by anthropogenic activities.
The oceans play a central role in supporting life on our planet. They regulate climate, provide food, energy, and a wealth of resources (NOAA, 2023). They cover approximately 70% of the Earth’s surface and serve as one of the primary global transportation routes (Mooney et al., 2020). However, factors such as climate change, pollution, overfishing, and other impactful human activities have significantly threatened this environment (Claudet et al., 2020). In this context, environmental monitoring is emerging as an essential and innovative tool for understanding, conserving, and protecting the oceans (Kaiser et al., 2019; Glaviano et al., 2022). Today, several studies have shown that passive acoustic monitoring of marine ecosystems is an innovative and promising approach to assess the health of the marine environment (Merchant et al., 2015; Miksis-olds and Martin, 2018; Howe et al., 2019). In addition to being a non-invasive tool, acoustic monitoring has an advantage over other methods, as it allows for quasi-continuous monitoring at large scales (spatial, temporal, and spectral) (Mooney et al., 2020). It facilitates analyses of the interplay between the primary components of an underwater soundscape: biophony (sounds of biological origin, e.g. marine mammals, etc.), geophony (sounds of environmental origin, e.g. waves, wind, rain, etc.), and anthropophony (sounds of human origin, e.g. ships, platforms, etc.) (Pijanowski et al., 2011).
Underwater soundscape monitoring can serve several purposes. For example, it can be used to detect, identify, and monitor the presence, behavior, and migration of marine species such as whales, dolphins, and fish (Mooney et al., 2020). It can also be used to assess and quantify underwater noise pollution from human activities such as construction, maritime traffic, and seismic exploration to mitigate the adverse effects of anthropogenic noise on marine life and to study its effects on behavior and communication between species (Faulkner et al., 2018; Haver et al., 2019). In addition, it can be used to detect, characterize, and monitor environmental conditions, including underwater events such as earthquakes, volcanic eruptions, and submarine landslides (Erbe et al., 2016; Schwardt et al., 2022), physical oceanographic features (Calado et al., 2018; Minello et al., 2021), and potential effects related to climate change (Affatati et al., 2022; Possenti et al., 2023).
Passive acoustic monitoring (PAM) in the ocean can be conducted using fixed or mobile sensors, each with its own characteristics (Robinson et al., 2014; Luczkovich and Sprague, 2022). Fixed sensors, such as hydrophones placed in coastal regions, buoys, or oceanic mooring lines, are primarily designed to collect acoustic data continuously at a specific location over time. This provides a long-term perspective on acoustic activity in the monitored area, which is advantageous for long-term studies, such as tracking seasonal and weather-related patterns (Robinson et al., 2014). On the other hand, mobile sensors, including gliders, acoustic profilers, autonomous underwater vehicles (AUVs), or vessels equipped with hydrophones, can collect acoustic data at different locations and depths. These mobile recorders can not only monitor, detect, and classify sounds from different sources, but also track and locate them (Jiang et al., 2019).
In this context, the combination of fixed and mobile methods can provide a more comprehensive understanding of the underwater soundscape. However, soundscape monitoring should be conducted in accordance with best practices and standards to ensure its efficient use. Several institutions and countries have developed recommendations and guidelines for acoustic monitoring with a focus on mitigating the damage caused by anthropogenic sound (Colbert, 2020; Lewandowski and Staaterman, 2020; Thomsen et al., 2021; Van Parijs et al., 2021; Breeze et al., 2022). In particular, the United States of America (USA) and the European Union (EU) have major research efforts in this area. In the USA, the National Oceanic and Atmospheric Administration (NOAA) has an underwater acoustics program with several soundscape monitoring projects ranging from marine mammal diversity modeling to continuous passive acoustic monitoring and underwater noise control (Haver et al., 2018). NOAA has also published an Ocean Noise Strategy Roadmap, a document that collects important information on the effects of anthropogenic noise on marine life (Gedamke et al., 2016). In Europe, the European Commission (European Commission, 2010) has established a list of 11 elements (Commission Decision 2010/477/EU) to characterize environmental status. In this publication, two indicators were described for the area of noise and acoustic energy: impulsive low- and mid-frequency sounds and continuous low-frequency sounds. In 2014, guidelines for monitoring underwater noise in European seas were published (Dekeling et al., 2014a, 2014b, 2014c). In addition, the International Maritime Organization (IMO) is developing guidelines for the reduction of underwater noise from commercial shipping (IMO MEPC.1/Circ.833, 2014; IMO MEPC.1/Circ.906, 2023).
In Brazil, underwater soundscape studies have often had site-specific classified military objectives or aimed to characterize the sound or behavior of specific marine species. The studies have a strong contribution from military research institutions, along with a few universities and research institutes. The work of Parente Ribeiro (1982, 1986) is highlighted as one of the most productive in underwater acoustics in Brazilian waters. Since 2015, a comprehensive acoustic program called “Santos Basin Underwater Soundscape Monitoring Project” (PMPAS-BS in Portuguese acronym) has been carried out by the state-owned company Petrobras, in partnership with the Brazilian Navy Research Institute (IPqM in Portuguese acronym). The project was designed at the request of the Brazilian Institute of Environment and Renewable Natural Resources (IBAMA in Portuguese acronym) as an environmental condition for the installation of deepwater offshore O&G production systems, with the main objective of characterizing the underwater soundscape and monitoring noise trends associated with anthropogenic exploration and production (E&P) activities in the Santos Basin.
The PMPAS-BS was designed to complete cycles of approximately four years. This article describes the design and results of the first cycle, which started in November 2015 and ended in December 2021. It presents the equipment and methods used, the results of the acoustic measurement components, the discussion, and the conclusions obtained at the end of the first cycle.
The planning of the PMPAS-BS was carefully pursued between 2014 and 2015, following a literature review of global initiatives for passive acoustic monitoring of the oceanic soundscape. The oil and gas (O&G) industry had already established a baseline for underwater sound assessment (IOGP, 2008). As an example, an acoustic monitoring program in the northeastern Chukchi Sea, Alaska (USA) was identified that aimed to measure baseline ambient noise conditions, characterize sounds generated by O&G exploration, and investigate the spatial and temporal distribution of marine mammals based on acoustic detection of their vocalizations (Delarue et al., 2012, 2013). A particularly useful reference was a document published by the Oslo and Paris Commission (OSPAR Commision, 2009), which provided an overview of the impacts of anthropogenic underwater sound in the marine environment.
The PMPAS-BS was designed using best practices and information on ocean soundscape measurement and modeling obtained from the literature review. For example, the guidelines for monitoring underwater noise in European seas (Dekeling et al., 2014a, 2014b, 2014c) were very useful, as were the best practices for underwater noise measurements provided by the National Physical Laboratory (Robinson et al., 2014). A key challenge for PMPAS-BS was to obtain baseline levels of the ocean soundscape over a large region of the western Atlantic, which would require a very large number of fixed stations and complex logistics if only single point acoustic measurements were used. In addition, as a secondary objective, PMPAS-BS also aimed to provide ancillary data to another environmental project called PMC-BS, which focuses on cetacean monitoring in the Santos Basin (Dalpaz et al., 2021; Pires et al., 2021). The PMPAS-BS was divided into different components to achieve its objectives using distinct equipment and methods. A detailed description of the project design and implementation is provided by (Lima et al., 2022). Figure 1 shows the four components of the project. These components were selected so that data collected from different locations and with different equipment would be complementary and adequate to monitor the contribution of anthropogenic noise from distinct sources and activities (such as production sites, shipping lanes, ports, etc.). The measured data would also be used to validate the results of an acoustic modeling component.
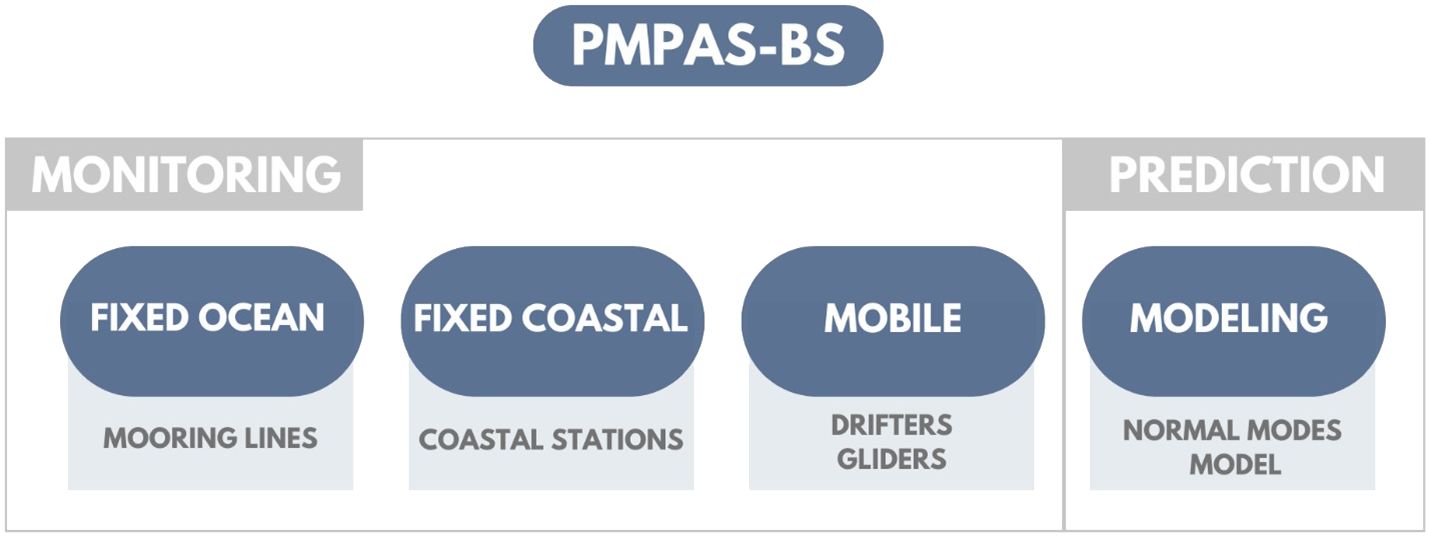
Figure 1 Schematic diagram of the four components of the first cycle of PMPAS-BS.
The Santos Basin is a sedimentary basin located offshore southeastern Brazil between 23° S and 28° S in the western South Atlantic Ocean (Figure 2). It has a concave shape following the orientation of the continental shelf and extends to the 3000-meter isobath, covering an approximate area of 251,000 km2. Most of the deepwater oil and gas blocks are located in water depths greater than 1000 meters. Figure 2 also shows the positions of the instrumented mooring lines FA (FA is a Portuguese acronym for Fundeio Acústico) and coastal acoustic stations OS (OS is a Portuguese acronym for Observatório Submarino) deployed for the project components.
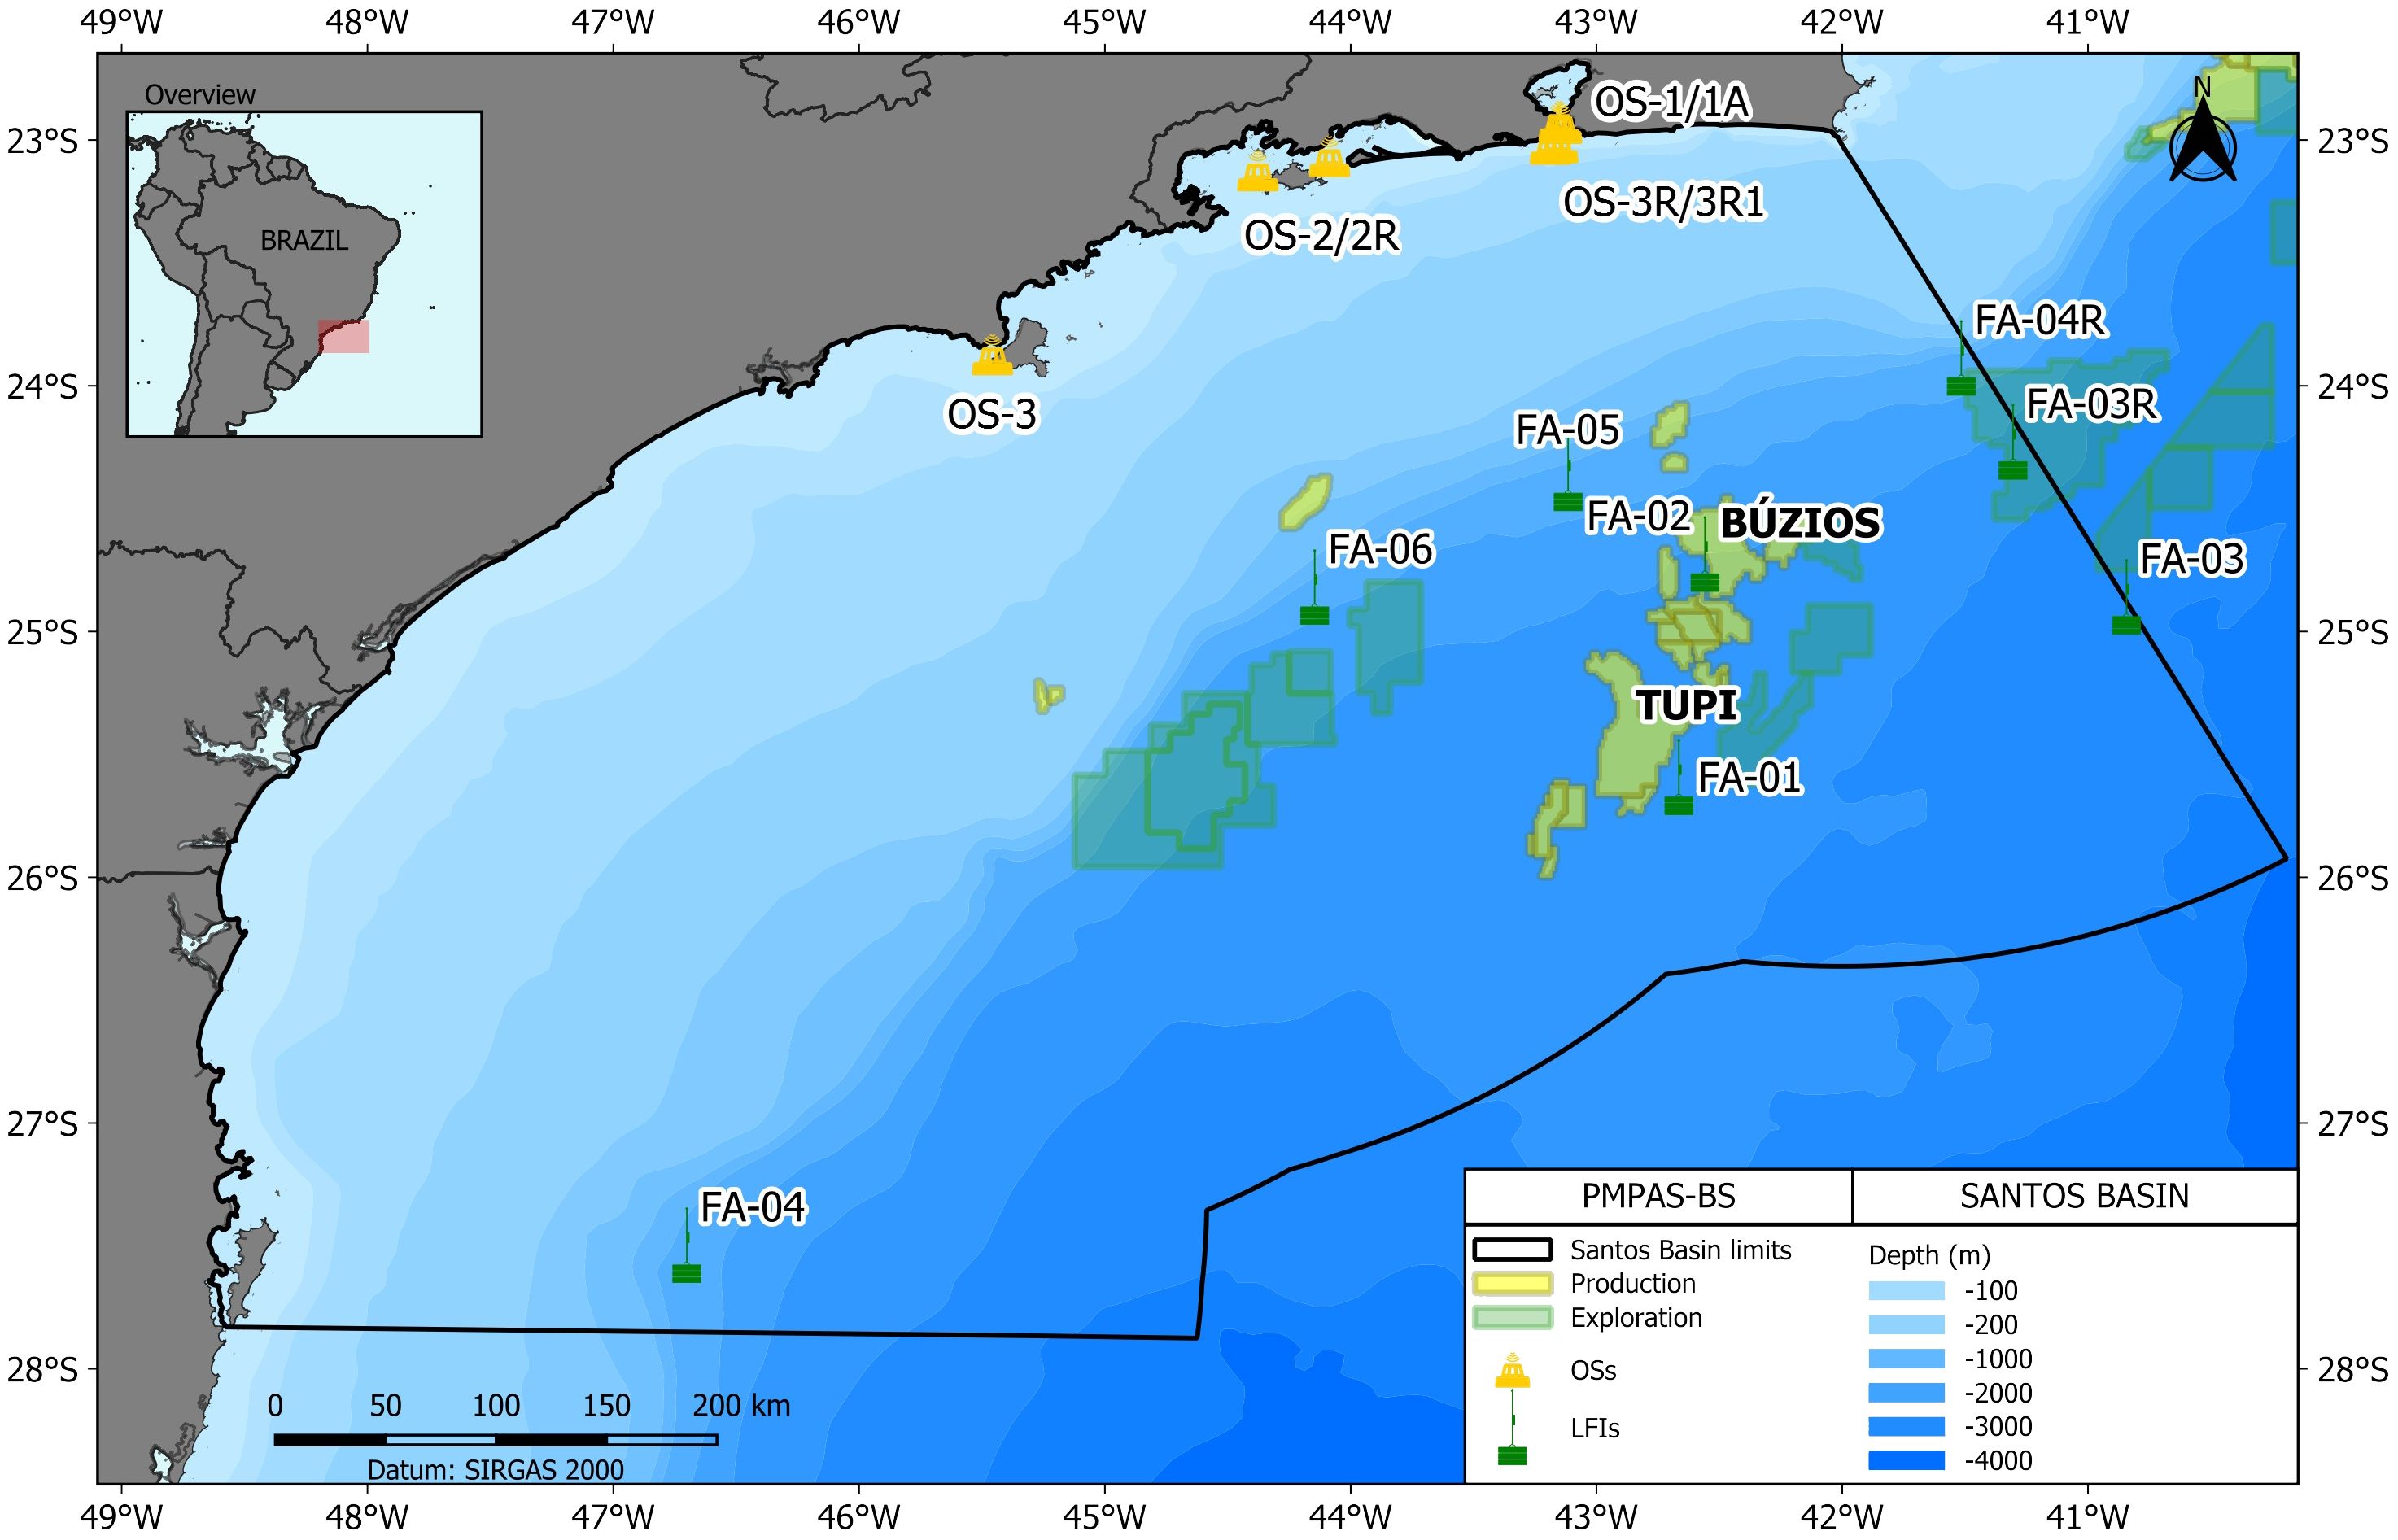
Figure 2 Map of Santos Basin with the positions of PETROBRAS O&G production and exploratory blocks (colored regions), the position of 6 instrumented oceanic mooring lines FAs (green marks) and the 3 coastal underwater observatories OSs (yellow triangles). Some measurement stations were repositioned during the 1st cycle (FA-03 to FA-03R; FA-04 to FA-04R; OS1 to OS1A; OS2 to OS2R; OS-3 to OS-3R then to OS-3R1). The black line delimits the geographical limits of the Santos Basin. Tupi and Buzios are major oil production fields.
The fixed oceanic component was designed to measure the soundscape at specific deep-water sites in the Santos Basin (depths ranging from 1100 m to 2850 m) using acoustic recorders installed on instrumented mooring lines (FA), with the aim of obtaining acoustic measurements at sites with different levels of anthropogenic activity in the basin. The FA is a deep-water mooring line composed of a few sections of nautical cable, with an acoustic release attached to a buoy on its deep section, close to the deadweight on the seabed, and ending with a submerged float, slightly shallower than 50 m below the surface. Acoustic equipment was installed at three different depths (50 m, 200 m, and 950 m) and programmed to acquire 85 seconds of acoustic signal every 10 minutes at a sampling frequency of 64 kHz and 24-bit resolution. The equipment used to record the acoustic signals is the autonomous recorder AMAR-G3™ manufactured by JASCO, using hydrophones with a sensitivity of -165 dB re 1V/μPa. Recording intervals were chosen based on available battery and memory card capacities, so that the mooring lines would have maintenance cruises at six-month intervals. The mooring lines were also equipped with current meters to measure ocean currents to assess unwanted levels of flow noise during acoustic data qualification. Table 1 provides details of the acoustic equipment used for the PMPAS-BS components.
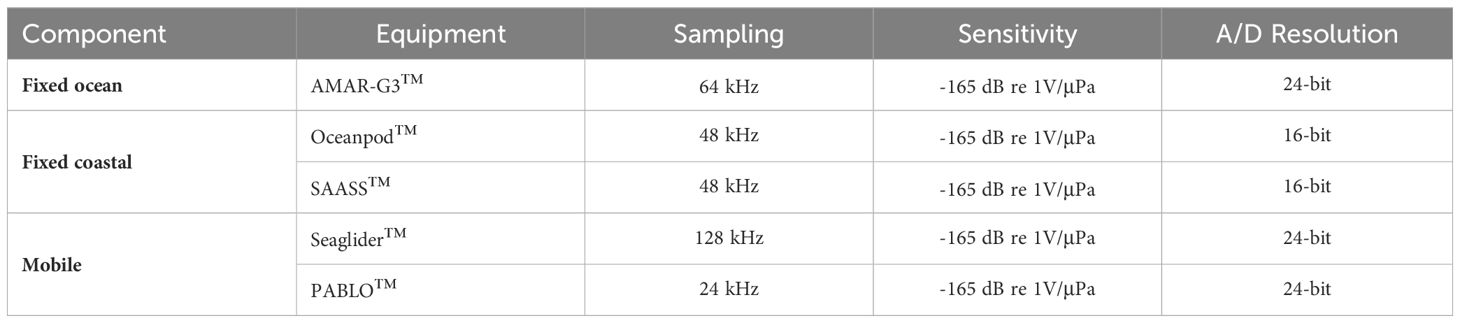
Table 1 Description of measurement equipment used by PMPAS-BS components.
In the first cycle of the PMPAS-BS, the installation of six mooring lines FAs was planned, the positions of which are shown in Figure 2, and their geographic coordinates, depths, operational periods, and locations in relation to O&G activities are shown in Table 2. Mooring FA01 was installed near a site with O&G production (the Tupi field was already fully productive in 2015); mooring FA02 was positioned in a site with developing production (there were no platforms producing O&G nearby), but the installation of facilities was already planned for the Buzios field; moorings FA03 and FA04 were located in areas with no O&G activity, but potentially subject to vessel traffic associated with other human activities, to be used as pristine water baselines; and moorings FA05 and FA06 were located near main shipping lanes used to supply the production facilities. The pristine water moorings were later redeployed to FA03R and FA04R sites in order to assess noise levels at different locations.
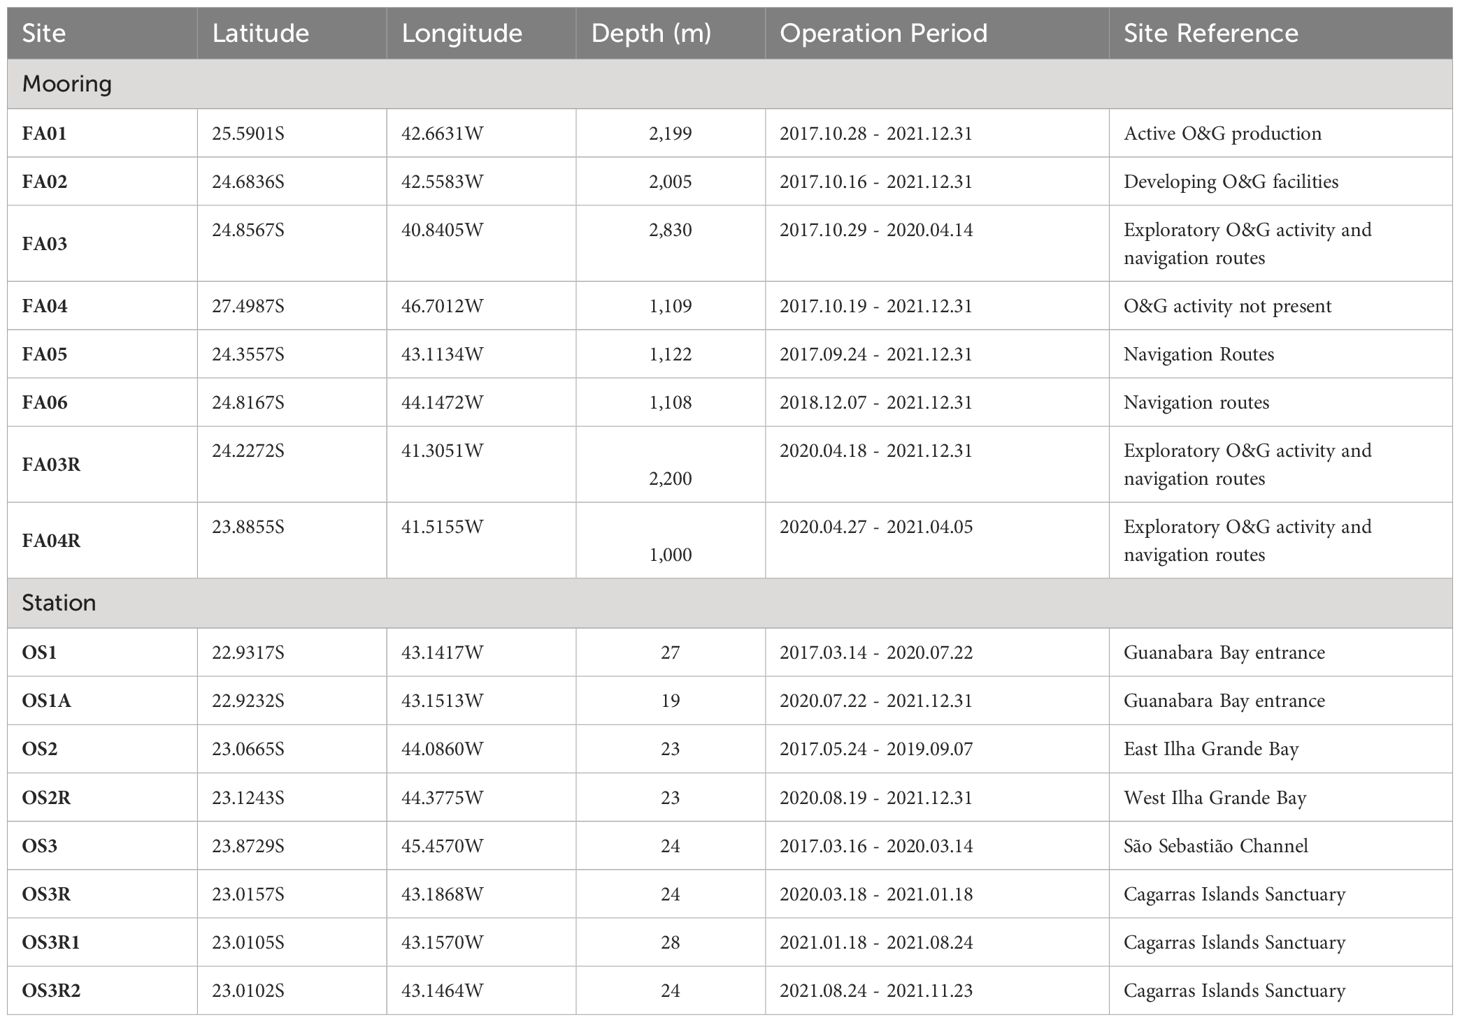
Table 2 Fixed oceanic monitoring mooring lines FAs and coastal observatories OSs with respective geographical coordinates (decimal degrees), water depths, operational time intervals and selected sites characteristics.
An important issue to consider is the vibration of the mooring line induced by high current velocities, causing effects such as vortex induced vibration (VIV), which produces pseudo-noise at lower frequencies not associated with anthropogenic sources (Strasberg and Taylor, 1979). Various measures have been taken to reduce the direct effect of currents on the mooring lines, including the installation of a protective cover on the hydrophone support structure and the insulation of the connectors with rubber tape to reduce vibration.
Deployment and recovery of the mooring lines was performed by specialized vessels with sufficient deck space to handle equipment for multiple lines, A-frames and cranes to handle the deadweight, cables and complete hardware. As the recovery vessel approached the estimated location of the line in the ocean, it emitted signals to contact the acoustic release and free the line from the deadweight. Its top end emerged to the surface due to the buoyancy of floats installed along the mooring line, allowing it to be recovered for maintenance, equipment replacement and data copying.
The fixed coastal monitoring component was designed to measure noise in shallow coastal waters at the entrance to busy ports and terminals supporting O&G facilities in the Santos Basin. Autonomous devices programmed to continuously record underwater acoustic signals were installed at the OS coastal bottom stations (Table 1). These recorders were equipped with hydrophones, preamplifiers, and electronics that received and stored underwater acoustic signals from various sources such as vessels, marine biota, and others. The acoustic recorder was installed on a tripod attached by a cable to the deadweight of the marker buoy. In the initial phase of the project, the acoustic equipment OCEANPOD™, developed and built by the University of São Paulo (USP), Brazil, was used, later replaced by the equipment SAASS™ (Portuguese acronym for Sistema Automatico de Aquisição de Sinais Submarinos), developed and built by IPqM, both working with a sampling frequency of 48 kHz and 16-bit resolution with 100% duty cycle (continuous recording). The instruments used hydrophones with a sensitivity of -165 dB re 1V/μPa. More details on SAASS are provided in (Alves et al., 2018). Later, acoustic transponders were installed to locate the bottom equipment without the use of a surface buoy, which would be exposed to vandalism.
In the first cycle, the installation of three OS was planned. Their positions are shown in the regional map of Figure 2 and in more detail in the maps of Figure 3. Their geographical coordinates, depths, installation periods and reference ports are presented in Table 2. The coastal station OS1 was installed near the main shipping channel of Guanabara Bay, the busiest port serving the offshore platforms. Later, this station was slightly relocated to the OS1A position. The OS2 station was initially installed at the eastern entrance of Ilha Grande Bay, which has an oil terminal that receives crude oil and exports refined products. This station was later moved to position OS2R at the western entrance of the bay. Station OS3 was located at the entrance of the São Sebastião Channel, where another busy oil terminal is located. This station was later moved to positions OS3R, OS3R1 and OS3R2 near the Cagarras Islands, a coastal sanctuary and protected area near the entrance of Guanabara Bay.
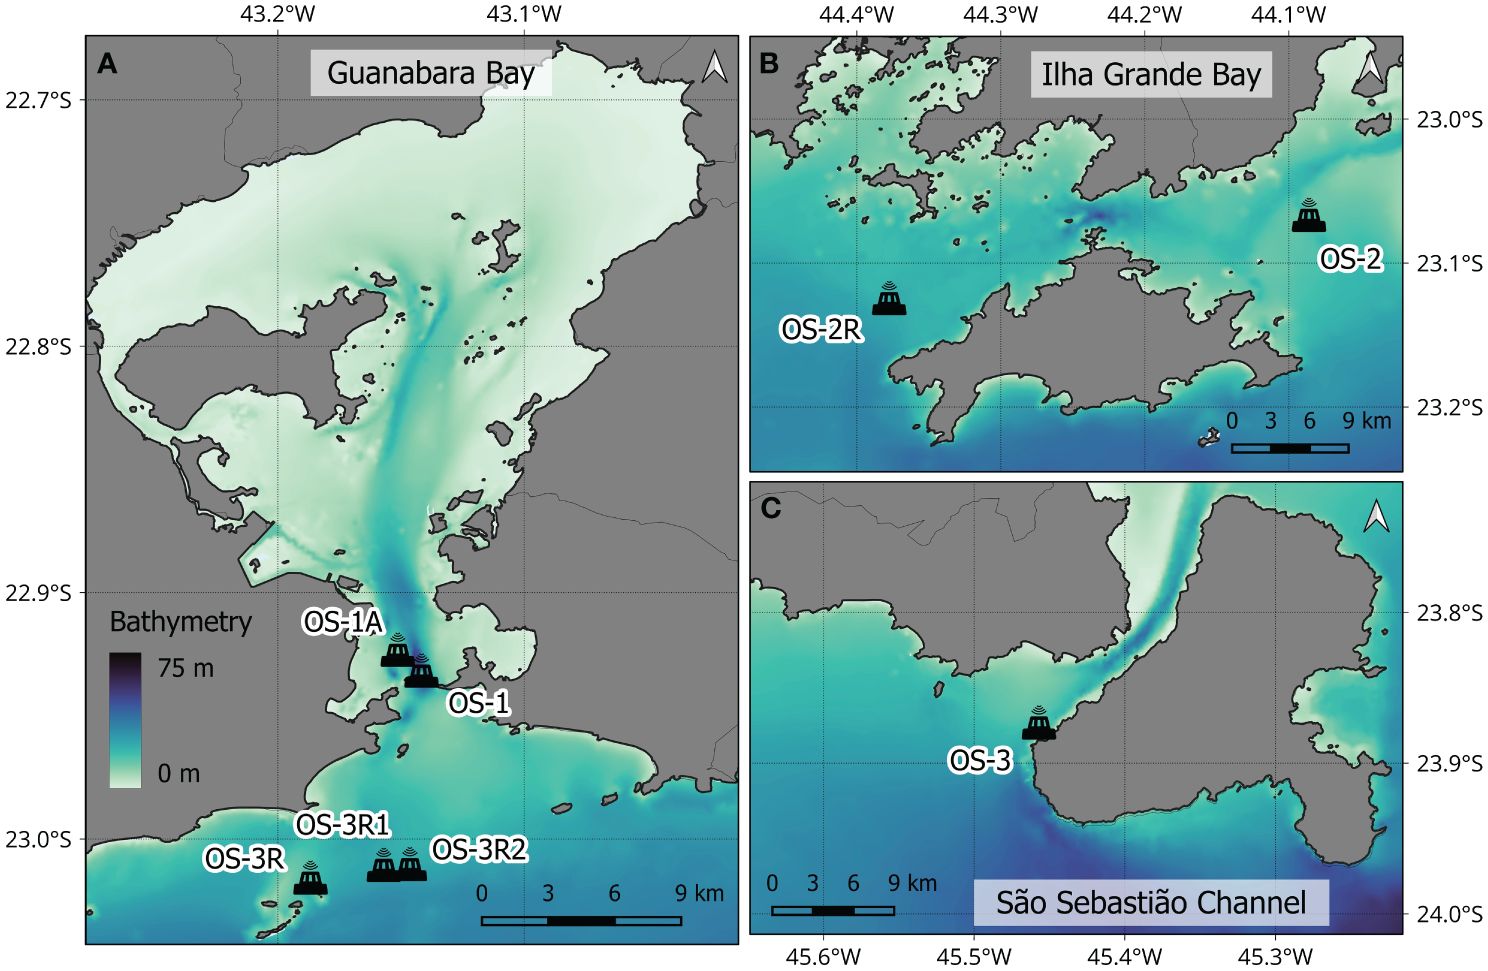
Figure 3 Detailed maps of the coastal OSs positions in Guanabara Bay and surroundings of the Natural Monument Cagarras Archipelago Islands (A), Ilha Grande Bay (B), and São Sebastião Channel (C). The background color scale indicates water depth.
Since the OSs were deployed in shallow water with depths of no more than 30 meters (Table 2), dive-assisted operations were used to install and retrieve the equipment from the bottom-mounted tripods. These maintenance cruises were scheduled at 60-day intervals to recover data from memory cards and replace batteries.
The mobile monitoring component was designed to provide an extensive and comprehensive coverage of the soundscape in the Santos Basin, allowing acoustic measurements with equipment capable of acquiring data in many different regions of the basin, from the surface down to 1000 meters depth (operational limit of available equipment). Two types of autonomous equipment were selected that could move freely once launched into the ocean: gliders, which could be remotely controlled, and autonomous drifting profilers, whose trajectories were determined solely by the action of ocean currents (Table 1).
Gliders are Autonomous Underwater Vehicles (AUVs) that are remotely controlled by satellite when they return to the surface of the ocean, capable of diving to depths of up to 1,000 meters and following routes programmed by the user. The SeaGlider™, developed by Kongsberg, was used in the first cycle of the PMPAS-BS, installed with a passive acoustic monitoring (PAM) system using a hydrophone with a sensitivity of -165 dB re 1V/μPa, a sampling frequency of 128 kHz and 24-bit resolution. The PAM remained on throughout the descent, operating continuously and stopping recording at the end of the descent, and remained off during the ascent of the instrument, as shown in Figure 4 (left panel). It also allowed continuous acquisition of oceanographic data of temperature, conductivity, and depth using a CTD sensor. Upon reaching the surface, the glider transmitted the navigation information of the dive and the CTD data via satellite. Due to satellite restrictions on high volume data traffic, it did not transmit the raw acoustic data, which remained stored in the equipment. When the maintenance ship recovered the glider at the end of its programmed mission (every 30 to 60 days), the raw acoustic data were retrieved. The gliders were preferably launched near E&P blocks to better measure their noise levels, but some trajectories were also planned in areas of low anthropogenic activity to measure the soundscape of different regions. During the quality control of the acoustic data acquired by the gliders, it was found that current noise would affect the acoustic signals if the diving speed was too high (dos Santos et al., 2016). Therefore, it was decided to keep the dive speed lower than 13 cm/s during the descent phase to improve the quality of the measured acoustic data.
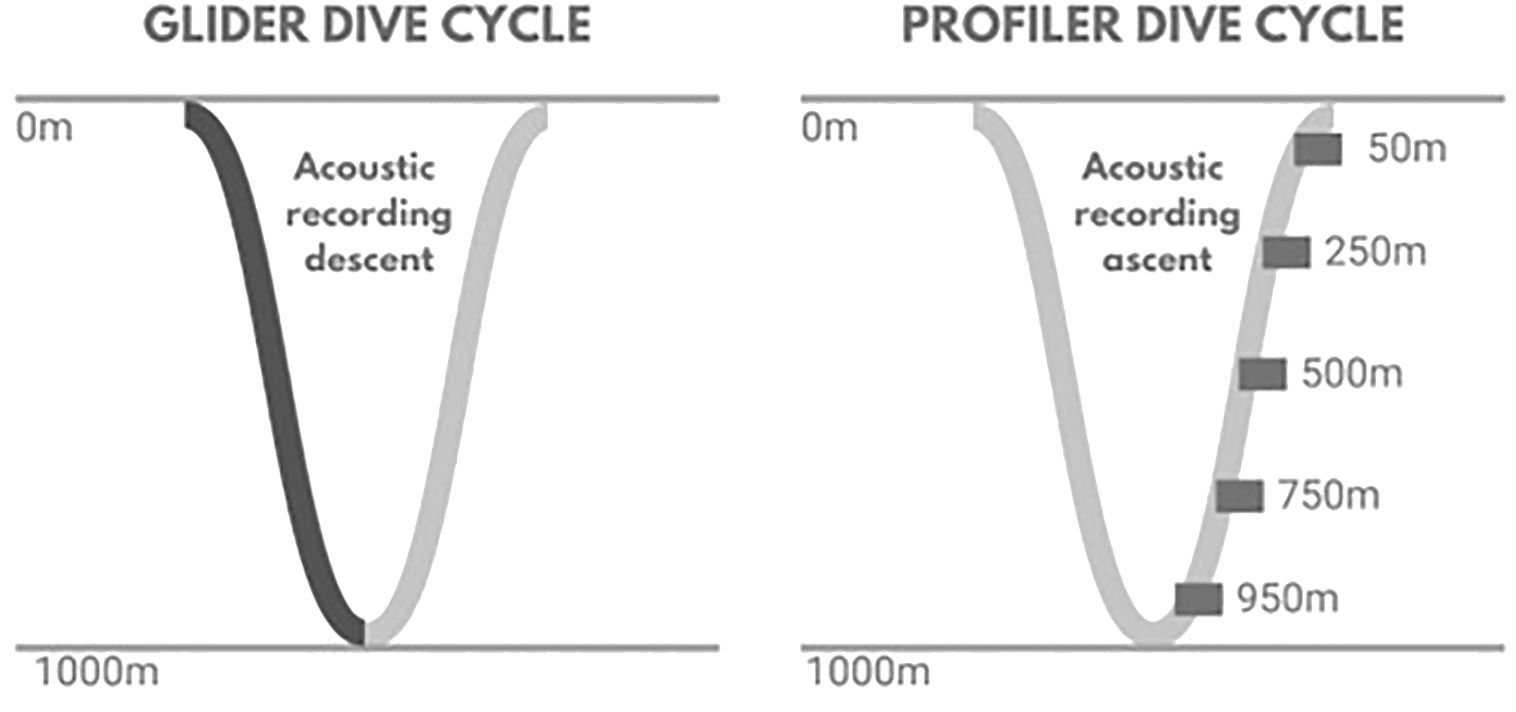
Figure 4 Schematic view of glider dive (left panel) and profiler dive (right panel) at PMPAS-BS. The gliders were programmed to activate the PAM during the descent phase and the profilers acquired acoustic data during the ascent phase.
The acoustic profiling device used was the MetOcean Telematics Profiling Acoustic Buoyant Lagrangian Observing system (PABLO™), a disposable Lagrangian ocean drifter designed to collect acoustic data at discrete depths up to 1,000 meters by controlling its buoyancy and drifting with currents. Its operation consisted of cycles of descent, submerged drift at a parking depth, ascent to perform acoustic measurements at five programmed depths, and transmission of data via Iridium™ satellite communications upon resurfacing. For each acoustic measurement performed at the selected depths (950 m, 750 m, 500 m, 200 m, and 50 m), as shown in Figure 4 (right panel), the profiler acquisition system acquired one minute of data. The equipment itself processed the time series of the acoustic signals and generated the acoustic parameters and spectra that were transmitted by satellite at each emersion, but the recordings of the acoustic signals were not recovered. The PAM system used for the profilers had a sensitivity of -165 dB re 1V/μPa with a sampling frequency of 24 kHz and 24-bit resolution.
The profilers were deployed on selected transects in the Santos Basin on cruises scheduled at three-month intervals. On each cruise, ten acoustic profilers were deployed and drifted by the action of oceanic currents. The oceanic circulation in Santos Basin is dominated by the Brazil Current, which flows southward with its eddies and meanders close to the continental slope (Biló et al., 2014). Thus, most of the starting transects were carried out in the northeastern part of the basin, offshore Cabo Frio and Rio de Janeiro, in a way that they could be gradually carried southward and stay as long as possible in the central region of the Santos Basin.
Underwater acoustic propagation modeling was planned as the fourth component of PMPAS-BS (Figure 1). According to Dekeling et al. (2014a), an efficient acoustic monitoring project requires an adequate combination between measurements and modeling, as the use of ocean acoustic noise models can effectively contribute to the assessment and monitoring of environmental noise. The propagation models used in acoustic noise estimation are consolidated (Siderius and Porter, 2008; Etter, 2012). Another important aspect is that modeling can help to evaluate different contributions to the underwater soundscape, such as environmental sources (geophony) and human-driven sources (anthropophony), as presented by ZoBell et al. (2024). PMPAS-BS developed the Underwater Acoustic Modeling System (SIMAS in its Portuguese acronym), initially as a collaborative initiative between IPqM and the Portuguese company MarSensing (Soares et al., 2015). SIMAS is a computational tool for predicting the underwater ship-related soundscape, using a model to simulate acoustic propagation based on the normal mode model KRAKEN (Porter, 1992). It uses as input data the Automatic Identification System (AIS) of ships, their acoustic signature, oceanographic and geophysical data. The normal mode solution was used to obtain a 2D representation, considering a stratified ocean and assuming variation of the medium properties only with depth and distance. The final 3D representation obtained uses an Nx2D modeling technique, where the 3D problem is solved using N radials centered on the source position in 2D mode. The SIMAS results are maps of ocean noise with a horizontal resolution of 1/6° generated by anthropogenic sources (ships, platforms, etc.) in the 63 Hz and 125 Hz frequency bands of the 1/3 octave energy spectrum, with monthly, annual, and seasonal characterization of the sound level.
Although it is important to present the acoustic modeling as the fourth component of PMPAS-BS, because it is a strategic part of the project and uses measured acoustic data for its validation, its description and results will not be elaborated in this paper, since our main concern here is the presentation and discussion of the measurement components. Further details and results of the SIMAS system are described in De Lima et al. (2020).
All the acoustic signals recorded by the equipment of the fixed oceanic, fixed coastal and mobile components were systematically processed by PMPAS-BS to generate acoustic parameters defined by internationally recognized standards (ANSI S1.11, 2004; ANSI/ASA S1.1, 2013; ISO-18405, 2017).
The basic methodology was to compute acoustic parameters and perform data qualification for signal sections extracted from raw audio signals acquired by the PAM systems (Medwin and Clay, 1998). The Welch method was applied to compute the signal spectrum (Stoica and Moses, 2005) using one-minute time intervals segmented with 50% overlap. These one-minute segments were divided into 120 one-second blocks, and for each block the 1/3-octave mean square sound pressure level (SPL) spectrum (dB re 1μPa2) was obtained. These spectra were used to calculate the 1/3 octave spectra at the 5th, 50th (or median) and 95th percentiles, as well as the average spectrum. In this paper, the nth percentile gives the level that is not exceeded n% of the time, and the median 1/3 octave spectrum was used to present and discuss the noise levels. The values of the 50th percentile of the sound pressure level (SPL50p) in the bands of 63 Hz and 125 Hz presented in this article were obtained from the median 1/3 octave spectra. For the data transmitted by the profilers, the acoustic signal processing was performed internally in the instruments, and the only difference from the processing steps presented above is that the number of blocks used to divide each signal minute was 351 blocks in the profiler processing algorithm. The qualification of the acoustic profiler data is described by Soares-Filho et al. (2018).
For each minute of acquired data, the PMPAS-BS processing algorithm submitted the calculated acoustic parameters to a qualification process before accepting them as valid information and adding them to the project database. If any 1-minute section was found to be contaminated by noise from the acquisition system, such as pump or internal glider motor operation, that section was discarded.
During the qualification phase, sections with noise caused by intense water flow through the PAM system were also discarded. Flow noise results from the response of the hydrophone to various types of non-acoustic pressure fluctuations generated by the flow at the hydrophone surface (Strasberg and Taylor, 1979). This problem was particularly recurrent for the PAM systems installed at depths of 50 m and 200 m in the instrumented FA mooring lines, which were occasionally subjected to intense flow from the Brazil Current, its eddies and meanders. Literature data confirm this fact, showing that acoustic measurements are affected by flow noise up to a few tens of Hertz (Erbe et al., 2015). Figure 5 shows an example of flow noise affecting the acoustic measurements of mooring line FA02 from 15/November/2017 to 31/January/2018, when an intensification of ocean currents occurred at 50 m water depth. The top panel presents time series of the 50th percentile of SPL spectra (dB re 1μPa2) and current velocity (cm/s) for two different water depths (50 m and 950 m). The middle and bottom panels show the corresponding spectrograms of the two water levels. It is clearly observed the high correlation of sound energy and current velocity during the episodes of intense current velocities at the 50 m level, and how this directly affects the spectrogram at lower frequency bands, including the 63 Hz band, which is most used to monitor the impact of anthropogenic noise. The spectrogram for 950 m water depth does not show the high enhancement at lower frequencies seen near the surface, because the flow velocities at this depth remained below 15 cm/s for most of the time. After several evaluations carried out by the PMPAS-BS data processing team, it was concluded that the threshold speed of 13 cm/s would be the upper limit to consider measurements valid for the PMPAS-BS objectives of metrological measurements of the influence of anthropogenic noise on the ocean soundscape. This value is compatible with the value obtained in the article by (dos Santos et al., 2016), where flow noise was evaluated for the drift speed of gliders.
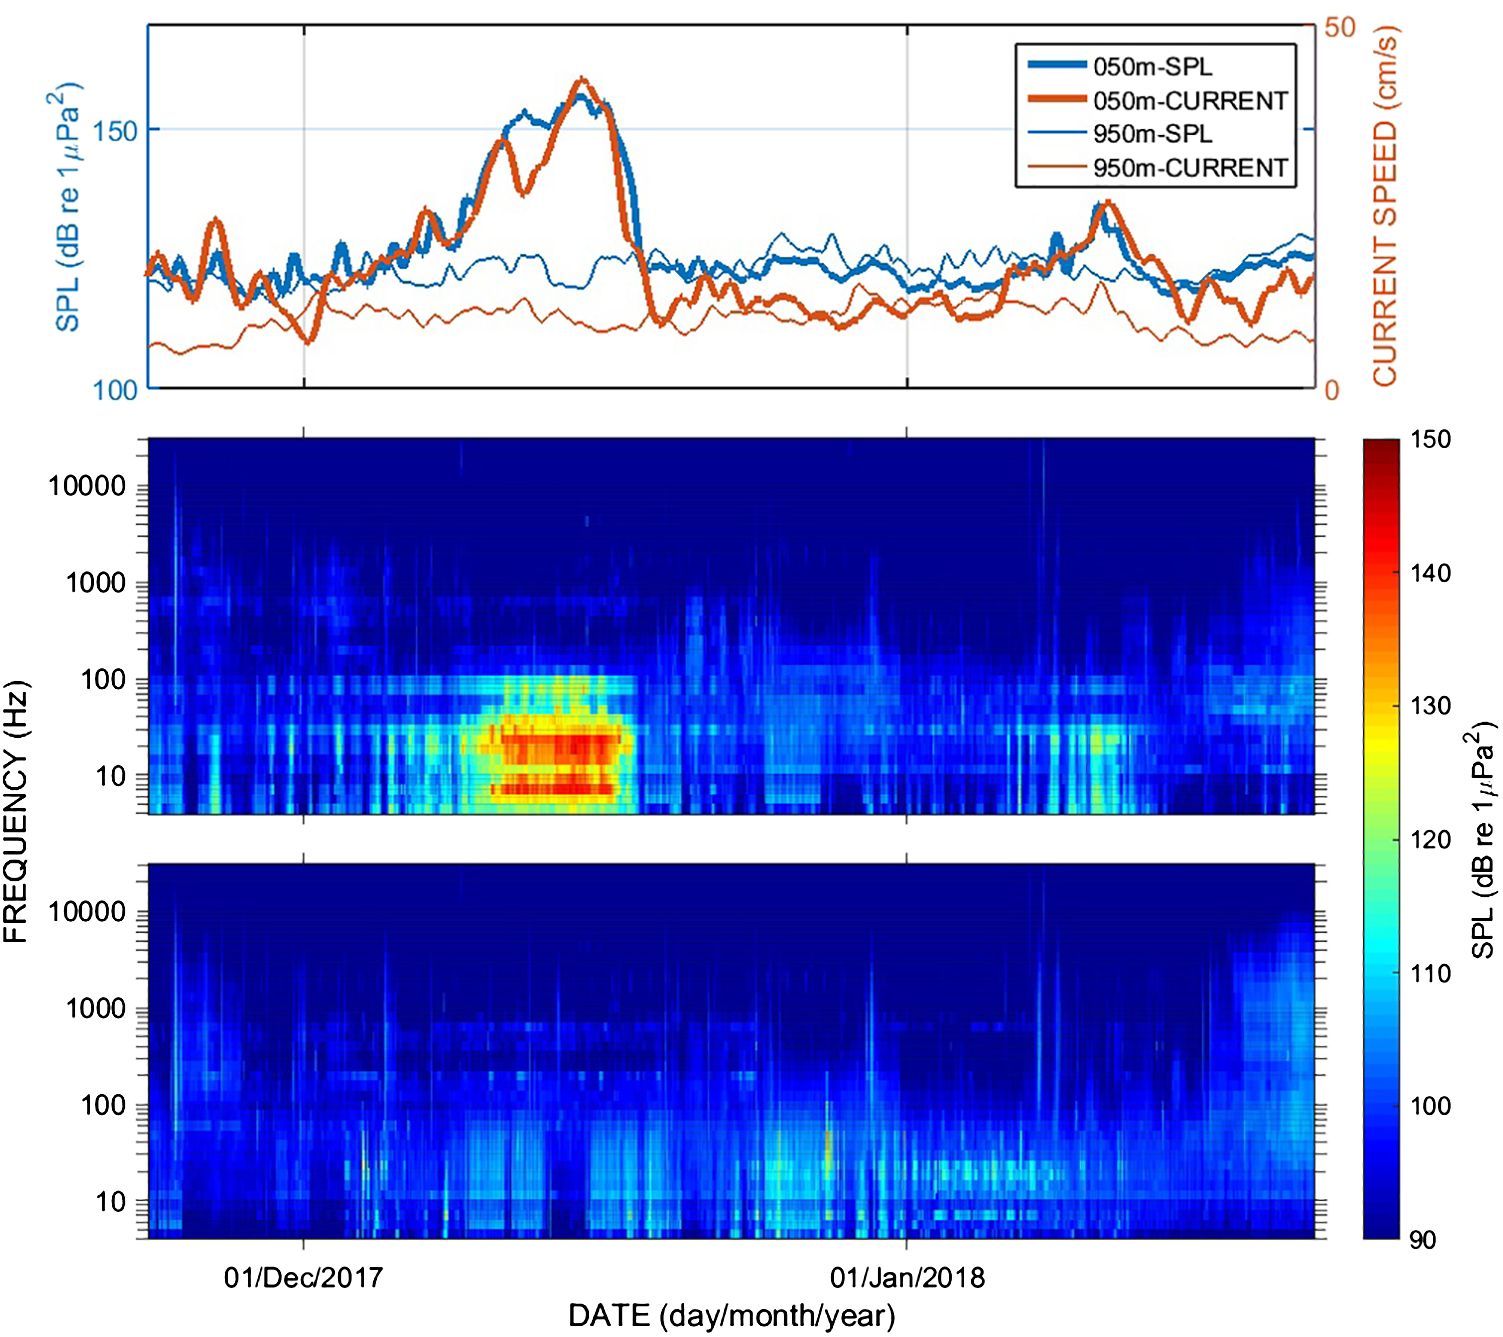
Figure 5 Upper panel: Time series of the 50th percentile of the SPL (left scale, dB re 1μPa2) versus current speed (right scale, cm/s) for 50 m and 950 m water levels at FA02 location from 15/November/2017 to 31/January/2018. Middle and lower panels: spectrograms of the SPL50p (time on the x-axis and frequency on the y-axis) for the 50 m and 950 m water depths respectively.
As discussed in the planning phase of the PMPAS-BS, the main objective of the project was to characterize and quantify the marine soundscape in a large oceanic region of the western South Atlantic Ocean, where the Santos Basin is located (Figure 1), and to estimate the impact of anthropogenic noise sources related to E&P activities. To this end, the paper will focus on presenting results and discussing the continuous low-frequency sound measured according to its components, with emphasis on noise levels within the 1/3-octave frequency bands at 63 and 125 Hz. These frequency bands are considered representative of the impact of anthropogenic sources on the ocean soundscape (Dekeling et al., 2014a; Haver et al., 2021). This does not mean that measurement and evaluation of impulsive sound sources are not important for PMPAS-BS, but that this article intends to present results related to the continuous low-frequency soundscape acquired during the first cycle from November 2015 to December 2021.
For the fixed oceanic mooring line (FA) measurements, 136,565 one-minute acoustic windows (18,942.74 hours) were accepted in the qualification process, measured from September 2017 to December 2021, during which 6 cruise campaigns of FA deployment and retrieval were conducted. Figure 6 shows comparative box plots of SPL50p of valid acoustic data from all FAs for the 1/3 octave filter at the frequencies of 63 Hz and 125 Hz, and the mean values of SPL50p are presented in Table 3. Comparison of data distributions is performed using the analysis of variance (ANOVA) method, testing the null hypothesis that the means of the distributions are equal. The results of the ANOVA test for each frequency are also shown in Table 3, and the null hypothesis was rejected at the 5% significance level. Thus, the averaged 50th percentiles of SPL for each mooring line were considered to be significantly different at the specified frequency bands. Note that the one-way ANOVA test does not consider which pairs may be considered similar or grouped. For this purpose, the Tukey and Bonferroni tests (Rice, 2007) were applied, and both provided results considering data sets with different means at the 5% significance level. The calculated standard errors of the means, defined as the standard deviation divided by the square root of the number of samples, are presented in Table 3.
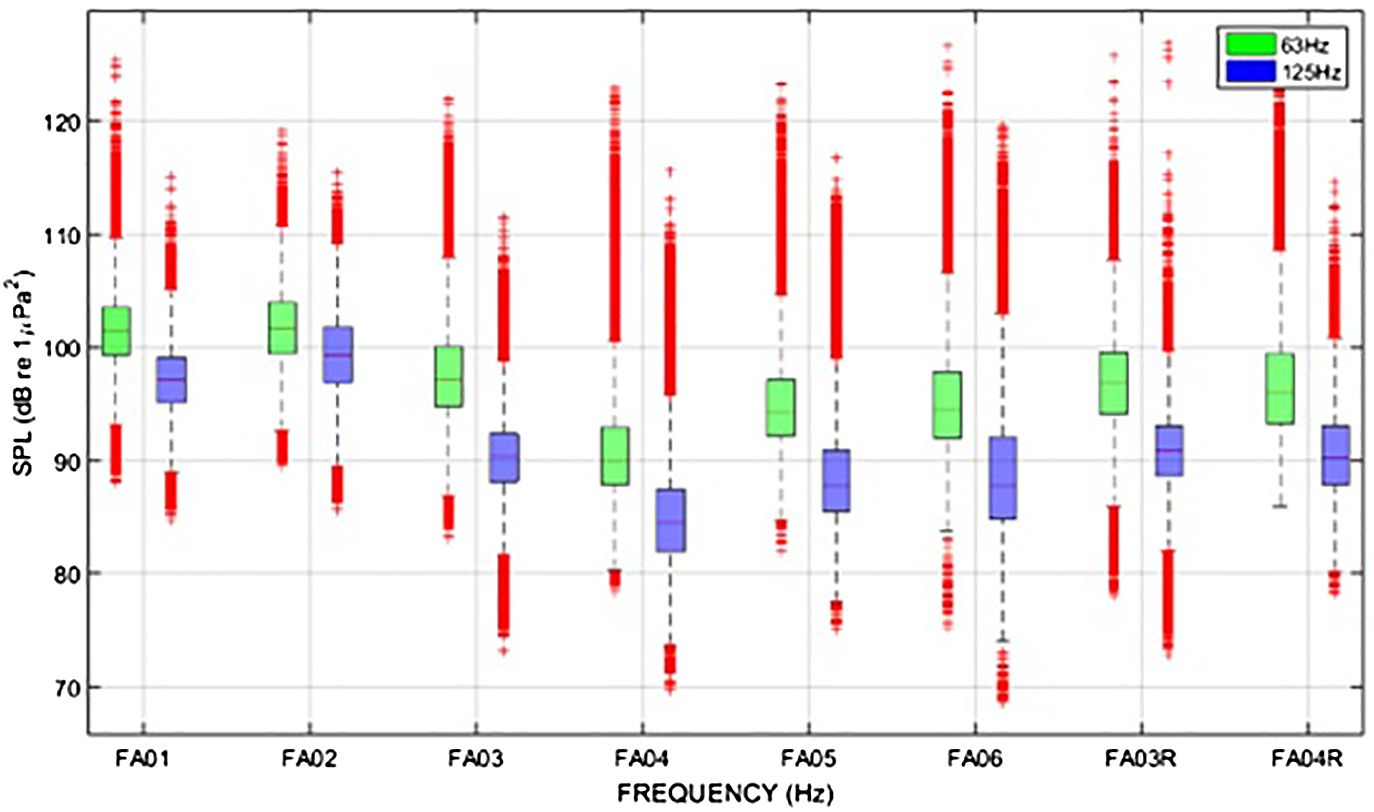
Figure 6 Box plots with comparison of the 50th percentile of SPL (SPL50p, dB re 1μPa2) between FAs for all data in the 1/3 octave filters at frequencies of 63 Hz (green rectangles, left in each pair of rectangles) and 125 Hz (blue rectangles, right).
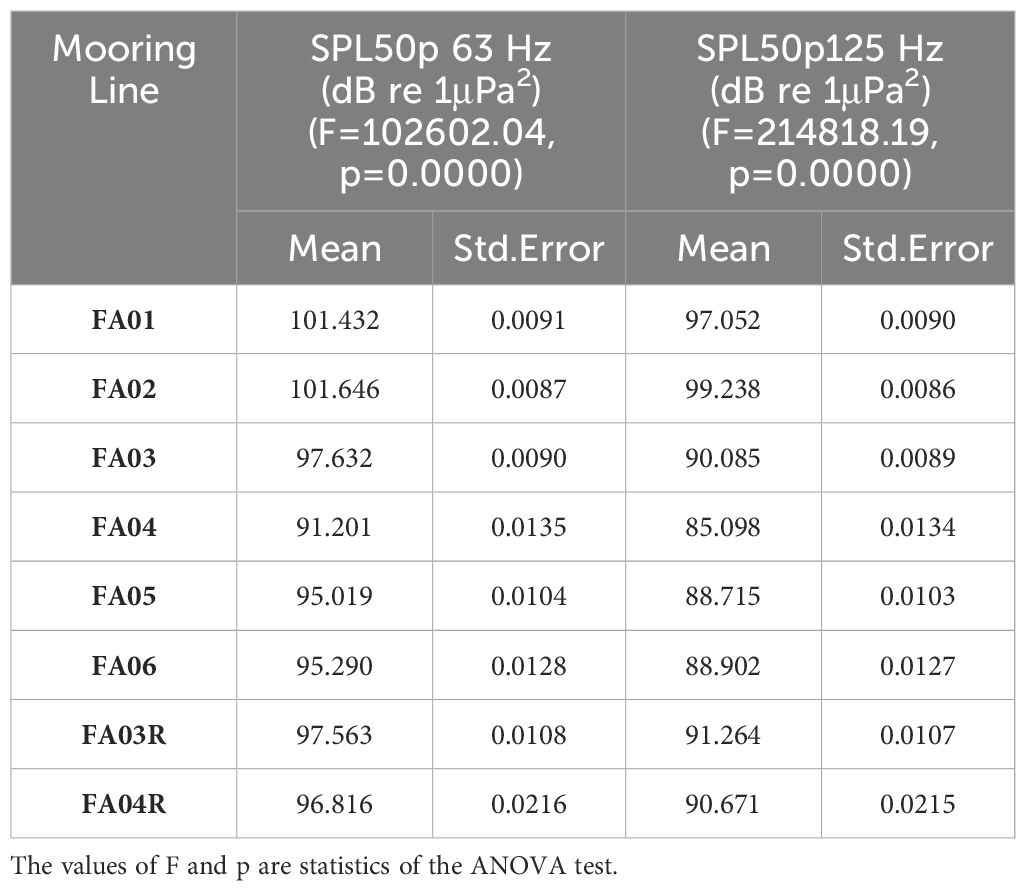
Table 3 Calculated mean values of SPL50p (dB re 1μPa2) for all FAs in the 1/3 octave filters at frequencies of 63 Hz and 125 Hz and their respective standard errors.
As observed in Figure 6, the sound pressure levels have slightly higher values in the 63 Hz frequency band than in the 125 Hz band. The FA-01 and FA-02 lines, which were installed in regions with O&G production activities, had higher median values than other lines. It is important to note that during the planning phase of the PMPAS-BS, FA-01 was the line closest to the Tupi field, which at that time had the higher O&G activity in the basin, with a daily production of 442,300 barrels per day (bpd) in December 2015, and there was no O&G production in the Buzios field (ANP, 2015). Gradually, from 2018 to 2021, O&G activity increased in the northern part of the basin near the location of FA-02, such that by December 2021, Buzios field had a production of 739,155 bpd (ANP, 2021). Because O&G activities involve not only the installation and operation of oil platforms, but also an increased number of supply and service vessels, these two lines have the highest noise levels compared to the others. Lines FA-03 and FA-04 were planned to be located in regions without E&P activities, which was confirmed by the lowest noise levels of FA-04, but not for FA-03. During the planning of the FA-03 site, it was not expected that this site would be exposed to E&P activities of other companies (such as seismic and environmental surveys) and busy cargo and tanker routes from the southern tip of Africa and the Indian Ocean to the ports of Rio de Janeiro and Santos, but the noise levels of FA-03 were slightly higher than FA-05 and FA-06 lines, which were installed in sites with higher regional density of ship traffic going to offshore O&G facilities. The same exposure of FA-03 was also found at nearby FA-03R and FA-04R sites.
Figure 7 presents the empirical probability density of the median SPL power spectra (SPL50p) to illustrate the behavior of the SPL 1/3 octave power spectra for the frequency bands from 10 Hz to 10,000 Hz calculated from the acoustic data of the FA-01 line. The empirical probability density presents the spectra as normalized histograms for each frequency band, allowing for the statistical distribution of underwater noise levels across the frequency spectrum (Merchant et al., 2013). The FA-01 line is the closest station to the Tupi field, the most productive O&G area in the Santos Basin (ANP, 2021), and is expected to be exposed to a very noisy environment associated with anthropogenic sources. The spectra presented were calculated using data from 09/April/2019 to 13/November/2019 acquired by the PAM system installed at 50 m below sea level, and the 5th, 25th, 50th (median), 75th, 95th percentiles and mean power spectra are also presented. Only spectra measured during periods of ocean currents less than 10 cm/s at the recorded depth were selected to avoid spurious contributions from flow noise in lower frequency bands. The empirical probability density shows that the energy is concentrated around the median spectrum. The enhancement in lower frequency bands (including the 63 Hz target band) is likely due to vessels passing close to the platforms or other nearby O&G support activities.
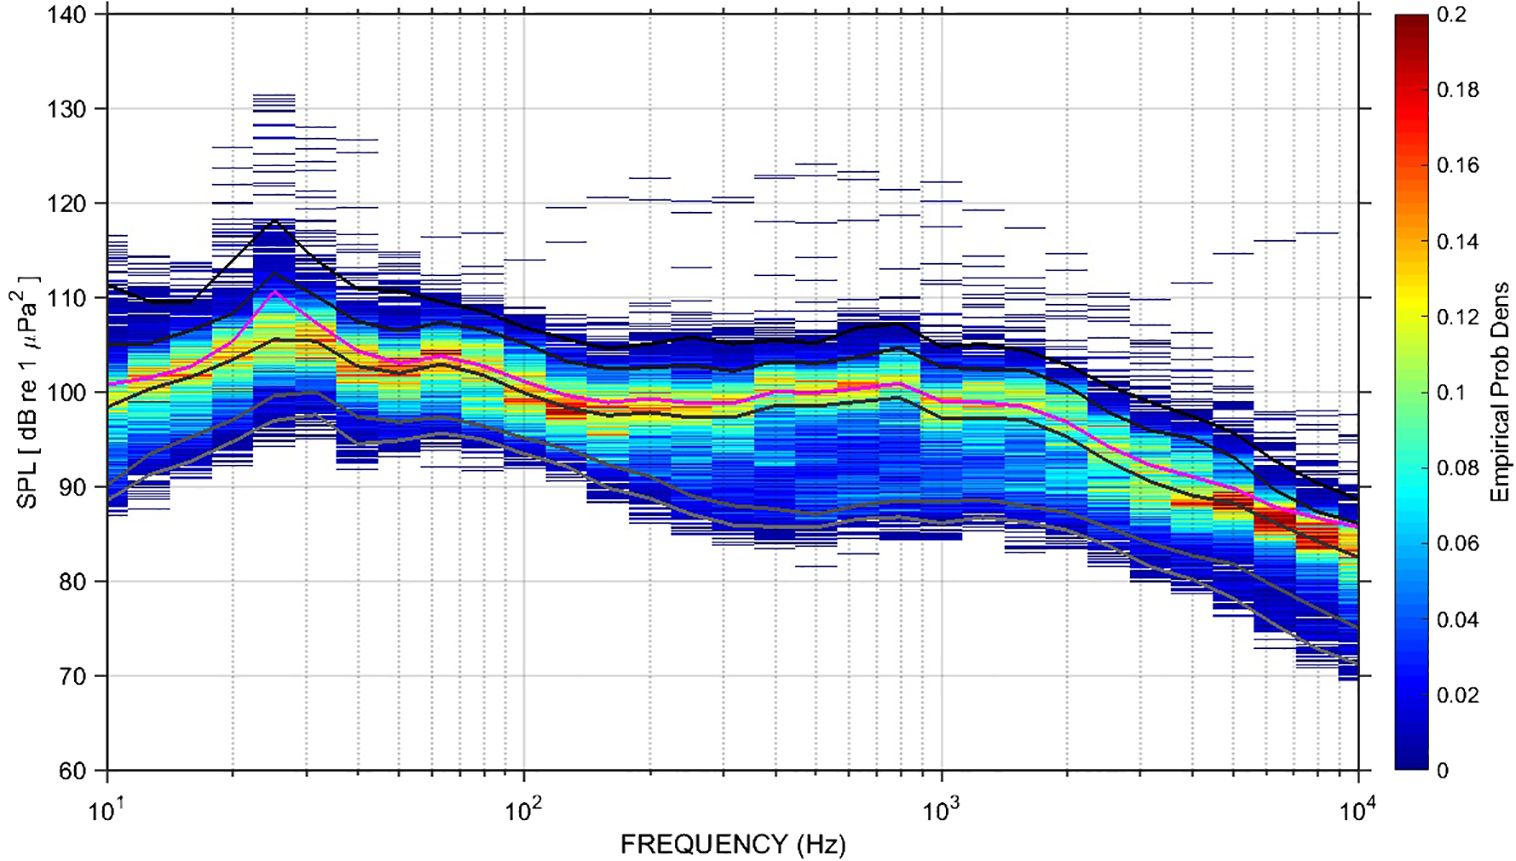
Figure 7 Empirical probability density of the median SPL power spectra (SPL50p, dB re 1μPa2) calculated from acoustic data of FA-01 mooring line measured in the time interval of 09/April/2019 to 13/November/2019. Magenta line is the average spectrum. Gray lines from below to above represent the 5th, 25th, 50th (median), 75th, and 95th percentiles.
For the fixed coastal stations (OSs), 4,004,727 one-minute acoustic windows (66,745.5 hours) were accepted in the qualification process, measured from March 2017 to December 2021, during which 105 cruise campaigns of OS deployment and retrieval were conducted. Figure 8 shows comparative box plots of SPL50p of valid acoustic data from all OSs for the 1/3 octave filters at the frequencies of 63 Hz and 125 Hz. The means of the SPL50p percentiles are shown in Table 4 with their respective standard errors. The results of the ANOVA test for each frequency are also presented and the null hypothesis that the distributions have similar means was rejected. Data sets for different OS sites were considered significantly different at the 5% significance level. Both the Tukey and Bonferroni tests (Rice, 2007) indicated that the data were not similar or grouped.
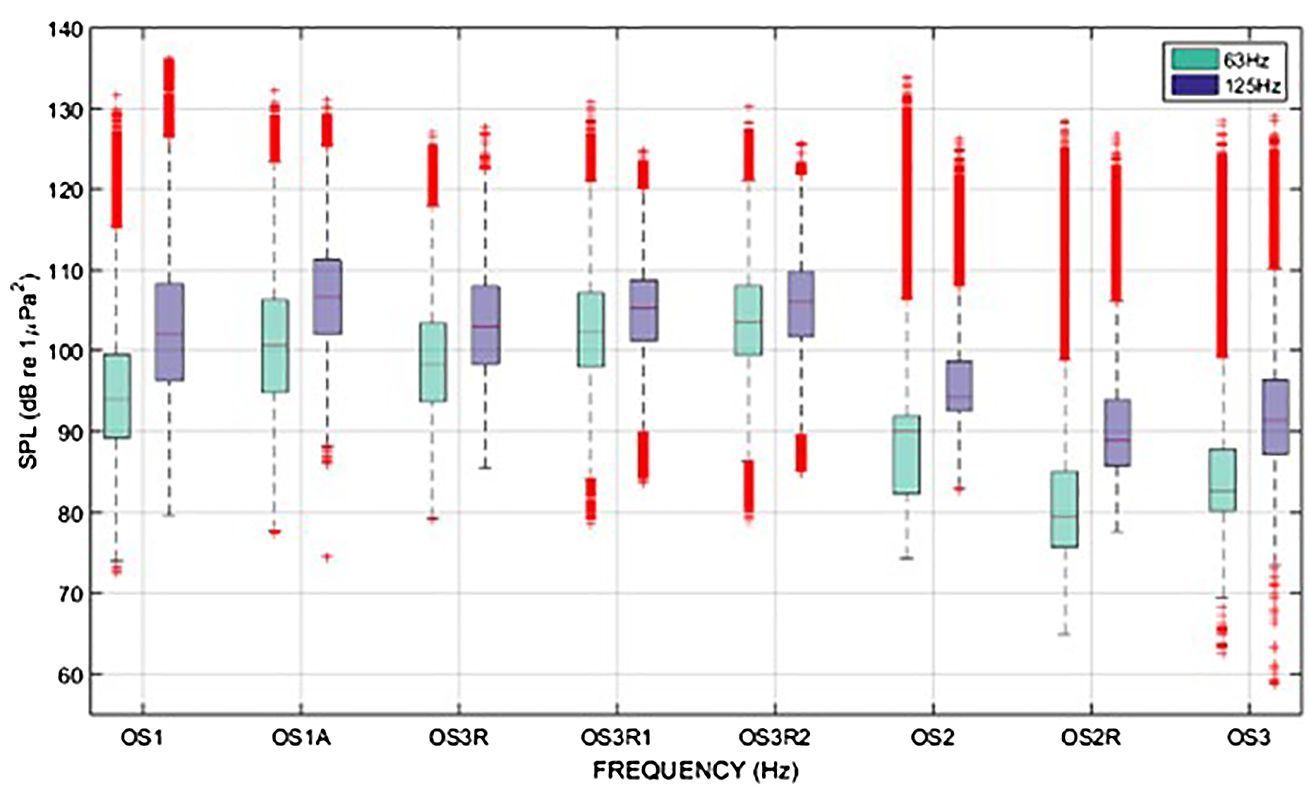
Figure 8 Box plots with comparison between OSs for all data (SPL50p, dB re 1μPa2) in the 1/3 octave filters at frequencies of 63 Hz (green rectangles, left in each pair of rectangles) and 125 Hz (blue rectangles, right).
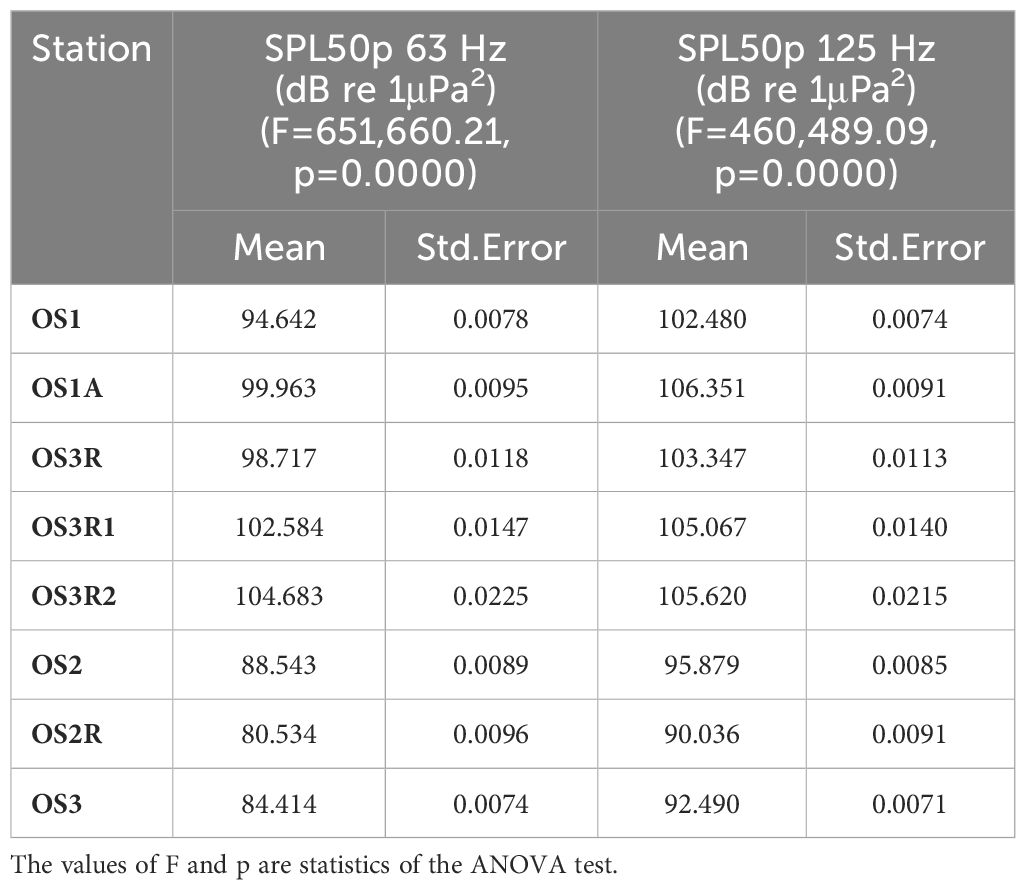
Table 4 Calculated mean values of SPL50p (dB re 1μPa2) for all OSs in the 1/3 octave filter at frequencies of 63 Hz and 125 Hz and their respective standard errors.
For both the 63 Hz and 125 Hz bands, OS1, OS1A, OS3R and OS3R1 (all located within the boundaries of the Guanabara Bay and Cagarras Islands Natural Sanctuary) were the noisiest environments measured. The high noise levels of OS1 and OS1A were expected, since they are located near the main shipping channel of the Port of Rio de Janeiro, but it was surprising that the noise levels of OS3R, OS3R1 and OS3R2 were as high as those measured at the entrance of the bay. The probable reason is that the Cagarras Islands are exposed to a very high level of noise generated by passing ships at the entrance of the bay, along with the recreational and fishing vessels that usually stay close to the islands. OS3R1 and OS3R2 were also deployed near the main shipping lane to the entrance of Guanabara Bay, which is a very busy lane with commercial, service, supply and military vessels, tugboats, etc. Observing the statistics of all OS sites in the 63 Hz band, OS2R is the quietest station (west entrance of Ilha Grande Bay), followed by OS3 (south entrance of São Sebastião Channel) and then OS2 (east entrance of Ilha Grande Bay).
Figure 9 shows the empirical probability density of the median SPL power spectra (SPL50p) for the noisy shallow-water observatories OS-3R1 and OS-3R2, which were exposed to heavy maritime traffic approaching the entrance of Guanabara Bay, as well as to various nearby vessel activities (fishing, recreational boating, etc.). The spectra presented were calculated using data from 18/January/2021 to 23/November/2021, and the 5th, 25th, 50th (median), 75th, 95th percentiles and mean power spectra are also plotted. The empirical probability density shows a noisy soundscape with an extensive plateau exceeding 100 dB re 1μPa2 for the median SPL from the 50 Hz to the 794 Hz bands. Compared to the deepwater site of Figure 7, the median SPL for the FA-01 mooring line exceeds 100 dB re 1μPa2 between the 12.5 Hz and 80 Hz bands, indicating that the OS-3R1 and OS-3R2 stations near the entrance to the Port of Rio de Janeiro are exposed to much higher low-frequency anthropogenic noise than the FA-01 deepwater site near isolated O&G platforms.
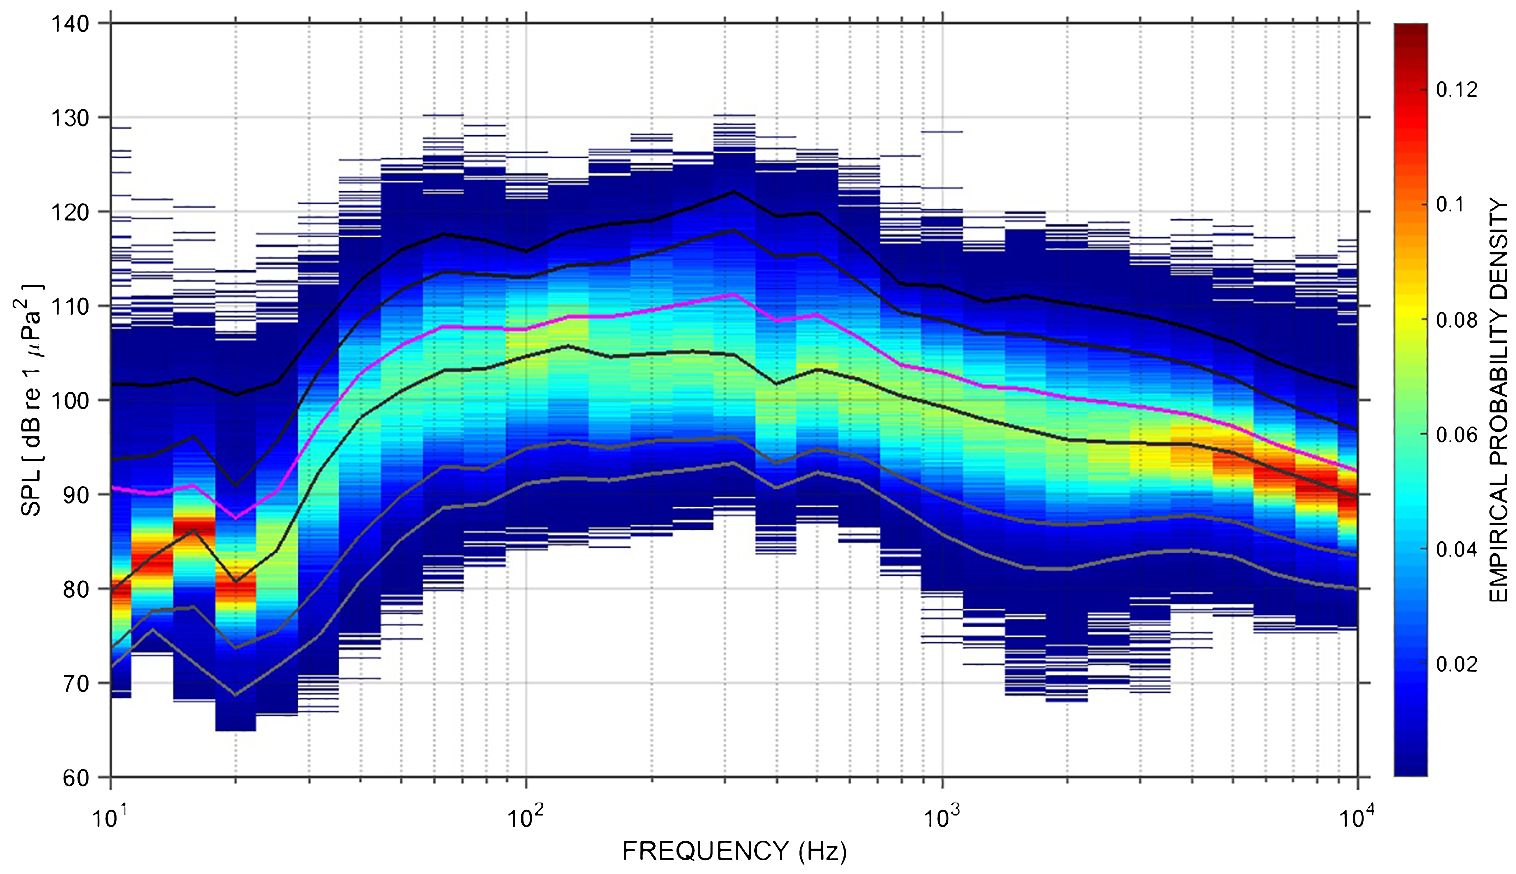
Figure 9 Empirical probability density of the median SPL power spectra (SPL50p, dB re 1μPa2) calculated from acoustic data of OS-3R1 and OS-3R2 shallow stations measured in the time interval of 18/January/2021 to 23/November/2021. Magenta line is the average spectrum. Gray lines from below to above represent the 5th, 25th, 50th (median), 75th, and 95th percentiles.
For the mobile component, 310,317 one-minute acoustic windows (5,172.0 hours) were accepted into the qualification process, measured by acoustic profilers from November 2015 to December 2021, with 234 profilers launched in 23 launch cruises, of which 226 provided data. Of the qualified acoustic windows, 130,065 were conducted within the Santos Basin perimeter (41.9%) and 180,252 outside the perimeter (58.1%). Glider-measured data amounted to 247,425 one-minute acoustic windows (4,123.8 hours) accepted in the qualification process, recorded from November 2015 to December 2021 with 52 cruise campaigns of glider launch and recovery. Of the accepted minutes, 242,246 were measured within the Santos Basin (98%) and 5,179 outside the basin (2%).
Acoustic profilers provided the greatest spatial coverage among the measurement modalities in the Santos Basin due to the large number of instruments deployed. They covered a large area of the South Atlantic Ocean by drifting freely with the ocean currents, as shown in the trajectories of 226 profilers in Figure 10 (green dots). On the continental slope, the instruments moved under the influence of the western boundary currents (Brazil Current from the surface to about 400 m depth and Intermediate Countercurrent between 400 m and 1000 m). On the São Paulo Plateau, a region of the Santos Basin between the isobaths of 2000 and 3000 m depth, they suffered the effects of oceanic eddies. Their trajectories showed great spatial variability, allowing them to cover the entire deep region of the Santos Basin, and after leaving the basin, they continued their measurements along the southern Brazilian region. The gliders had more controlled trajectories and were navigated to stay close to the O&G activities in the Santos Basin. Figure 10 (red dots) shows the trajectories of the 52 measurement campaigns carried out with the acoustic gliders in the PMPAS-BS, covering the period from November 2015 to December 2021.
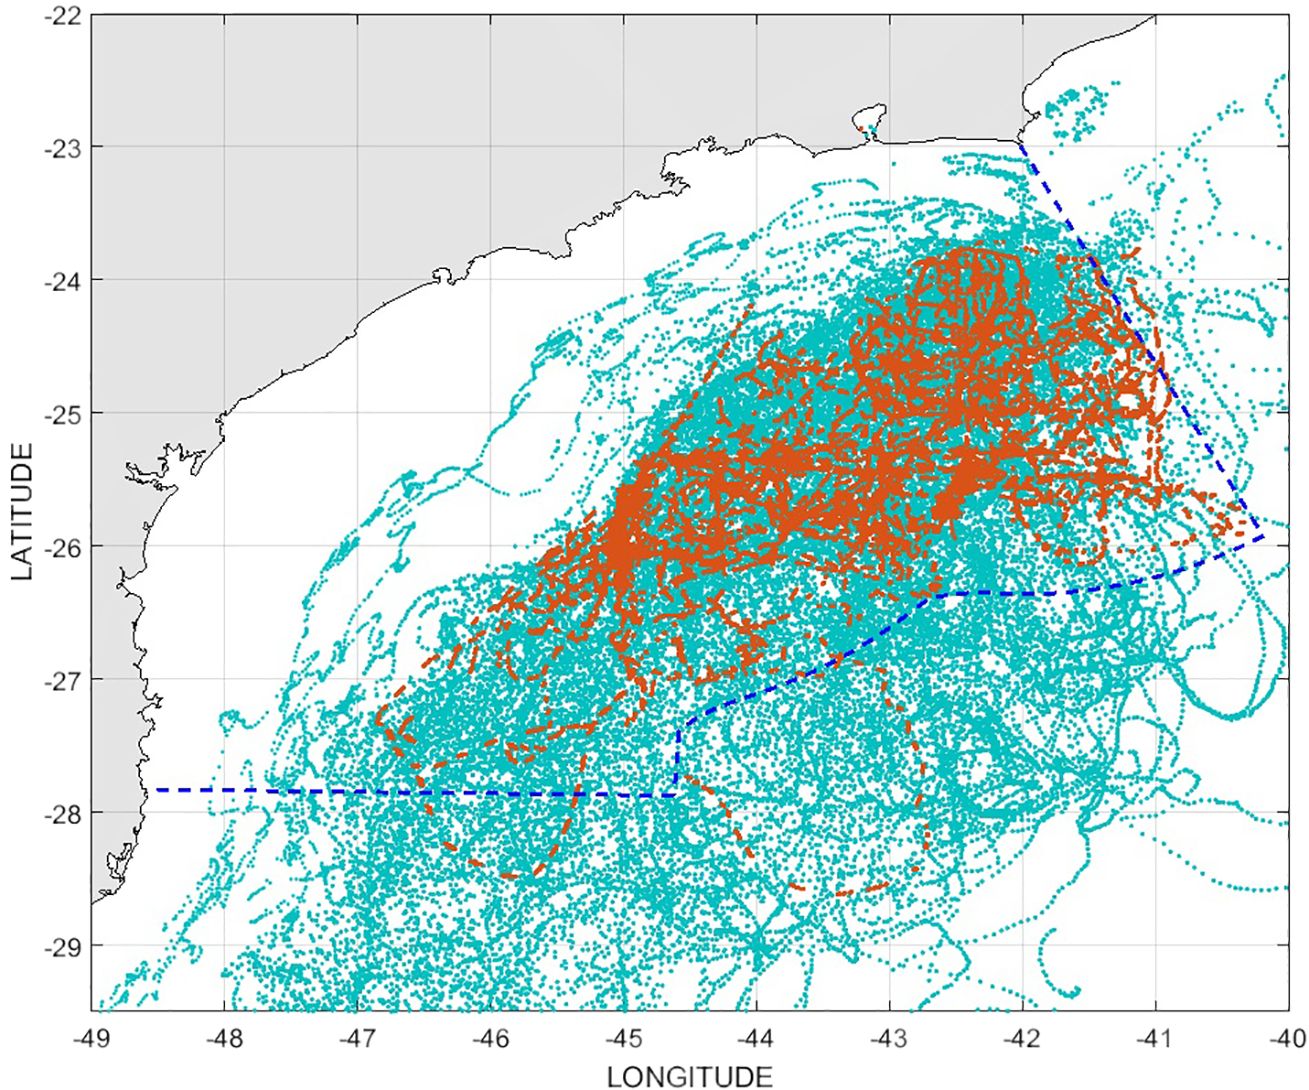
Figure 10 Trajectory of 226 of 234 profilers released from November 2015 to December 2021 (green dots) and gliders in 52 measurement campaigns from November 2015 to December 2021 (red dots). Thin black lines represent isobaths at depths of 50 m, 200 m, 1000 m, 2000 m, and 3000 m (depth indicated by black numbers near the lines). Dotted blue line delimits Santos Basin region.
After qualifying the mobile component data, it was possible to generate spatial maps with computed acoustic statistics using the qualified data from both profilers and gliders. Figure 11 shows the spatial variations of the SPL50p at the frequencies of 63 Hz and 125 Hz of the 1/3 octave spectra, using the data measured at all available depth levels from the surface to 1000 m. It is clearly observed that the region with the highest SPL50p values is between 25° S and 26° S latitude and 42° W and 44° W longitude, due to the higher concentration of E&P activities. The continental shelf area off the port of Rio de Janeiro (23.5° S and 43° W) is also noisy due to vessel traffic.
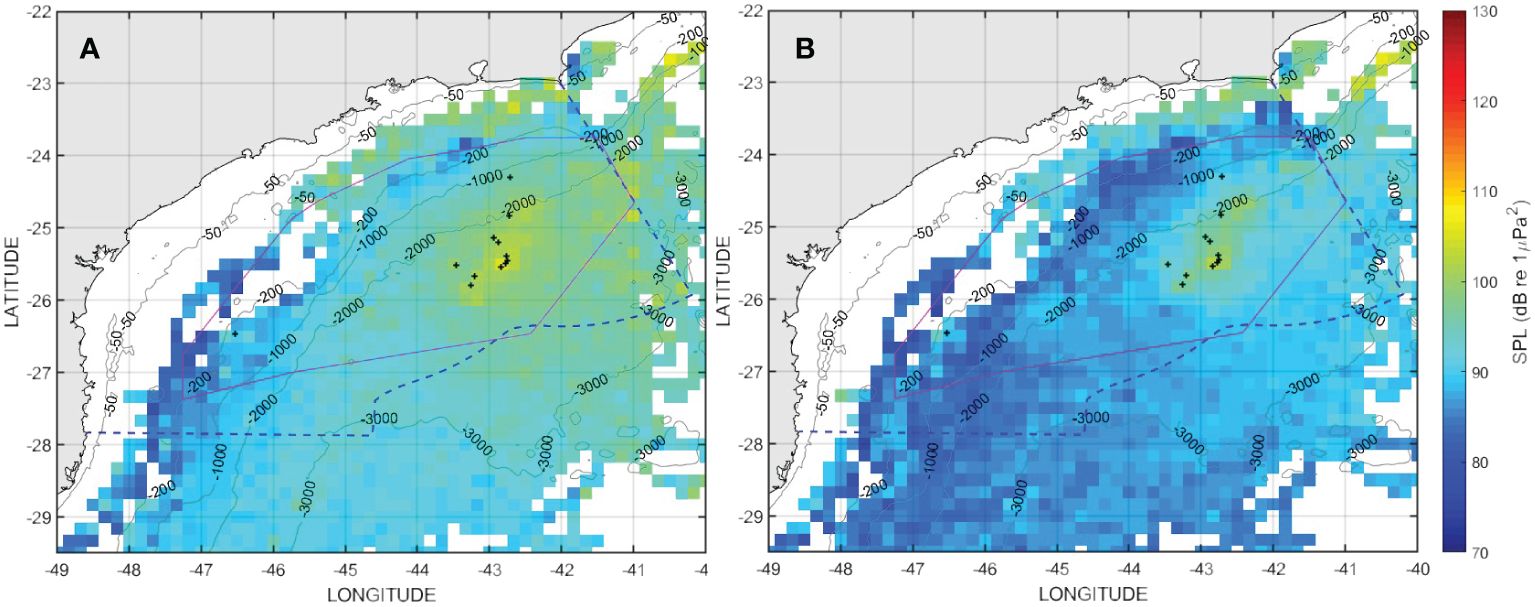
Figure 11 Median SPL maps (SPL50p, dB re 1μPa2) of the 1/3 octave filters at 63 Hz (A) and 125 Hz (B) frequencies created using acoustic data measured by PMPAS-BS mobile component (profilers and gliders) from November 2015 to December 2021. Dotted blue line delimits the Santos Basin region. Thin black lines represent isobaths for depths, in meters, indicated near the lines. Black crosses show the position of some O&G producing platforms in the pre-salt region.
The Santos Basin Underwater Soundscape Monitoring Project (PMPAS-BS) was responsible for unprecedented passive underwater acoustic measurements in the southwestern South Atlantic. A variety of equipment and data acquisition methods were used in a complementary manner to provide a metrological assessment of the underwater soundscape in the region, focusing on the contribution from anthropogenic sources.
It is important to note that the southeastern Brazilian continental margin was already a noisy region of the western South Atlantic Ocean prior to the start of deepwater O&G production in the Santos Basin, due to the intense traffic of commercial, military, fishing, and recreational vessels. The two main hubs for Brazil’s export and import of goods by sea are located in this region: Santos and Rio de Janeiro ports. The major contribution of PMPAS-BS was to propose a series of acoustic measurements that contributed to the knowledge of the baseline soundscape of the region, besides monitoring the increase of underwater noise in areas particularly affected by the growing O&G activities.
The first cycle of PMPAS-BS consisted of three measurement components (fixed oceanic, fixed coastal, and mobile instruments) that started in November 2015 and lasted until December 2021, along with an underwater acoustic modeling component that is not discussed in this paper. Based on the results obtained up to the end of this cycle, each component is considered to have fulfilled its purpose. A complete picture of the Santos Basin soundscape emerged, and a scientific basis was established for the future extension of the monitoring project into its second cycle.
The fixed oceanic component consisted of six deep-water moorings with attached PAM systems. They were designed to cover different acoustic scenarios in the basin. The quietest results were obtained at the southern boundary mooring FA-04, which measured 91.20 dB re 1μPa2 and 85.10 dB re 1μPa2 as mean 50th percentile SPL (SPL50p) in the 63 Hz and 125 Hz frequency bands, respectively. The loudest levels were measured at the FA-02 mooring line, which had average SPL50p values of 101.65 dB re 1μPa2 and 99.24 dB re 1μPa2 for these bands. This increase of 10.45 dB at 63 Hz and 14.14 dB at 125 Hz is associated with the highest exposure of the FA-02 site to O&G activities and associated marine traffic.
The fixed coastal component was designed with three shallow-bottom mounted PAM systems. They were planned to measure the soundscape near the entrance routes of busy ports associated with O&G activities located in Guanabara Bay, Ilha Grande Bay, and São Sebastião Channel, respectively. Some of them were later relocated to other sites proposed by the Brazilian environmental agency IBAMA. The quietest acoustic environment was obtained in the western part of Ilha Grande Bay, where OS-2R was located, with mean sound levels around 84.41 dB re 1μPa2 and 90.03 dB re 1μPa2 for SPL50p at 63 Hz and 125 Hz frequency bands, respectively. The noisiest levels were measured at OS-3R2, located outside Guanabara Bay but close to the main shipping lane, with average values of 104.68 dB re 1μPa2 and 105.62 dB re 1μPa2 for SPL50p in these bands. The position of OS-3R2 is exposed to a very high level of noise generated by all types of vessels transiting the Guanabara Bay (commercial, service, supply and military vessels, tugboats, etc.), as well as recreational and fishing vessels that usually stay in the vicinity of the Cagarras Islands.
The mobile component used acoustic profilers and gliders to obtain a very comprehensive view of the regional soundscape in the Santos Basin, which covers an area of approximately 251,000 km2. They were able to accomplish their mission and allowed PMPAS-BS to obtain regional SPL maps of the 1/3 octave filters at frequencies of 63 Hz and 125 Hz. Results for other frequency bands were also calculated, but this paper focuses on the anthropogenic noise contribution using these two frequencies as proxies. The results obtained show that the central deepwater O&G production region, located between geographic coordinates 24.5° S to 25.5° S and 42.5° W to 43.5° W, had the highest mean SPL50p values in the 63-Hz and 125-Hz frequency bands, in the same order of magnitude of 102 dB re 1μPa2 as the results obtained from the fixed oceanic component.
Based on the experience and results obtained in all the components of the first cycle of the PMPAS-BS, a second cycle of the project has been planned with the objective of continuing the underwater soundscape monitoring project, optimizing its results by reinforcing the positive points and reevaluating the initiatives whose objectives were achieved during the first phase of the project, or which presented operational problems. Based on these premises, the second cycle will discontinue the use of profilers, considering that those previously launched have already contributed to the characterization of the regional soundscape of the Santos Basin. These profilers also do not permit the recovery of raw acoustic recordings, which does not allow the reprocessing of audio files or, eventually, the detection of cetacean vocalizations. The monitoring strategy using gliders will be expanded from one to three operational devices, considering the increased reliability of the operation of these devices, their flexibility for the detection of cetacean vocalizations and their contribution to the validation of the results of the numerical modeling of acoustic propagation. Regarding the acoustic moorings FAs, the number of lines will be reduced to three in the second cycle, using PAM systems in water depths less affected by current speeds (500 and 950 m), due to quality control limitations related to pseudo-noise and other logistical problems. Considering the fixed coastal component, two OS will be maintained for the second cycle. In addition to maintaining one OS at the entrance of Guanabara Bay, a second one will be used to measure different regions of the continental shelf of the Santos Basin (up to 100 m), or will be deployed at previously monitored coastal sites if changes in their anthropogenic activities are observed. The acoustic modeling component will be continued to make its results more robust and reliable through validation with measured data. Our long-term goal is to keep track of ongoing global ocean soundscape monitoring initiatives and to follow international standards and frameworks.
The results presented in this article provide an insight into the first cycle of the PMPAS-BS. Scientific research and academic work are being pursued with the data obtained from this project, such as the temporal evolution of anthropogenic noise, the impact of specific activities such as seismic surveys, detailed evaluation of the soundscape in different regions of the basin, increased low- and mid-frequency noise at the coastal stations associated with fish or invertebrate choruses, the contribution of wind noise, and other prospective topics. Its interface with another regional scale initiative, the PMC-BS project related to the monitoring of cetaceans in the Santos Basin, is also planned and will be one of the main scientific contributions of the second cycle of the PMPAS-BS (Filún et al., 2020; Rossi-Santos et al., 2022).
Restrictions apply to the datasets: The datasets presented in this article are not readily available because they should be requested exclusively for academic or research initiatives. They should not be requested for commercial or business purposes. Requests to access the datasets should be directed to d2lsbGlhbS5zb2FyZXNAbWFyaW5oYS5taWwuYnI=.
JL: Conceptualization, Formal analysis, Investigation, Methodology, Software, Validation, Visualization, Writing – original draft, Writing – review & editing. WSL: Conceptualization, Data curation, Formal analysis, Investigation, Methodology, Software, Validation, Visualization, Writing – original draft, Writing – review & editing. FX: Formal analysis, Investigation, Methodology, Validation, Visualization, Writing – original draft, Writing – review & editing. TP: Conceptualization, Data curation, Formal analysis, Investigation, Methodology, Software, Supervision, Validation, Visualization, Writing – original draft, Writing – review & editing. AS: Conceptualization, Data curation, Funding acquisition, Methodology, Project administration, Resources, Supervision, Writing – original draft, Writing – review & editing. FA: Conceptualization, Funding acquisition, Project administration, Resources, Supervision, Writing – review & editing. DP: Conceptualization, Data curation, Funding acquisition, Methodology, Project administration, Resources, Supervision, Writing – review & editing. VR: Data curation, Methodology, Project administration, Resources, Supervision, Writing – review & editing. CG: Data curation, Formal analysis, Investigation, Methodology, Project administration, Resources, Supervision, Writing – review & editing. CC: Formal analysis, Investigation, Methodology, Software, Validation, Visualization, Writing – review & editing. AB: Data curation, Project administration, Resources, Supervision, Writing – review & editing.
The author(s) declare financial support was received for the research, authorship, and/or publication of this article. This work was supported by Petróleo Brasileiro S.A. (PETROBRAS), including its planning and execution.
The authors would like to thank Petróleo Brasileiro S.A. (PETROBRAS) for full support of the PMPAS-BS project, Instituto de Pesquisas da Marinha (IPqM) for the provision of a technical team to follow up and collaborate with the project, Instituto Brasileiro de Meio Ambiente e Recursos Renováveis (IBAMA) for the evaluation and approval of the project’s demands, and the oceanographic service companies ProOceano and OceanPact Geo for their commitment to accurate data acquisition. The first author also thanks the Agência Nacional de Petróleo, Gás Natural e Biocombustíveis (ANP) and the Financiadora de Estudos e Projetos (FINEP) for their support to human resources with PRH programs.
TP, AS, FA, DP and VR are employed by Petrobras.
The remaining authors declare that the research was conducted in the absence of any commercial or financial relationships that could be construed as a potential conflict of interest.
The authors declare that this study received funding from Petróleo Brasileiro S.A. (PETROBRAS). The funder had the following involvement in the study: study design, data collection and decision to publish. For the purpose of this article, the funder was not involved in the selection of data and paper design, analysis and interpretation of data, and writing of the article.
All claims expressed in this article are solely those of the authors and do not necessarily represent those of their affiliated organizations, or those of the publisher, the editors and the reviewers. Any product that may be evaluated in this article, or claim that may be made by its manufacturer, is not guaranteed or endorsed by the publisher.
Affatati A., Scaini C., Salon S. (2022). Ocean sound propagation in a changing climate: global sound speed changes and identification of acoustic hotspots. Earth’s Futur. 10, e2021EF002099. doi: 10.1029/2021EF002099
Alves A., Barros R., Villares C., Ribeiro R., Bernsmuller E., Afonso O., et al. (2018). “Development and characterization of an autonomous underwater acoustic recording system,” in OCEANS 2018 MTS/IEEE Charleston proceedings. 1–8 (IEEE). doi: 10.1109/OCEANS.2018.8604487
ANP (2015). Boletim da Produção de Petróleo e Gás Natural. Monthly bulletin of O&G production in Brazil. Bulletin 64/2015. Rio De Janeiro, Brazil: Agência Nacional de Petróleo, Gás Natural e Biocombustíveis.
ANP (2021). Boletim da Produção de Petróleo e Gás Natural. Monthly bulletin of O&G production in Brazil. Bulletin no.136/2021. Rio De Janeiro, Brazil: Agência Nacional de Petróleo, Gás Natural e Biocombustíveis.
ANSI S1.11 (2004). Specification for octave-band and fractional-octave-band analog and digital filters. New York, NY: American National Standards Institute.
Biló T. C., da Silveira I. C. A., Belo W. C., de Castro B. M., Piola A. R. (2014). Methods for estimating the velocities of the Brazil Current in the pre-salt reservoir area off southeast Brazil (23∘S–26∘S). Ocean Dyn. 64, 1431–1446. doi: 10.1007/s10236–014-0761–2
Breeze H., Nolet V., Thomson D., Wright A. J., Marotte E., Sanders M. (2022). Efforts to advance underwater noise management in Canada: Introduction to the Marine Pollution Bulletin Special Issue. Mar. pollut. Bull. 178, 113596. doi: 10.1016/j.marpolbul.2022.113596
Calado L., Camargo Rodríguez O., Codato G., Contrera Xavier F. (2018). Upwelling regime off the Cabo Frio region in Brazil and impact on acoustic propagation. J. Acoust. Soc Am. 143, EL174–EL180. doi: 10.1121/1.5026244
Claudet J., Bopp L., Cheung W. W. L., Devillers R., Escobar-Briones E., Haugan P., et al. (2020). A roadmap for using the UN decade of ocean science for sustainable development in support of science, policy, and action. One Earth 2, 34–42. doi: 10.1016/j.oneear.2019.10.012
Colbert B. R. (2020). Trends and developments in international regulation of anthropogenic sound in aquatic habitats. J. Acoust. Soc Am. 147, 3100–3107. doi: 10.1121/10.0001139
Dalpaz L., Paro A. D., Daura-Jorge F. G., Rossi-Santos M., Norris T. F., Ingram S. N., et al. (2021). Better together: analysis of integrated acoustic and visual methods when surveying a cetacean community. Mar. Ecol. Prog. Ser. 678, 197–209. doi: 10.3354/meps13898
Dekeling R. P. A., Tasker M. L., van der Graaf A. J., Ainslie M., Andersson M. H., Andre M., et al. (2014a). Monitoring Guidance for Underwater Noise in European Seas. Part I - Executive Summary, JRC Scientific and Policy Report EUR 26557 EN (Luxembourg: Publications Office of the European Union). doi: 10.2788/29293
Dekeling R. P. A., Tasker M. L., van der Graaf A. J., Ainslie M., Andersson M. H., Andre M., et al. (2014b). Monitoring Guidance for Underwater Noise in European Seas. Part II: Monitoring Guidance Specifications, JRC Scientific and Policy Report EUR 26555 EN (Luxembourg: Publications Office of the European Union). doi: 10.2788/27158
Dekeling R. P. A., Tasker M. L., van der Graaf A. J., Ainslie M., Andersson M. H., Andre M., et al. (2014c). Monitoring guidance for underwater noise in European seas - Part III - Background Information and Annexes, JRC Scientific and Policy Report EUR 26556 EN (Luxembourg: Publications Office of the European Union). doi: 10.2788/2808
Delarue J., MacDonnell J., Martin B., Mouy X., Hannay D., Chorney N. E., et al. (2012). Northeastern Chukchi Sea Joint Acoustic Monitoring Program 2010 – 2011. JASCO Applied Sciences Document 00301, Version 1.0. Technical report for ConocoPhillips Company, Shell Exploration & Production Company, and Statoil USA E&P, Inc. Dartmouth, NS: JASCO Applied Sciences.
Delarue J., Vallarta J., Frouin-Mouy H., Wladichuk J., Martin B., Mouy X., et al. (2013). Northeastern Chukchi Sea Joint Acoustic Monitoring Program 2011 – 2012. JASCO Document 00533, Version 3.0. Technical report for ConocoPhillips Company, Shell Exploration & Production Company, and Statoil USA E&P, Inc. Dartmouth, NS: JASCO Applied Sciences.
De Lima F. M., Junior C. C., Soares-Filho W., Galottas C., Lima J. A. M., de Paula T. P. (2020). “An underwater acoustic modelling framework for Santos Basin, Brazil,” in International Conference on Underwater Acoustics. Meville, NY: AIP Publishing 40 (1), 1–8. doi: 10.1121/2.0001347
dos Santos F. A., São Thiago P. M., de Oliveira A. L. S., Barmak R., Lima J. A. M., de Almeida F. G., et al. (2016). Investigating flow noise on underwater gliders acoustic data. J. Acoust. Soc Am. 140, 3409–3409. doi: 10.1121/1.4970954
Erbe C., McCauley R., Gavrilov A. (2016). Characterizing marine soundscapes. The Effects of Noise on Aquatic Life II, 265–271. doi: 10.1007/978–1-4939–2981-8_31
Erbe C., Verma A., McCauley R., Gavrilov A., Parnum I. (2015). The marine soundscape of the Perth Canyon. Prog. Oceanogr. 137, 38–51. doi: 10.1016/j.pocean.2015.05.015
Etter P. C. (2012). Advanced applications for underwater acoustic modeling. Adv. Acoust. Vib. 2012, 1–21. doi: 10.1155/2012/214839
European Commission (2010). Commission decision of 1 September 2010 on criteria and methodological standards on good environmental status of marine waters. Off. J. Eur. Union 232, 14–24. doi: 10.25607/OBP-820
Faulkner R. C., Farcas A., Merchant N. D. (2018). Guiding principles for assessing the impact of underwater noise. J. Appl. Ecol. 55, 2531–2536. doi: 10.1111/1365-2664.13161
Filún D., Schall E., Paitach R., Soares-Filho W., Espírito Santo S. R., Paro G. S., et al. (2020). Using an autonomous vehicle (Seaglider) reveals the seasonality of cetaceans in the Santos Basin, Brazil. In: Abstracts of XIII Congresso da Sociedade Latino Americana de Especialistas em Mamíferos Aquáticos, p 51. Bahia, Brazil: Sociedade Latino Americana de Especialistas em Mamíferos Aquáticos.
Gedamke J., Harrison J., Hatch L., Angliss R., Barlow J., Berchok C., et al. (2016). Ocean Noise Strategy Roadmap. Washington, D.C: NOAA.
Glaviano F., Esposito R., Di Cosmo A., Esposito F., Gerevini L., Ria A., et al. (2022). Management and sustainable exploitation of marine environments through smart monitoring and automation. J. Mar. Sci. Eng. 10, 297. doi: 10.3390/jmse10020297
Haver S. M., Adams J. D., Hatch L. T., Van Parijs S. M., Dziak R. P., Haxel J., et al. (2021). Large vessel activity and low-frequency underwater sound benchmarks in United States waters. Front. Mar. Sci. 8. doi: 10.3389/fmars.2021.669528
Haver S. M., Fournet M. E., Dziak R. P., Gabriele C., Gedamke J., Hatch L. T., et al. (2019). Comparing the underwater soundscapes of four U.S. National Parks and marine sanctuaries. Front. Mar. Sci. 6. doi: 10.3389/fmars.2019.00500
Haver S. M., Gedamke J., Hatch L. T., Dziak R. P., Van Parijs S., McKenna M. F., et al. (2018). Monitoring long-term soundscape trends in U.S. Waters: The NOAA/NPS Ocean Noise Reference Station Network. Mar. Policy 90, 6–13. doi: 10.1016/j.marpol.2018.01.023
Howe B. M., Miksis-Olds J., Rehm E., Sagen H., Worcester P. F., Haralabus G. (2019). Observing the oceans acoustically. Front. Mar. Sci. 6. doi: 10.3389/fmars.2019.00426
IMO MEPC.1/Circ.833 (2014). Guidelines for the Reduction of Underwater Noise from Commercial Shipping to Address Adverse Impacts on Marine Life. London: International Maritime Organization.
IMO MEPC.1/Circ.906 (2023). Revised Guidelines for the Reduction of Underwater Radiated Noise from Shipping to Address Adverse Impacts on Marine Life. London: International Maritime Organization.
IOGP (2008). Fundamentals of Underwater Sound. Report No. 406. London: International Association of Oil & Gas Producers.
ISO-18405 (2017). Underwater Acoustics–Terminology. Geneva: International Organization for Standardization.
Jiang C., Li J. L., Xu W. (2019). The use of underwater gliders as acoustic sensing platforms. Appl. Sci. 9 (22), 4839. doi: 10.3390/app9224839
Kaiser B. A., Hoeberechts M., Maxwell K. H., Eerkes-Medrano L., Hilmi N., Safa A., et al. (2019). The importance of connected ocean monitoring knowledge systems and communities. Front. Mar. Sci. 6. doi: 10.3389/fmars.2019.00309
Lewandowski J., Staaterman E. (2020). International management of underwater noise: Transforming conflict into effective action. J. Acoust. Soc Am. 147, 3160–3168. doi: 10.1121/10.0001173
Lima J. A. M., de Paula T. P., Soares-Filho W., Spengler A., de Almeida F. G., Pereira D. P. C., et al. (2022). Monitoramento da Paisagem Acústica Submarina da Bacia de Santos (PMPAS-BS): uma iniciativa brasileira em monitoramento acústico oceânico. Rev. Bras. Meio Ambient. 10, 95–119. doi: 10.5281/zenodo.7321719
Luczkovich J. J., Sprague M. W. (2022). Soundscape maps of soniferous fishes observed from a mobile glider. Front. Mar. Sci. 9. doi: 10.3389/fmars.2022.779540
Merchant N. D., Barton T. R., Thompson P. M., Pirotta E., Dakin D. T., Dorocicz J. (2013). Spectral probability density as a tool for ambient noise analysis. J. Acoust. Soc. Am. 133, 262–267. doi: 10.1121/1.4794934
Merchant N. D., Fristrup K. M., Johnson M. P., Tyack P. L., Witt M. J., Blondel P., et al. (2015). 3-Measuring acoustic habitats. Methods Ecol. Evol. 6, 257–265. doi: 10.1111/2041-210X.12330
Miksis-olds J. L., Martin B. (2018). Exploring the ocean through soundscapes. Acoust. Today 14, 26–34. doi: 10.3233/JAD-2010–100201\r13655M88P45N0707
Minello M., Calado L., Xavier F. C. (2021). Ecoacoustic indices in marine ecosystems: A review on recent developments, challenges, and future directions. ICES J. Mar. Sci. 78, 3066–3074. doi: 10.1093/icesjms/fsab193
Mooney T. A., Di Iorio L., Lammers M., Lin T. H., Nedelec S. L., Parsons M., et al. (2020). Listening forward: Approaching marine biodiversity assessments using acoustic methods: Acoustic diversity and biodiversity. R. Soc Open Sci. 7, 201287. doi: 10.1098/rsos.201287
NOAA (2023) Why should we care about the ocean? Available online at: https://oceanservice.noaa.gov/facts/why-care-about-%0Aocean.html (Accessed December 6, 2023).
OSPAR Commission (2009). Overview of the impacts of anthropogenic underwater sound in the marine environment Biodiversity Series. OSPAR Biodivers. Ser. 441, 1–134. London: OSPAR Secretariat.
Parente Ribeiro C. E. (1982). ’Estação de Acústica Submarina,’ I Simpósio Naval de Sonar Proceedings. Rio de Janeiro, Brazil: Brazilian Navy.
Parente Ribeiro C. E. (1986). Ruído irradiado por navios. Rev. Portos e Navios. Rio de Janeiro, Brazil: Portos e Navios Journal.
Pijanowski B. C., Villanueva-Rivera L. J., Dumyahn S. L., Farina A., Krause B. L., Napoletano B. M., et al. (2011). Soundscape ecology: The science of sound in the landscape. Bioscience 61, 203–216. doi: 10.1525/bio.2011.61.3.6
Pires C. R., Rossi-Santos M. R., Paro A. D., Wedekin L. L. (2021). Whistles of the pantropical spotted dolphin (Stenella attenuata) in Santos Basin, western South Atlantic Ocean. J. Acoust. Soc Am. 149, 3241–3249. doi: 10.1121/10.0004950
Possenti L., Reichart G. J., de Nooijer L., Lam F. P., de Jong C., Colin M., et al. (2023). Predicting the contribution of climate change on North Atlantic underwater sound propagation. PeerJ 11, 1–26. doi: 10.7717/peerj.16208
Rice J. A. (2007). Mathematical statistics and data analysis. 3rd ed. Belmont, CA: Thomson/Brooks/Cole.
Robinson S. P., Lepper P. A., Hazelwood R. A. (2014). Good Practice Guide for Underwater Noise Measurement. NPL Good Practice Guide No. 133. Teddington, UK: National Measurement Office, Marine Scotland, The Crown Estate. doi: 10.25607/OBP-21
Rossi-Santos M. R., Filun D., Soares-Filho W., Paro A. D., Wedekin L. L. (2022). “Playing the beat”: Occurrence of Bio-duck calls in Santos Basin (Brazil) reveals a complex acoustic behaviour for the Antarctic minke whale (Balaenoptera bonaerensis). PloS One 17, 1–13. doi: 10.1371/journal.pone.0255868
Schwardt M., Pilger C., Gaebler P., Hupe P., Ceranna L. (2022). Natural and Anthropogenic Sources of Seismic, Hydroacoustic, and Infrasonic Waves: Waveforms and Spectral Characteristics (and Their Applicability for Sensor Calibration) (Netherlands: Springer). doi: 10.1007/s10712-022-09713-4
Siderius M., Porter M. B. (2008). Modeling broadband ocean acoustic transmissions with time-varying sea surfaces. J. Acoust. Soc Am. 124, 137–150. doi: 10.1121/1.2920959
Soares C., Zabel F., Jesus S. M. (2015). A shipping noise prediction tool In MTS/IEEE OCEANS 2015 – Genova Proceedings: Discovering Sustainable Ocean Energy for a New World. New York: IEEE. doi: 10.1109/OCEANS-Genova.2015.7271539
Soares-Filho W., Barreira L. M., Lima J. A. M., De Paula T. P., De Almeida F. G. (2018). “Evaluation of data measured by acoustic profilers on the Southeast Brazilian Continental Slope,” in 2017 IEEE/OES Acoustics in Underwater Geosciences Symposium (RIO Acoustics). New York: IEEE. 1–4. doi: 10.1109/RIOAcoustics.2017.8349746
Stoica P., Moses R. L. (2005). Spectral analysis of signals. (Upper Saddle River, NJ: Pearson Prentice Hall).
Strasberg M., Taylor D. W. (1979). Nonacoustic noise interference in measurements of infrasonic ambient noise. J. Acoust. Soc Am. 66, 1487–1493. doi: 10.1121/1.383543
Thomsen F., Mendes S., Bertucci F., Breitzke M., Ciappi E., Cresci A., et al. (2021). Addressing underwater noise in Europe: Current state of knowledge and future priorities. Ostend, Belgium: European Marine Board.
Van Parijs S. M., Baker K., Carduner J., Daly J., Davis G. E., Esch C., et al. (2021). NOAA and BOEM minimum recommendations for use of passive acoustic listening systems in offshore wind energy development monitoring and mitigation programs. Front. Mar. Sci. 8. doi: 10.3389/fmars.2021.760840
Keywords: passive acoustic monitoring, soundscape, anthropogenic noise, Santos basin, underwater acoustics
Citation: Lima JAM, Soares Filho W, Xavier FC, Paula TPd, Spengler A, Almeida FGd, Pereira DPC, Rego VS, Galotta C, Corrêa Junior C and Bazyl A (2024) The Brazilian Santos basin underwater soundscape monitoring project (PMPAS-BS). Front. Mar. Sci. 11:1416590. doi: 10.3389/fmars.2024.1416590
Received: 12 April 2024; Accepted: 24 May 2024;
Published: 17 June 2024.
Edited by:
Jay S. Pearlman, Institute of Electrical and Electronics Engineers (France), FranceReviewed by:
Paolo Favali, ERIC foundation (Italy), ItalyCopyright © 2024 Lima, Soares Filho, Xavier, Paula, Spengler, Almeida, Pereira, Rego, Galotta, Corrêa Junior and Bazyl. This is an open-access article distributed under the terms of the Creative Commons Attribution License (CC BY). The use, distribution or reproduction in other forums is permitted, provided the original author(s) and the copyright owner(s) are credited and that the original publication in this journal is cited, in accordance with accepted academic practice. No use, distribution or reproduction is permitted which does not comply with these terms.
*Correspondence: José Antonio Moreira Lima, amFtbGltYUBsYW1jc28uY29wcGUudWZyai5icg==; William Soares Filho, d2lsbGlhbS5zb2FyZXNAbWFyaW5oYS5taWwuYnI=
Disclaimer: All claims expressed in this article are solely those of the authors and do not necessarily represent those of their affiliated organizations, or those of the publisher, the editors and the reviewers. Any product that may be evaluated in this article or claim that may be made by its manufacturer is not guaranteed or endorsed by the publisher.
Research integrity at Frontiers
Learn more about the work of our research integrity team to safeguard the quality of each article we publish.