 Ryo Furue
94% of researchers rate our articles as excellent or good
Learn more about the work of our research integrity team to safeguard the quality of each article we publish.
Find out more
CORRECTION article
Front. Mar. Sci., 05 July 2024
Sec. Physical Oceanography
Volume 11 - 2024 | https://doi.org/10.3389/fmars.2024.1388621
A Corrigendum on
A seasonal undercurrent along the northwest coast of Australia
by Furue R (2022) Front. Mar. Sci. 8:806659. doi: 10.3389/fmars.2021.806659
In the published article, there was an error. As described and discussed below, the analytic solutions (A5) and (A7) were incorrect and owing to the error some of the figures were also incorrect. The author apologizes for this error and states that this does not change the scientific conclusions of the article in any way. The original article has been updated.
Solution (A5) was previously:
The corrected solution appears below:
To introduce the new symbol used in the corrected solution above, the text preceding solution (A5) needs to be modified. It was previously:
The corrected text appears below:
where .
As to solution (A7), the relevant text was previously:
and the solution (A5) is modified to
where .
The corrected text appears below:
and the solution is identical to (A5) except that −ılj of (A5) is replaced with −ılj + (rj/cj) in the present solution.
This change does not affect the rest of the paper because equation number (A7) itself was not referred to anywhere and this was the last equation in the original paper.
Since the analytic solutions (A5) and (A7) are corrected as described above, all figures plotting the solutions are also corrected. They are Figures 12, 13, A1C, and S7. The corrected figures are all very similar to the original ones and some of them are hardly distinguishable from the original ones.
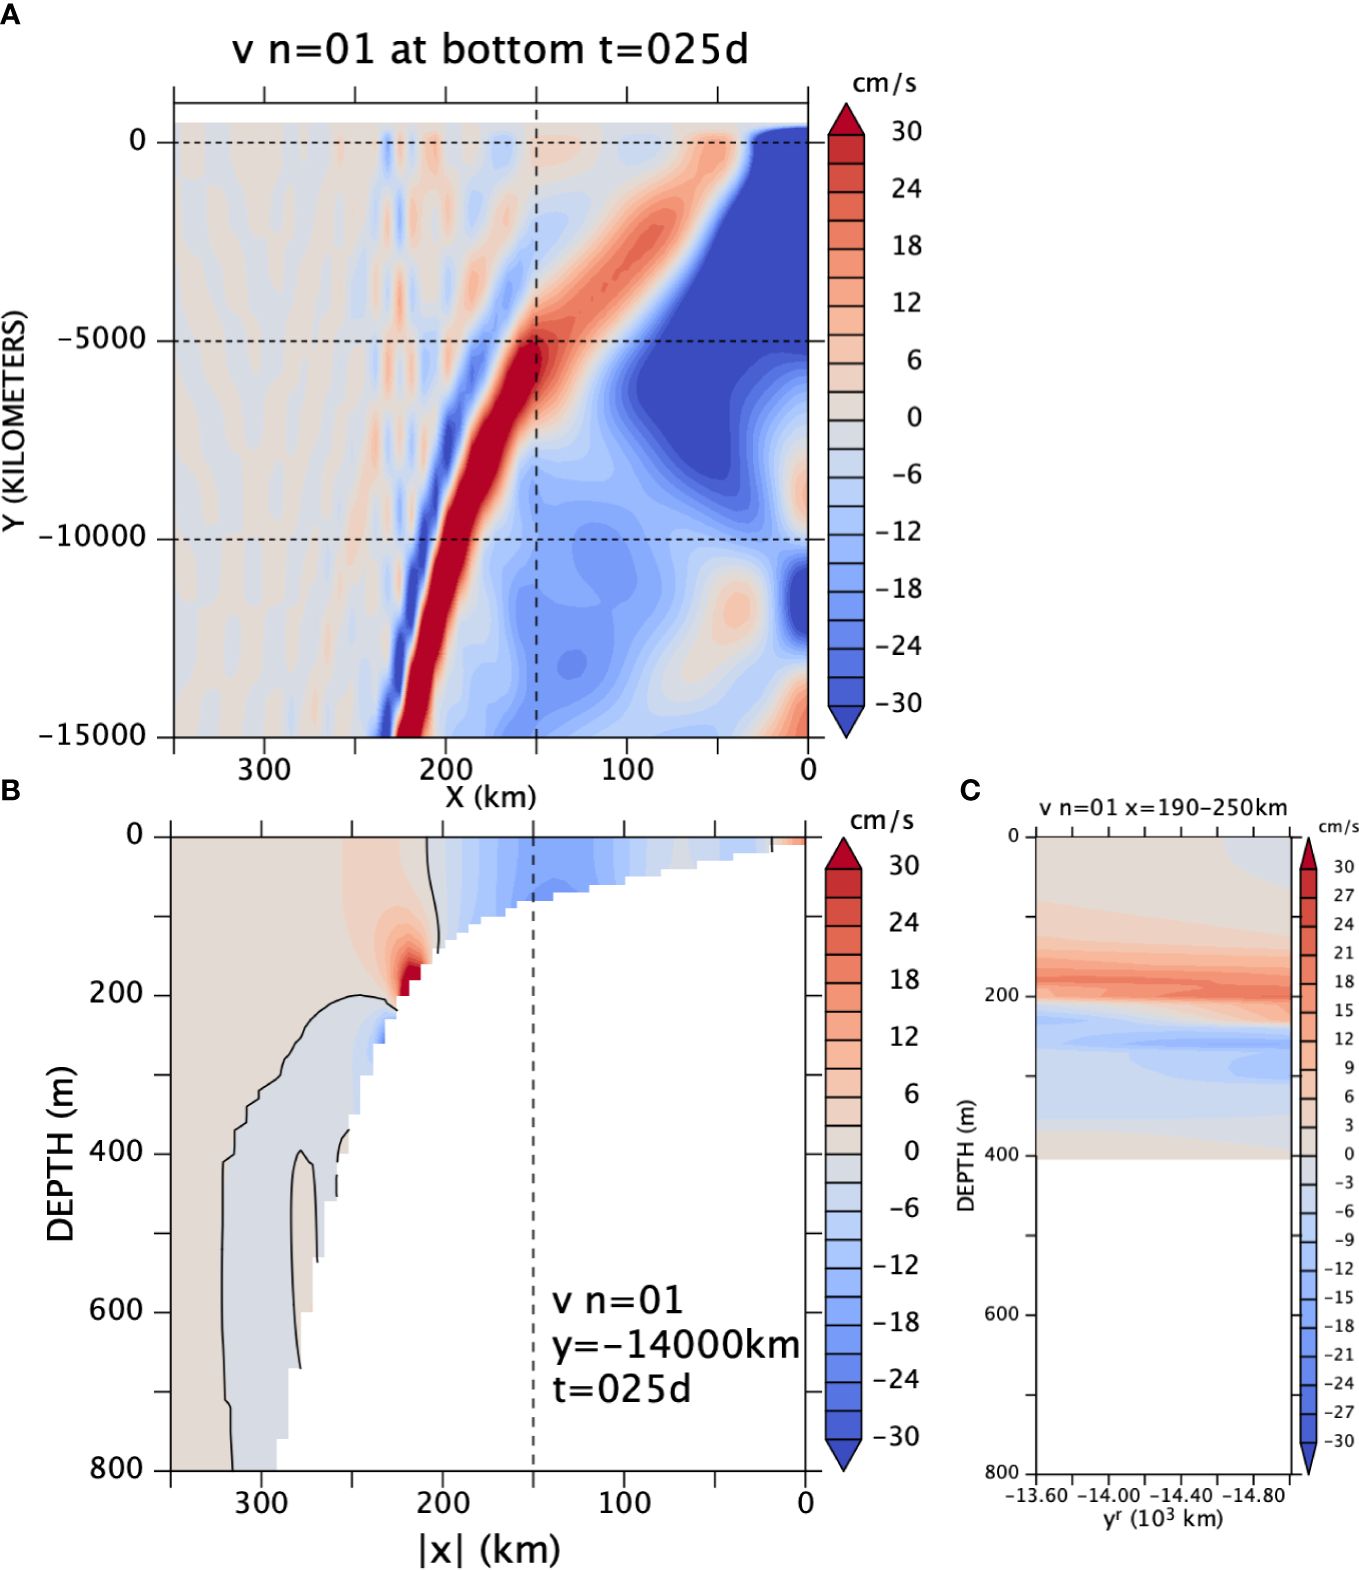
Figure 12 v from the CTW model (A) along the bottom, (B) at y = −14,000 km, and (C) averaged over x = 190–250 km at an arbitrary time for the annual frequency. The y-range for (C) is the southern-most 1,400 km of (A).
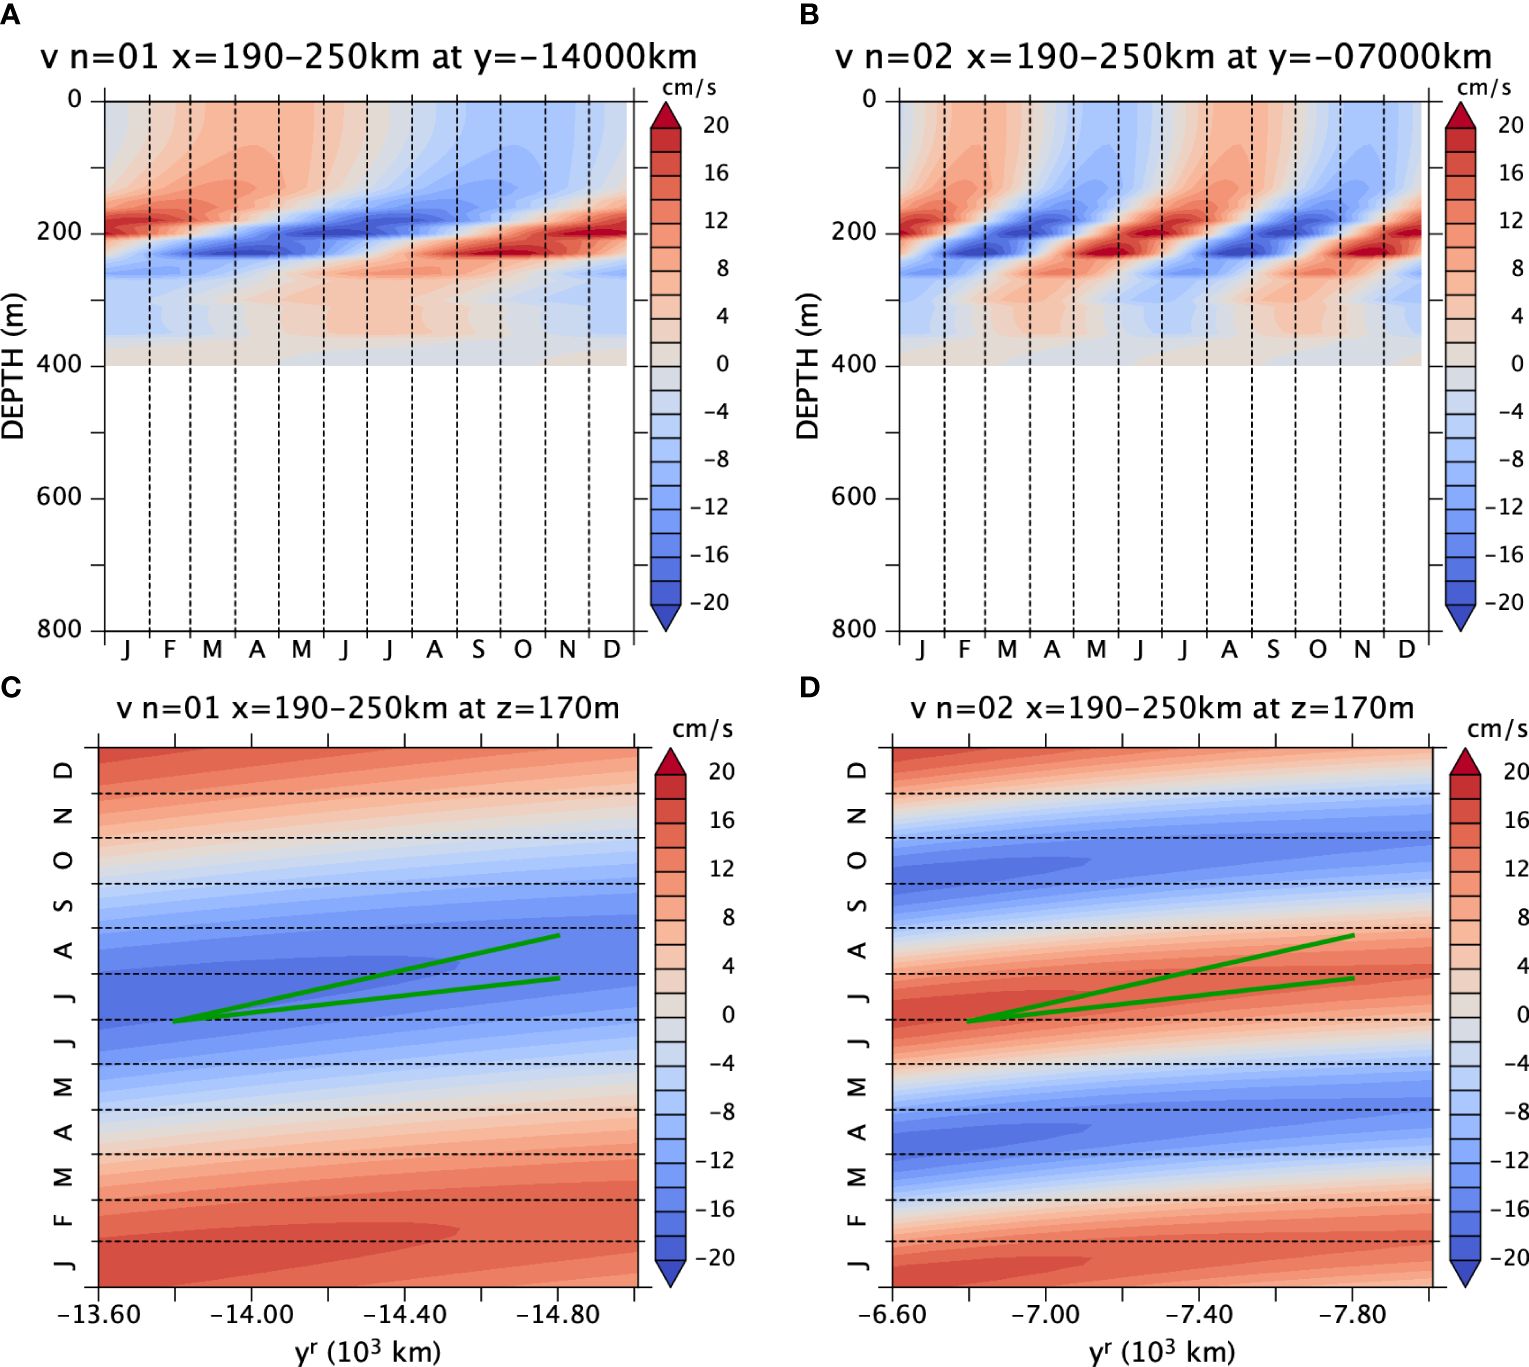
Figure 13 v from the CTW model averaged over x = 190–250 m (A) at y = −14,000 km and (B) at y = −7,000 km; and (C, D) at z = −170 m (A, C) for the annual frequency and (B, D) for the semi-annual frequency. The green line segments indicate speeds of 0.2m/s and 0.4m/s. Note that the latitudinal ranges are different between the annual (A, C) and semi-annual (B, D) frequencies because the beam emerges to the continental slope earlier for the semi-annual frequency. Note also that the range of coloring is narrower (±20 cm/s) here than in Figure 12 because the zonal average weakens the values.
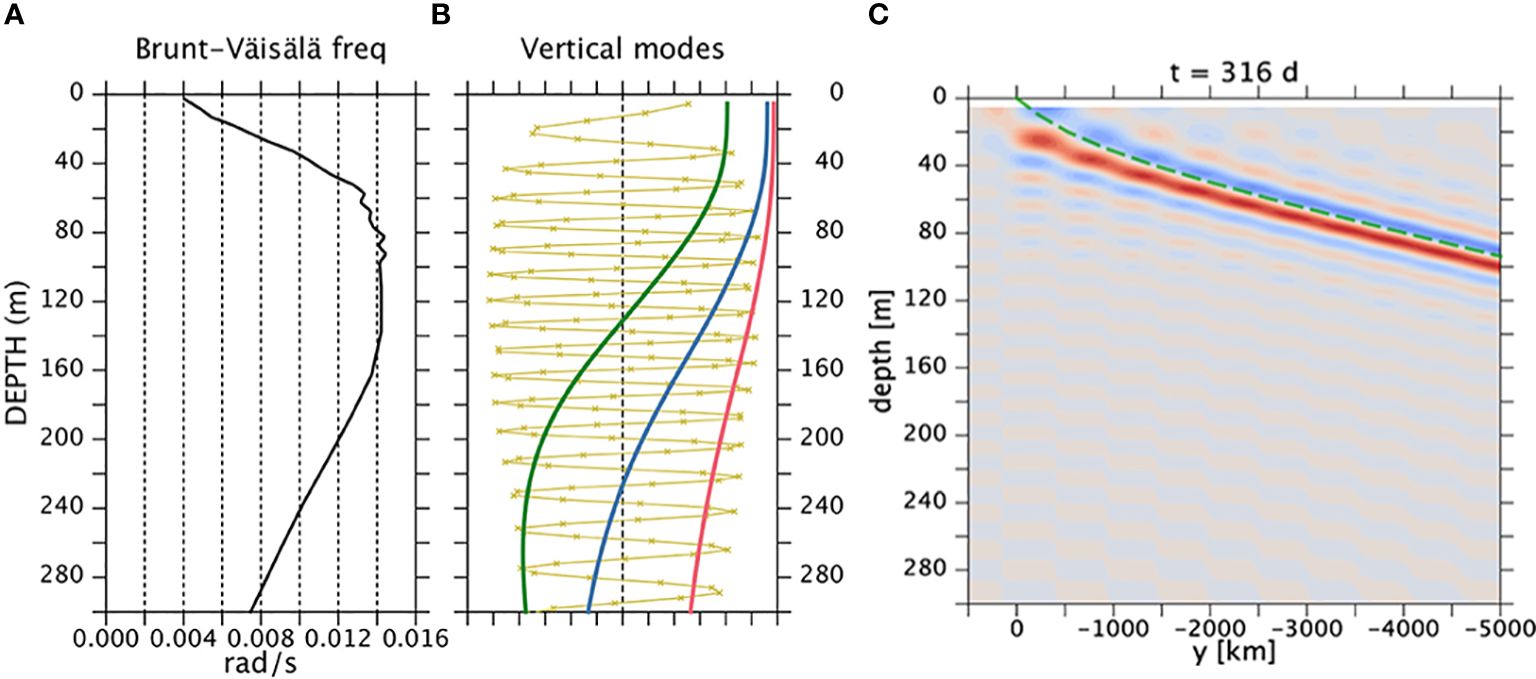
Figure A1 (A) Mean Brunt-Väisälä frequency N(z) based on WOA13 and (B) vertical modes 1, 2, 3, and 100 (red, blue, green, and yellow). The dots on the j = 100 mode indicate the gridpoints for the numerical calculation of Equation (4). (C) Meridional velocity (snapshot at an arbitrary time and at x = 0, eastern boundary) of coastal Kelvin wave on an f plane forced by an annual wind. The velocity field is constructed as a sum of 100 modes [ j = 1–100 in formula (1). The total depth is 5,000 m; only the upper 300 m is shown. The green dashed curve is a WKB ray starting from the southern edge of the forcing region (y > 0). See text for details.
All claims expressed in this article are solely those of the authors and do not necessarily represent those of their affiliated organizations, or those of the publisher, the editors and the reviewers. Any product that may be evaluated in this article, or claim that may be made by its manufacturer, is not guaranteed or endorsed by the publisher.
Keywords: eddy-resolving oceanic general circulation model, annual cycle, North West Shelf, eastern boundary, coastal trapped waves
Citation: Furue R (2024) Corrigendum: A seasonal undercurrent along the northwest coast of Australia. Front. Mar. Sci. 11:1388621. doi: 10.3389/fmars.2024.1388621
Received: 20 February 2024; Accepted: 27 February 2024;
Published: 05 July 2024.
Edited and Reviewed by:
Zhiyu Liu, Xiamen University, ChinaCopyright © 2024 Furue. This is an open-access article distributed under the terms of the Creative Commons Attribution License (CC BY). The use, distribution or reproduction in other forums is permitted, provided the original author(s) and the copyright owner(s) are credited and that the original publication in this journal is cited, in accordance with accepted academic practice. No use, distribution or reproduction is permitted which does not comply with these terms.
*Correspondence: Ryo Furue, cnlvZnVydWVAZ21haWwuY29t
Disclaimer: All claims expressed in this article are solely those of the authors and do not necessarily represent those of their affiliated organizations, or those of the publisher, the editors and the reviewers. Any product that may be evaluated in this article or claim that may be made by its manufacturer is not guaranteed or endorsed by the publisher.
Research integrity at Frontiers
Learn more about the work of our research integrity team to safeguard the quality of each article we publish.