
94% of researchers rate our articles as excellent or good
Learn more about the work of our research integrity team to safeguard the quality of each article we publish.
Find out more
ORIGINAL RESEARCH article
Front. Mar. Sci., 20 December 2023
Sec. Physical Oceanography
Volume 10 - 2023 | https://doi.org/10.3389/fmars.2023.1294189
 Verónica Morales-Márquez1
 Alejandro Cáceres-Euse1*
 Ismael Hernández-Carrasco2
 Anne Molcard1
 Alejandro Orfila2*
The extreme wave height distribution in the Caribbean Sea is studied using a new method based on the maximum basin-wide aggregate of significant wave height, Hs, values per month. Besides, by means of the Self-Organizing Maps (SOM) technique, we identify coherent geographical regions with similar extreme wave height variability in the Caribbean Sea. Our findings revealed three primary regions: the eastern side with comparatively lower values, the central region with intermediate values, and the western side with the highest extreme wave heights. The study also examines the wind forcing conditions driving the spatial and temporal variability of the extreme waves, highlighting the influence of the low-pressure belt dynamics as well as the role played by the Caribbean Low-Level Jet (CLLJ) index, and the impact of cold fronts and hurricanes on extreme wave heights. Additionally, we explore the relationship between the extreme wave height distribution and climatic indices, such as the Atlantic Multidecadal Oscillation (AMO), the Atlantic Meridional Mode (AMM), the North Atlantic Oscillation (NAO) and the Oceanic Niño (ONI). The results reveal that the spatial distribution of extreme wave heights in the Caribbean Sea is mostly ruled by the influence of the CLLJ, with correlations close to 80%. In addition, significant correlations were observed between the extreme wave heights and the ENSO in the central Caribbean, as well as positive correlations between the extreme wave heights and NAO in the eastern part of the basin, and significant values of correlation with the negative phases of AMO and AMM in the whole basin. We show that, unlike conventional (or broadly used) methods deployed to identify extreme wave height, such as percentile 99th, , our methodology allows a further assessment of the wind and climate forcing conditions associated with the extreme wave events. Although, we acknowledge that the method here presented has limitations to capture extreme wave height outliers, it has the advantage of being used concomitant with the wind forcing to develop multivariate wave climate analysis at basin scale, and could be extended to a more local scale when studying coastal processes.
Extreme events refer to meteorological and oceanographic conditions that are characterized by their infrequent occurrence, intense nature or severe impact (Beniston et al., 2007) and deviate significantly from normal conditions, exhibiting large magnitudes that are outside the typical range of occurrence. In the ocean, they can refer to a wide range of abrupt changes of physical variables related for instance to sea temperatures, sediment outpourings, occurrence of storms, tropical cyclones, hurricanes or storm surges among many others. Undoubtedly by definition of extreme, they have significant impacts on marine ecosystems as well as in conditioning the physical and morphological aspects of ocean and coastal areas (Morales-Márquez et al., 2018; Orejarena-Rondón et al., 2019; Cueto and Otero, 2020). Thus, understanding the role played by physical processes over ecosystems is necessary to address the social and ecological challenges posed by these events (Group et al., 2011; Bernal et al., 2016; Walz et al., 2021).
Extreme events are hardly predictable and can pose threats to the environment; additionally, the climate change exacerbates these hazards, leading to rising sea levels, increased air and sea surface temperatures, and inducing more extreme meteorological events (Martín et al., 2023). Despite its difficult predictability, their frequency and intensity can be linked to some well-known large scale climatic phenomena such as El Niño, Southern Oscillation (ENSO), the North Atlantic Oscillation (NAO), the Atlantic Multidecadal Oscillation and the Atlantic Meridional Mode (AMM) indices, as well as to global climate change (Field et al., 2018; Morales-Márquez et al., 2020), making their characterization more feasible.
The Caribbean Sea, is particularly vulnerable to extreme climate events (Devis-Morales et al., 2017; Sánchez-Núñez et al., 2019). This region faces threats such as tropical storms, hurricanes, droughts, heavy rainfall, and tsunamis (Marengo et al., 2009; Ramenzoni et al., 2020; Sayol et al., 2022). Indeed, the Caribbean has already experienced significant economic losses, with over 165 extreme climate events occurred between 1999 and 2008, causing more than $136 billion in damages (Report, U. N, 2010). In addition, recently, the United Nations Development Program reported that countries in the Caribbean suffer annual losses corresponding to an average of about 17% of their gross domestic product (GDP), according to the International Disaster Database EM-DAT (CRED, 2022) for the period between 1963-2017. For instance, one of the most severe cases occurred in 2017 in Dominica, where the losses reached 253% of GDP due to damages caused by the Hurricane Maria (UNDP, 2023).
The economic activities in the Caribbean heavily rely on natural resources, with tourism being the most prominent industry (Pérez et al., 2022). Although sectors such as mining and mineral extraction also contribute to the economic growth (Report, 5 March 2010). These industries are highly vulnerable to extreme meteorological events, particularly hurricanes. Moreover, over the past decade, there has been a notable rise in offshore oil and gas operations within the Colombian basin (Porto Solano et al., 2017), as well as an emerging trend that advocates for renewable energy sources like offshore wind energy (Rueda-Bayona et al., 2019). Therefore, highlighting the importance of comprehending extreme weather conditions to ensure the safe implementation and development of this sector.
In the Caribbean Sea, tropical storms, hurricanes, and cold fronts pose major threats to life, and coastal and offshore structures (Kaiser, 2008). Trade winds and cold fronts from the north influence the region’s climate patterns. Research has been conducted on hurricane behavior (Ortiz, 2009; Ortiz Royero, 2012; Montoya et al., 2018; Rey et al., 2021; Roldán et al., 2023), nonetheless, there is a need for more studies focusing on the characterization of extreme waves along the whole Caribbean Sea.
Obtaining accurate wave data in the Caribbean is challenging due to limited availability of buoys with long records, scattered observations from ships during extreme wave conditions, and few satellite data that rarely captures extreme events. To overcome these obstacles, numerical modeling is an important alternative for analyzing long-term climate trends. It helps compensate for the lack of comprehensive observational data and provides valuable insights about the spatial wave patterns and extreme events (Vinoth and Young, 2011; Ortiz et al., 2014; Orejarena-Rondón et al., 2023).
Based on this background, in this paper, we analyze the spatial and seasonal distribution of extreme waves. We examine the influence of various factors such as the low-pressure belt dynamics, cold fronts, and hurricanes on wave heights, and explore the relationship between the extreme wave height distribution and the modes of climate variability. The paper is structured as follows. In Section 2, the study area is described as well as the general wave dynamics. In Section 3, the data and method used and the description of extreme waves are presented. In Section 4, we show and discuss the results of the spatio-temporal variability of extreme waves and its connection with the main climatic modes. Finally, Section 4 concludes the work.
The Caribbean Sea, located between 9°N – 21°N and 88°W–60°W, is a semi enclosed basin bordered by the Lesser Antilles at the east, the Greater Antilles at the north, the eastern portion of Central America at the west and the northern coasts of South America at the south (Figure 1). The wave dynamic in the basin is mainly controlled by the westward surface trade winds, which show a large seasonality, and a low-level wind core with higher speeds that gives origin to the Caribbean Low Level Jet (CLLJ) with a kernel located at the center of the basin (Poveda et al., 2006; Orfila et al., 2021; López-Álzate et al., 2022). Wind seasonality is associated with the meridional migration of the Inter Tropical Convergence Zone (ITCZ), which is also responsible for the path and penetration of transient features as cold fronts and tropical storms. From August to November, the ITCZ is located at a latitude between 10–12°N, and weaker southern trade winds reach the basin (see Figure S1 in Annex 1 for the seasonal characterization of monthly extreme wind regime in the basin), contributing to the formation and even strengthening of tropical convective storms that may reach hurricane category over the western Caribbean Sea (Andrade et al., 2013). In addition, based on local hydrology, two well-marked periods can be defined in the Caribbean region: the rainy season and the wet season. However, when considering the combined factors of wind, temperature, and rainfall, a more coherent seasonal classification emerges. This classification includes the wet season from September to November, the dry season from December to March, a transitional season from April to May, and the phenomenon known as the “Veranillo de San Juan” occurring from June to August (Moron et al., 2016). These seasons are mainly driven by the location of the ITCZ and the cycle of the American Monsoon System.
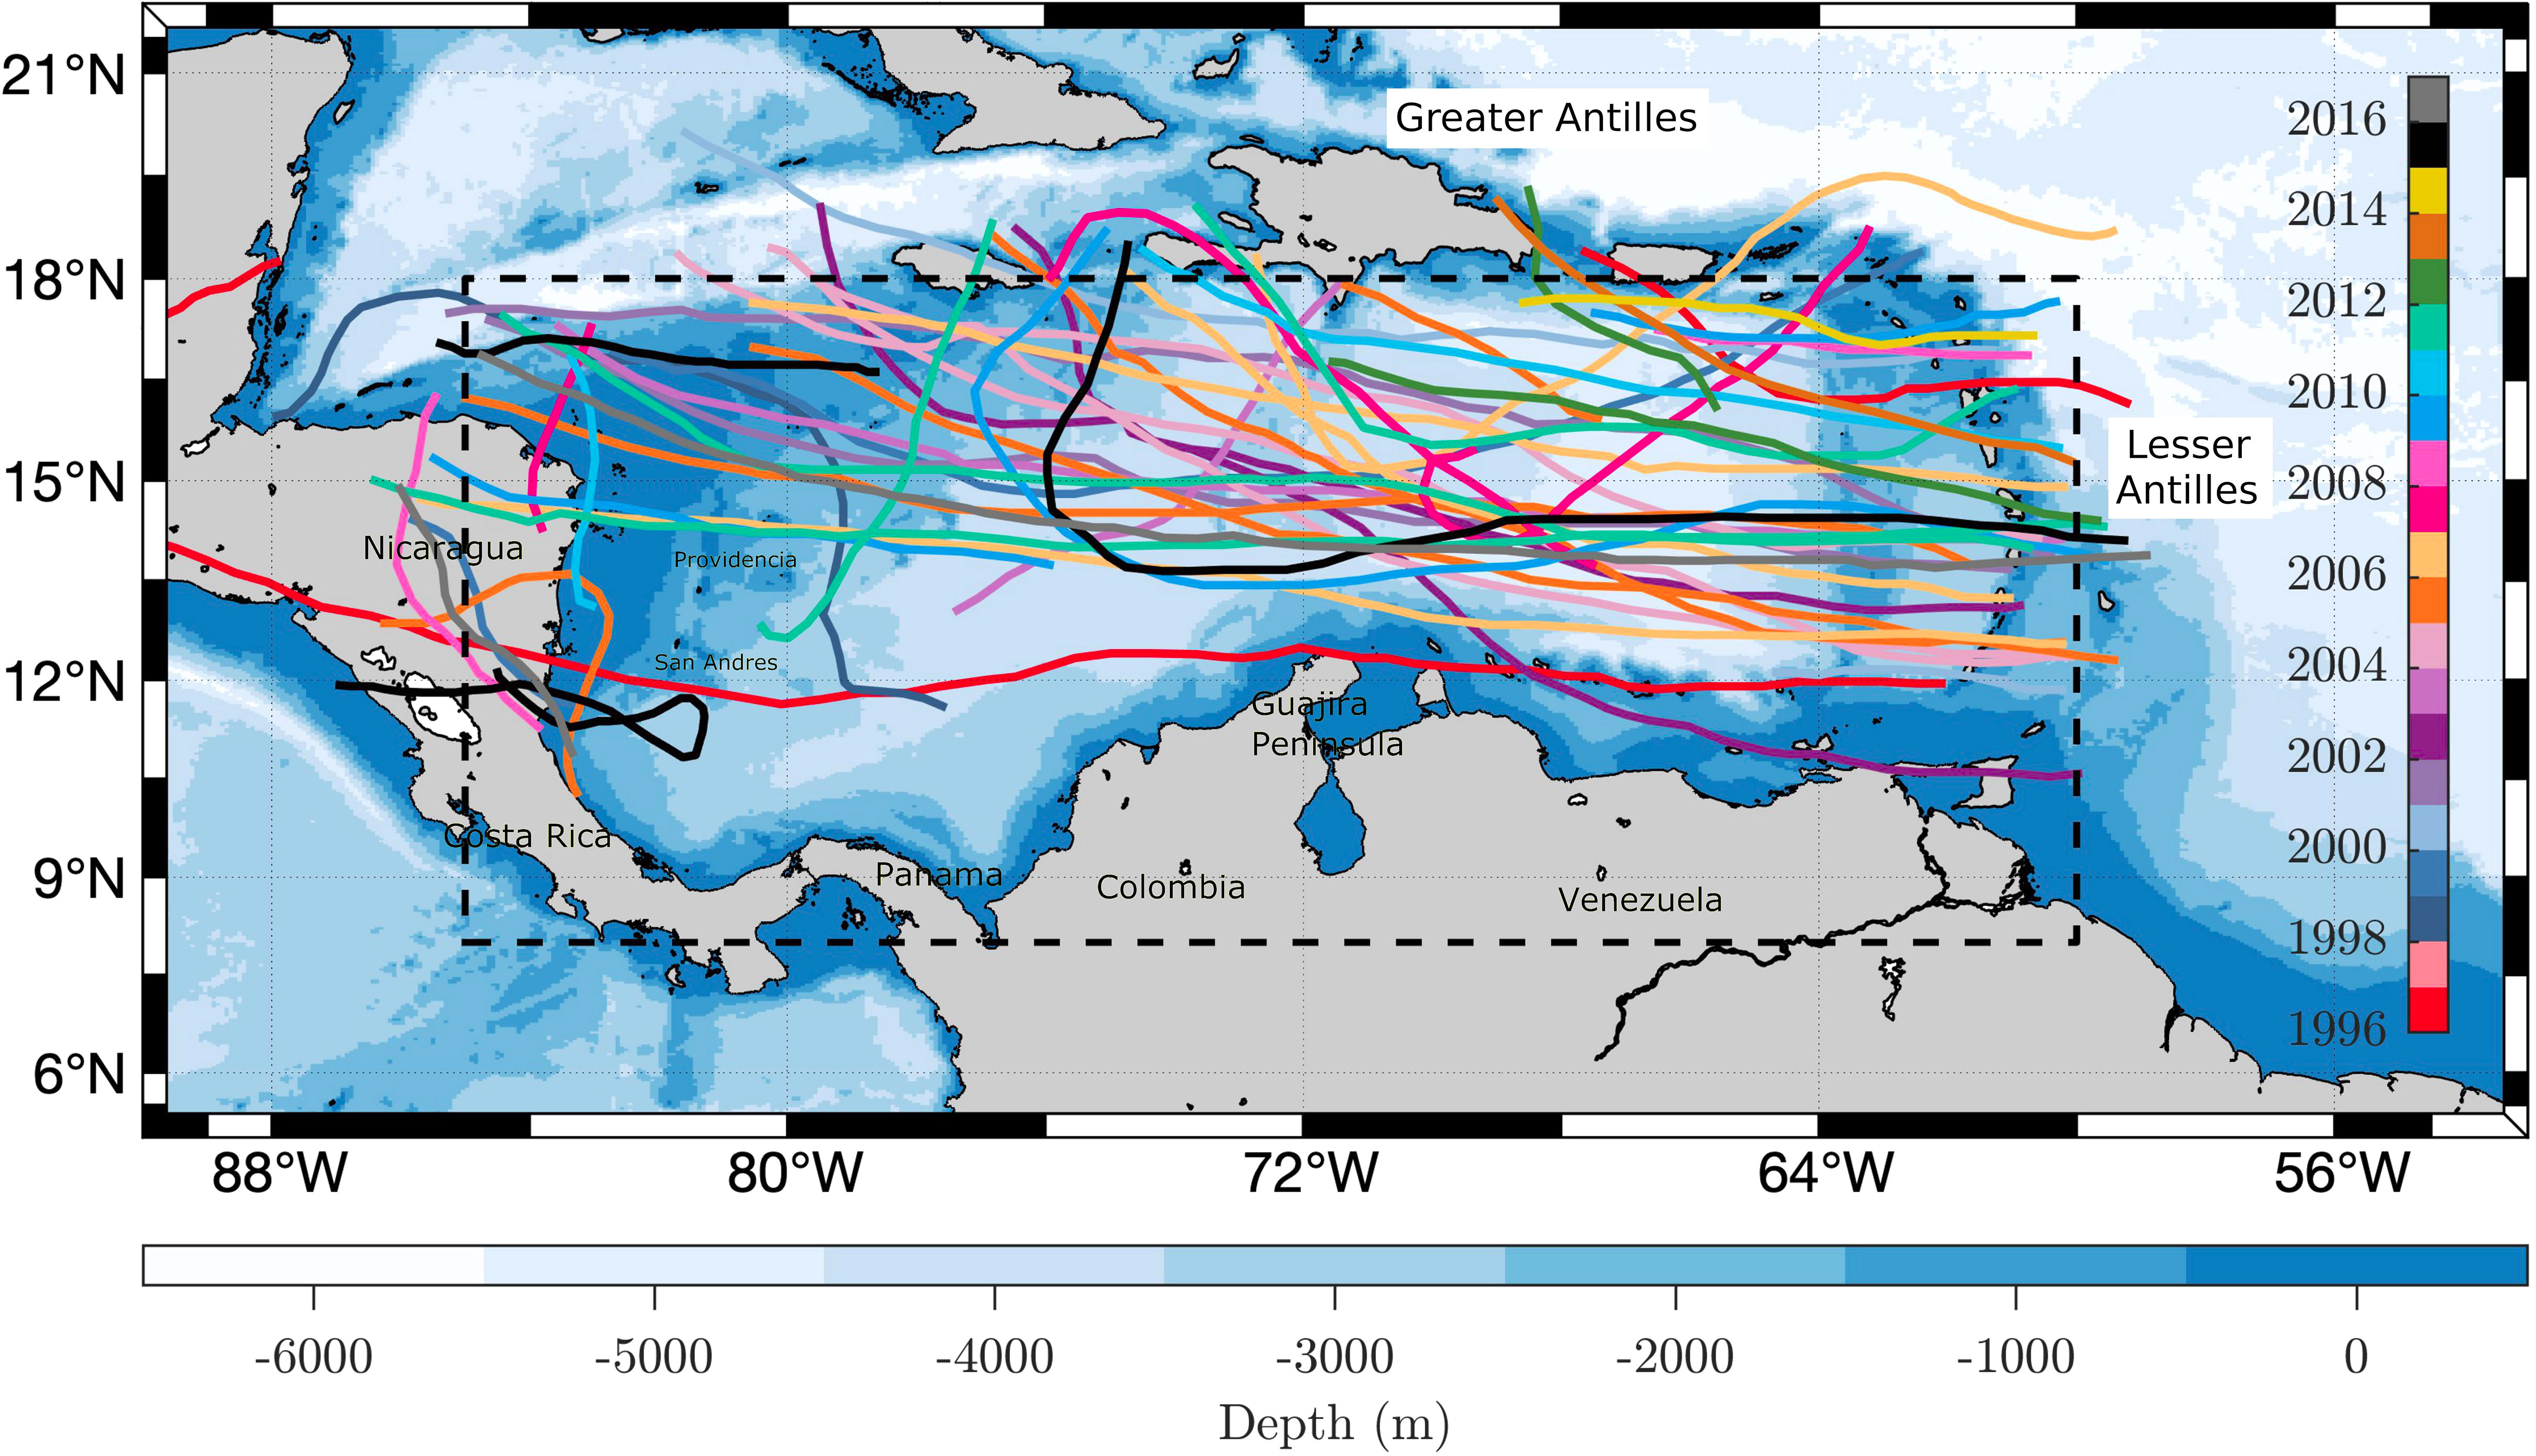
Figure 1 Geographic sketch of the Caribbean Sea corresponding to the wave model domain with the background colour indicating the bathymetry depth (in m). Dash dotted box correspond to the hindcast model domain area and the color paths to the different hurricane paths between 1996 and 2017 crossing the area (data digitized from https://www.nhc.noaa.gov/data/tcr/, last access 05/31/2023). Toponyms cited in the main text appear in the figure.
In the Caribbean Sea, the threat of significant waves extends beyond just hurricanes, tropical storms, and cold fronts. While these weather phenomena do contribute to the hazardous wave conditions, it is important to note that even the trade winds can generate waves surpassing 6 m in height (Orejarena-Rondón et al., 2023). Therefore, a variety of factors, including trade winds, hurricanes, tropical storms, and cold fronts, collectively pose a significant risk to marine traffic, coastal areas, and offshore structures in the Caribbean Sea (Royero et al., 2014). As stated by Devis-Morales et al. (2017), reports of large waves are recorded in the marine-weather bulletins of the Colombian Oceanographic and Hydro-graphic Research Center during different months from those of the hurricane season.
For the time span from 1958 to 2017 with a time resolution of 6-hourly, a wave hindcast using the SWAN model was performed in the Caribbean basin (Orejarena-Rondón et al., 2021). The model encompassed a domain of 229 × 101 grid points, resulting in a spatial resolution of approximately 11.5 km. This domain covered the southern Caribbean Sea, stretching from the coast of Colombia and Venezuela to the Greater Antilles in the north, and from the Lesser Antilles in the east to the coasts of Panama and Nicaragua in the west (Figure 1).
The wind data used in this study were sourced from the JRA-55 database, which was specifically developed to provide a comprehensive dataset of atmospheric conditions from the latter half of the 20th century to the early 21st century. This database is widely recognized for its suitability in studying multidecadal variability and climate change (Kobayashi et al., 2015). It offers the highest overall spatial and temporal resolution, with wind data available at 3-hour intervals. For our specific region of interest, the wind data at a 10-m height (U10, V10) were available at a spatial resolution of approximately 60.8 km.
The growth of waves driven by wind was modeled using an exponential and nonlinear deep-water interaction approach based on the Webb-Resio-Tracy method (Booij et al., 1999). To represent the wave spectrum, a JONSWAP spectrum with a parameter value of γ = 1.37 was employed. For the directional resolution, 120 circle subdivisions were utilized, and the frequency range spanned from 0.05 to 0.585 Hz. To validate the simulated waves, a comparison was made with in-situ wave data collected by NOAA (https://www.ndbc.noaa.gov/) and DIMAR buoys situated in the Central Caribbean and along the continental coastline of the Colombian Caribbean. For further insights into the model parameters, interested readers can refer to Orejarena-Rondón et al. (2021) and Orejarena-Rondón et al. (2023).
To explore possible links with the ENSO, we use the ONI Index, which is a 3-month running average of the temperature anomaly difference from the average surface waters of the east central tropical Pacific (https://origin.cpc.ncep.noaa.gov/products/analysis_ monitoring/ensostuff/ONI _v5. php. Last access March 15, 2023). Regarding the connection of the extreme waves and the NAO, we analyze its monthly average value. This index is calculated by measuring the difference in surface sea-level pressure between the Subtropical (Azores) High and the Subpolar Low. To construct the NAO index, the daily difference of pressure is projected into the first mode of a Rotated Empirical Orthogonal Function (EOF) analysis using monthly mean 500 millibar height anomaly data from 1950 to 2000 over 0− 90°N latitude (Barnston and Livezey, 1987). For more details about the NAO index, you can refer to the website: https://www.cpc.ncep.noaa.gov/products/precip/CWlink/pna/norm.nao.mont hly.b5001.current.ascii.table, (Last access March 15, 2023). In addition, we study the link between the extreme waves and the AMO and the AMM indices. The AMO index is defined as an averaged representation of North Atlantic sea surface temperature anomalies, which have been filtered to remove trends and subjected to low-pass filtering, with the aim of characterizing low-frequency variations within the Atlantic, occurring over time frames exceeding a decade Enfield et al. (2001); Sutton and Hodson (2005). For more details, readers can consult NOAA webpage: https://psl.noaa.gov/data/timeseries/AMO/ (last access October 26, 2023). The AMM index describes the meridional variabilty in the tropical Atlantic Ocean and it is determined by using the Maximum Covariance Analysis (MCA) method on two variables: the sea surface temperature (SST) and the U10 and the V10 components. The trend and the seasonal cycle are removed, a three month running mean is applied to the data and a linear fit to the ENSO variability Kossin and Vimont (2007); Vimont and Kossin (2007). For additional information about the AMM index, readers can consult https://psl.noaa.gov/data/ti meseries/monthly/AMM/ (last access October 26, 2023). Finally, we use data of the Caribbean Low-Level Jet index to explain the principal driver of the ocean waves in the Caribbean Sea (Wang, 2007), the monthly dataset is available through the website http://iridl.ldeo.columbia.edu/SOURCES/.NOAA/.NCEP-NCAR/.CDAS-1/.MONTHLY/.Intrinsic/.PressureLevel/.u/P/925/VALUE/Y/12.5/17.5/RANGE/X/-80/-70/RANGE/[X/Y]average/dup/T/(1981)/(2010)/RANGE/[T]average/sub/-1/mul/DATA/-10/10/RANGE//name//cllji/def//long_name/(Caribbean%20Low%20Level%20Jet%20Index)/def/dup/index.html (last access October 27, 2023).
To obtain reliable trends of extreme values, both long-term time-series and high frequency data are necessary (Young et al., 2011). Conventional methods, such as the monthly 99th-percentile of Significant Wave Height (), are considered robust estimations of extreme events according to the wave model frequency output. A first dataset of 60-years monthly extreme waves is built using this method, by selecting for each grid point the monthly Hs maximum.
In this study, we introduce a new method to estimate extreme events, aiming to capture not only the spatial and temporal distribution of extreme waves but also the underlying climatic factors driving these events.
The method is based on the selection of the basin-wide Hs field corresponding to the date in each month (tM) where the aggregate (or averaged) Hs value over the whole basin is maximum, defined as:
where is the maximum aggregate value per month of the 6-hourly Hs snapshots. The size of the snapshot, represented by m and n, refers to the longitudinal and latitudinal axis of the basin, respectively, taking into account the Hs in each grid point for each t snapshot. By employing this method, we are able to identify the dates when the highest sum () of Hs occurs taking into account the entire basin. Consequently, we can select the Hs during these dates (hereinafter ) as well as determine the corresponding wave period, direction and the characteristics of the associated wind forcing.
Figure 2 illustrates an example of the resulting and for the month of July 1972. The upper panel depicts the spatial distribution of , with each pixel representing the value for that specific month. In the lower panel, we observe the for July 27th, 1972 at 12: 00 PM, corresponding to the maximum aggregate value obtained using Equation 1. This second analysis allows us to associate the spatial distribution of the aggregate extreme waves with the corresponding wind pattern. It is worth noting that the first method (using in each pixel) may yield unsmoothed patterns compared to the aggregation method. This discrepancy arises because the method incorporates potentially different and distant times in the calculation. However, both methods yield maps that are remarkably similar in terms of spatial distribution and significant wave height values.
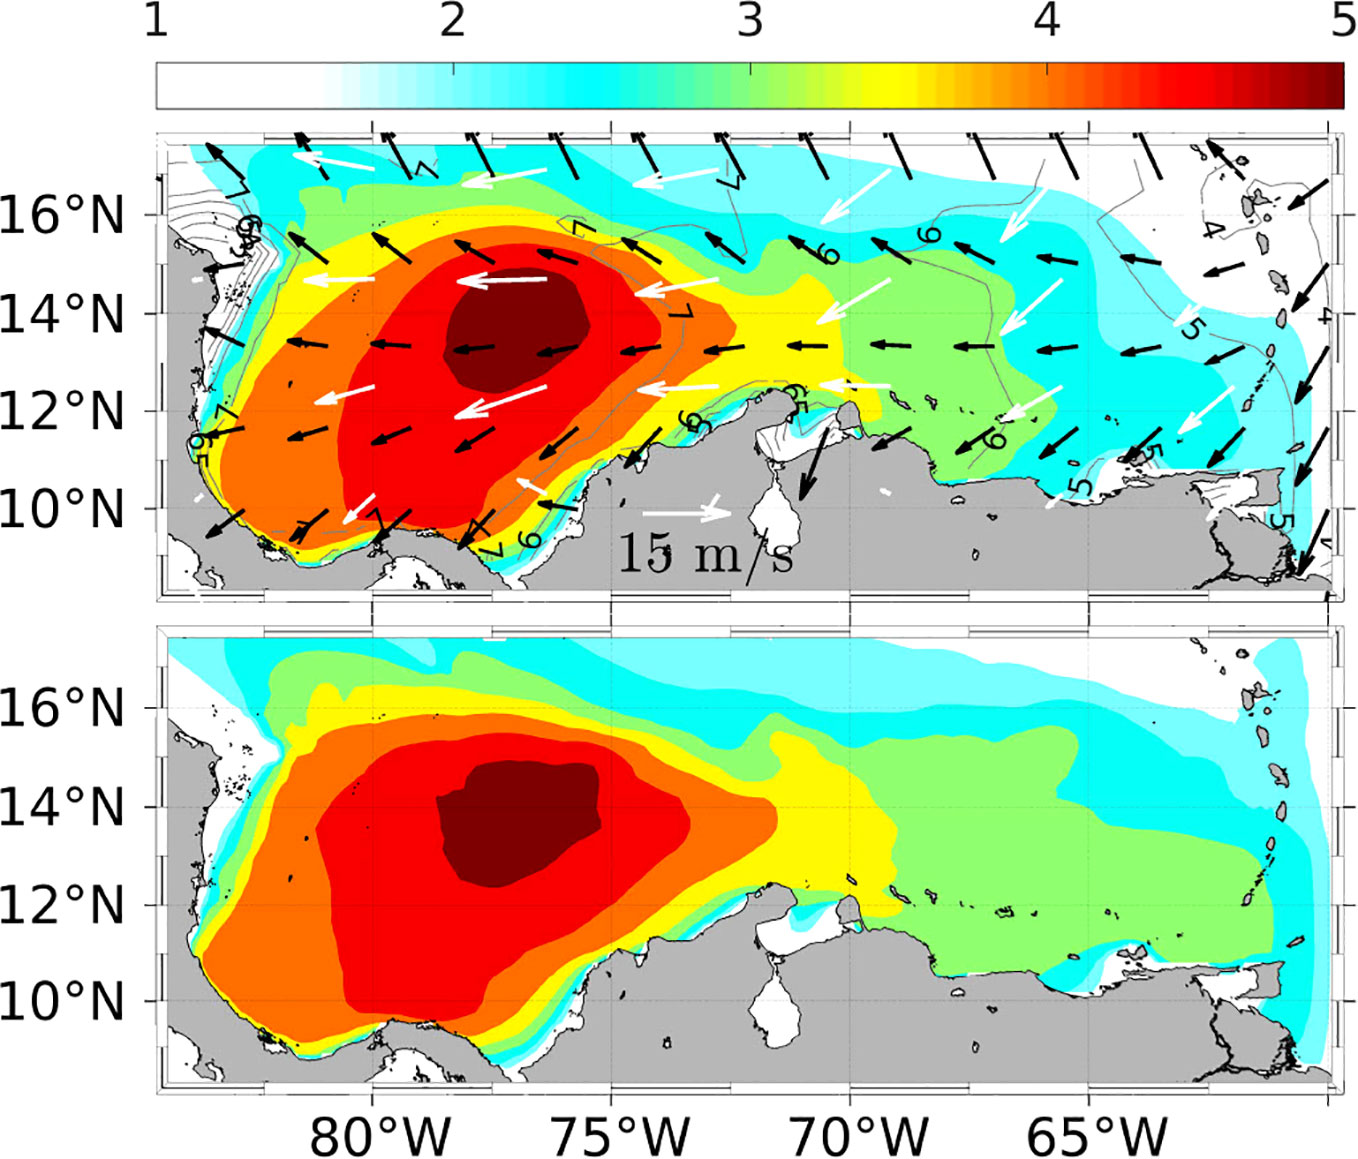
Figure 2 Maximum value of significant wave height (units in m) obtained for the aggregation method (top panel) for July 27th 1972 at 12:00 PM and for July 1972 according to the 99th-percentile (lower panel). In the former, black arrows indicate direction of waves (only 1 on every 11 is displayed) and white arrows direction of winds (only 1 every 8 is displayed).
The SOM is an unsupervised learning neural network especially suited to extract nonlinear patterns in large datasets. SOM is a classification tool used to map high-dimensional input data onto a two-dimensional space, while preserving the topological relationships between the input data (Liu et al., 2006). The input data are clustered in units, called neural units or neurons. The number of units is the same as the size of the SOM array (or lattice), where each unit has a weight vector (mi) that has the number of components equal to the dimension of the input sample data.
The learning process algorithm consists of the presentation of the input data to the SOM during an iterative process. In each iteration, the unit with the weight vector that has the closest Euclidean distance to the presented input data is chosen as the winner unit, also known as the best matching unit (BMU),
The distance measure, denoted by || · ||, is used to calculate the similarity between the weight vector of the best matching unit (BMU) and the presented input data. The index ckrepresents the BMU’s position on the resulting neural network after the training process in relation to the input data k.
During the training iteration, the BMU, along with its neighboring units in the lattice, is updated by moving it towards the input sample. This update process takes into account the topological relationships among the units and is guided by a neighborhood function denoted as h. To improve computational efficiency, the batch version of the SOM algorithm, as described by Vesanto and Alhoniemi (2000), has been employed in this study. In this version, all the input data are used simultaneously to update the weight vectors, providing computational advantages over other methods (Liu and Weisberg, 2005),
where M is the size of the lattice, is the mean of the n data vectors in group j, and hij(t) represents the neighborhood function value at unit j centred on the unit i. Regarding the neighborhood function h, the Epanechnikov neighborhood function has been selected. This choice is motivated by its superior performance in the batch training process, as evaluated through metrics such as the average quantization error (QE), the topological error (TE) and computational cost (Liu et al., 2006).
The SOM technique can be applied both in the spatial (Orfila et al., 2021; Cáceres-Euse et al., 2022) and temporal domains (Morales-Márquez et al., 2021; Torres et al., 2023), according to the objective of the study. Here we are interested in the regionalization of extreme events based on its temporal variability, so a temporal SOM analysis is performed on the two and datasets. The training process is performed using a data input of 720 snapshots (i.e., 60 years of monthly data), in order to characterize the temporal extreme wave features in the Caribbean. First, to avoid that any of the variables dominates over the others during the SOM training, the input data was normalized to variance equals one; latter, the shape of the lattice was defined using an hexagonal lattice structure and we use a random initialization. A 3 × 3 SOM lattice array (9 neurons) was selected after a sensitivity test to find the minimum QE and TE based on several SOM training runs (Hernández-Carrasco and Orfila, 2018; López-Álzate et al., 2022).
The Wavelet Coherence (WTC) analysis helps us determine the correlation between two variables by identifying their dominant frequencies, phase relationships, and time periods in which their variations are linked to each other. In essence, it provides insights into how the two variables are connected over time. Mathematically, the WTC of two time series, denoted as xn and yn, is defined as:
where S is a smoothing operator, WX(s) and WY(s) are the wavelet transforms for each time series for a wavelet scale s, WXY(s) is the cross wavelet transform and s− 1 is used to convert to power density. and are the wavelet and cross wavelet powers (respectively). The argument expressed by arg is the relative phase between the two time series in time-frequency space. This can be visualized as arrows, pointing right for in-phase, left for anti-phase, upward 90° when yn leads xn, and downward 90° when xn leads yn. The Wavelet Coherence (CWT) is a value between 0 (no correlation) and 1 (full correlation), providing information about the relative phase relationship between the two variables (see Torrence and Compo (1998), for more details).
Figure 3 displays the mean extreme significant wave height (a and c panels) and the regionalization resulting from the temporal SOM analysis (b and d panels). Each color in b and d panels corresponds to a SOM temporal pattern, representing regions with similar monthly temporal variability of extreme significant wave height. The top figures correspond to the method, while the bottom figures correspond to the method. The time series obtained from the SOM analysis in the time domain represent statistical representations of the monthly and values over a 60-year period (Figures 4, 5).
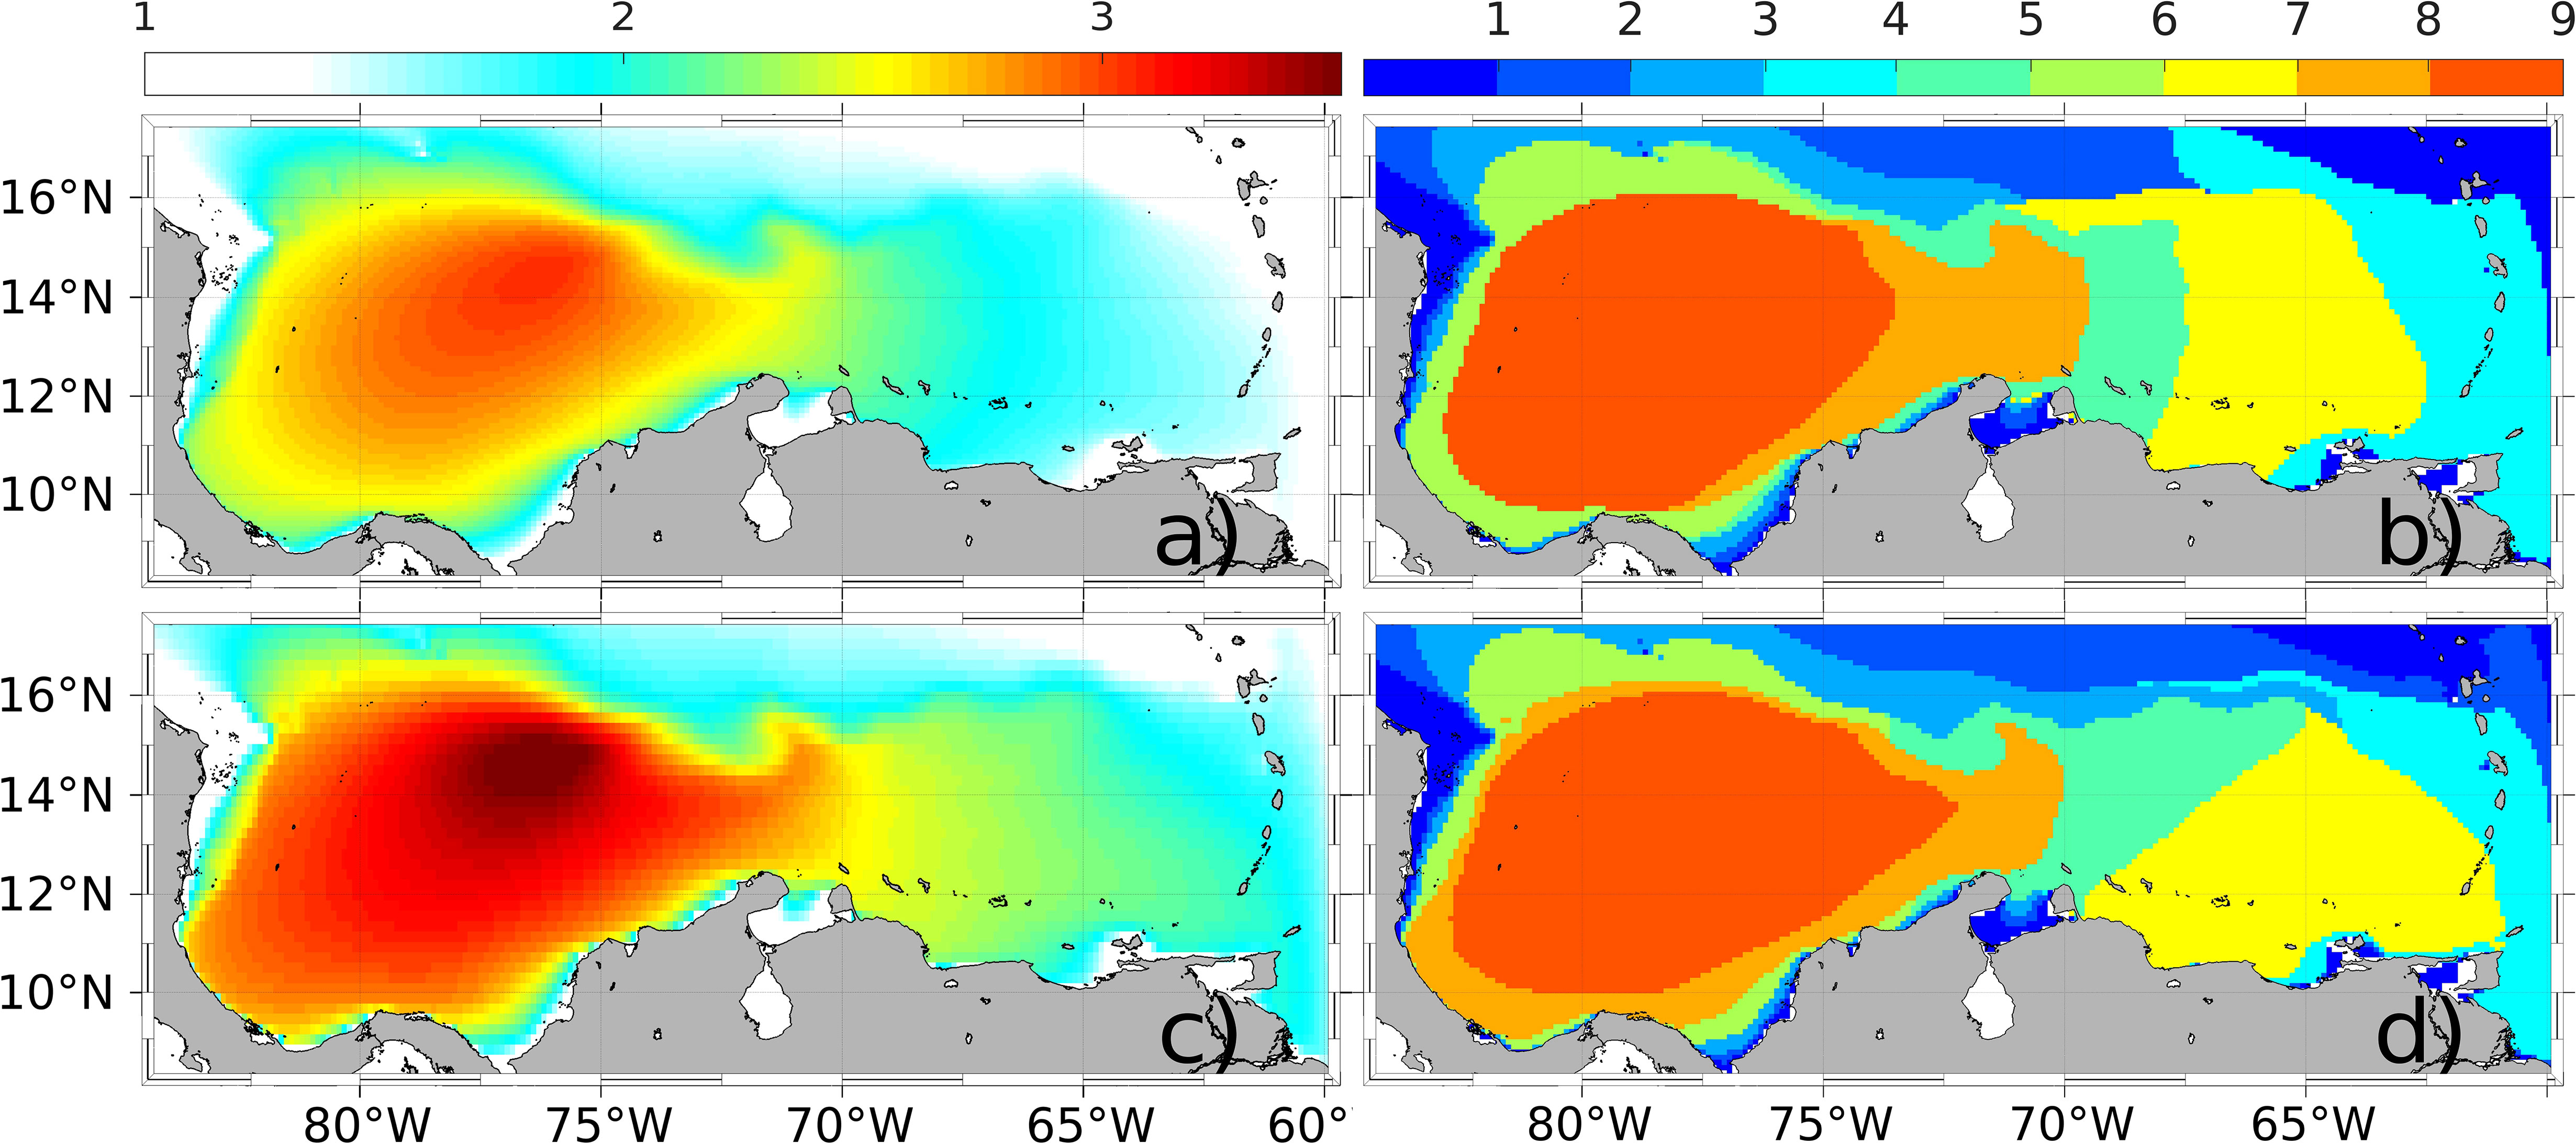
Figure 3 Mean value of extreme wave heights in the basin (units in m) (A, C) and regionalization from the 3 × 3 SOM temporal analysis (B, D) where each region (R1–R9) corresponds to the output of a neuron. Top figures correspond to and bottom figures to .
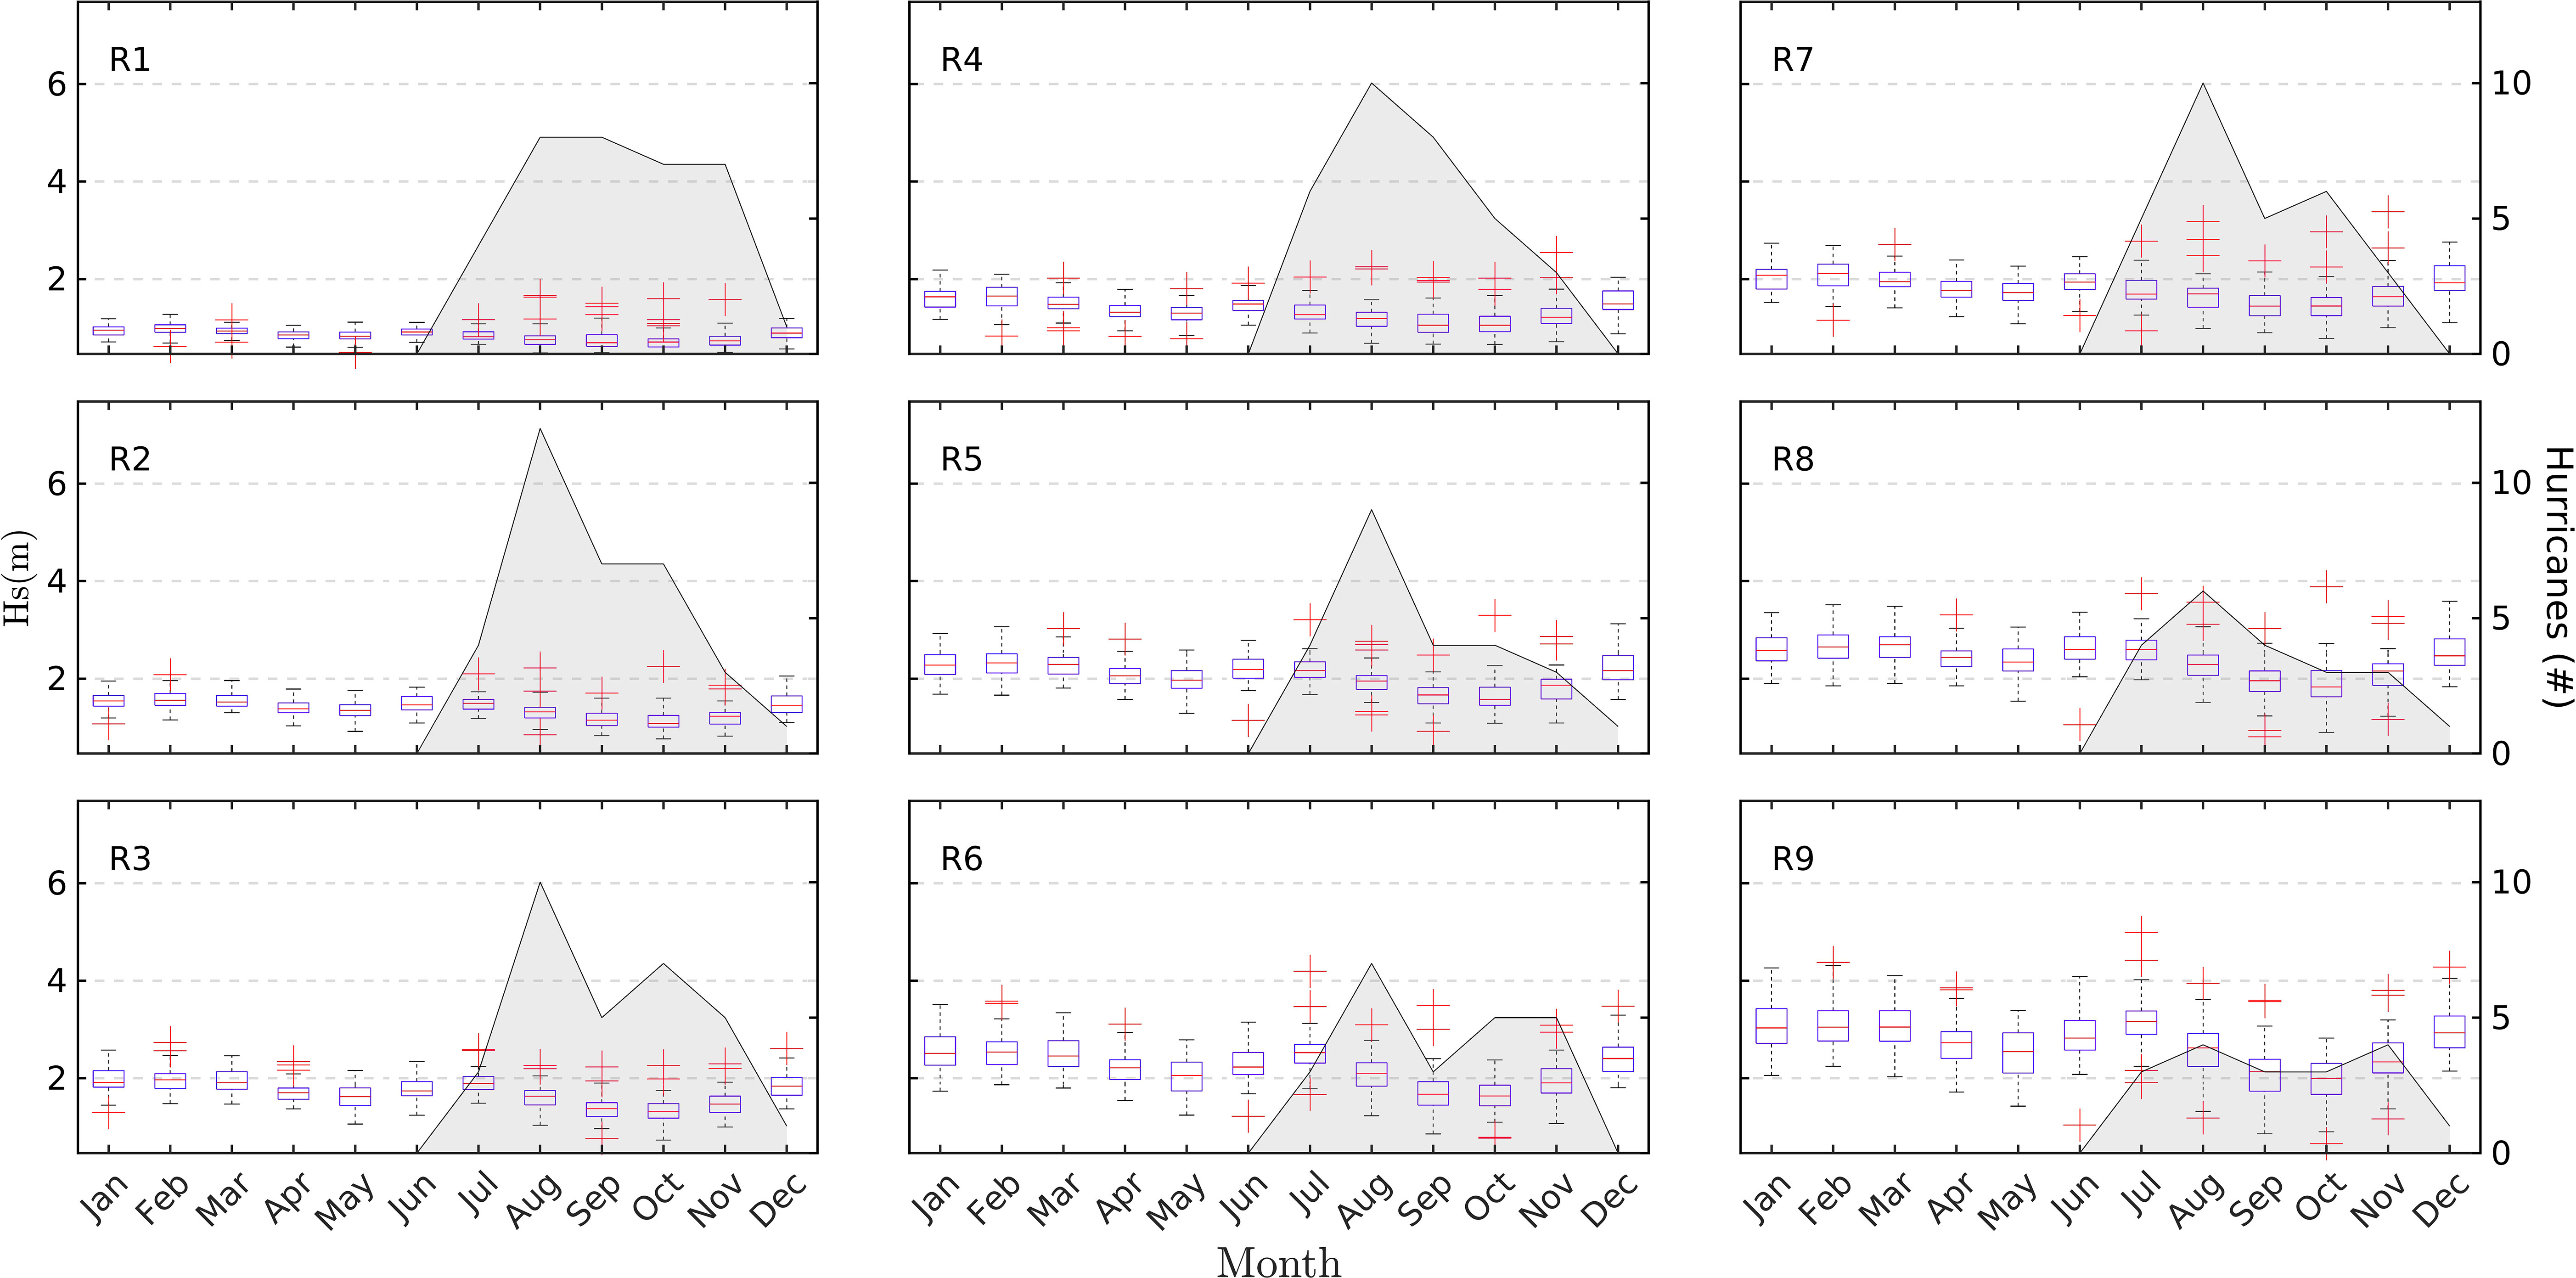
Figure 4 Left y-axis: box-plot of the monthly averaged temporal patterns of (in m), from 1958 to 2018 of the SOM regions R1-R9. The red central line indicates the median, and the bottom and top edges of the blue box indicate the 25th and 75th percentiles, respectively. The whiskers extend to the most extreme data points not considered outliers, and the outliers are plotted individually using the ‘+’ marker symbol. Right y-axis: The gray area shows the number of hurricanes that have passed through each of the regions during each month during the period of 1996 and 2007, using the center coordinates of each hurricane and a minimum persistence of 3 days inside the region.
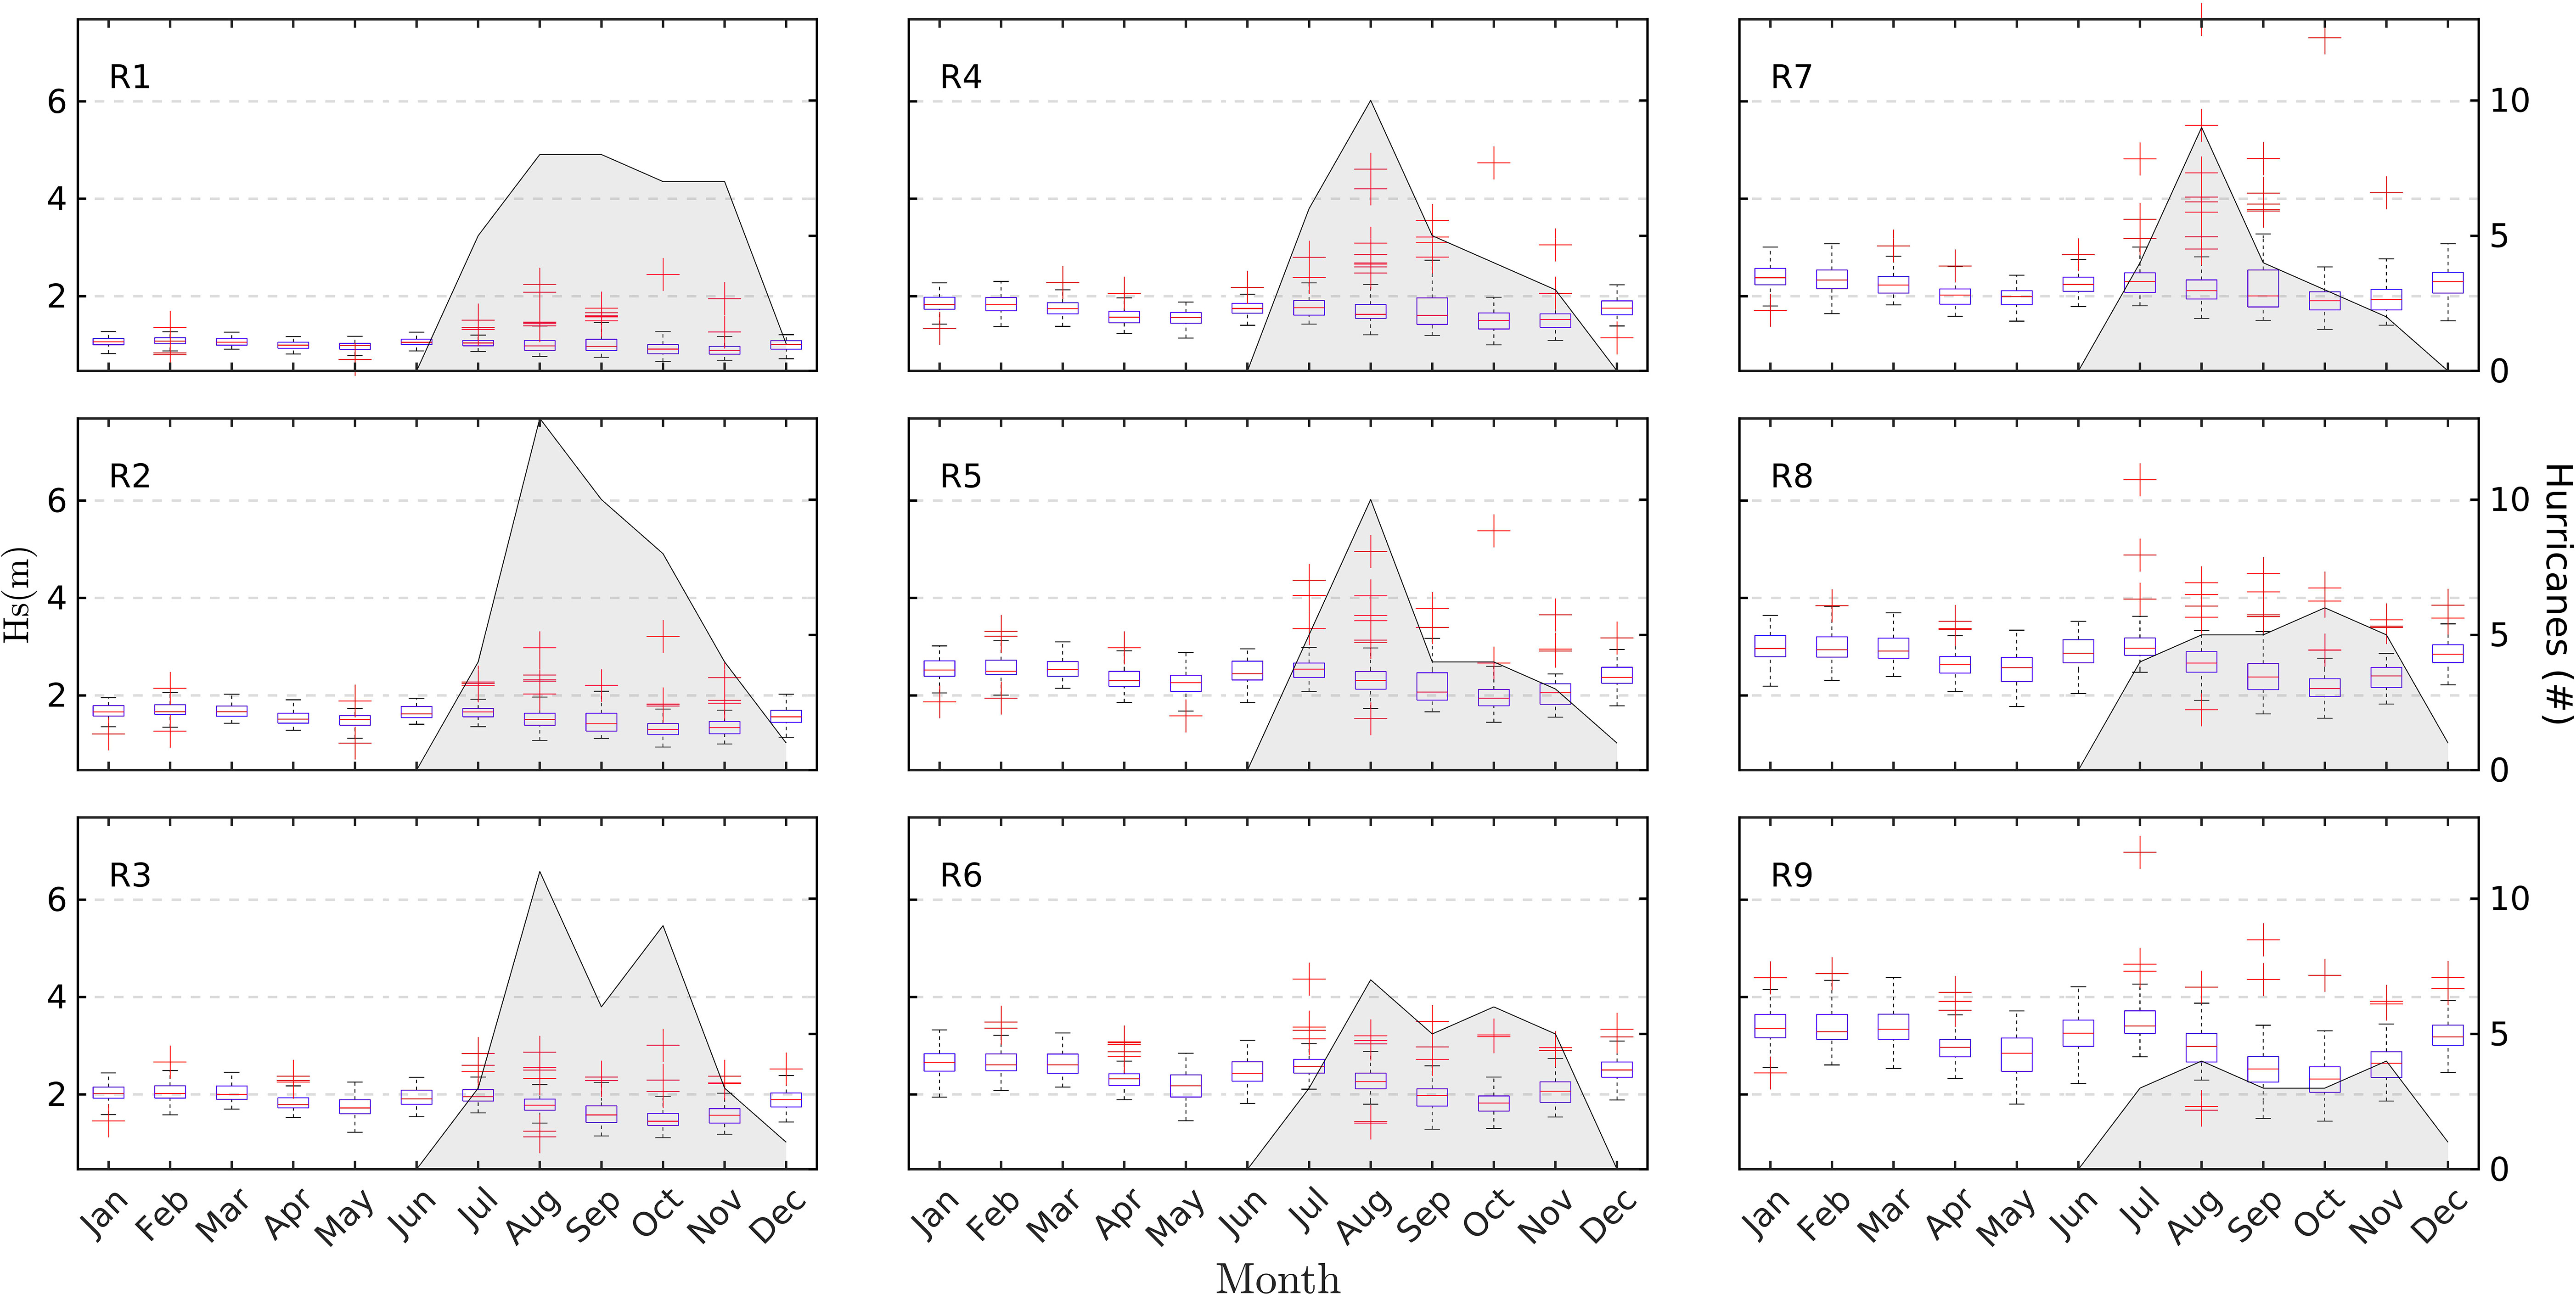
Figure 5 Same as Figure 4 for .
The mean patterns in the a and c panels (Figure 3) closely resemble the regions clustering in the b and d panels. For example, region R9 represents the core of maximum extreme significant wave height values (as shown in the a and c panels), and it is surrounded by successive regions with similar mean patterns (such as the rising tail at the eastern end of region R8). However, there are differences between the two methods. The criterion allows for higher maximum values (differences around 1m) in terms of mean magnitude as compared to the aggregation method ( ). See Figure 6 where the temporal series were smoothed with a moving average of 3 monthly data in order to improve the visualization. It is important to note that higher mean values obtained with the method are expected. This is because, with this method, we consider the monthly maximum value in each isolated pixel or location. In contrast, the method spatially averages the extreme values, considering the overall behavior of wave heights across the entire basin, providing a representative value for the month based on the date with the highest cumulative sum. In terms of spatial distribution, the core of region R9 is more spread out to the east in the method. Additionally, region R8 fully surrounds region R9, and as we move towards the eastern boundary, regions R2, R3, R6 and R7 show a more elongated longitudinal shapes for the method.
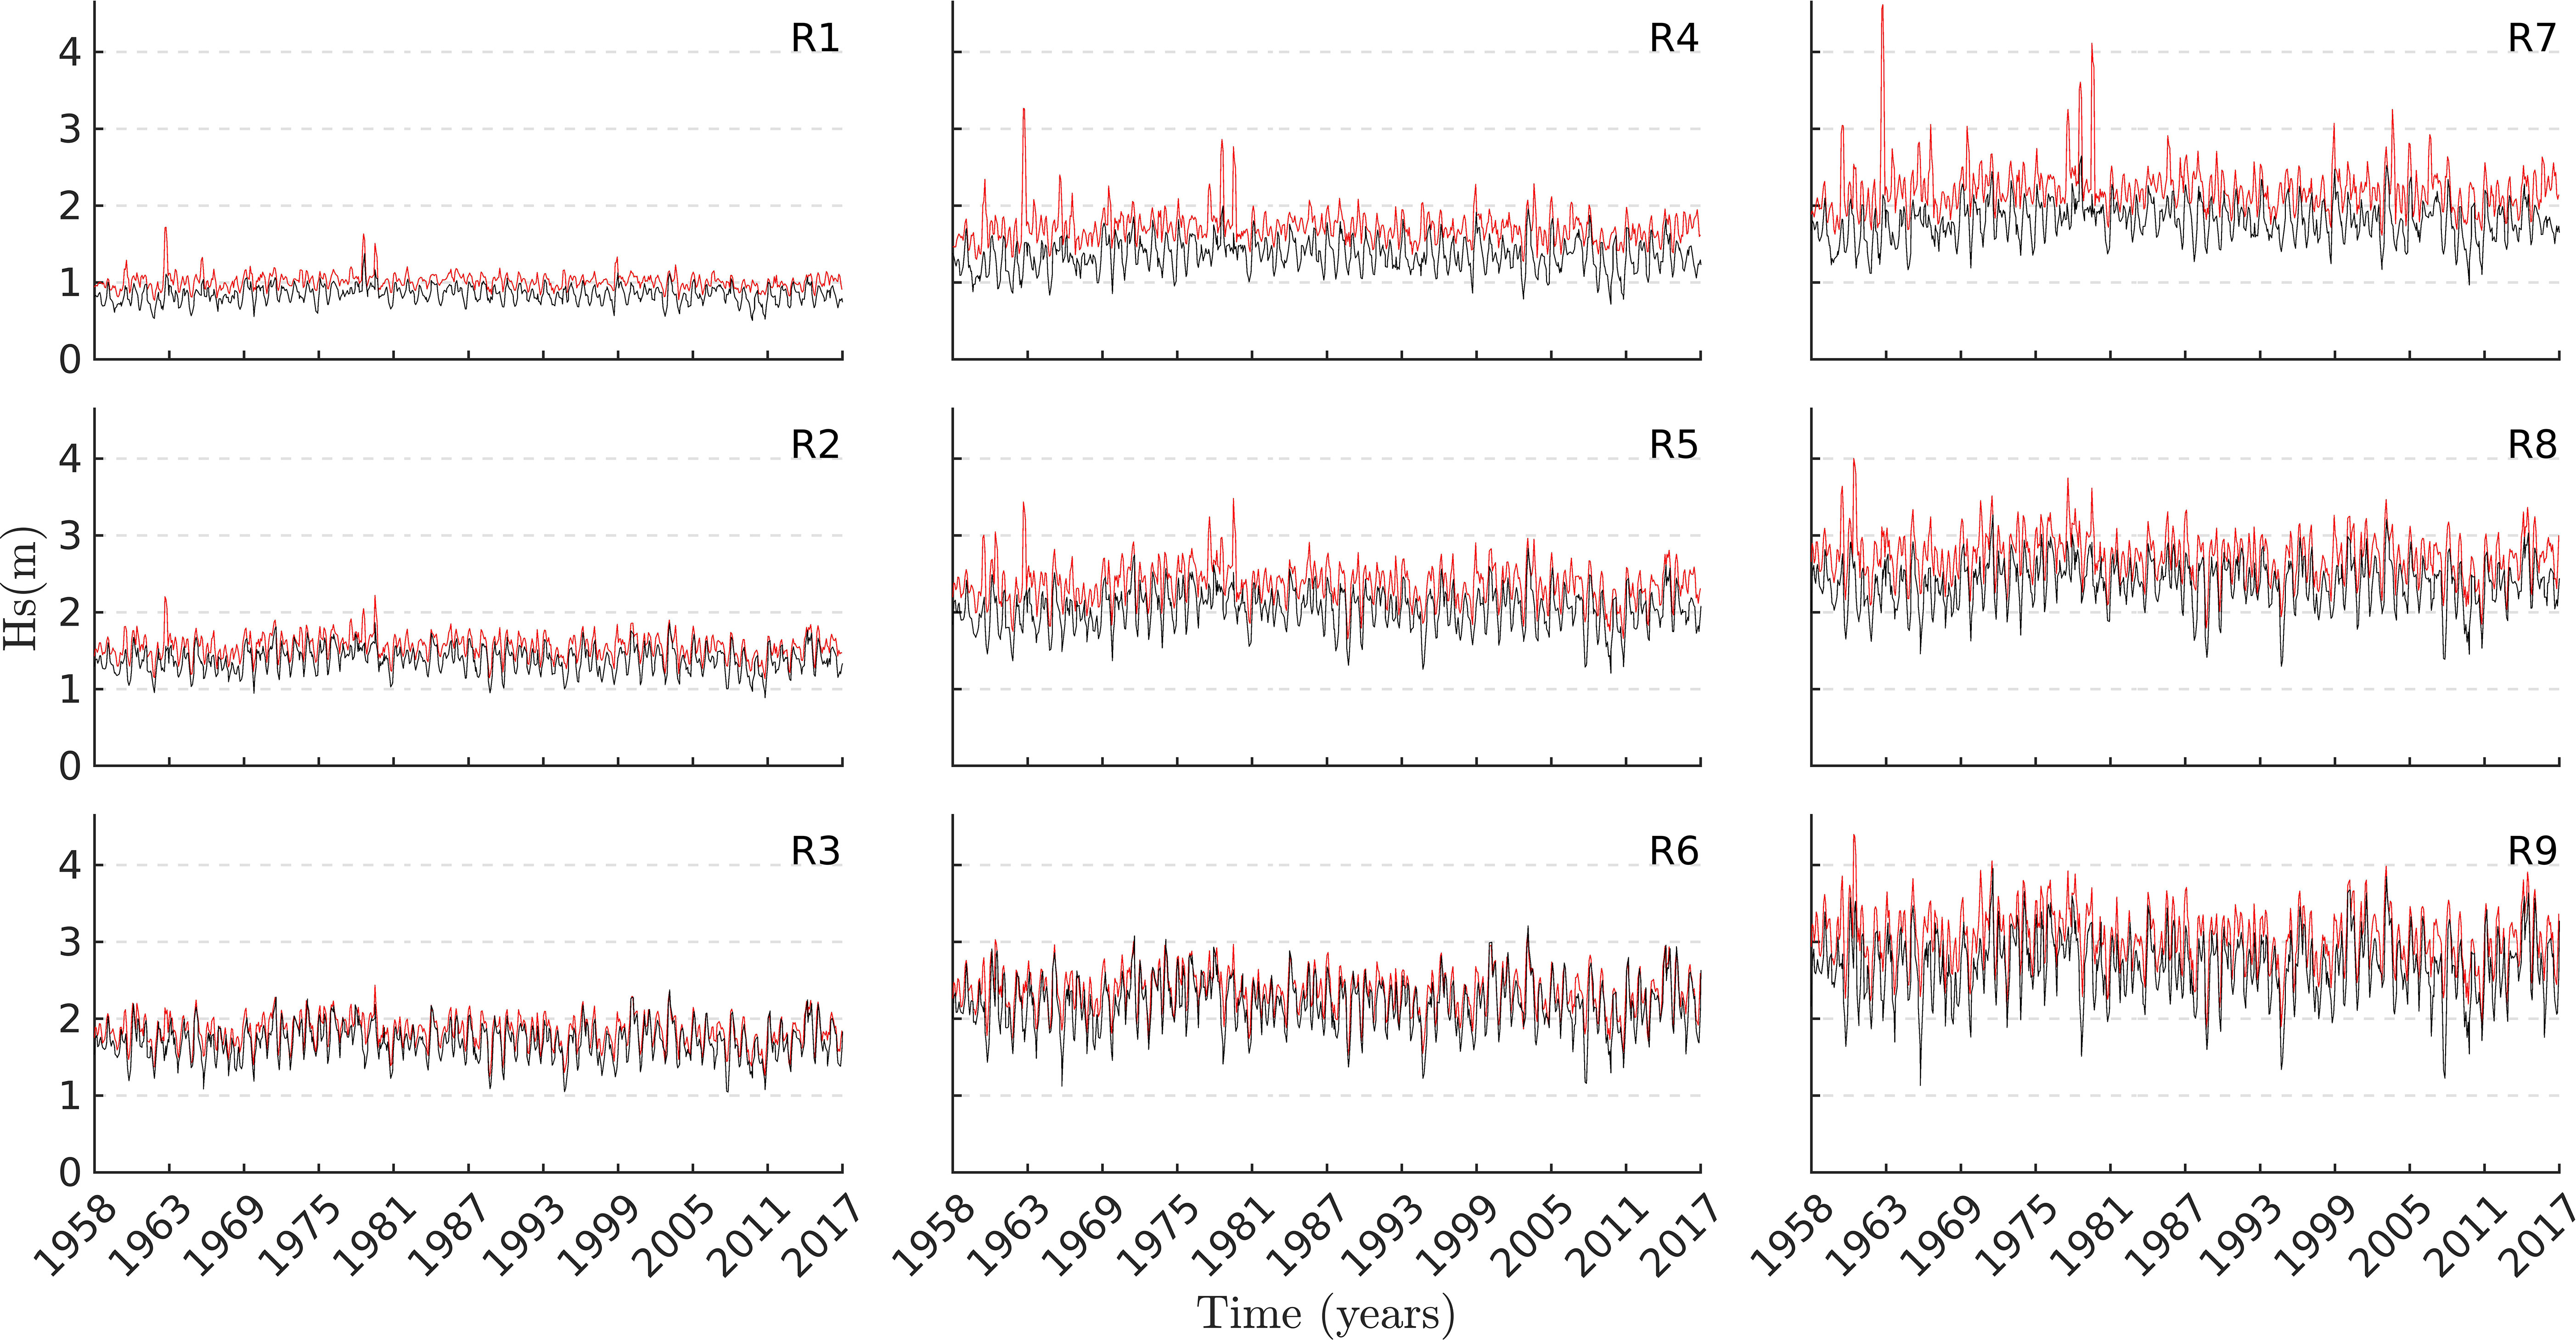
Figure 6 Temporal patterns of (black line) and (red line) in meters using the temporal SOMs technique from 1958 to 2017. Temporal series were smoothed with a moving average of 3 months in order to improve the display.
To complete the distribution of the 9 neurons, their temporal behavior is depicted in Figure 4 for and in Figure 5 for using box-and-whisker diagrams. We can see that in both methods the value of the median is similar, following the same temporal variability in each of the regions. Notably, the main differences between the two extreme wave definitions can be observed in the outliers (red crosses), which are higher for the method, particularly during the hurricane period from June to November and in regions R7-R9. However, it is important to mention that the medians are quite similar across all the regions defined by the neurons, indicating consistent variability. Other differences in terms of spread and skewness (seen in R7, R8, and R9) are primarily due to variations in spatial clustering.
Based on these findings, although the method may slightly underestimate the outliers, we can confidently conclude that it is as effective as traditional statistical methods in capturing the spatial and temporal distribution of extreme waves. Its primary advantage lies in identifying the climatic forcing associated with these extreme events. Consequently, our analysis will continue focusing on the results obtained using the aggregation method.
The temporal analysis reveals three main regions in the Caribbean Sea: 1) The eastern side, represented by regions R1 and R4 around the Lesser Antilles, exhibits the lowest values with a median (µ) around 1.5 m and a low variance with a standard deviation of σ < 0.25 m. 2) The central Caribbean, depicted by R5 and R7, shows intermediate values with µ ranging around 2m and a σ close to 0.3 m. 3) The western side (84W - 72W), spanning from the north of Nicaragua to La Guajira peninsula, represented by R6, R8, and R9, exhibits the highest values (up to 5 m), where µ ranges from 2.5 m to 3 m, with high variability, σ around 0.5 m (see Figure 4) coinciding with the wind intensity modulated by the displacement of the ITCZ (see Figure S1 in Supplementary Material). Regions R1, R2, R3 and R4 present a lower seasonality in the coinciding with the position of the ITCZ.
The gradual increase in along the longitudinal direction can be attributed to a large fetch. Beside the ocean swell entering the Caribbean through the Lesser Antilles, wind-waves have enough space to grow before reaching a stable condition or facing land (see Figure S1 in the Supplementary Material). Therefore, the Caribbean Sea can be seen as a slender basin, where the maximum wave conditions are constraint by the longitudinal displacement of the sea wave fronts.
To examine the spatial and seasonal distribution of extreme waves in the Caribbean, we depicted the patterns (maximum aggregation significant wave height) between the years 2005 and 2010 (Figure 7). This period provides a general view of the values showing the main extreme wave intra-annual variability, as well as the main events associated with extreme waves that we can find in the Caribbean Sea, such as hurricanes and cold fronts. For reference, a full catalogue of data for the entire period from 1958 to 2017 can be found in Figures S2-S4 in the Supplementary Material.
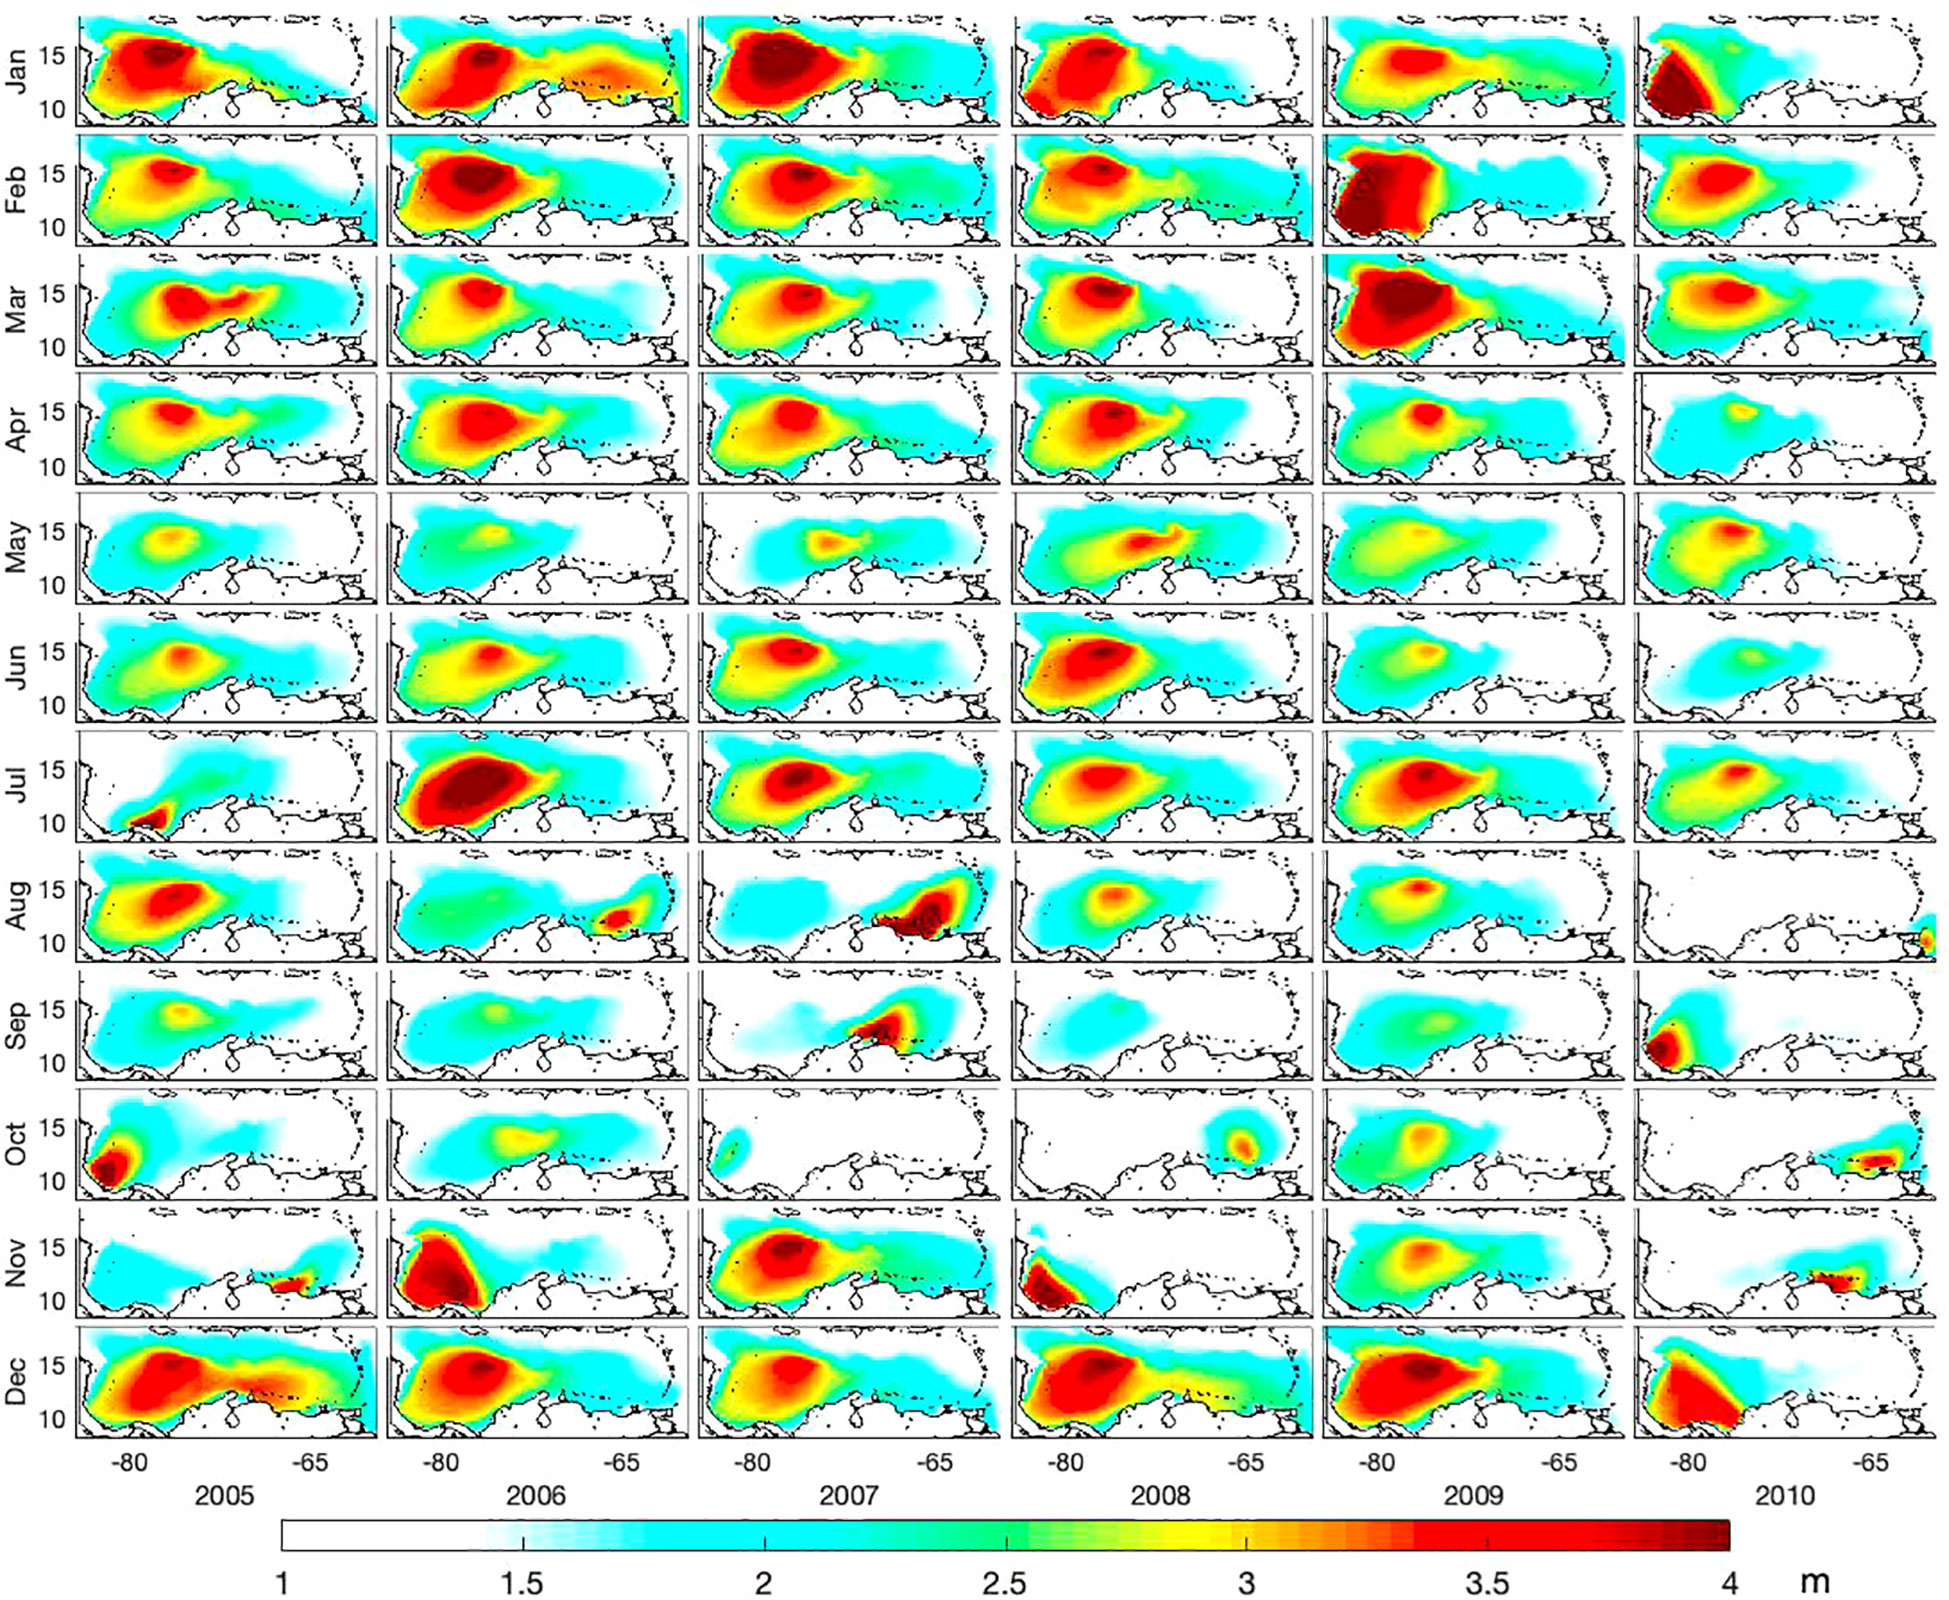
Figure 7 Monthly distribution (in m) in the Caribbean Sea for the period of 2005 to 2010.
As depicted in Figure 7, the distribution of extreme waves in the Caribbean is mainly influenced by the dynamics of the low-pressure belt formed by the ITCZ during two distinct seasons: the dry and windy season from December to April, and the wet season from August to November. For a visualization of the monthly extreme wind distribution in the basin, refer to Figure S1 in the Supplementary Material.
During the windy season, the highest wave heights are observed in the westernmost region of the Caribbean, which is influenced by the fetch configuration extending across the entire basin. In addition, extreme wave heights during this season can be generated by the passage of cold fronts originated from the Northern Atlantic. According to the different areas identified in the regionalization (Figure 3, top right panel), extreme waves during December to March are around 4 m in region R9 slightly decrease during April and May. Outliers during this period could be attributable to the cold fronts events specifically in regions R5, R6, R8 and R9 (Figure 4). For instance, high values of in front of Panama and Nicaragua, and covering the insular Colombian territories of San Andres and Providencia correspond to February 6th 2009. Event identified as a cold front traveling from the NW to the SW in the western Caribbean Sea according to the database provided by Borges et al. (2022). 1
While the monthly aggregate extreme wave pattern may not serve as a reliable indicator to identify cold fronts due to their occurrence during the windy season, it is relatively easy to identify hurricanes. In 2007, two hurricanes, Hurricane Dean and Hurricane Felix, passed through the Caribbean Sea. Hurricane Dean occurred on August 17th, and moved westward from Martinica and Santa Lucia impacting the central part of the basin. The highest wave height from Hurricane Dean was observed in the eastern basin between the Lesser Antilles and the coast of Venezuela. Hurricane Felix entered the Caribbean on September 1st, between Granada and Trinidad y Tobago (see Figure S5a), and reached the coast of Nicaragua on September 4th. The maximum wave heights from Hurricane Felix were easily identified on Aruba, extending northeastwards in a lenticular shape.
Moving on to 2008, four hurricanes - Dolly, Gustav, Omar, and Paloma - impacted the Caribbean Sea (Figure S5b). The extreme wave signatures of these hurricanes, which occurred in their respective months, can be seen in Figure 7. Hurricane Dolly was located south of Cuba on July 20th, Hurricane Omar traveled northeastwards between October 14th and 16th and Hurricane Paloma can be identified between Nicaragua and the insular Colombian territories of San Andrés and Providencia on November 6th. However, Hurricane Gustav, which was located east of Curac¸ao on July 15th and crossed Jamaica on the 29th, did not generate the most extreme waves for that month. This indicates that while both the cold fronts and the hurricanes can generate extreme waves associated with strong winds and flooding, which are important for coastal inundation, extreme waves in the Caribbean as a whole basin are mostly generated by the trade winds during the windy season.
Now, an example that highlights the limitations of this methodology is seen in 2009 (Figure 7). During this year, two hurricanes affected the area without leaving a clear signature on the extreme wave patterns for their respective months. Hurricane Erika, a tropical storm, entered the eastern side of the Caribbean basin from September 1st to 3rd, and hurricane Ida, a tropical depression, formed in the western side near San Andres on November 4th. It is important to note that this methodology gives more importance to events that occur over larger areas of the basin. Therefore, when we observe specific events like hurricanes based on the monthly maximum values (with methodology), it indicates that these events were exceptionally intense and surpassed the cumulative effect of other smaller events at a large area.
In 2010, the Caribbean experienced the impact of four hurricanes: Karl, Mathew, Paula, and Thomas. Hurricane Mathew, initially a Tropical depression near Nicaragua, quickly intensified and turned into a Tropical storm, causing extreme waves along the coast of Panama on September 24th (Figure 7). Thomas entered the Caribbean on September 30th, moving parallel to the South America coasts and then turned northward on November 4th. Its influence on the wave patterns, represented by , is clearly visible for both October and November 2010 in Figure 7. The extreme waves generated by Hurricane Karl from September 14th to 18th and Hurricane Paula from October 11th to 15th are not easily distinguishable due to the dominant effects of Hurricane Mathew and Hurricane Thomas, respectively.
In this section, we investigate the potential connections between the long-term distribution of extreme wave height (), with one local and four major climate patterns that influence the Caribbean region: CLLJ, NAO, ONI, AMO and AMM. Previous studies have extensively explored the impact of these indices on wave patterns in several locations (Vimont and Kossin, 2007; Izaguirre et al., 2010; Izaguirre et al., 2012; Appendini et al., 2015; Morales-Márquez et al., 2020). However, research focusing specifically on the wave climate in the Caribbean Sea is limited and mainly devoted to the analysis of average wave conditions, or to examining the effects of specific hurricanes that have affected the region, rather than examining the spatiotemporal distribution of extreme wave values.
We analyzed the correlation between these indices and the time series of extreme wave patterns () as displayed in Figure 8. To determine the significance, we set a threshold of 90% confidence level using an adjusted t-value.
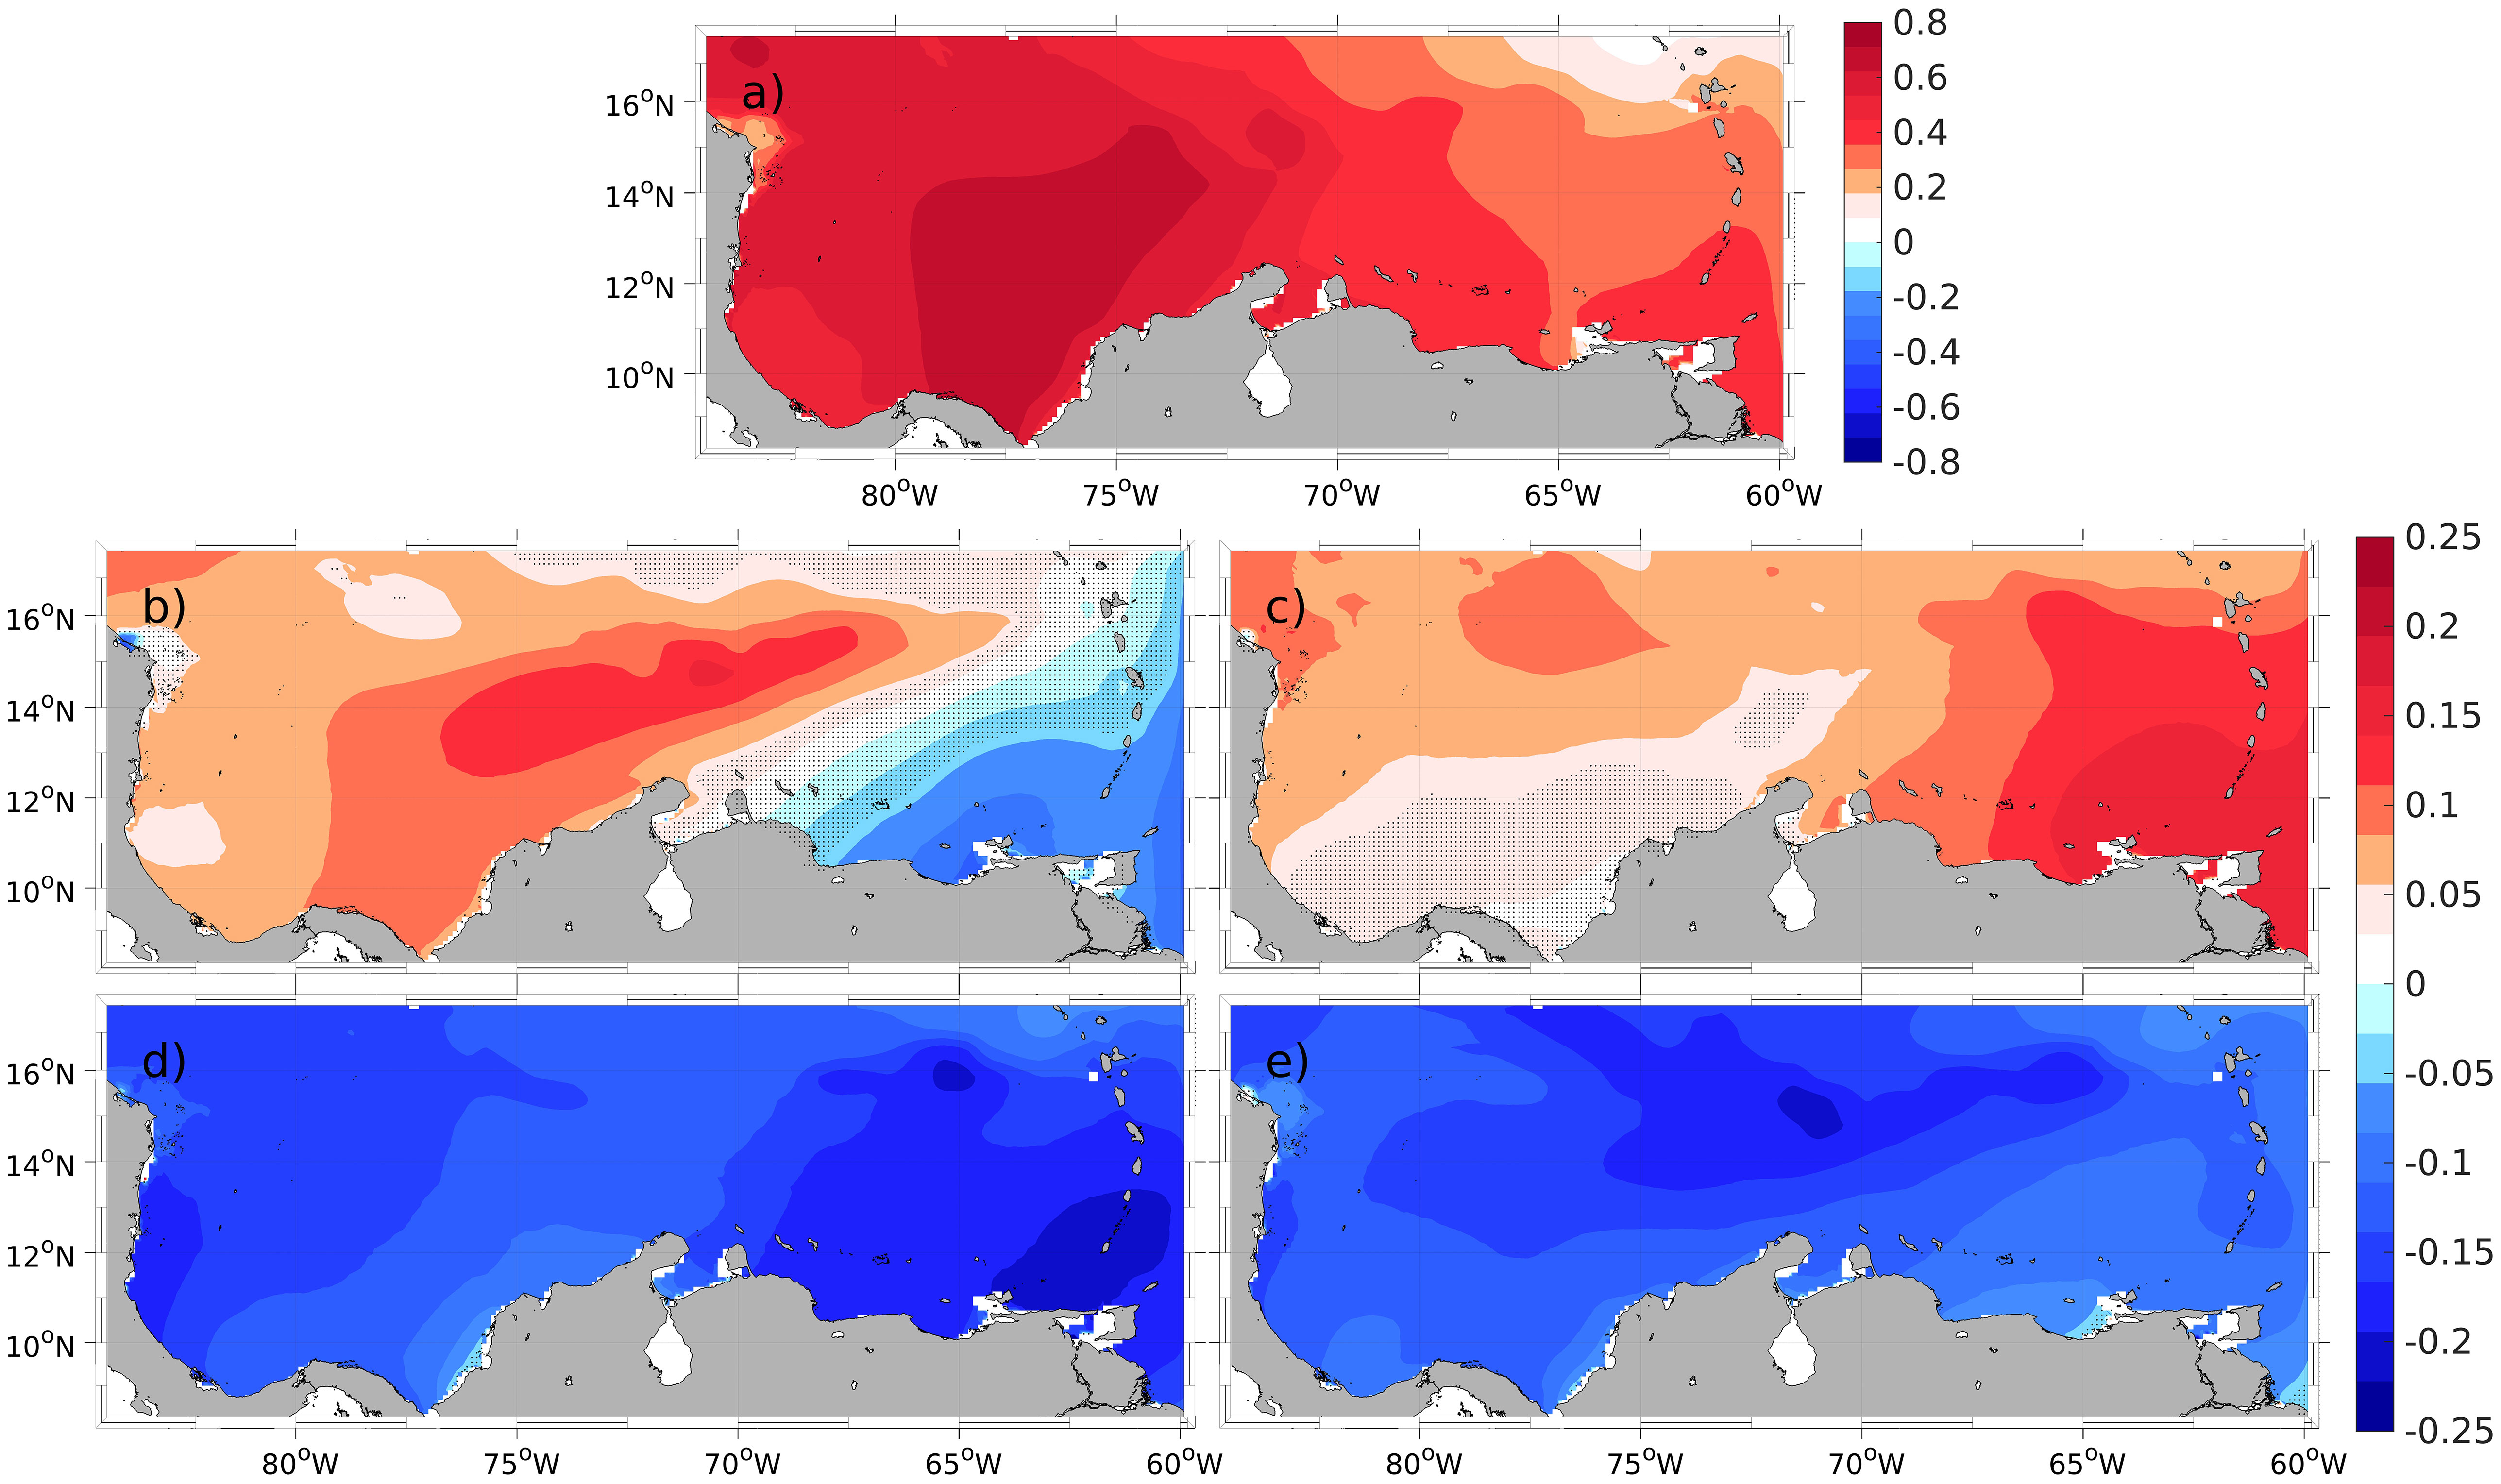
Figure 8 Pearson correlation coefficient of against (A) CLLJ, (B) ONI, (C) NAO, (D) AMO and (E) AMM indices. Locations with no significance with a 90% confidence interval are plotted with a dot.
where c is the correlation coefficient and N the length of the time series. If the value of t is equal to or greater than the critical t-value from the Student’s t-distribution with N − 2 degrees of freedom, then the correlation is considered statistically significant at a confidence level of 90%. These significance values are specific to this study because they are based on the data and time period analyzed.
Figure 8 shows the five spatial correlation patterns between the extreme wave field and the climatic indices. As can be observed, the CLLJ present a positive phase-high correlation with the extreme wave throughout the whole the Caribbean Sea (Figure 8A), as it was mentioned in Devis-Morales et al. (2017). This correlation pattern is similar to that shown previously when performing the regionalization of extreme waves in Figure 3, with a maximum value found for R9 (around the 85% in the western zone of the Caribbean). This index is local to the atmospheric dynamics in the Caribbean, which justifies its high correlation with .
There is a significant positive correlation between extreme waves and the ONI in the central Caribbean Sea, while a negative correlation is observed in the eastern part of the region. In a specific band, the correlations are not statistically significant, as depicted in Figure 8B. This pattern closely resembles the averaged maximum . Vega et al. (2020) investigated the impact of the ENSO on extreme waves using the peak over threshold method. They focused on 20 virtual buoys situated in the Caribbean Sea and selected extreme waves based on a 1% probability of exceedance (referred to as in this study). Their findings revealed that 55% of the buoys exhibited larger average values during La Niña, while 70% of the virtual buoys experienced the lowest averages during El Niño. The spatial pattern obtained by these researchers closely resembled the pattern obtained using the method presented in this study.
Extreme waves and the NAO are positively related in the Caribbean, particularly to the east of 70° W. However, in the southwestern basin stretching from La Guajira to the coasts of Panama and Costa Rica, the correlations are not significant (Figure 8C). Nonetheless, as we move towards the western side at 12° N, the correlations become more noticeable. It is widely known that the NAO influences changes in the strength of the Atlantic’s subtropical high-pressure system. These changes impact the meridional pressure gradient towards the equator, affecting the strength of the trade winds and ultimately influencing the magnitude of extreme waves in the region (George and Saunders, 2001).
The link between the extreme waves in the Caribbean and the AMO and AMM climatic modes is negative in a generalized way throughout the basin. Correlation values of about 25% for both climatic indices in the nine different areas of the basin (Figures 8D, E) are observed. The AMO present the strongest correlation in the eastern part of the basin, in the southern part of the Lesser Antilles (Figure 8D); while the AMM index reaches the maximum correlation in the central part of the basin (Figure 8E). These indices provide information about the connection of the hurricane activity in the Atlantic Ocean Goldenberg et al. (2001) and the extreme events within the Caribbean. For instance, Klotzbach (2011) used landfall data to show that an increment in the number of cyclones can occur during La-Niña when a positive phase with AMO is observed.
According to Vega et al. (2020), a thorough analysis of climatic indices and the distribution of extreme waves is necessary. To understand how the seasonal and inter-annual variability of the ENSO influence the extreme wave height (), we applied the Wavelet Coherence (WTC) analysis (Grinsted et al., 2004). This analysis involves examining the monthly time series derived from SOM-temporal training (Figure 6) and the time series of the CLLJ,ONI, NAO, AMO or AMM indices.
The Wavelet power spectrum of the extreme wave (Figure 9) shows the annual cycle as the dominant temporal scale during the 60 years, and in a less degree, the intra-annual periodicity (around 6 months) in agreement with the results obtained by Vega et al. (2020). The intra-annual periodicity is generated by the action of cold front events and the seasonal variability of the wind (represented here by the CLLJ index), stronger winds during the dry period (from December to March) and midsummer drought (June to August) Bernal et al. (2016). The time scale associated to annual cycle obeys to the passages of hurricanes through the Caribbean (mainly from July to November), which regularly come from east (Atlantic Ocean).
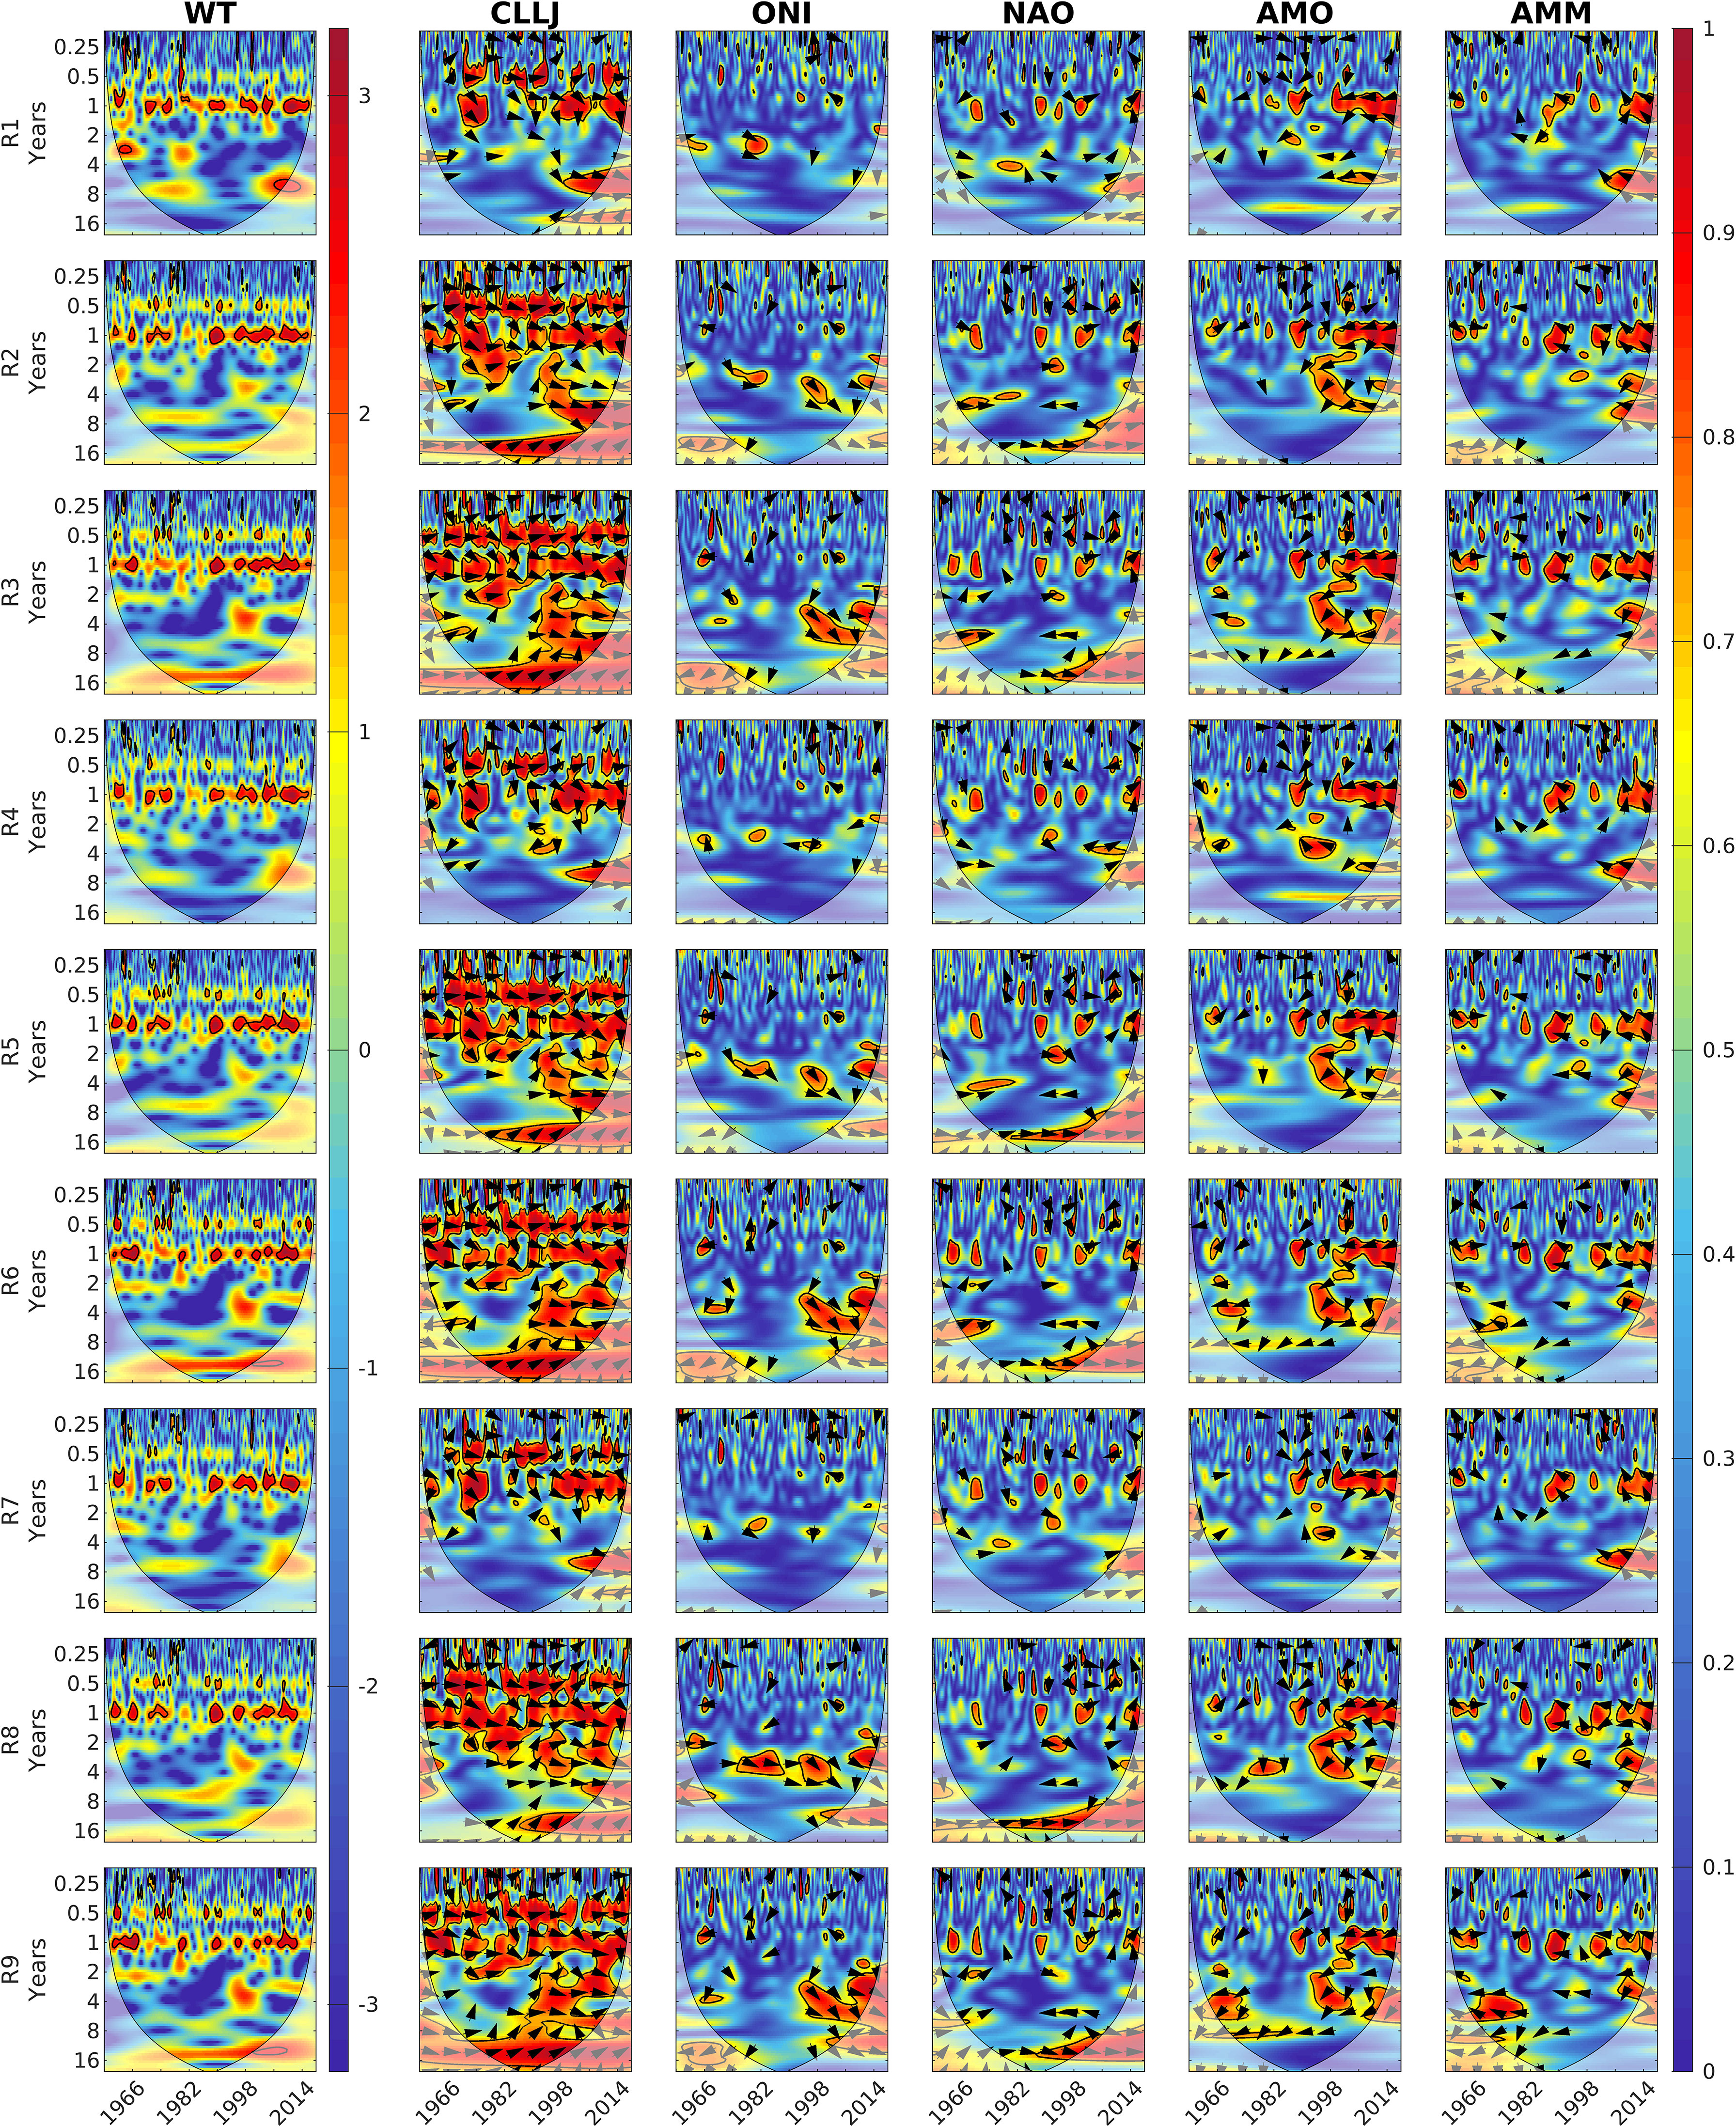
Figure 9 The Wavelet power spectrum of monthly after the SOM temporal training (R1-R9) (first column) and the Wavelet Coherence between monthly and monthly CLLJ index (second column), ONI index (third column), NAO index (fourth column), AMO index (fifth column) and AMM index (sixth column) values from 1958 to 2018. The solid black line represents the significance level of 5% when compared to random noise (red noise), while the lighter shaded area represents the cone of influence. The arrows show the phase relationship between the two series. Arrows pointing right indicate positive correlation, while arrows pointing left indicate anti-correlation. The contours represent the squared coherence of the wavelet analysis.
From the coherence wavelet analysis, it is observed that the annual and semi-annual, as well as the long-term variability, of extreme waves in the nine regions are dominated by the CLLJ index, such that it can be seen as the main driver of the extreme wave regimes in the Caribbean Sea (see the first and the second column of the Figure 9). This result is consistent with the findings presented in section 4.2 (Extreme Wave Distribution), since the extreme waves are modulated by fetch given the slender shape of the basin along the longitudinal axis. In addition to the influence of the local effects through the CLLJ, teleconnections beyond the Caribbean Sea domain (based on AMO and AMM) are observed by means of a significant annual correlation value with AMO and AMM in the entire basin from 1996 onwards.
Furthermore, we can observe long-term oscillations in the extreme waves occurring in the Caribbean Sea. Specifically, in the eastern part of the basin, there is a notable oscillation with a characteristic period of approximately 6 to 8 years. This oscillation was observed between 1966 and 1986, as well as between 2000 and 2018, and it is strongly influenced by the positive phase of the CLLJ and NAO and a negative of AMM (refer to Figure 9, panels R1, R4, and R7). Since this region of the Caribbean Sea is the closest to the Atlantic Ocean, it is particularly susceptible to the various dynamics occurring there. Additionally, both the eastern part of the basin, and to a lesser extent, the entire Caribbean Sea, exhibit another oscillation with a period of 2 to 4 years. This oscillation was observed during the periods of 1960-1970 and 1975-1982 and is associated with the positive phase of the ONI, and from 1986 onwards linked to negative phases of AMO and AMM.
In the central and western regions of the Caribbean basin (Figure 9, panels R2, R3, R5, R6, R8, and R9), a similar behavior is observed in terms of long-term oscillations, although with some variations. Across the entire time period from 1958 to 2018, there is a prolonged oscillation lasting approximately 10 to 15 years. Both the NAO and the ONI have effects on the extreme wave patterns during this oscillation. However, the NAO’s effect is more pronounced in the last decade. This phenomenon is particularly pronounced in regions R6 and R9 (Figure 9, panels R6 and R9), located in the western part of the basin. In these regions, extreme waves are primarily driven by wind patterns and the distance over which the wind can blow (fetch). Additionally, there is a shorter oscillation lasting between 2 to 5 years, observed specifically in Figure 9, panels R3, R6, and R9, during the period 1993-2000. This shorter oscillation is clearly associated with the positive phase of the ONI, the negative phases of AMO and AMM and the prevailing winds in the western part of the basin.
In the central part of the Caribbean Sea, represented by regions R5 and R8, a distinct oscillation with a period of 6 to 8 years is evident between 1960 and 1996 (see Figure 9, panels R5 and R8). This particular oscillation is linked to the positive phase with the ONI index and to the negative phase of the AMO index.
Using a 60-year wave simulation, we conducted an analysis of the spatial and temporal variations of monthly extreme waves in the Caribbean Sea. The main results from this work can be summarized as follows:
1. We have developed a novel method to analyze extreme waves, based on monthly extreme wave events from 1958 to 2018 in the Caribbean Sea. This method involves identifying the maximum wave height (denoted as ) in the basin for each calendar month. By determining the specific date when the aggregate value of significant wave height reaches its peak during that month, we can extract the corresponding snapshot of the significant wave height ( ). In addition to , we also gather information about the wind conditions at the same moment, as well as the wave peak period and direction. These parameters are derived directly from the original wave hindcast data, allowing us to establish a comprehensive characterization of the extreme wave events.
2. By comparing the monthly maximum wave height () with the 99th percentile of significant wave height (), we observed similar spatial patterns in the Caribbean Sea using a SOM clustering technique. It is important to note that while the proposed method based on may not capture extreme outlying values accounted for in the 99th percentile, it does exhibit a suitability to accurately capture the temporal variations of extreme waves.
3. Extreme waves in the Caribbean Sea are primarily influenced by the location and intensity of the northeast trade winds. In addition, the variability of extreme waves undergoes significant changes during specific periods. From June to November, the presence of hurricanes in the southern Caribbean greatly impacts the wave conditions. While in February and March, the area is affected by cold fronts, which also have a notable influence on the extreme wave patterns in the region.
4. The time series allows a proper identification of the different hurricanes affecting the Caribbean Sea. Median values of extreme waves show a large seasonality on extreme waves in the central and western side of the Caribbean, which corresponds to the movement of the Intertropical Convergence Zone (ITCZ). When using the aggregation method, extreme wave outliers are primarily associated with the occurrence of cold fronts during February and March, as well as hurricanes during the period from June to November.
5. The North Atlantic Oscillation (NAO) is a large-scale atmospheric circulation pattern that fluctuates between positive and negative phases. During the positive phase of NAO, stronger winds prevail, leading to the generation of more powerful waves that impact the Lesser Antilles with greater force in the Caribbean region. In contrast, during the negative phase of the NAO, the intensity of the wind decreases, resulting in less intense wave activity. In this regards, our results show that is positively correlated with NAO index, specially in the eastern part of the Caribbean Sea. However, in the southern and Caribbean Panama bight region, no significant correlation has been observed between and the NAO index.
6. Regarding ENSO, during El Niño conditions, there is usually a decrease in the intensity of the trade winds that can cause a decrease in the intensity of the winds in the Caribbean, which can in turn reduce Hs. On the other hand, during La Niña episode a strengthening of the trade winds is usually experienced in the Pacific and therefore an increase in the intensity of the winds in the Caribbean, which can increase the Hs. Our results show spatially positive/negative correlations in the eastern and western areas of the Caribbean. The CWT between and ENSO index at the different identified regions provide new insights to understand the behaviour of extreme waves in the different regions of the Caribbean Sea.
7. The extreme waves in the Caribbean are correlated with the negative phase of the AMO and AMM indices throughout the basin, with maximum values in the eastern part of the basin for the AMO and in the central part for the AMM. In addition, both indices have an effect on the annual and semi-annual variability of extreme waves in the Caribbean Sea.
8. The use of in extreme wave studies, particularly in the context of wave propagation towards coastal regions, can have a substantial value, since this approach enables the integration of wind associated with extreme waves (swell), thereby enhancing the accuracy of results in wave propagation analysis. The combination of maximum wave height and wind data provides a comprehensive understanding of the characteristics and behavior of extreme waves. Furthermore, this method has potential applications in statistical analyses related to extreme wave events. By utilizing , it becomes possible to identify areas that require protection or mitigation measures based on past events.
Data for HMs, their corresponding Tp, wind forcing, direction and date are provided in a netCDF file at https://zenodo.org/record/8296630. Hurricane data analyzed is provided by NOAA/NWS, National Hurricane Center and can be found in https://www.nhc.noaa.gov/data/tcr/. ONI Index is provided by NOAA/NWS, Climate Prediction Center and can be found in https://origin.cpc.ncep.noaa.gov/products/analysis_monitoring/ensostuff/ONI_v5.php. NAO Index is provided by NOAA/NWS, Climate Prediction Center and can be found in https://www.cpc.ncep.noaa.gov/products/precip/CWlink/pna/norm.nao.monthly.b5001.current.ascii.table. AMO Index is provided by NOAA/NWS, Climate Prediction Center and can be found in https://psl.noaa.gov/data/timeseries /AMO/:AMO unsmooth, long: Standard PSL Format. AMM Index is provided by NOAA/NWS, Climate Prediction Center and can be found in https://psl.noaa.gov/data/timeseries/monthly/AMM/: AMM (SST): Standard PSL Format. CLLJ Index is provided by Columbia Unviersity and can be found in https://iridl.ldeo.columbia.edu/SOURCES/.NOAA/.NCEP-NCAR/.CDAS-1/.MONTHLY/.Intrinsic/.PressureL.u/P/925/VALUE/Y/12.5/17.5/RANGE/X/-80/-70/RANGE/[X/Y]average/dup/T/(1981)/(2010)/RANGE/[T]average/sub/-1/mul/DATA/-10/10/RANGE//name//cllji/def//long_name/(Cari bbean%20Low%20Level %20Jet %20Index)/def/dup/. Wave hindcast data is freely accessible in the repository https://nimbus.imedea.uib-csic. es/index. php/s/gw2TforD8EezGjL Orejarena-Rondón et al. (2021).
VM-M: Data curation, Formal Analysis, Investigation, Methodology, Software, Supervision, Validation, Visualization, Writing – original draft. AC-E: Conceptualization, Data curation, Formal Analysis, Investigation, Methodology, Software, Supervision, Visualization, Writing – review & editing. IH-C: Investigation, Methodology, Resources, Supervision, Validation, Writing – review & editing. AO: Conceptualization, Funding acquisition, Investigation, Methodology, Project administration, Supervision, Validation, Writing – review & editing. AM: Formal Analysis, Funding acquisition, Investigation, Methodology, Project administration, Supervision, Validation, Writing – review & editing.
The author(s) declare financial support was received for the research, authorship, and/or publication of this article. VM-M was supported by the MORHOC’H2 project, funded by the French “Agence Nationale de la Recherche” and “Direction Générale de l’Armement”, (grant number 21-ASM1-0003). AC-E was supported by the Postdoctorat PD22-260 - Centre National d’Études Spatiales (CNES). AO thanks support from Projects LAMARCA (PID2021-123352OB-C31) funded by MICIN/AEI/10.13039/501100011033/FEDER, UE and Tech2Coast (TED2021-130949B-I00) funded by MCIN/AEI/10.13039/501100011033 and BY EU ‘NextGenerationEU/PRTR”. IH-C is supported by the TRITOP Project (UIB2021-PD06) funded by the Universidad de las Islas Baleares – FEDER (UE).
The present research was carried out in the framework of the AEI accreditation “Maria de Maeztu Centre of Excellence” given to IMEDEA (CSIC-UIB) (CEX2021-001198). Besides, this work was partially done while AO was an invited scientist at MIO-Universite´ du Toulon. Authors acknowledge support from J.L. Perales and A. Amores.
The authors declare that the research was conducted in the absence of any commercial or financial relationships that could be construed as a potential conflict of interest.
All claims expressed in this article are solely those of the authors and do not necessarily represent those of their affiliated organizations, or those of the publisher, the editors and the reviewers. Any product that may be evaluated in this article, or claim that may be made by its manufacturer, is not guaranteed or endorsed by the publisher.
The Supplementary Material for this article can be found online at: https://www.frontiersin.org/articles/10.3389/fmars.2023.1294189/full#supplementary-material
Andrade C., Thomas Y.-F., Alexandre N.-L., Durand P., Anselme B. (2013). Coastal flooding hazard related to swell events in Cartagena de Indias, Colombia. J. Coast. Res. 290, 1126–1136. doi: 10.2112/JCOASTRES-D-12-00028.1
Appendini C. M., Urbano-Latorre C. P., Figueroa B., Dagua-Paz C. J., Torres-Freyermuth A., Salles P. (2015). Wave energy potential assessment in the Caribbean low level jet using wave hindcast information. Appl. Energy 137, 375–384. doi: 10.1016/j.apenergy.2014.10.038
Barnston A. G., Livezey R. E. (1987). Classification, seasonality and persistence of low-frequency atmospheric circulation patterns. Monthly Weather Rev. 115, 1083–1126. doi: 10.1175/1520-0493(1987)115<1083:CSAPOL>2.0.CO;2
Beniston M., Stephenson D. B., Christensen O. B., Ferro C. A., Frei C., Goyette S., et al. (2007). Future extreme events in European climate: an exploration of regional climate model projections. Climatic Change 81, 71–95. doi: 10.1007/s10584-006-9226-z
Bernal G., Osorio A., Urrego L., Peláez D., Molina E., Zea S., et al. (2016). Occurrence of energetic extreme oceanic events in the Colombian Caribbean coasts and some approaches to assess their impact on ecosystems. J. Mar. Syst. 164, 85–100. doi: 10.1016/j.jmarsys.2016.08.007
Booij N., Ris R. C., Holthuijsen L. H. (1999). A third-generation wave model for coastal regions: 1. model description and validation. J. Geophysical Res.: Oceans 104, 7649–7666. doi: 10.1029/98JC02622
Borges D., Varona H., Calzada A., Araujo M., Noriega C., Casals R., et al. (2022). Database of anomalies in the Caribbean sea (ocean wave parameters): Dacs-wave. SEANOE. doi: 10.17882/86637
Cáceres-Euse A., Molcard A., Bourg N., Dumas D., Guérin C.-A., Besio G. (2022). Breakdown of near-surface sea current from High-Frequency radar data. J. Atmospheric Oceanic Technol 39(12), 1927–1942. doi: 10.1175/JTECH-D-22-0013.1
CRED (2022) Storm data from database em-dat: The emergency events database - université catholique de louvain (ucl) - cred. gdp data from wold bank world development indicators. Available at: https://www.emdat.be/ (Accessed 16-10-2023).
Cueto J., Otero L. (2020). Morphodynamic response to extreme wave events of microtidal dissipative and reflective beaches. Appl. Ocean Res. 101, 102283. doi: 10.1016/j.apor.2020.102283
Devis-Morales A., Montoya-Sánchez R. A., Bernal G., Osorio A. F. (2017). Assessment of extreme wind and waves in the Colombian Caribbean sea for offshore applications. Appl. Ocean Res. 69, 10–26. doi: 10.1016/j.apor.2017.09.012
Enfield D. B., Mestas-Nuñez A. M., Trimble P. J. (2001). The Atlantic multidecadal oscillation and its relation to rainfall and river flows in the continental us. Geophysical Res. Lett. 28, 2077–2080. doi: 10.1029/2000GL012745
Field C. B., Barros V., Stocker T. F., Dahe Q., Dokken D. J., Ebi K. L., et al. (2018). “IPCC 2012: summary for policymakers: managing the risks of extreme events and disasters to advance climate change adaptation,” in Planning for climate change (New York: Routledge), 111–128.
George S. E., Saunders M. A. (2001). North Atlantic oscillation impact on tropical north atlantic winter atmospheric variability. Geophysical Res. Lett. 28, 1015–1018. doi: 10.1029/2000GL012449
Goldenberg S. B., Landsea C. W., Mestas-Nuñez A. M., Gray W. M. (2001). The recent increase in atlantic hurricane activity: Causes and implications. Science 293, 474–479. doi: 10.1126/science.1060040
Grinsted A., Moore J. C., Jevrejeva S. (2004). Application of the cross wavelet transform and wavelet coherence to geophysical time series. Nonlinear Processes Geophysics 11, 561–566. doi: 10.5194/npg-11-561-2004
Group T. M., de Madron X. D., Guieu C., Sempéré R., Conan P., Cossa D., et al. (2011). Marine ecosystems’ responses to climatic and anthropogenic forcings in the Mediterranean. Prog. Oceanogr. 91, 97–166. doi: 10.1016/j.pocean.2011.02.003
Hernández-Carrasco I., Orfila A. (2018). The role of an intense front on the connectivity of the western Mediterranean sea: The cartagena-tenes front. J. Geophysical Res.: Oceans 123, 4398–4422. doi: 10.1029/2017JC013613
Izaguirre C., Mendez F. J., Menéndez M., Luceno A., Losada I. J. (2010). Extreme wave climate variability in southern Europe using satellite data. J. Geophysical Res.: Oceans 115. doi: 10.1029/2009JC005802
Izaguirre C., Menéndez M., Camus P., Méndez F. J., Mínguez R., Losada I. J. (2012). Exploring the interannual variability of extreme wave climate in the northeast Atlantic ocean. Ocean Model. 59, 31–40. doi: 10.1016/j.ocemod.2012.09.007
Kaiser M. J. (2008). The impact of extreme weather on offshore production in the gulf of Mexico. Appl. Math. Model. 32, 1996–2018. doi: 10.1016/j.apm.2007.06.031
Klotzbach P. J. (2011). The influence of el Niño–southern oscillation and the Atlantic multidecadal oscillation on Caribbean tropical cyclone activity. J. Climate 24, 721–731. doi: 10.1175/2010JCLI3705.1
Kobayashi S., Ota Y., Harada Y., Ebita A., Moriya M., Onoda H., et al. (2015). The jra-55 reanalysis: General specifications and basic characteristics. J. Meteorological Soc. Japan Ser. II 93, 5–48. doi: 10.2151/jmsj.2015-001
Kossin J. P., Vimont D. J. (2007). A more general framework for understanding Atlantic hurricane variability and trends. Bull. Am. Meteorological Soc. 88, 1767–1782. doi: 10.1175/BAMS-88-11-1767
Liu Y., Weisberg R. H. (2005). Patterns of ocean current variability on the west Florida shelf using the self-organizing map. J. Geophysical Res.: Oceans 110. doi: 10.1029/2004JC002786
Liu Y., Weisberg R. H., Mooers C. N. K. (2006). Performance evaluation of the self-organizing map for feature extraction. J. Geophysical Res.: Oceans 111. doi: 10.1029/2005JC003117
López-Álzate M. E., Sayol J.-M., Hernández-Carrasco I., Osorio A. F., Mason E., Orfila A. (2022). Mesoscale eddy variability in the Caribbean sea. Ocean Dynamics 72, 679–693. doi: 10.1007/s10236-022-01525-9
Marengo J. A., Jones R., Alves L. M., Valverde M. C. (2009). Future change of temperature and precipitation extremes in South America as derived from the precis regional climate modeling system. Int. J. Climatol.: A J. R. Meteorological Soc. 29, 2241–2255. doi: 10.1002/joc.1863
Martín A., Amores A., Orfila A., Toomey T., Marcos M. (2023). Coastal extreme sea levels in the Caribbean sea induced by tropical cyclones. Natural Hazards Earth System Sci. 23, 587–600. doi: 10.5194/nhess-23-587-2023
Montoya R. D., Menendez M., Osorio A. F. (2018). Exploring changes in Caribbean hurricaneinduced wave heights. Ocean Eng. 163, 126–135. doi: 10.1016/j.oceaneng.2018.05.032
Morales-Márquez V., Hernández-Carrasco I., Simarro G., Rossi V., Orfila A. (2021). Regionalizing the impacts of wind- and wave-induced currents on surface ocean dynamics: A long-term variability analysis in the Mediterranean sea. J. Geophysical Res.: Oceans 126, e2020JC017104. doi: 10.1029/2020JC017104
Morales-Márquez V., Orfila A., Simarro G., Gómez-Pujol L., Alvarez-Ellacuría A., Conti D., et al. (2018). Numerical and remote techniques for operational beach management under storm group forcing. Natural Hazards Earth System Sci. 18, 3211–3223. doi: 10.5194/nhess-18-3211-2018
Morales-Márquez V., Orfila A., Simarro G., Marcos M. (2020). Extreme waves and climatic patterns of variability in the eastern north Atlantic and Mediterranean basins. Ocean Sci. 16, 1385–1398. doi: 10.5194/os-16-1385-2020
Moron V., Gouirand I., Taylor M. (2016). Weather types across the Caribbean basin and their relationship with rainfall and sea surface temperature. Climate Dynamics 47, 601–621. doi: 10.1007/s00382-015-2858-9
Orejarena-Rondón A. F., Orfila A., Restrepo J. C., Ramos I. M., Hernandez-Carrasco I. (2021). A 60 year wave hindcast dataset in the Caribbean sea. Data Brief 37, 107153. doi: 10.1016/j.dib.2021.107153
Orejarena-Rondón A. F., Sayol J.-M., Hernández-Carrasco I., Cáceres-Euse A., Restrepo J. C., Orfila A. (2023). Spatio-temporal variability of mean wave energy flux in the Caribbean sea. J. Ocean Eng. Mar. Energy 9, 25–41. doi: 10.1007/s40722-022-00246-x
Orejarena-Rondón A. F., Sayol J. M., Marcos M., Otero L., Restrepo J. C., Hernández-Carrasco I., et al. (2019). Coastal impacts driven by sea-level rise in Cartagena de Indias. Front. Mar. Sci. 6, 614. doi: 10.3389/fmars.2019.00614
Orfila A., Urbano-Latorre C. P., Sayol J. M., Gonzalez-Montes S., Caceres-Euse A., Hernández-Carrasco I., et al. (2021). On the impact of the Caribbean counter current in the guajira upwelling system. Front. Mar. Sci. 8. doi: 10.3389/fmars.2021.626823
Ortiz J. (2009). Application of a parametric wind model and a spectral swell model for the study of maximum swell generated by hurricane lenny on the Colombian Caribbean coast in 1999. Sci. Bulletin CIOH 27, 29–36. doi: 10.26640/01200542.27.29_36
Ortiz J. C., Salcedo B., Otero L. J. (2014). Investigating the collapse of the Puerto Colombia pier (Colombian Caribbean coast) in march 2009: methodology for the reconstruction of extreme events and the evaluation of their impact on the coastal infrastructure. J. Coast. Res. 30, 291–300. doi: 10.2112/JCOASTRES-D-12-00062.1
Ortiz Royero J. C. (2012). Exposure of the Colombian caribbean coast, including San Andres Island, to tropical storms and hurricanes 1900–2010. Natural Hazards 61, 815–827. doi: 10.1007/s11069-011-0069-1
Pérez L. G., Ferrer J. J., Bermejo Á.I., Mejía Y. K., Romero G. F., Álvarez-Silva Ó. (2022). Advances in the study of coastal processes in the continental Colombian Caribbean coast. Regional Stud. Mar. Sci. 51, 102209. doi: 10.1016/j.rsma.2022.102209
Porto Solano A. F., Barbosa Correa R. A., Cohen Jiménez J. R., Suárez López D. M., Mercado Caruso N. N., Salas Navarro K. P. (2017). Estrategias para el desarrollo sostenible del sector portuario en el caribe Colombiano.
Poveda G., Waylen P. R., Pulwarty R. S. (2006). Annual and inter-annual variability of the present climate in northern south america and southern mesoamerica. Palaeogeogr. Palaeoclimatol. Palaeoecol. 234, 3–27. doi: 10.1016/j.palaeo.2005.10.031
Ramenzoni V. C., Borroto Escuela D., Rangel Rivero A., González-Díaz P., Vázquez Sánchez V., López-Castañeda L., et al. (2020). Vulnerability of fishery-based livelihoods to extreme events: local perceptions of damages from hurricane irma and tropical storm alberto in yaguajay, central Cuba. Coast. Manage. 48, 354–377. doi: 10.1080/08920753.2020.1802198
Report, U. N (2010). Economic commission for Latin America and the Caribbean (ECLAC) Subregional Headquarters for the Caribbean, analysis of extreme events in the Caribbean 1990–2008. Tech. rep., LC/CAR/L.254.
Rey W., Ruiz-Salcines P., Salles P., Urbano-Latorre C. P., Escobar-Olaya G., Osorio A. F., et al. (2021). Hurricane flood hazard assessment for the archipelago of san Andres, providencia and Santa Catalina, Colombia. Front. Mar. Sci. 8, 766258. doi: 10.3389/fmars.2021.766258
Roldán M., Montoya R. D., Rios J. D., Osorio A. F. (2023). Modified parametric hurricane wind model to improve the asymmetry in the region of maximum winds. Ocean Eng. 280, 114508. doi: 10.1016/j.oceaneng.2023.114508
Royero J. C. O., Moreno J. M. P., Lizano O. (2014). Evaluation of extreme waves associated with cyclonic activity on San Andrés Island in the Caribbean Sea since 1900. J. Coast. Res. 31, 557–568. doi: 10.2112/JCOASTRES-D-14-00072.1
Rueda-Bayona J. G., Guzmán A., Eras J. J. C., Silva-Casarín R., Bastidas-Arteaga E., HorrilloCaraballo J. (2019). Renewables energies in Colombia and the opportunity for the offshore wind technology. J. Cleaner Production 220, 529–543. doi: 10.1016/j.jclepro.2019.02.174
Sánchez-Núñez D. A., Bernal G., Mancera Pineda J. E. (2019). The relative role of mangroves on wave erosion mitigation and sediment properties. Estuaries Coasts 42, 2124–2138. doi: 10.1007/s12237-019-00628-9
Sayol J.-M., Vásquez L. M., Valencia J. L., Linero-Cueto J. R., García-García D., Vigo I., et al. (2022). Extension and application of an observation-based local climate index aimed to anticipate the impact of el niño–southern oscillation events on Colombia. Int. J. Climatol. 42, 5403–5429. doi: 10.1002/joc.7540
Sutton R. T., Hodson D. L. (2005). Atlantic ocean forcing of north American and European summer climate. science 309, 115–118. doi: 10.1126/science.1109496
Torrence C., Compo G. (1998). A practical guide to wavelet analysis. Bull. Am. Meteorological Soc. 79, 61–78. doi: 10.1175/1520-0477(1998)079<0061:APGTWA>2.0.CO;2
Torres R. R., Giraldo E., Muñoz C., Caicedo A., Hernández-Carrasco I., Orfila A. (2023). Seasonal and el Niño–southern oscillation-related ocean variability in the Panama bight. Ocean Sci. 19, 685–701. doi: 10.5194/os-19-685-2023
UNDP, U. N. D. P (2023) After the rain: The lasting effects of storms in the Caribbean. Available at: https://www.undp.org/latin-america/after-rain-lasting-effects-storms-caribbean (Accessed 16-10-2023).
Vega M. J., Alvarez-Silva O., Restrepo J. C., Ortiz J. C., Otero L. J. (2020). Interannual variability of wave climate in the Caribbean sea. Ocean Dynamics 70, 965–976. doi: 10.1007/s10236-020-01377-1
Vesanto J., Alhoniemi E. (2000). Clustering of the self-organizing map. IEEE Trans. Neural Networks 11, 586–600. doi: 10.1109/72.846731
Vimont D. J., Kossin J. P. (2007). The Atlantic meridional mode and hurricane activity. Geophysical Res. Lett. 34. doi: 10.1029/2007GL029683
Vinoth J., Young I. (2011). Global estimates of extreme wind speed and wave height. J. Climate 24, 1647–1665. doi: 10.1175/2010JCLI3680.1
Walz Y., Janzen S., Narvaez L., Ortiz-Vargas A., Woelki J., Doswald N., et al. (2021). Disaster-related losses of ecosystems and their services. why and how do losses matter for disaster risk reduction? Int. J. Disaster Risk Reduction 63, 102425. doi: 10.1016/j.ijdrr.2021.102425
Wang C. (2007). Variability of the Caribbean low-level jet and its relations to climate. Climate dynamics 29, 411–422. doi: 10.1007/s00382-007-0243-z
Keywords: extreme wave climate, Caribbean Sea waves, CLLJ, AMO, AMM, ENSO, NAO, extreme wave regionalization
Citation: Morales-Márquez V, Cáceres-Euse A, Hernández-Carrasco I, Molcard A and Orfila A (2023) Extreme waves in the Caribbean Sea: spatial regionalization and long-term analysis. Front. Mar. Sci. 10:1294189. doi: 10.3389/fmars.2023.1294189
Received: 14 September 2023; Accepted: 27 November 2023;
Published: 20 December 2023.
Edited by:
Il-Ju Moon, Jeju National University, Republic of KoreaReviewed by:
Alfredo Izquierdo, University of Cádiz, SpainCopyright © 2023 Morales-Márquez, Cáceres-Euse, Hernández-Carrasco, Molcard and Orfila. This is an open-access article distributed under the terms of the Creative Commons Attribution License (CC BY). The use, distribution or reproduction in other forums is permitted, provided the original author(s) and the copyright owner(s) are credited and that the original publication in this journal is cited, in accordance with accepted academic practice. No use, distribution or reproduction is permitted which does not comply with these terms.
*Correspondence: Alejandro Cáceres-Euse, YWxlamFuZHJvLmNhY2VyZXMtZXVzZUB1bml2LXRsbi5mcg==; Alejandro Orfila, YW9yZmlsYUBpbWVkZWEudWliLWNzaWMuZXM=
Disclaimer: All claims expressed in this article are solely those of the authors and do not necessarily represent those of their affiliated organizations, or those of the publisher, the editors and the reviewers. Any product that may be evaluated in this article or claim that may be made by its manufacturer is not guaranteed or endorsed by the publisher.
Research integrity at Frontiers
Learn more about the work of our research integrity team to safeguard the quality of each article we publish.