 Júlia Clols-Fuentes
- 1Aquaculture and Sea-Ranching, Faculty of Agricultural and Environmental Sciences, University of Rostock, Rostock, Germany
- 2Institute of Genome Biology, Research Institute for Farm Animal Biology, Dummerstorf, Germany
- 3Institute of Medical Microbiology, Virology and Hygiene University Medicine Rostock (UMR), Rostock, Germany
Fish farming in Recirculating Aquaculture Systems (RAS) is a sustainable and efficient practice to produce fish. Knowledge of microbial communities, particularly harmful pathogens on fish, is required to better understand microbiological processes occurring at different RAS compartments and to optimize the overall RAS management. In this study, we assessed the influence of different Clarias gariepinus stocking densities in RAS on the water microbiome composition. Molecular targeting the V3-V4 16S rRNA hypervariable region was used to infer Amplicon Sequence Variants (ASV), identify microbes, and assess their abundance and diversity. We identified bacterial pathogens in the rearing environment associated with common fish farming practices. Our findings show that microbiomes differ across all systems (high, medium and low stocking densities) and within sampling points (water inflow, outflow and sedimentation tank). The medium-density system had the most fish biomass, resulting in high ASVs cumulative abundance. In water samples from high- and low-density systems, we discovered a wide range of phyla, with Mycobacterium sp. being the most common potentially pathogenic group. We discuss the effects of fish biomass and water physicochemical properties on the microbiome.
1 Introduction
During the last century the demand for fisheries products has increased considerably, leading to the rapid development of the aquaculture sector (Food and Agriculture Organization of the United Nations, 2022). Recirculating Aquaculture Systems (RAS) are designed for intensive fish farming and a suitable practice for providing the increasing demand for fish (Badiola et al., 2012). Clarias gariepinus (Burchell, 1822) is an ideal fish for land-based closed aquaculture systems. It tolerates wide ranges of temperature, salinity, and low concentrations of dissolved oxygen (Food and Agriculture Organization of the United Nations, 2022). This extreme robustness is supported by the ability to breathe atmospheric oxygen. It can also sustain adverse environmental changes when kept under high stocking densities, since they show agonist behavioral responses (Van de Nieuwegiessen et al., 2010; Vera et al., 2011). To date, Brazil, Hungary, The Netherlands, Arab Republic, Syria, Cameroon, Kenya, Mali, Nigeria, and South Africa are considered top producing countries (Food and Agriculture Organization of the United Nations, 2021), while its production in Germany reached 806,734 t in 2021 (Destatis Statistisches Bundesamt, 2020).
To maintain optimal conditions for rearing fish in RAS it is vital to prevent physiological stress and/or microbial infections. RAS must ensure efficient recirculation and wastewater treatment because it undergoes biochemical and biological changes resulting from fish metabolism, stocking densities, bacterial metabolism, feeding regime, management routine and others (Food and Agriculture Organization of the United Nations, 1992; Keramat, 2008). Water quality basically relies on physicochemical water parameters such as O2, nitrogen, phosphorus and CO2 concentration, but also on the microbial community (Jegatheesan et al., 2011; Lucas and Southgate, 2012). The ability of microorganisms to aerobically and anaerobically remove ammonium, nitrite, nitrate, phosphate and oxygen from wastewater is well documented in freshwater aquaculture systems (Jegatheesan et al., 2011; Lin et al., 2016; Li et al., 2017; Ni et al., 2018; Li et al., 2020). The bacteria forming these communities are generally classified depending on their metabolic role as heterotrophic, which metabolize organic matter in aerobic conditions, and nitrifying bacteria, which are involved in the nitrogen cycle. In intensive systems the accumulation of organic compounds promotes the growth and selection of heterotrophs, resulting in a higher total bacterial load, unstable microbial communities, and certain water conditions which can negatively affect fish health and performance (Subhash et al., 2007; Bhakta et al., 2010; Subhash and Lipton, 2010; Califano et al., 2017; Liu et al., 2019).
Unlike nitrifying bacteria, certain heterotrophic bacteria present in the system are capable of infecting fish (Shi et al., 2012; Lee et al., 2016). For instance, some of these opportunistic and pathogenic bacteria infecting freshwater fish belong to Aeromonas sp., Pseudomonas sp., Flavobacterium sp., Streptococcus sp., Shewanella sp., or Staphylococcus sp. (Pękala-Safińska, 2018). Some important pathogens reported in Catfish culture are Edwardsiella ictaluri, Aeromonas sp. and Flavobacterium columnare (Wise et al., 2021). Several disease agents can infect the host due to a combination of factors, which include poor immune status of fish, adverse environmental conditions and the pathogen’s virulence. Such viral or bacterial disease outbreaks and parasite infections also imply economic losses for the production (Food and Agriculture Organization of the United Nations, 1992; Keramat, 2008). Infections caused by these harmful agents are linked to environmental conditions and influence each other directly. Fish reared in aquaculture systems seem to be more vulnerable and susceptible to pathogen infections than wild fish (Hennersdorf et al., 2016). Though bite wounds are regularly recorded on the cultivated fish (Baßmann et al., 2017), Clarias gariepinus skin lesions are rapidly healed (Baßmann et al., 2020), so the risk to initiate an infection and a subsequent disease outbreak would be reduced. It is unclear whereas this attribute is caused by the general holding conditions or by the presence/absence of specific beneficial or pathogenic bacteria.
The description of microbial communities and their influence on water quality under various operation conditions in Catfish commercial aquaculture systems remains poorly understood. Little has been documented in shellfish (Subhash et al., 2007; Subhash and Lipton, 2010; Liu et al., 2019; ), and other larval or fish productions (Bhakta et al., 2010; Califano et al., 2017; Dahle et al., 2022). Water microbiota may also differ between different subunits of the RAS, i.e., fish tank, drum filter, sediment tank or biofilter, where distinct water nutrients and bacterial metabolic products are observed (Schmauz et al., 2017). Progress may lead to the development of a balanced microbiota community that could contribute to water purification and fish welfare, resulting in a healthier and more efficient production system (Mannan et al., 2012; Abdel-Wahed et al., 2018). The FishGlassHouse at Rostock University allows experimental studies of commercial African catfish cultivation under different stocking densities. Its RAS has been studied for nutrient dynamics, element and energy pathways (Palm et al., 2018), and organic matter composition and phosphorus speciation of solid waste (Prüter et al., 2020). The present study aims to describe the microorganisms’ community composition during a C. gariepinus rearing trial, testing three different stocking densities (extensive, semi-intensive and intensive), by sequencing the 16S rRNA genes amplified from water samples. We compared general community composition and potentially pathogenic bacteria groups between sample type and system at phyla, family and genera taxonomical levels. This knowledge can be used to develop African Catfish commercial RAS further, detecting potential shifts of the microorganism’s populations with increasing stocking densities and potential implications on the fish health status and performance.
2 Material and methods
2.1 Sample collection, storage
The analyses of the water microbiome took place at the aquaculture and aquaponics research facility “FishGlassHouse” (FGH, PAL Anlagenbau GmbH, Germany) at University of Rostock (Germany), Faculty of Agricultural and Environmental Sciences. The facility consists of three warm water recirculating aquaculture systems (RAS) which are connected to different hydroponic subunits (Figure 1). Each RAS consists of the same basic components: a) fish tanks with a total water volume of 9 m3 (n=9), b) settling tank with lamella inserts (n=1), c) pump-sump (n=1), d) UV-lamp (n=1) e) trickling filter (n=1) and f) trickling filter-sump (n=1) (for detailed specifications see Palm et al., 2018). Water parameters measured in triplicate at each sampling date included water temperature (°C), dissolved oxygen (%), pH, salinity (‰), conductivity (µS cm-1) and redox potential (mV) (Table 1). Fish was fed by automated feeders with the commercial feed “Skretting Meerval” France including 43.6% protein, 13.8% fat, 22.3% carbohydrates, 8.9% ash and 1.8% fiber. The daily feed ratio was adjusted following a feeding curve for commercial systems (PAL Anlagenbau GmbH, Germany).
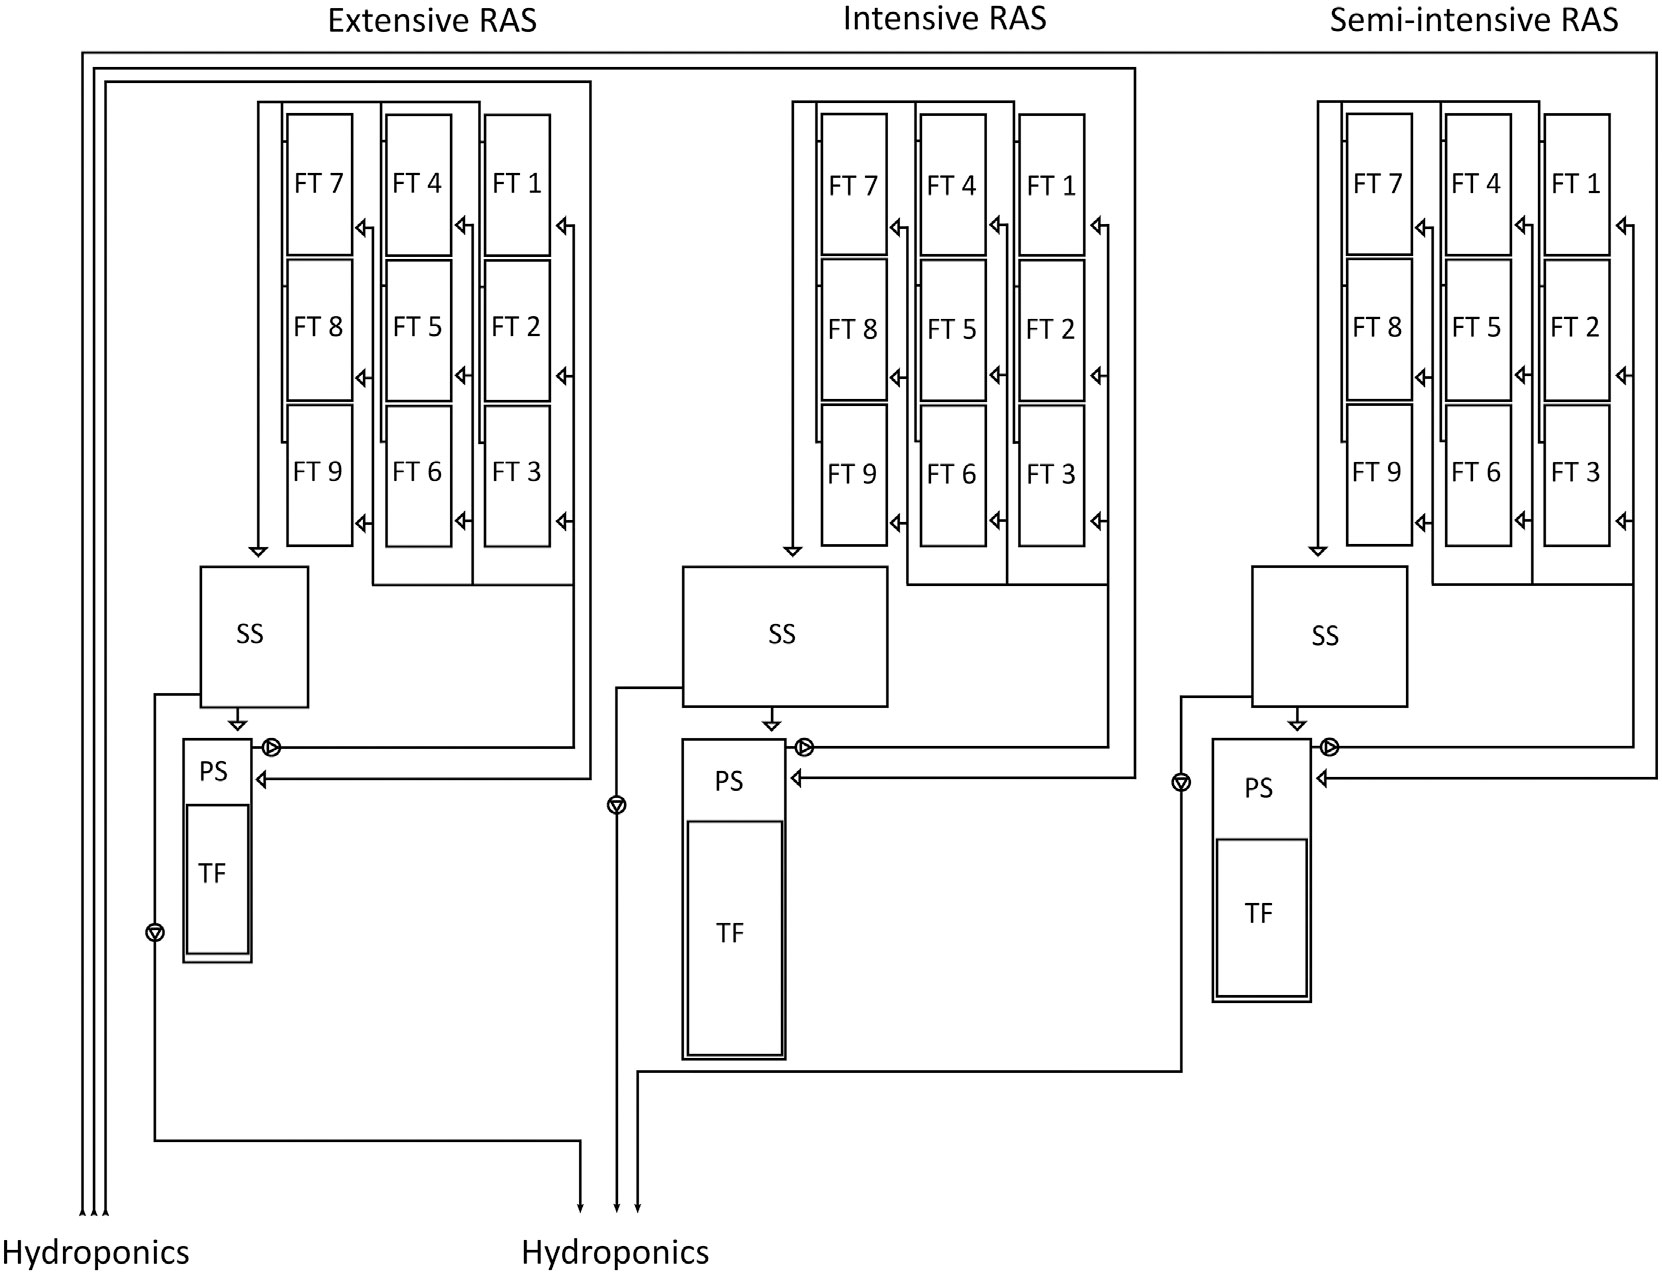
Figure 1 Schematic diagram of the three aquaculture units (RAS) from the research facility “FishGlassHouse”) at the University of Rostock. Water flow direction is represented in arrows.
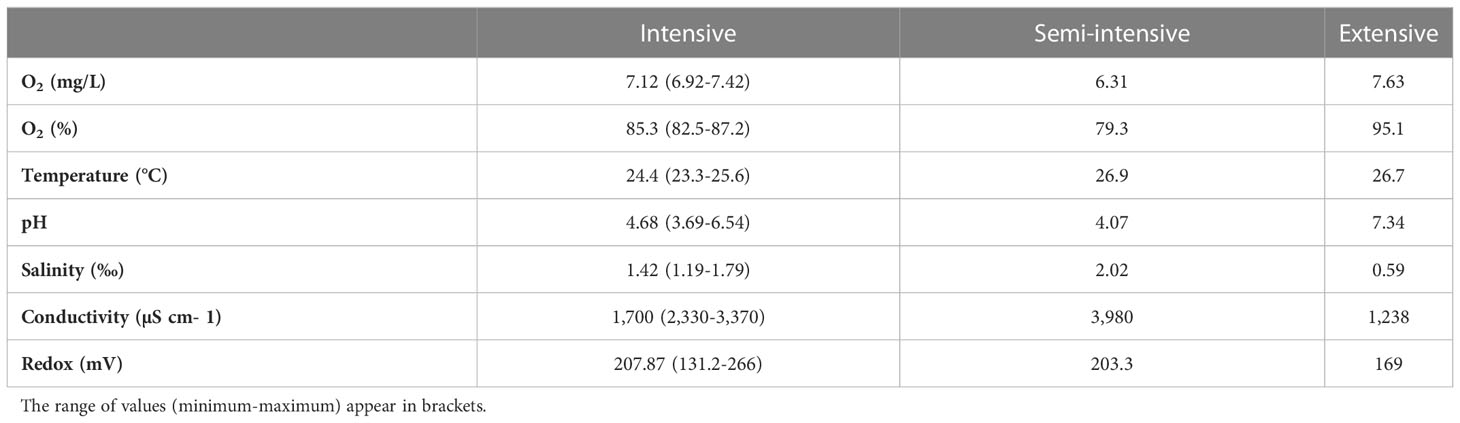
Table 1 Mean values of physicochemical water parameters measured from each system (intensive, semi-intensive and extensive) at each sampling date.
Samples from the intensive RAS (S1) were obtained on the 24th of September 2018 and 13th of November 2018, with 81.65 kg/m3 of fish distributed in 9 tanks and 53.80 kg/m3 of fish distributed at 6 tanks respectively. The semi-intensive system (S2) was sampled on the 9th of January 2019 and had 88.97 kg/m3 of fish in 9 tanks, and the extensive system (S3) on the 13th of November 2018 with 18.18kg/m3 fish in 6 production tanks. African catfish (Clarias gariepinus) was stocked at three different densities; low at the extensive system (25 individuals/m3), medium at the semi-intensive system (70 ind./m3) and high at the intensive system (120-130 ind./m3). The sampling design followed the regular stocking in the commercially run FishGlassHouse, so as to sample at different stocking situations inside the systems. All fish was obtained from the same hatchery (Fishzucht abtshagen GmbH & Co., Germany). On the 24th September 2018, a first bacterial sample was taken from the intensive system only under maximum possible fish load and staggered production, with 3 batches of fish and one of them directly before harvesting with a maximum average weight of about 1.9 kg. After harvesting and six weeks later (13th November 2018), a comparative sample was taken inside the staggered extensive and intensive systems with two fish batches each of the same size classes, reaching an average weight of about 0.7 kg and 1.0 kg. Three tanks were still unstocked. Finally, a third sampling was taken inside the semi-intensive system at its maximal possible stocking density directly before harvesting 9 fish tanks with an average fish size of 2.1 kg.
Water was sampled from each system by the aseptic collection of 1000 ml water in sterile containers. Three sampling points were considered: a) the filtered water that circulates to the entry of the fish tanks, named as water inflow, b) water that leaves the fish tanks and enters the sedimentation tank, named as water outflow, and c) the water from the sedimentation compartment before entering the biofiltration, or sedimenter water. Samples were directly transported to the laboratory and filtered using a millipore filter with the fineness of 0.22μm (Merck Millipore KGaA, Darmstadt, Germany). The supernatant in the filters of each sample was stored at -20°C.
2.2 DNA extraction, library preparation and sequencing
Samples from the filters were fixed in 1ml Lysis buffer and DNA was extracted using the DNeasy Power Water Kit (Qiagen GmbH, Hilden, Germany) by following the manufacturer’s instructions. The V3-V4 hypervariable region of the 16S rRNA gene was amplified using universal primers 515F (5´- TCG-TCG-GCA-GCG-TCA-GAT-GTG-TAT-AAG-AGA-CAG-GTG-CCA-GCM-GCC-GCG- GTA-A -3´, including adapter sequences) and 806R (5´- GTC-TCG-TGG-GCT-CGG-AGA-TGT- GTA-TAA-GAG-ACA-GGG-ACT-ACH-VGG-GTW-TCT-AAT -3´, including adapter sequences). Amplicon PCR, PCR clean-up, index PCR and second clean- up and final library dilution was performed essentially as described in the appropriate Illumina protocol (www.illumina.com, 16S Metagenomic Library Prep Guide). For each sample and a negative control, PCR reactions were performed with 2.5µl of forward and 2.5µl of reverse primers, 25µl 2xKAPA HiFi HotStart ReadyMix, 15µl H2O and 5ng/µl gDNA. The amplification protocol followed the Illumina protocol mentioned above. Successful amplification and amplicon size of each PCR product was checked using a Bioanalyzer DNA 1000 chip. PCR clean-up used AMPure XP beads. Again, index PCR, purification and final amplicon size check after the index PCR was essentially done as outlined in the Illumina protocol and size and quality was again determined by Bioanalyzer DNA 1000 chips. Individual sequencing libraries were pooled and 6.5 pM of the final library pool was subjected to paired end sequencing using an Illumina 600v3 sequencing kit on an Illumina MiSeq system. A density of 586 K/mm2 clusters was reached on the sequencing cell. A total of 12,794,957 amplicon reads was achieved, of which 11,751,581 reads were passing the quality filter.
2.3 Bioinformatics and statistical analyses
A total of 21,148,953 paired-end reads (250 bp) were obtained in FASTQ format from an Illumina MiSeq platform. Adapter sequences were removed from the raw sequencing reads using the trimming tool fastp (Chen et al., 2018a). Adapter-free paired-end reads were processed using the DADA2 pipeline (v 1.1.6), following the workflow described in Callahan et al. (2016). DADA2 method is an algorithm that infers higher-resolution error-free sequences, called amplicon sequences variants (ASV), from the library of noisy short reads generated by amplicon sequencing. It is analog to the traditional operational taxonomic unit (OTU), though it can resolve sequencing errors and infer true biological sequences in the sample.
Raw reads were filtered by removing reads with more than two expected errors and reads with undetermined bases. We truncated the forward and reverse strands after visually inspecting the read quality profiles, removing the first four and last 12 bases, respectively. The error model for the dataset was then learned, and paired reads were merged together to produce fully denoised contig sequences. At this point, we removed chimeric contigs and created the amplicon sequence variant (ASV) table. DADA2’s naive Bayesian classifier method was used to perform the taxonomic classification of the ASVs. We used the DADA2-formatted 16S rRNA Silva reference database for taxonomic assignment from kingdom to genus level. Our sequences are deposited at the National Center for Biotechnology Information (NCBI) under the accession number PRJNA875290.
Statistical analyses were performed at phylum, family, and genus levels using different packages in R version 4.1, and customed R scripts. We estimated sample richness, and alpha and beta diversities. To visualize ordination and clustering among samples, we ran principal coordinate analysis (PCoA) using weighted UniFrac distances. Heatmaps were further generated for the most abundant phyla and genera. We used DESeq2 (Love et al., 2014) to perform differential abundance (DA) analysis to determine the enrichment of ASVSs at various stocking densities. Statistical significance tests were limited to pairwise comparisons of systems with different levels of stocking density. ASVs with a significant enrichment have a false discovery rate (FDR) of less than 5% and a fold change of at least four.
3 Results
3.1 Abundances at phyla level
The microorganism’s community dynamics included in Bacteria and Archaea domains from water samples between different systems (intensive or high-density, semi-intensive or medium-density, and extensive or low-density) was evaluated from the inflow, outflow and sedimenter water. Overall, phyla that showed to have the highest actual abundance from all types of samples were Proteobacteria and Bacteroidetes. The medium-density system (S2) had the highest cumulative abundance of ASVs (Amplicon Sequence Variant), followed by the high-density and low-density system in descending order (Figure 2). Amplicon Sequence Variants represented 42 phyla, 384 families, and 1,191 genera, where Proteobacteria, Bacteroidetes and Firmicutes comprise the majority (average 66%) of the ASVs actual abundance in all samples and systems. The 15 most abundant ASVs analyzed from all samples correspond to the following phyla, in descending order; Proteobacteria (30.63%), Bacteroidetes (24.76%), Firmicutes (10.79%), Actinobacteria (10.62%), Fusobacteria (8.04%), Parcubacteria (4.88%), Verrucomicrobia (2.00%), Planctomycetes (1.71%), Candidatus Saccharibacteria (1.62%), Chloroflexi (0.99%), Chlamydiae (0.93%), Acidobacteria (0.57%), Nitrospirae (0.44%), Armatimonadetes (0.43%) and Euryarchaeota (0.24%) (Figure 2). Same order is followed for those phyla which have a contribution >1% when obtaining relative abundances (Figure 3). Exceptionally, Proteobacteria appeared to be the only dominant phyla at the sedimenter samples from the low-density system (S3), and at the outflow water samples from the high-density system (S1) (Figure 2). Also, high relative abundance was obtained of these phyla at its belonging group (Figure 3).
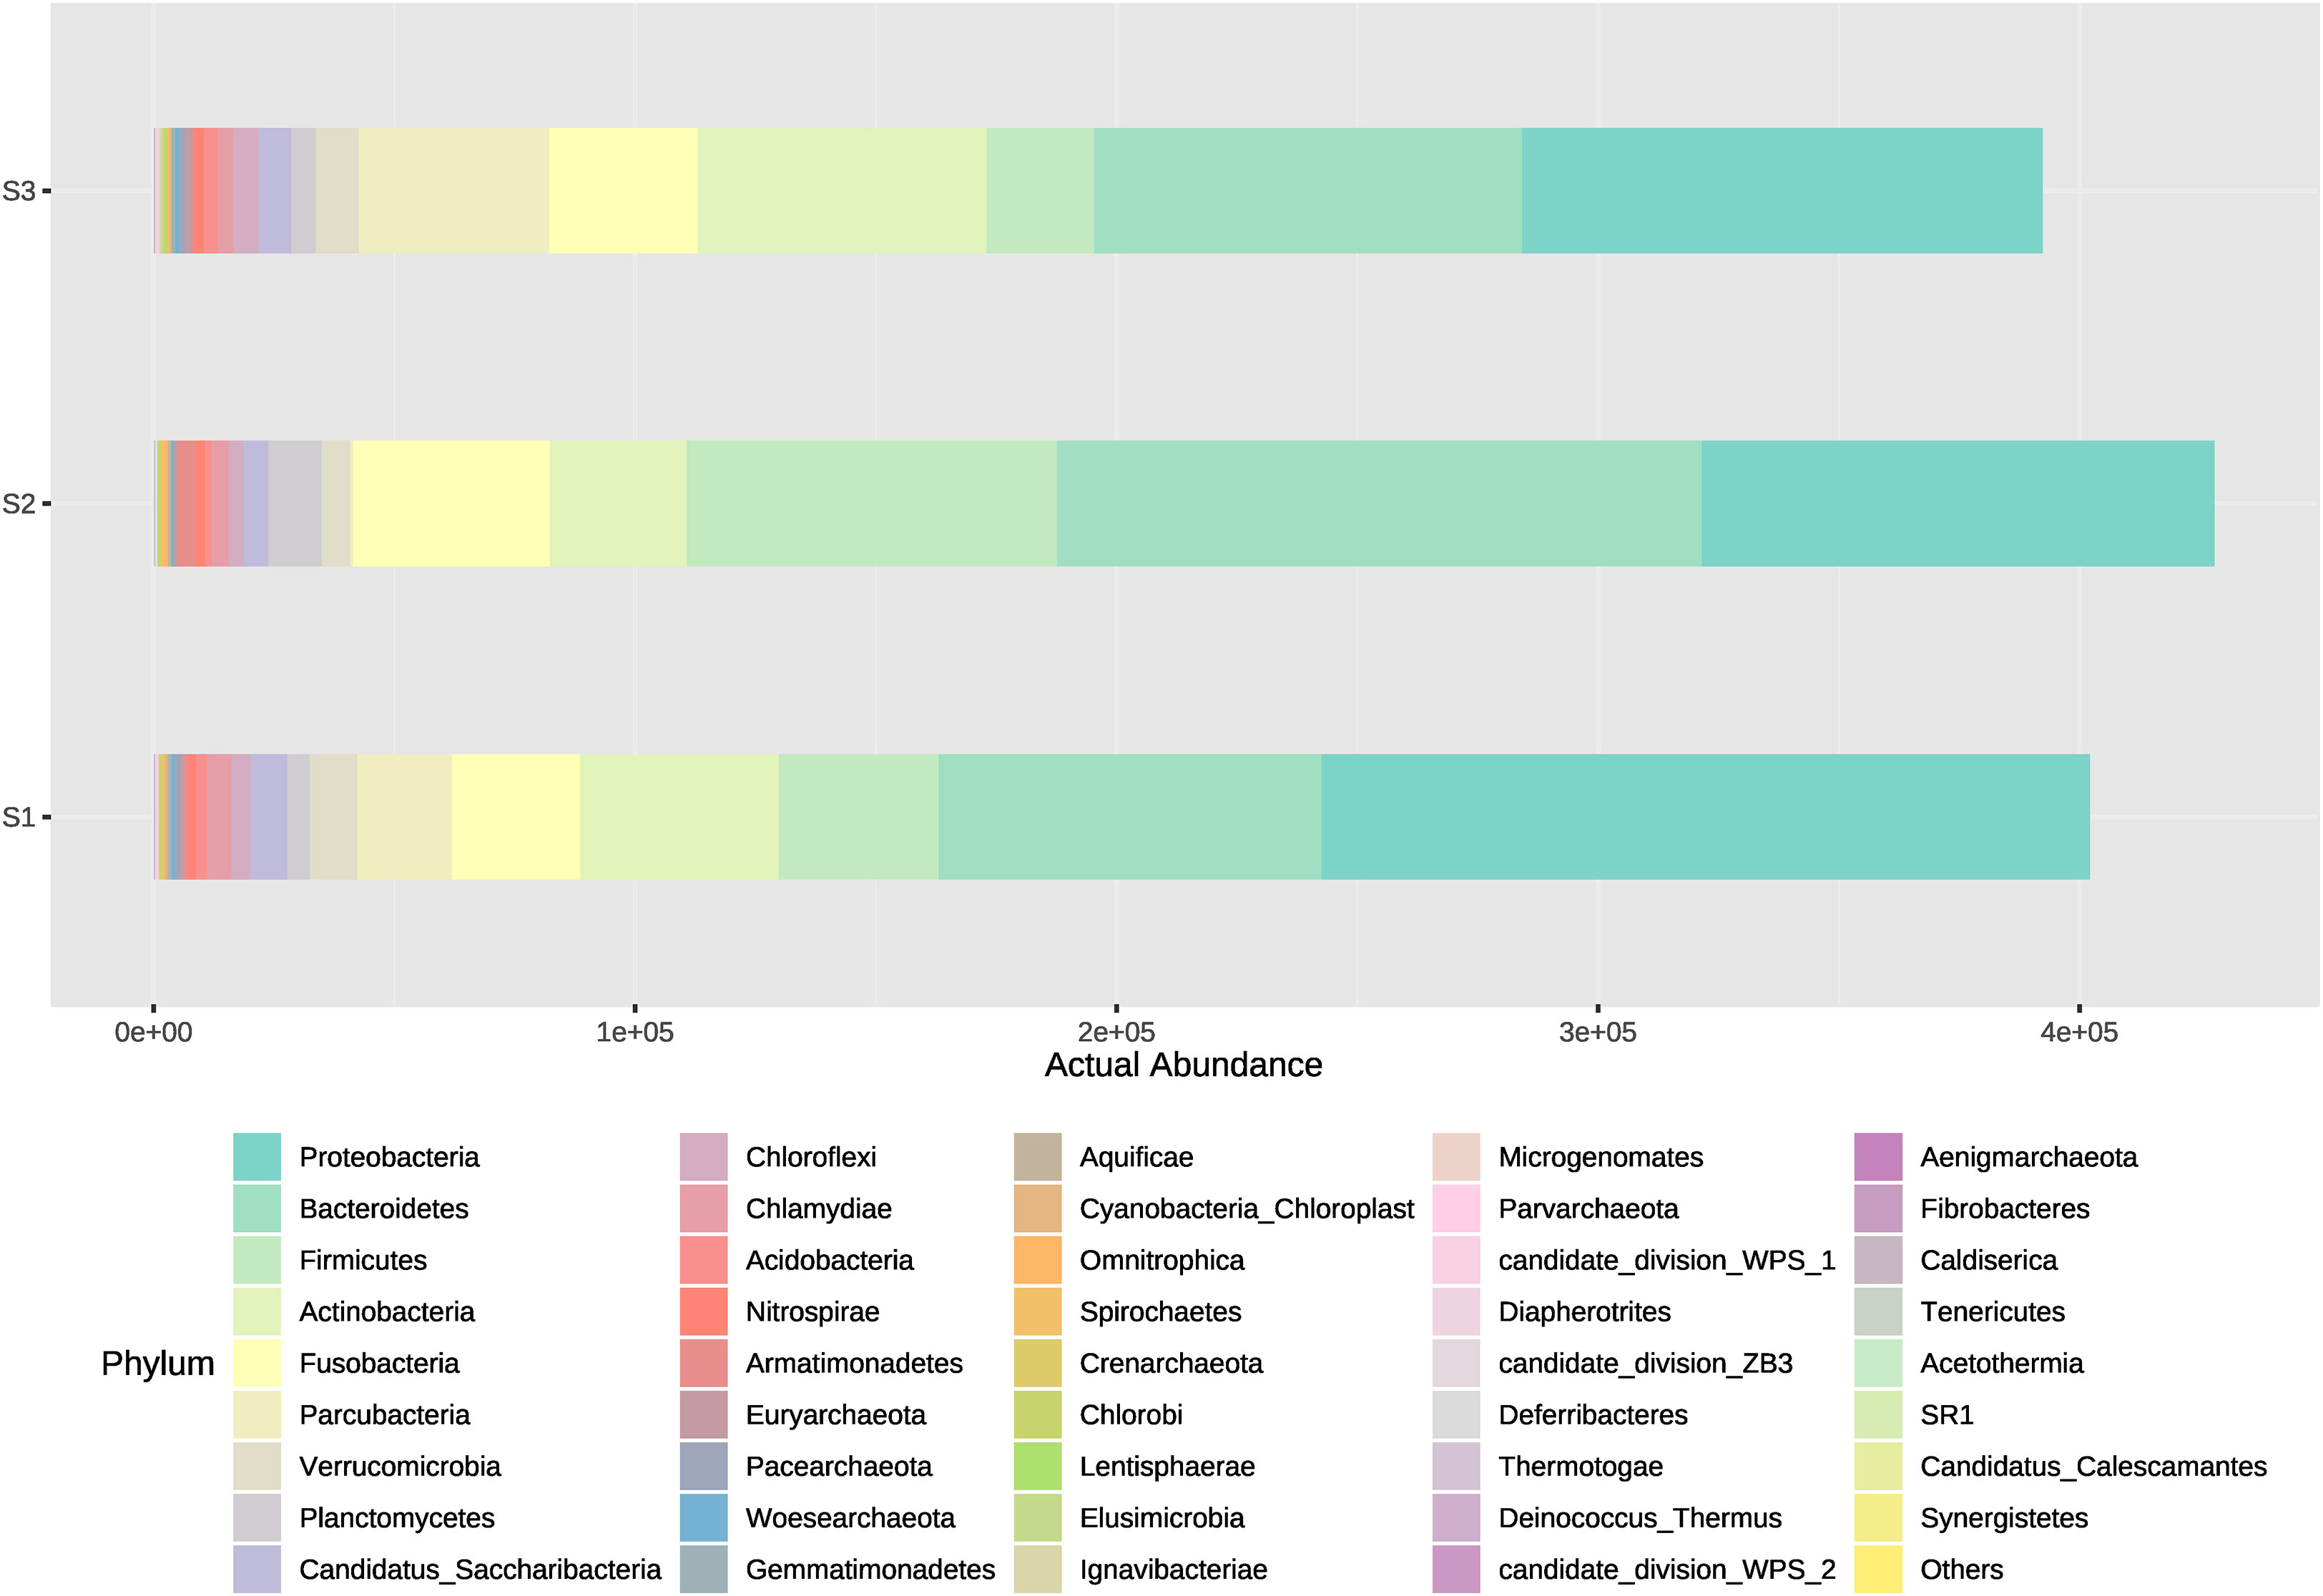
Figure 2 Actual abundances of all bacterial phyla present in water outflow, water inflow and sediment samples from three different systems: intensive, semi-intensive and extensive. The lateral axis shows the actual abundance of each phyla, and the vertical axis shows the name of each system.
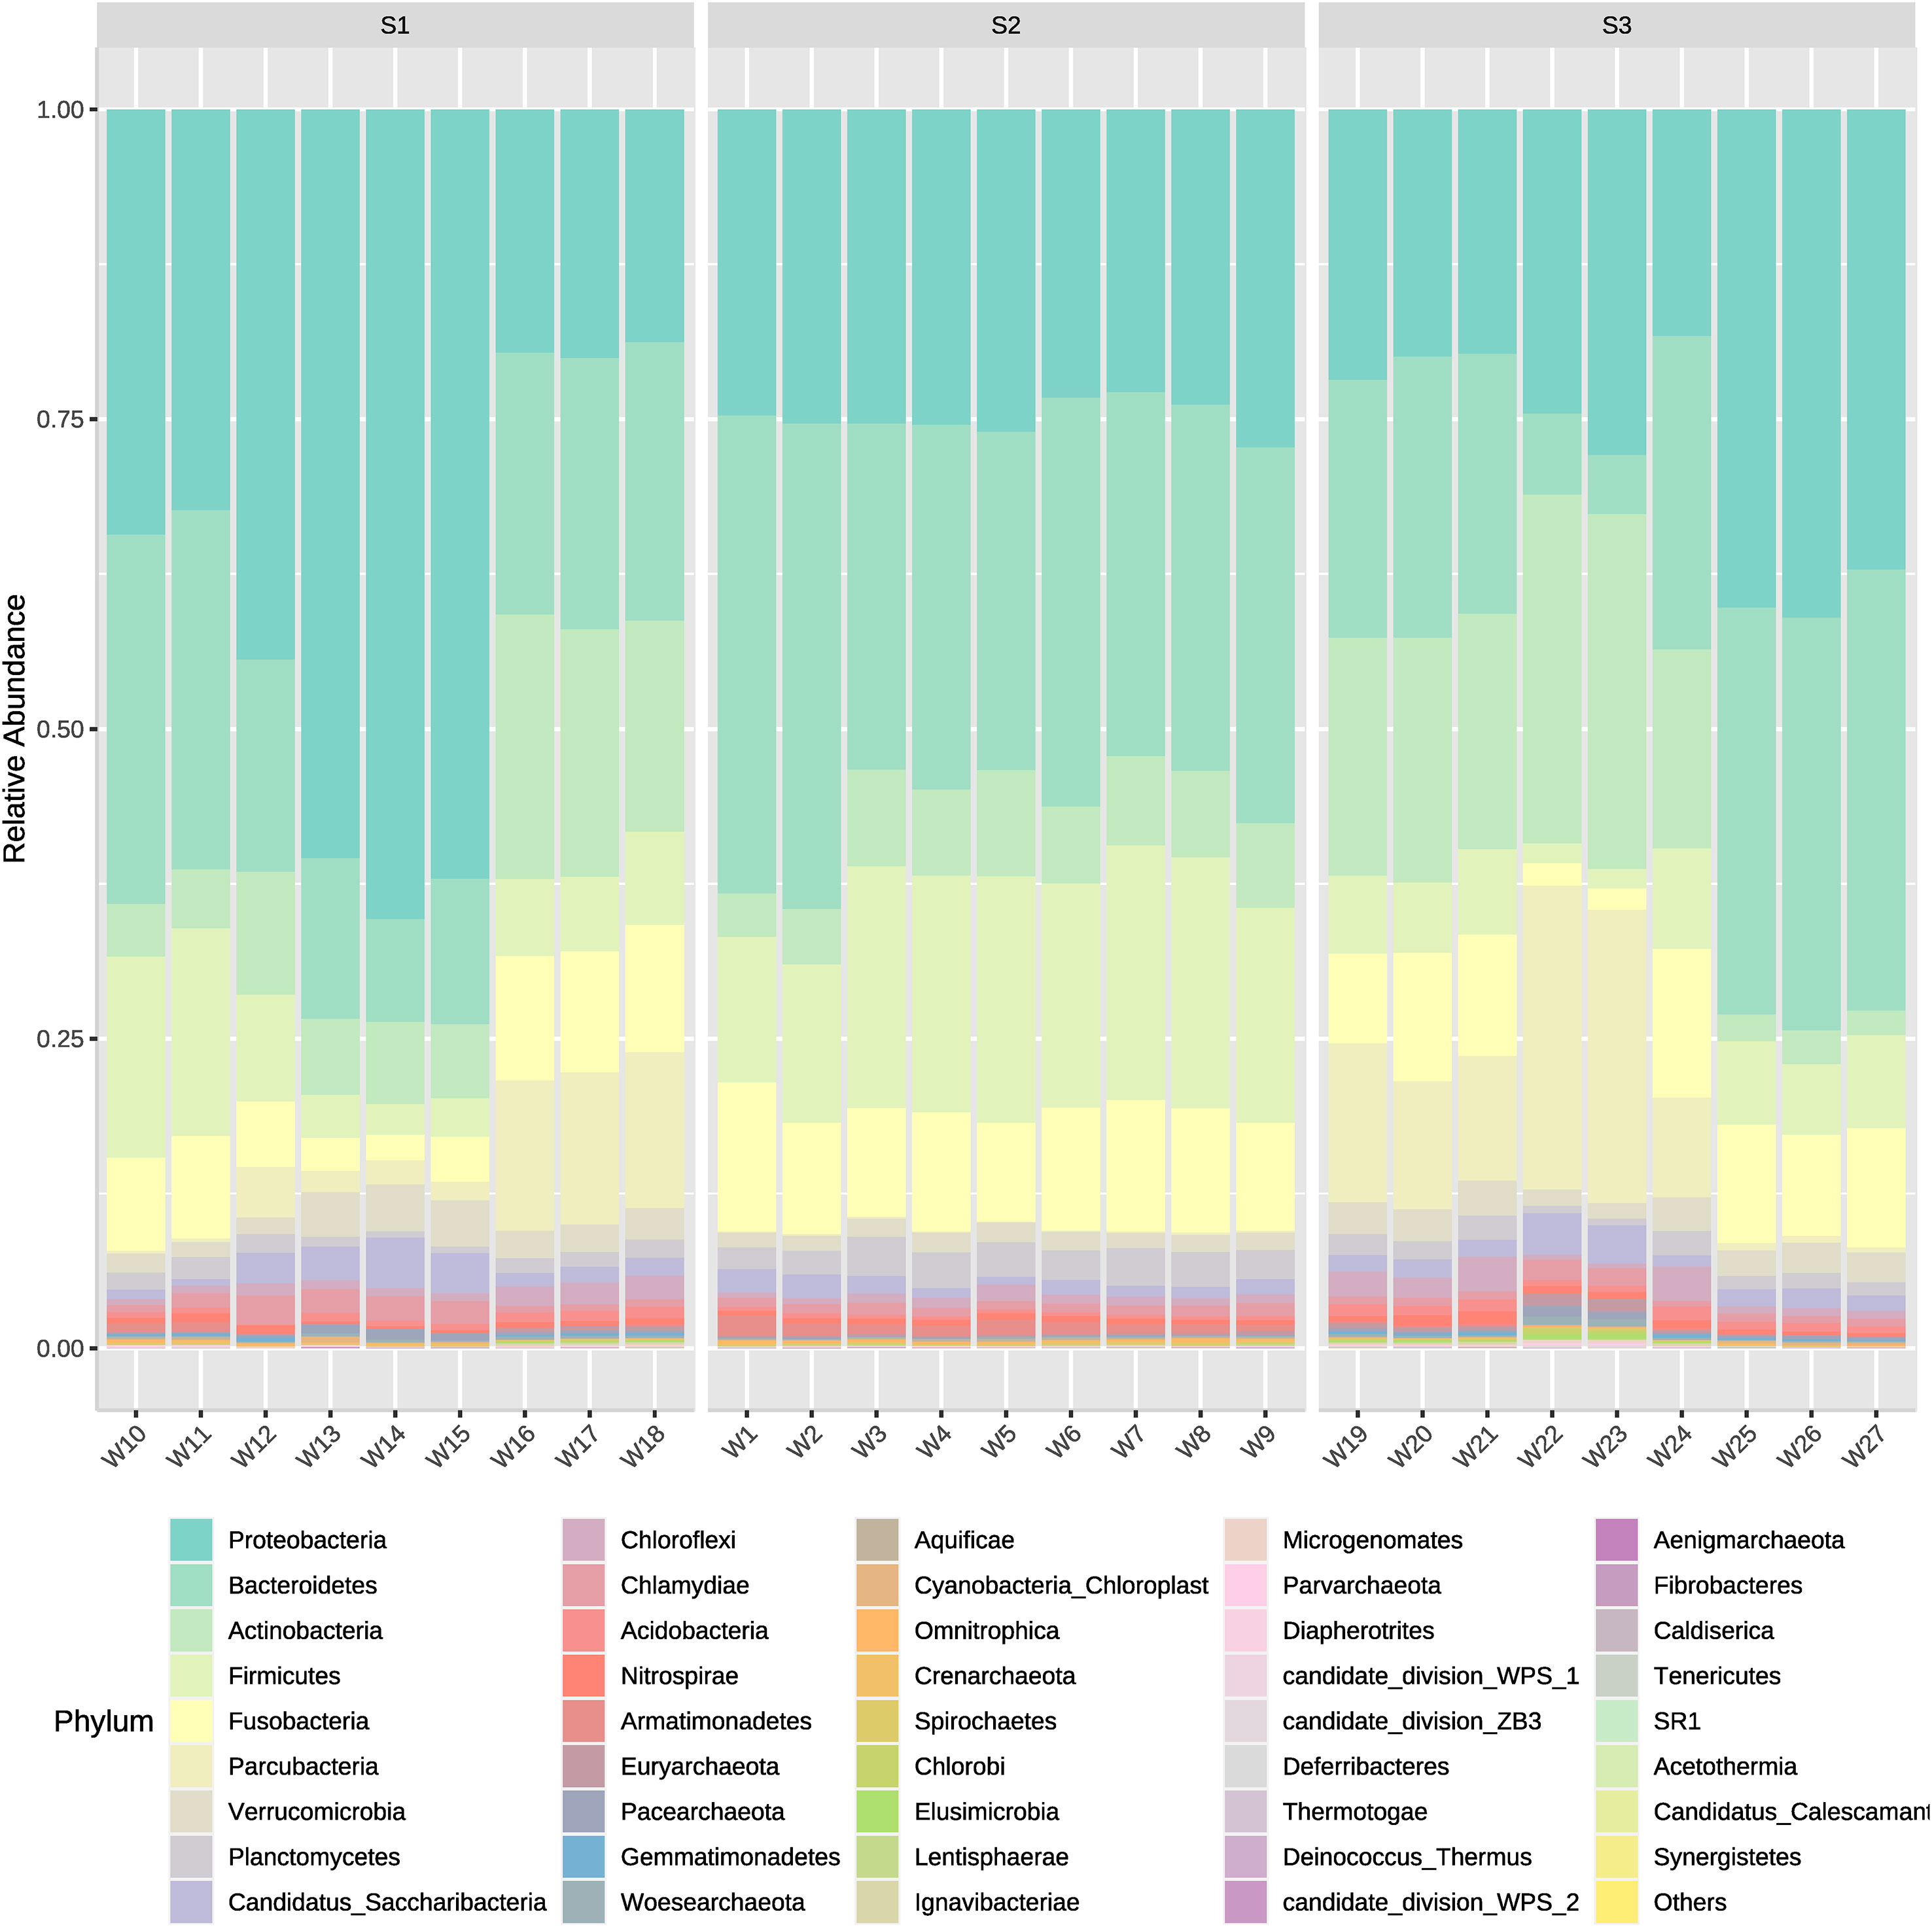
Figure 3 Mean relative abundances of all bacterial phyla present in water outflow, water inflow and sediment samples from three different systems: intensive, semi-intensive and extensive. The lateral axis shows the sample names, and the vertical axis shows the relative abundance of each phyla.
3.2 Differential abundance analysis
The differential abundance analysis quantifies the difference in abundance between all ASVs pairs. We identified several genera with varying abundances in relation to stocking density (Figure 4 and Supplementary Table 2). A large majority of ASVs (n=142) exhibit significant abundance differences between S2 (medium-density) and S3 (low-density) (Figure 4E). A high amount of ASVs (n=102) are also significantly different in abundance between S1 and S2 (Figure 4A), contrary to the results obtained when comparing S1 with S3, where only 14 ASVs are significantly abundant (Figure 4C). For instance, S2 is highly enriched with Mycobacterium when compared to S3 (Figure 4D). Limnohabitans is significantly abundant in S3 compared to S2, but not shared with S1 (Figure 4F). A comprehensive list of differentially abundant ASVs is provided in Supplementary Table 2.
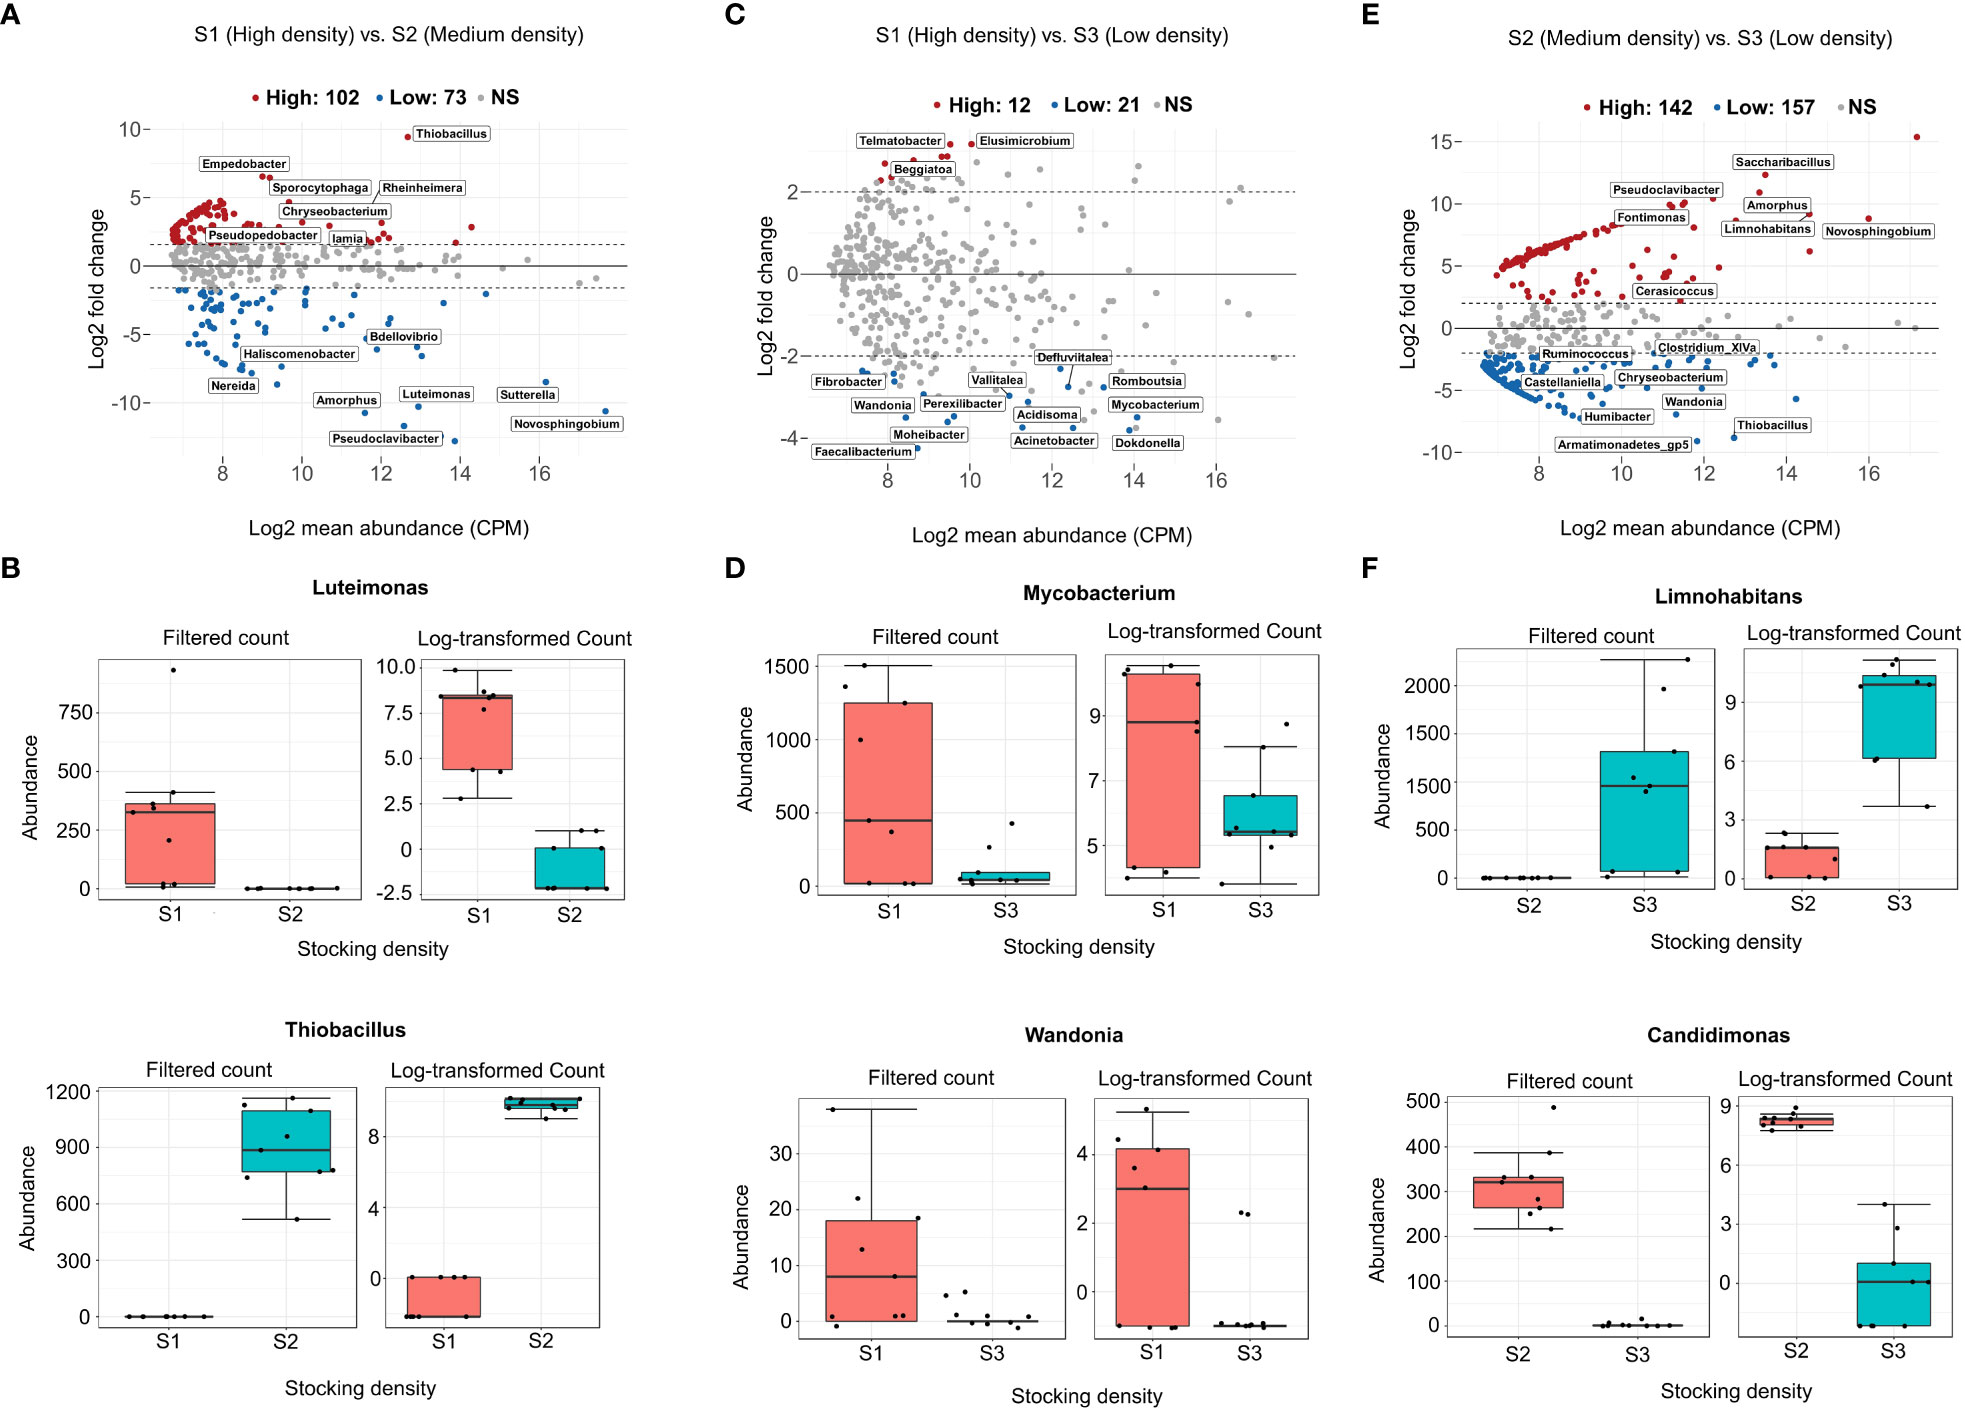
Figure 4 The difference in abundance of each genus between stocking density systems was tested using Generalized linear models with FDR 0.05 and logFC > 3. MA plots (A, C), (E) depict system-wide differential abundance between high (S1) and medium (S2), high (S1) and S3 (low), and medium (S2) and low (S3). Mean relative abundances (CPM) were calculated and plotted against log2 fold changes for all features in each system, including lowly and highly enriched ASVs. (B, D), (F) are examples of genera that are specific to each stocking density level.
3.3 Diversity values
In order to assess the bacterial community diversity, the diversity was measured by Shannon- Wiener Diversity Index and Simpson Diversity Index. The alpha-diversity was significantly higher at S2 compared to S3 (p-value ≤ 0.0001), and to S1 (p-value ≤ 0.05) (Supplementary Figure 1). Three different groups resulted from the beta-diversity values obtained within phyla taxonomical classification (Figure 5). All samples from S2 were grouped with less disparate separation between them, which means the bacterial community between samples was closely related. S1 and S3 seem to be correlated, in particular, inflow and sediments samples (Figure 5).
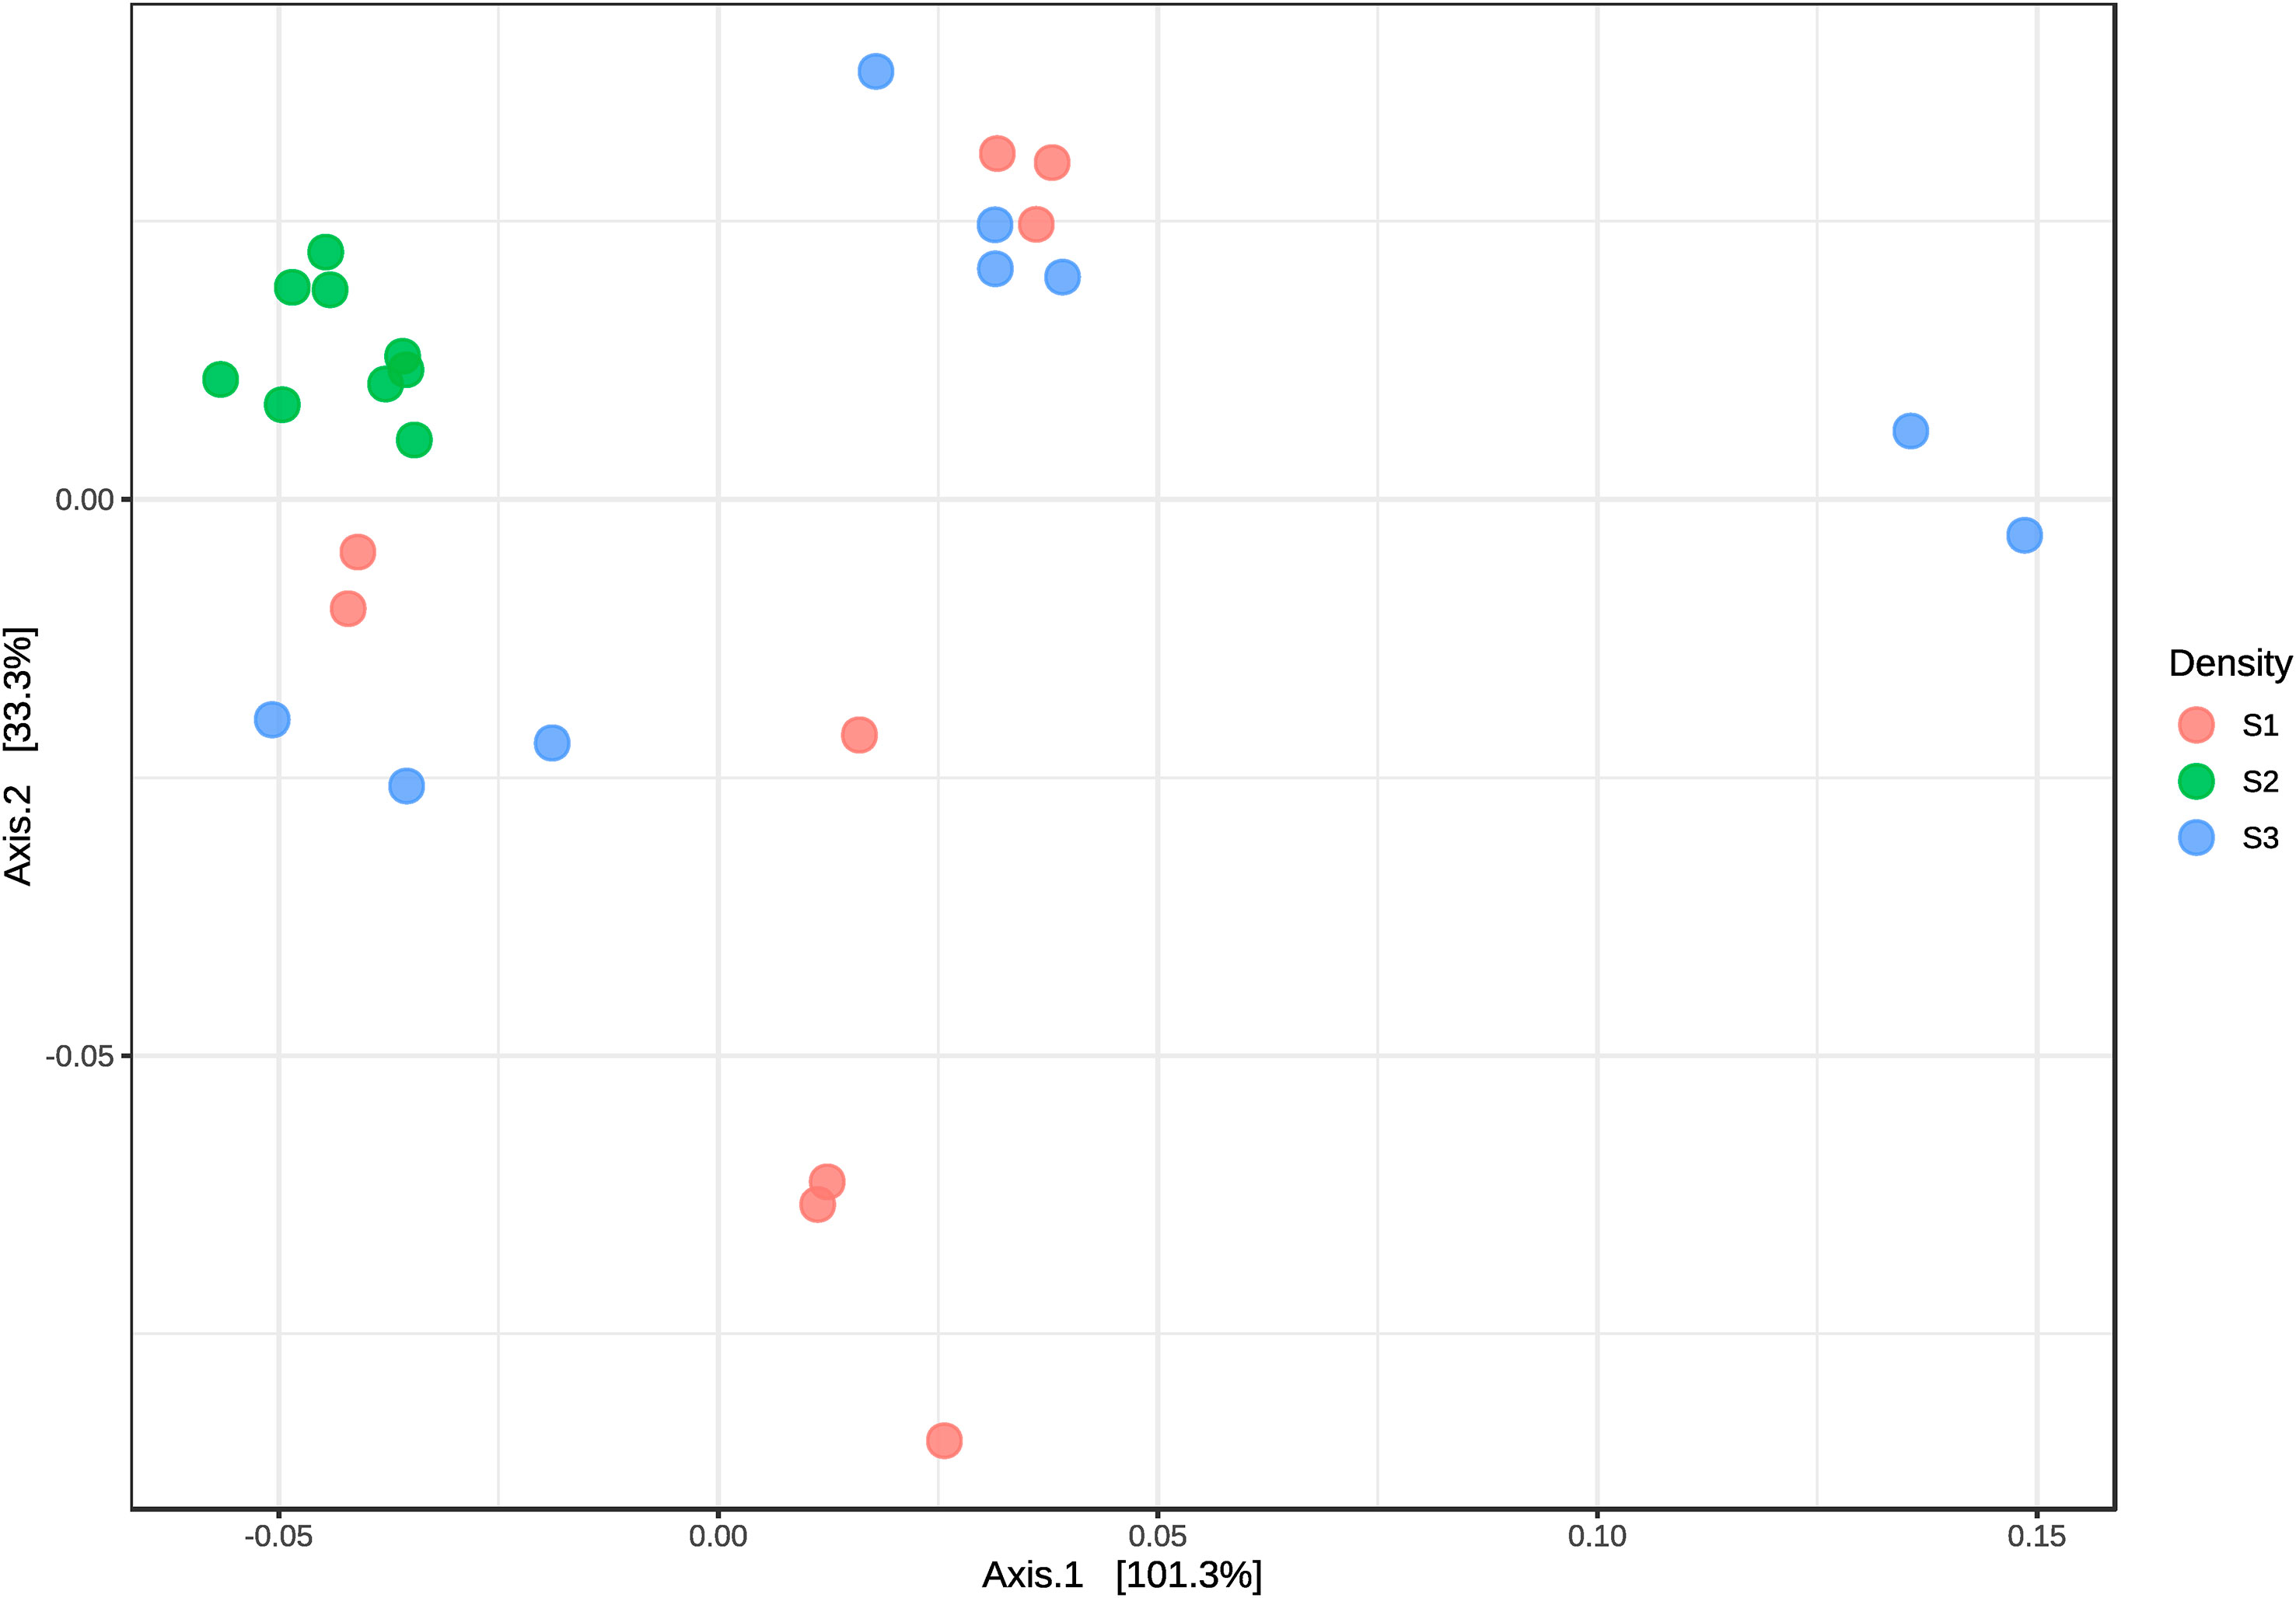
Figure 5 Principal coordinates analysis (PCoA) plot on the UniFrac distance matrix generated from taxon abundances and beta diversity from microbiome communities of water samples from S1, S2 and S3. Points that are closer together on the ordination have communities that are more similar.
3.4 Abundances at phyla level on a heatmap
At the high-density system (S1), the phyla with a high number of ASVs differed between sample points (Figure 6). The few dominant phyla observed in water inflow from this system were Gemmatimonadetes, Spirochaetes, and Nitrospirae. Also very few phyla appeared to be dominant at outflow water samples, although those phyla were Verrucomcrobia, Proteobacteria, Crenarchaeota, Saccharibacteria, and Chlamydiae. Samples from the sedimenter showed another pattern, where the abundance of bacteria is encountered in several phyla. In the medium-density system (S2), abundance values tended to be similar at each phylum between sample groups. High differences in abundance between phyla and sample were shown in the low-density system (S3). Generally, different phyla abundances changed between water inflow and water outflow samples, whereas mainly Bacteroidetes, Fusobacteria, and Aquificae tended to be the dominant phyla in sedimenter (Figure 6). Actinobacteria, Elusimicrobia, Woesearchaeota, Chlorobi, Euryarchaeota, and Paracubacteria showed an increase in abundance when water leaves the fish tanks, although this pattern was not shared within all sampling points. For instance, sample point W24 shared big dissimilarities of abundances between the other water outflow sample points (Figure 6).
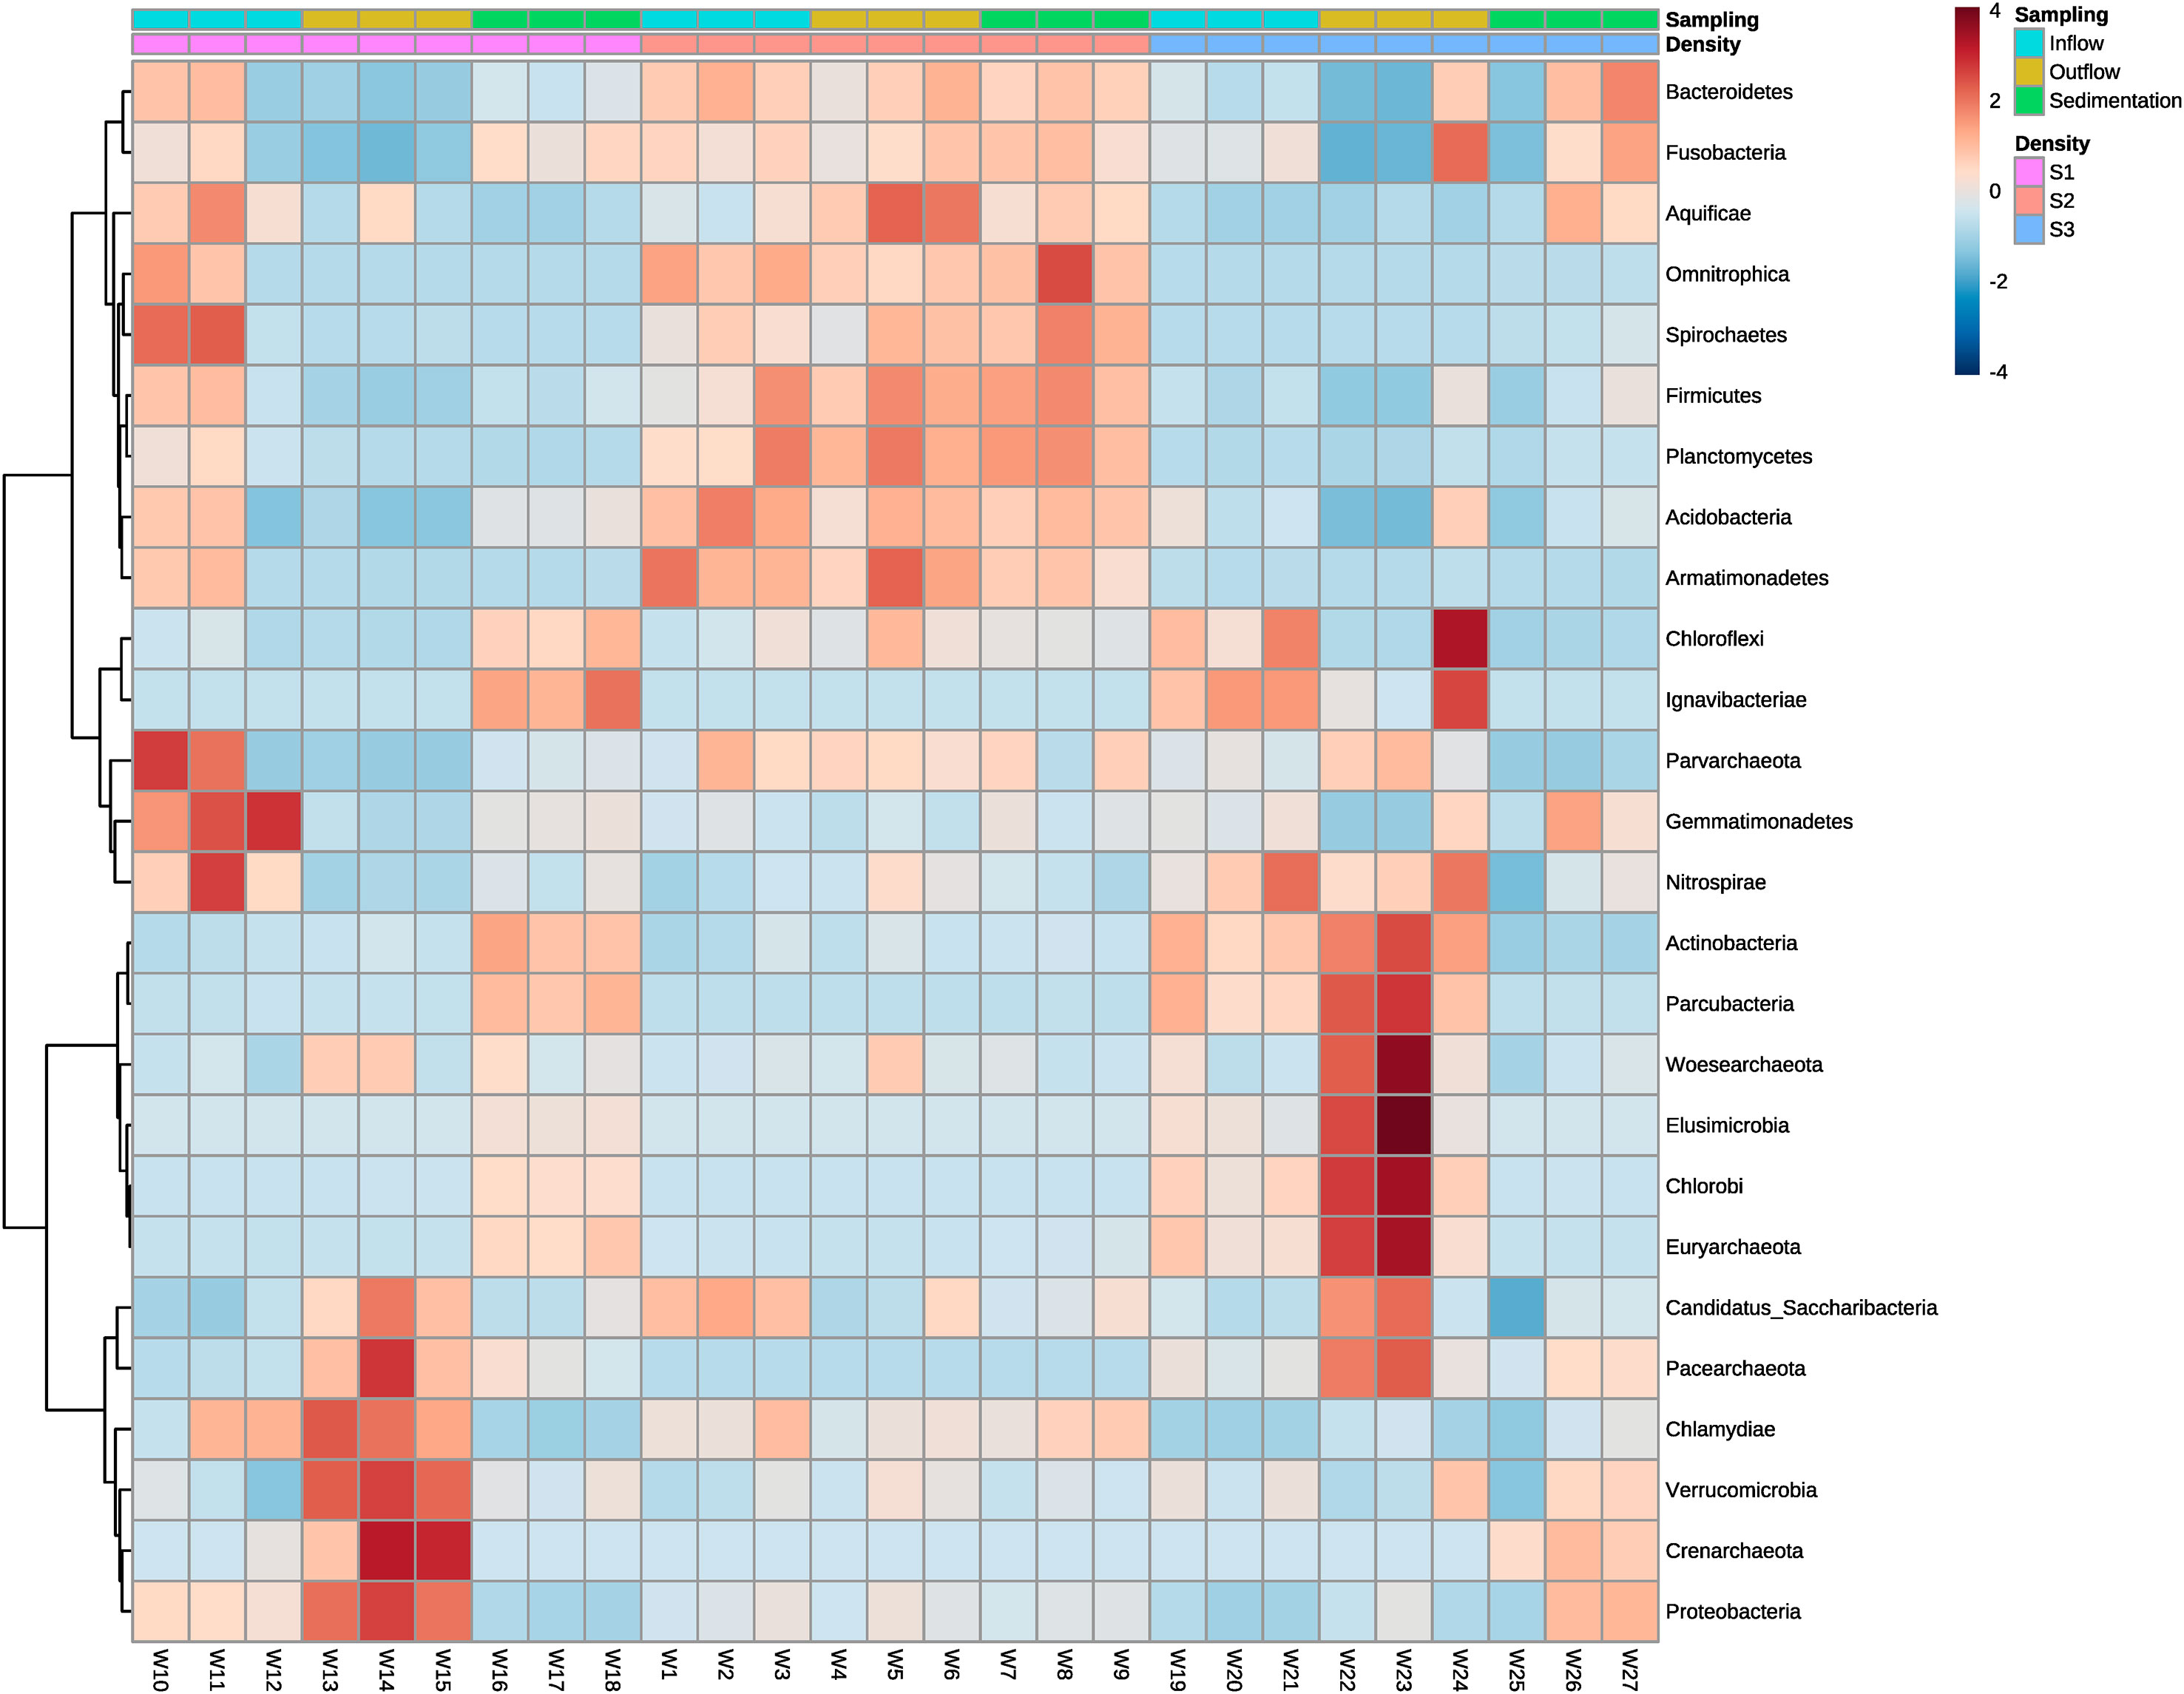
Figure 6 Heatmap showing the relative abundances of ASVs from water inflow, water outflow and sediment at intensive, semi-intensive and extensive systems. The taxonomy of ASVs (phyla) appears on the left. Differential abundances appear in two colors, red and blue, corresponding to low and high abundance of ASVs in the phyla respectively. High intensity colors denote in which sample the ASVs are more abundant. The legend on the right indicates the range of colors that represent each abundance (from -2 to 2) and the types of systems and samples. S1: high-density system; S2: medium-density system; S3: Low-density system.
3.5 Potentially pathogenic groups
Genus of potentially pathogenic bacteria identified were Mycobacterium, Pseudomonas, Edwardsiella, Flavobacterium, Yersinia, Rickettsia and Aeromonas. Those genus detected belong rather to Proteobacteria, Bacteroidetes or Actinobacteria, which appeared to have the greatest actual abundance in all samples (Figure 2). Therefore, to analyze which bacteria present in the system could potentially cause a disease outbreak, the genus of the most well reported fish pathogenic bacterial genus was considered and represented on two bar plots (Figures 7, 8). ASVs abundance that corresponded to pathogenic bacteria reached the highest values in samples from the high-density system (S1), specifically at water outflow samples and from the phyla Mycobacterium (Figure 7). The actual abundance of all phylum at the medium-density system (S2) was relatively high, and similar between sample points. Contrarily to S1, at low-density system (S3) values remained remarkably low except in two samples from the sedimenter.
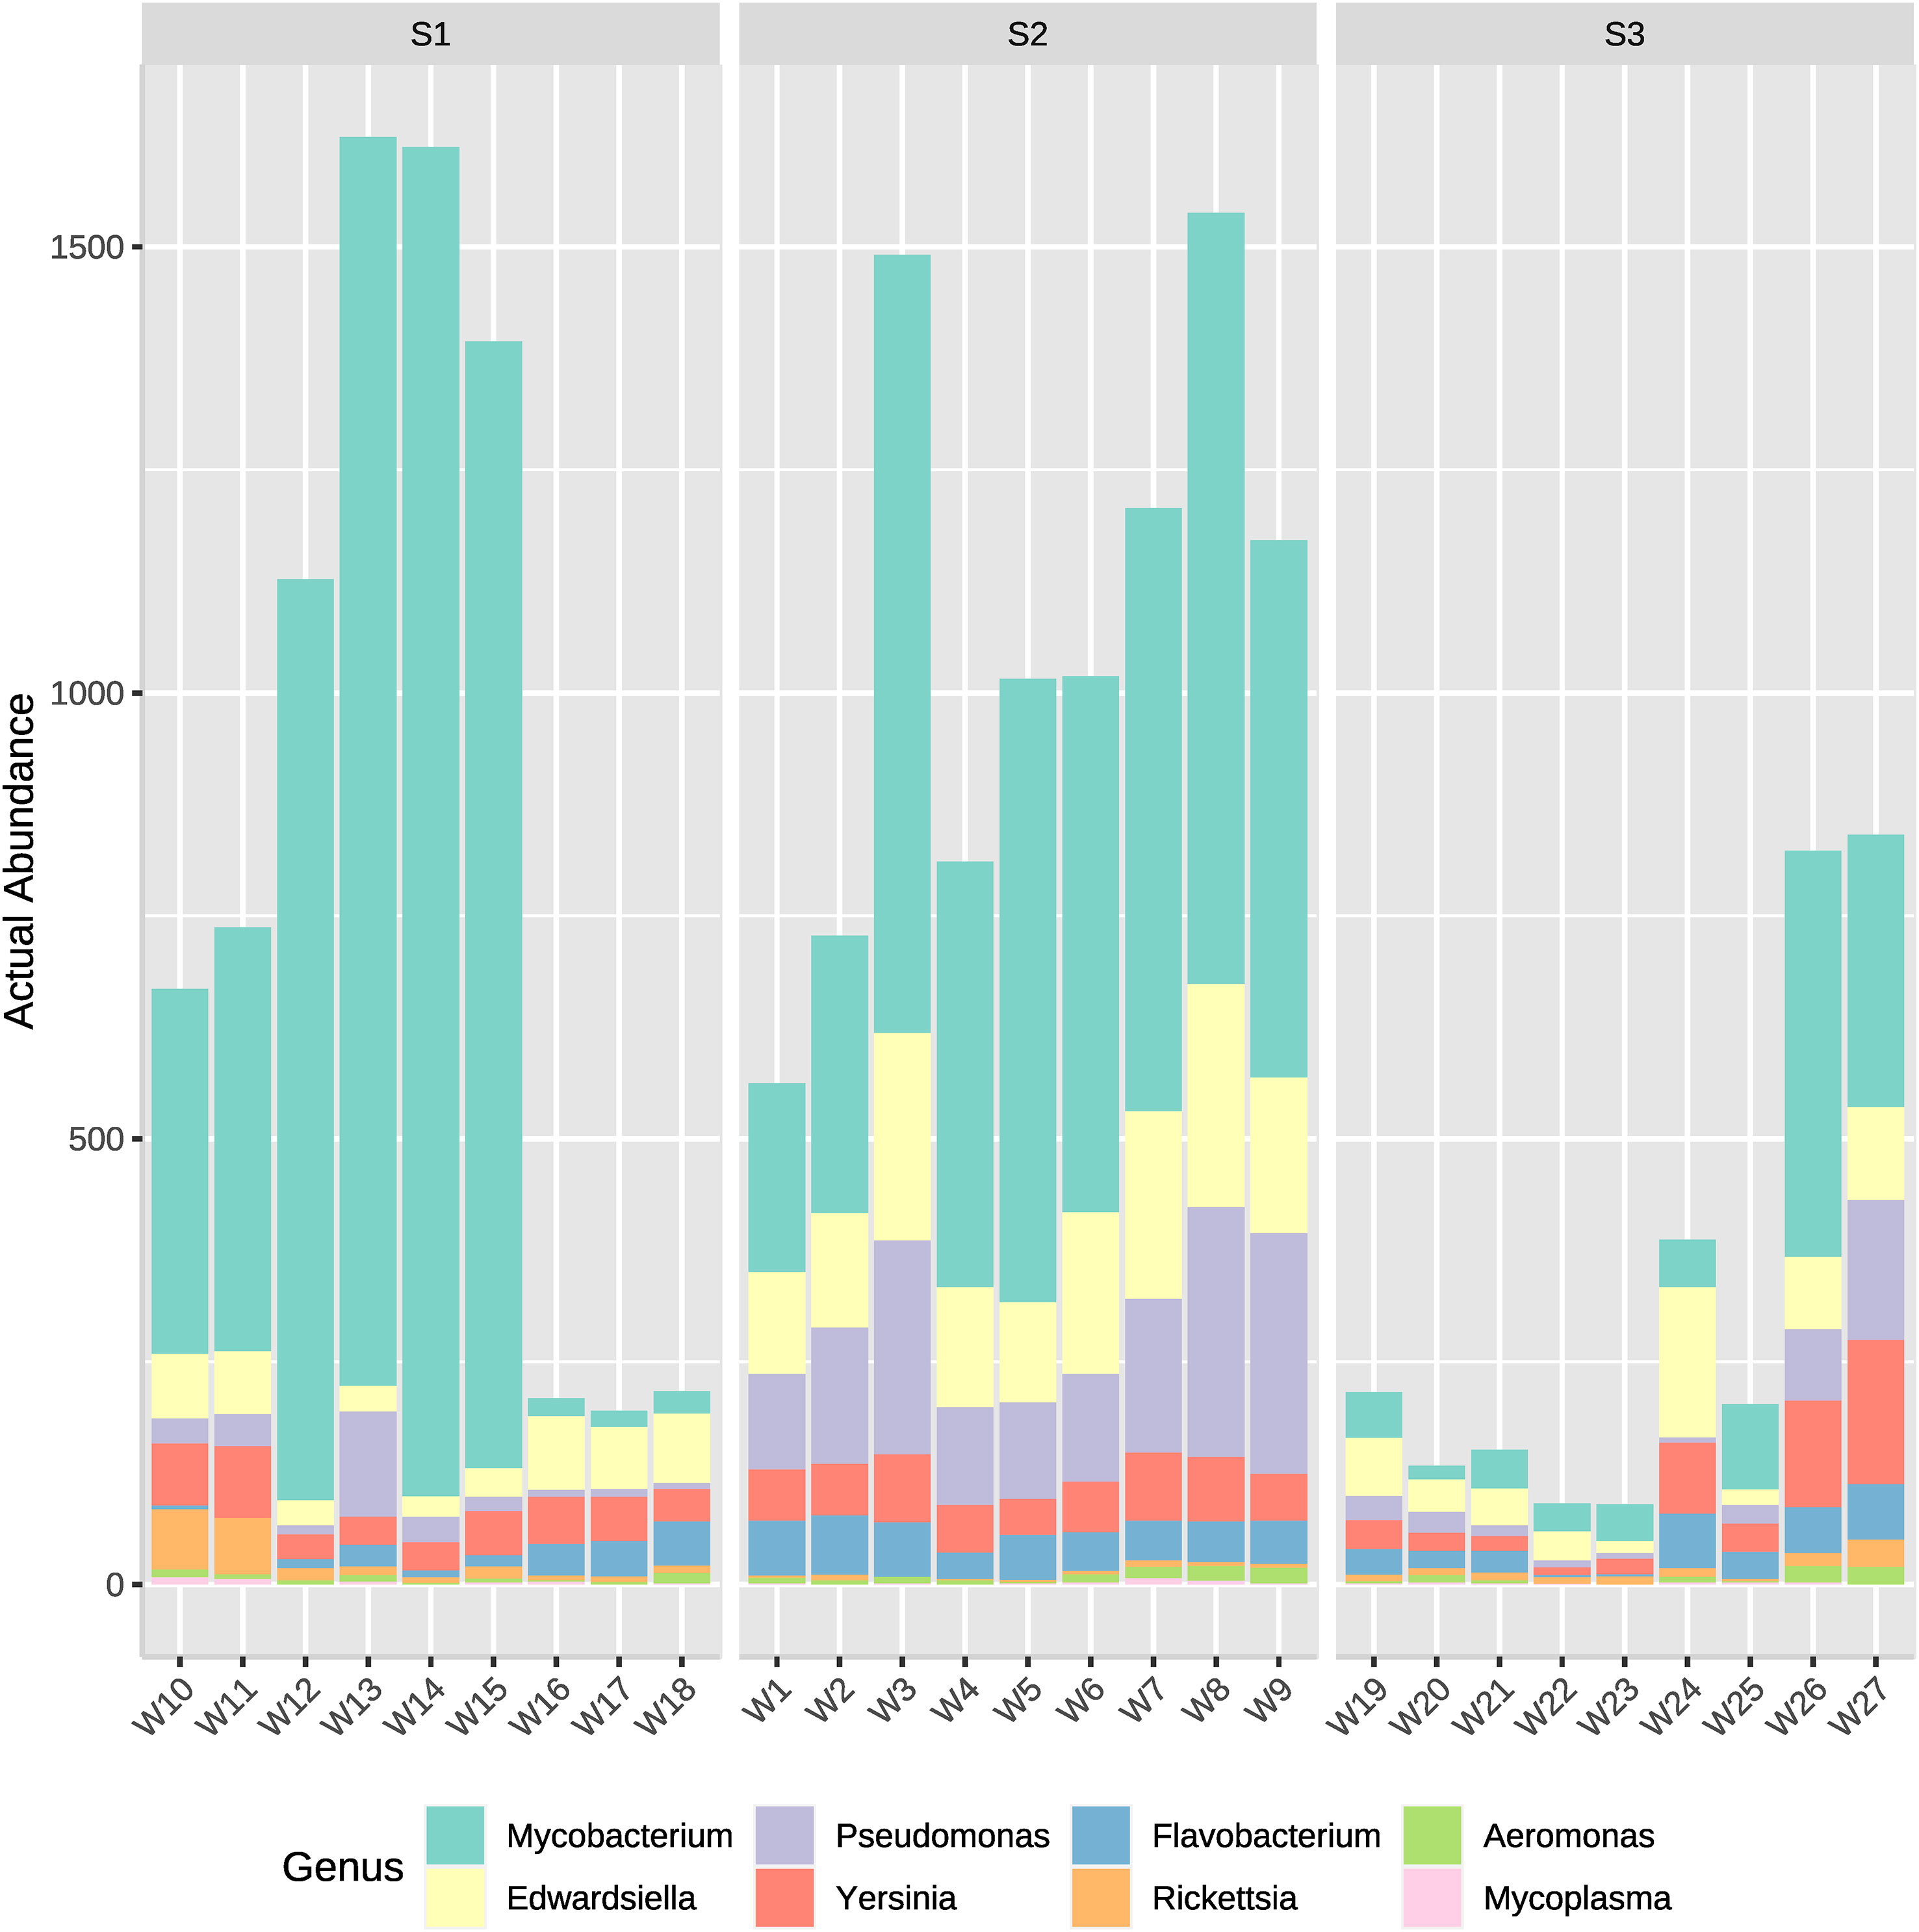
Figure 7 Actual abundances of ASVs corresponding to several potentially pathogenic bacterial genera. Each plot bar correspond to a sampling point from the high- (S1), medium- (S2) and low-density (S3) systems.
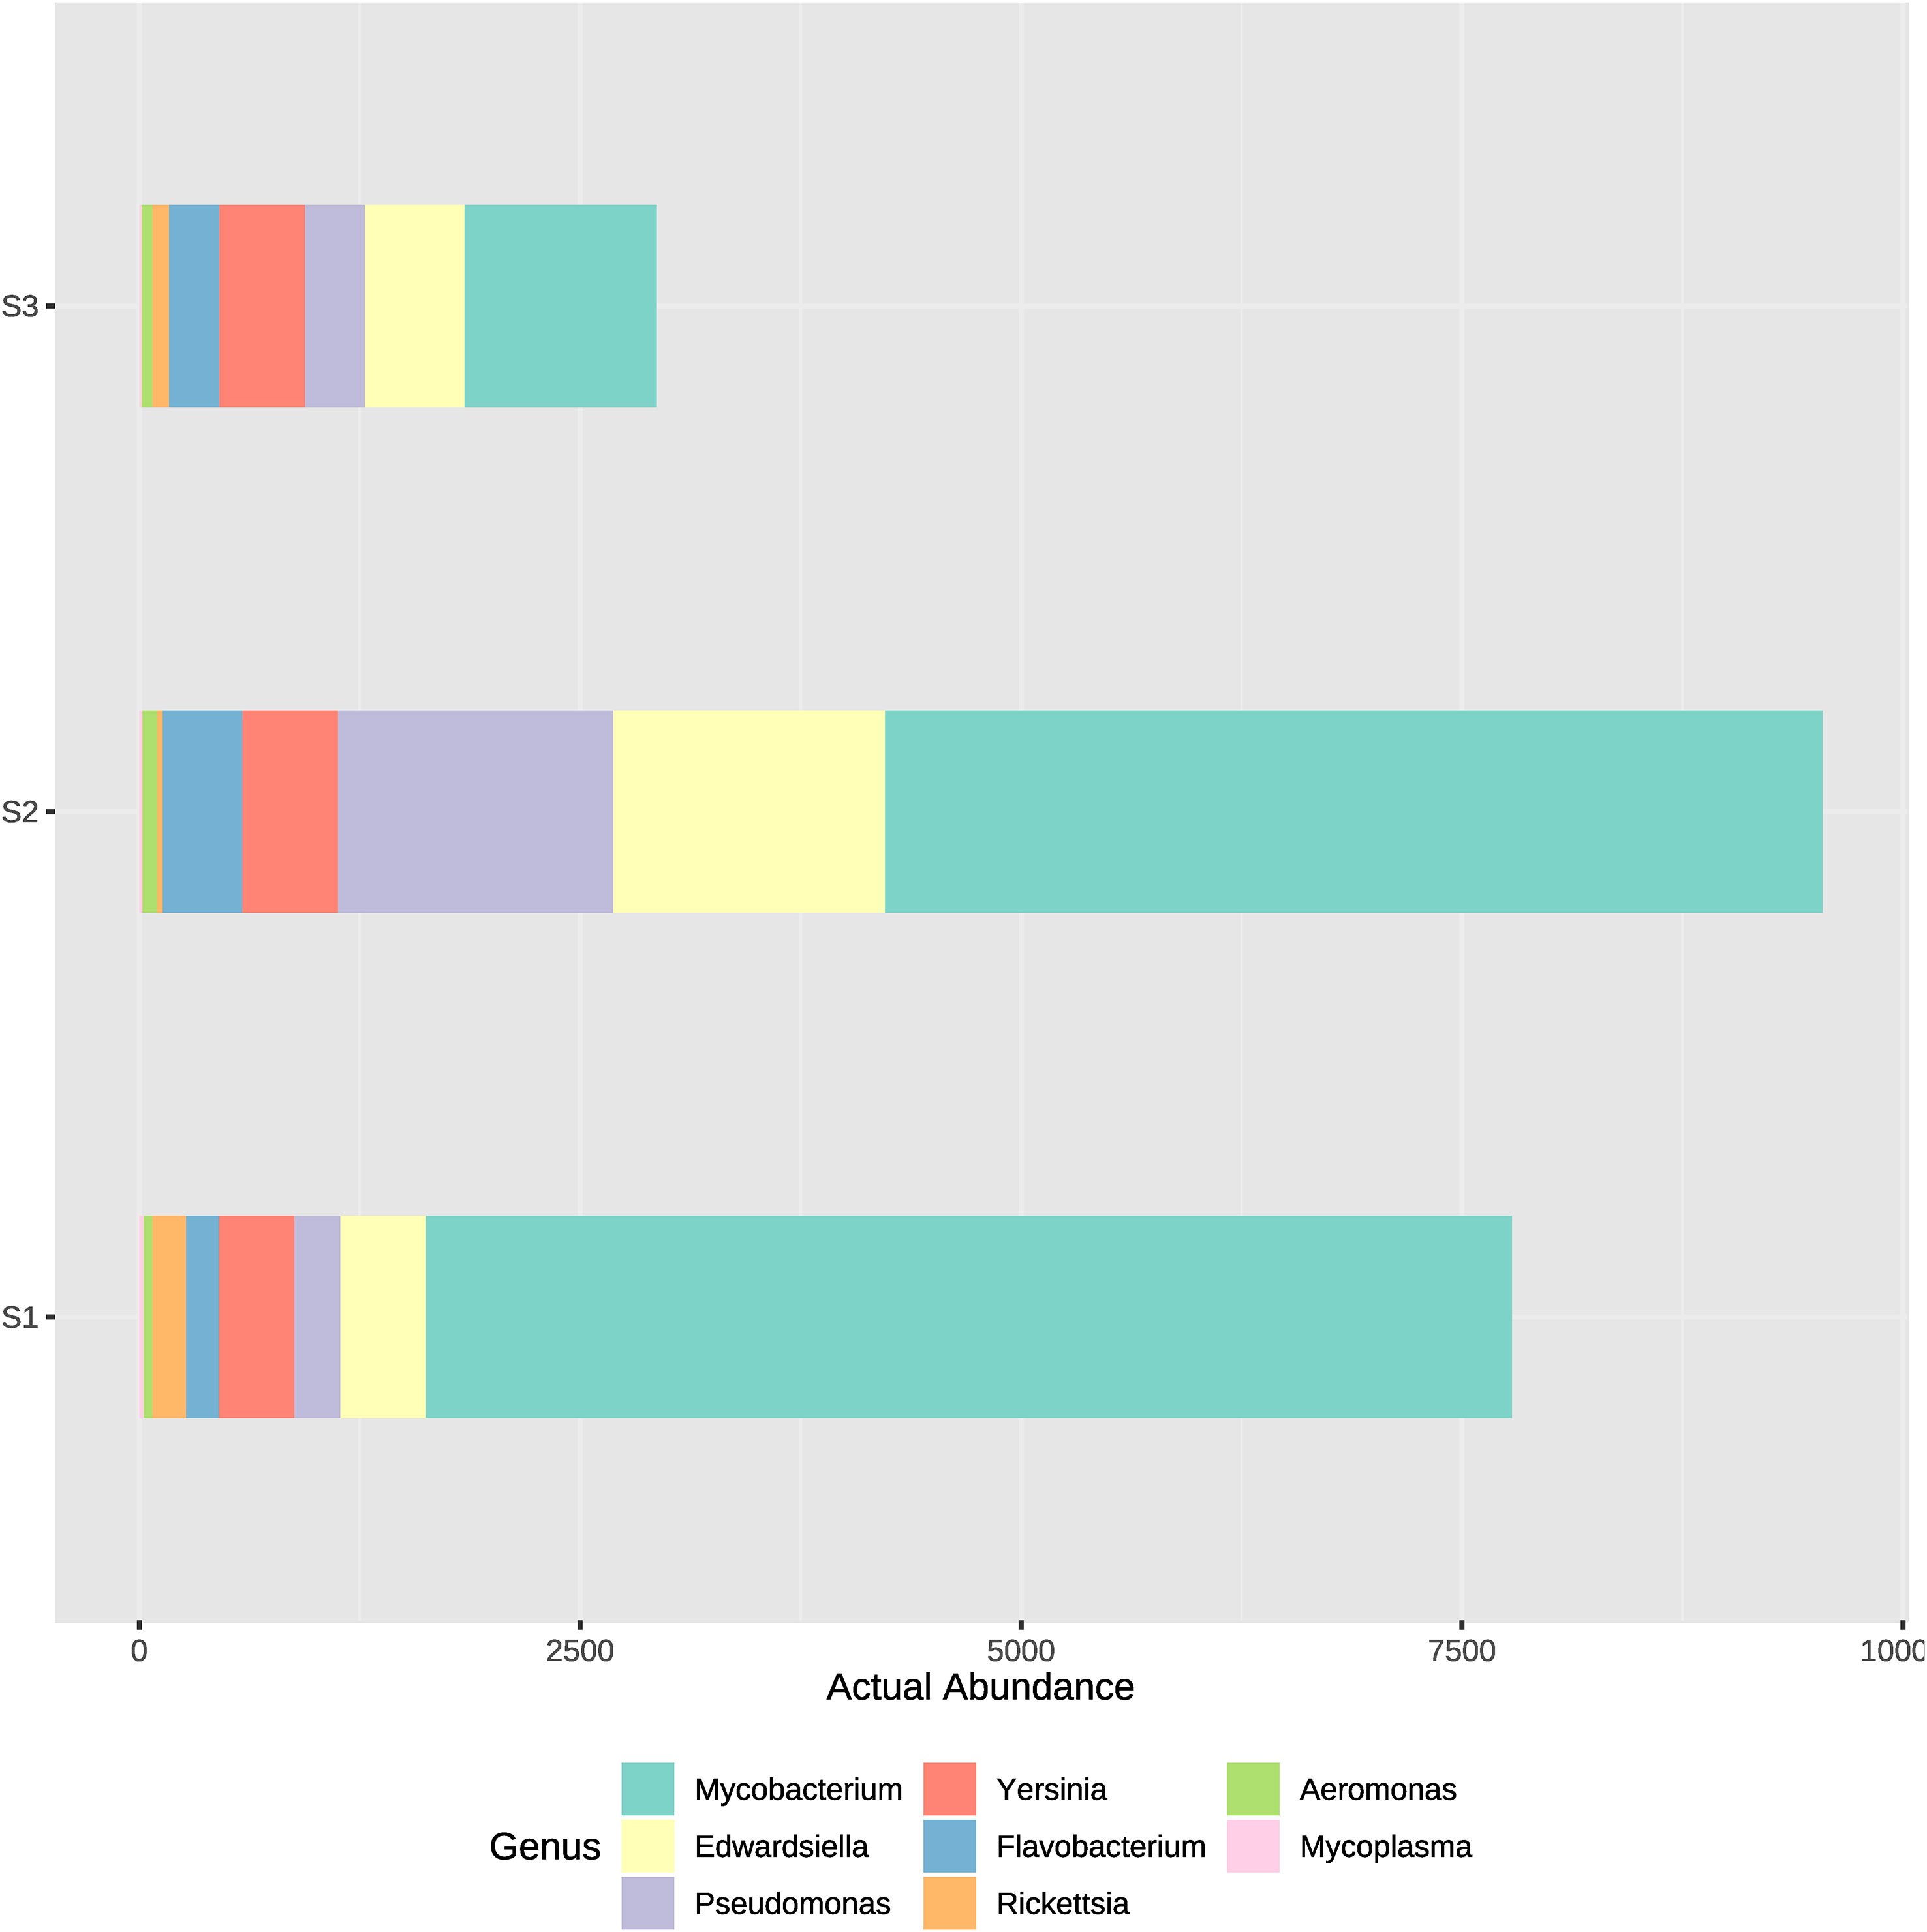
Figure 8 Actual abundances of ASVs corresponding to several potentially pathogenic bacterial genera. Each plot bar correspond to the ASVs obtained at high- (S1), medium- (S2) and low-density (S3) systems.
4 Discussion
Bacterial communities in Recirculating Aquaculture Systems (RAS) are of great complexity and should be valued for management strategies and hygienic practices. In this study the samplings covered typical and widely different possible scenarios which are commonly described at commercial productions, including seasons of extremely high fish stocking densities before or after batch harvesting, and seasons of low densities. Thus, we describe how the bacterial community is shifting to the conditions which result from different fish weight, and fish stocking densities within different compartments of the units. Here we detected 42 phyla in three sample categories, which are characterized by different stocking densities of C. gariepinus. Our RAS showed how the microbial community composition changed between systems and consisted of several taxonomic groups being rare and few being common. This fact was evidenced by obtaining significantly low Shannon diversity indices at the high- and low-density systems compared to the medium-density system.
Fish stocking density is a factor that strongly impacts the bacterial community, and its changes often depend on nutrient availability. It was evidenced how all RAS from our facility show daily changes at the proportions of nutrients, although ratios were stable over long time spans (Palm et al., 2018). Concentration of certain elements derived from N, P and other nutrients such as potassium, calcium or magnesium increased at high fish stocking densities, although these fluctuations do not exceed a defined range (Palm et al., 2018). For instance, it has been reported how high fish stocking densities led to an increase of biogeochemical cycling bacterial populations (Bhakta et al., 2010; Chen et al., 2018b), resulting in decreased biodiversity. In our medium-density system (S2) the amount of kg/m3 of fish was the highest from all systems at the time of sampling and in the weeks before (Figure 9 and Supplementary Table 1), implying low DO, low pH, accumulation of organic materials, and increase of chemical compounds such as N, P or K. Such situation was reported at the same system and same stocking densities by Palm et al. (2018). Fish metabolism produces ammonium, which is oxidized during the biofiltration process. This process releases hydrogen ions, that decrease pH, as well as CO2 which shifts the carbonate system towards a lower pH (Shanahan and Semmens, 2015). When high amounts of organic carbon are available, heterotrophic bacteria may overgrow and outcompete nitrifiers for available oxygen and space, which reduces the nitrification rate (Michaud et al., 2006). Some community descriptors which define this community shift could be the abundance of ASVs and diversity indices. In S2 we observed the highest actual abundance of ASVs and the highest Shannon diversity indices of all systems, which evidenced a single cluster with low disparate separation between points (Figure 5) and alpha- diversity significantly different to the values obtained at S1 and S3 (Supplementary Figure 1). Thus, its microbial community is the most evenly distributed compared to the other RAS, even if the kg of fish/m3 are the highest. Candidate phylum Omnitrophica, Aquificae and Chromatiaceae were the highly abundant groups identified at all compartments of S2 (Figure 5), and are considered as sulfur cycling groups (Gupta, 2014; Rosenberg, 2014; Hahn et al., 2022). Other abundant groups were Rhodospirillaceae, Armatimonadetes or Firmicutes, which are considered heteotrophic families but also include metabolically versatile species that have been isolated from a big variety of habitats, such as freshwater, activated sludge or soil (Lee et al., 2014; Pujalte et al., 2014; Mehrani et al., 2020). Nitrifiers were less abundant but also present in this system. Those belong to some families included in Proteobacteria phylum, such as Hydrogenophilaceae (Orlygsson and Kristjansson, 2014) or Alcaligenaceae (Rosenberg, 2014). Although the optimum pH for nitrification process is pH 7.6- 7.8, groups of nitrifiers were frequently detected at environments with pH around 4, showing a certain versatile metabolism (Schmidt et al., 2002). In our case, some of those microorganisms at S2 with pH=4,07 were able to complete this process under oxygen limited conditions, which is important to maintain proper levels of ammonia in the water.
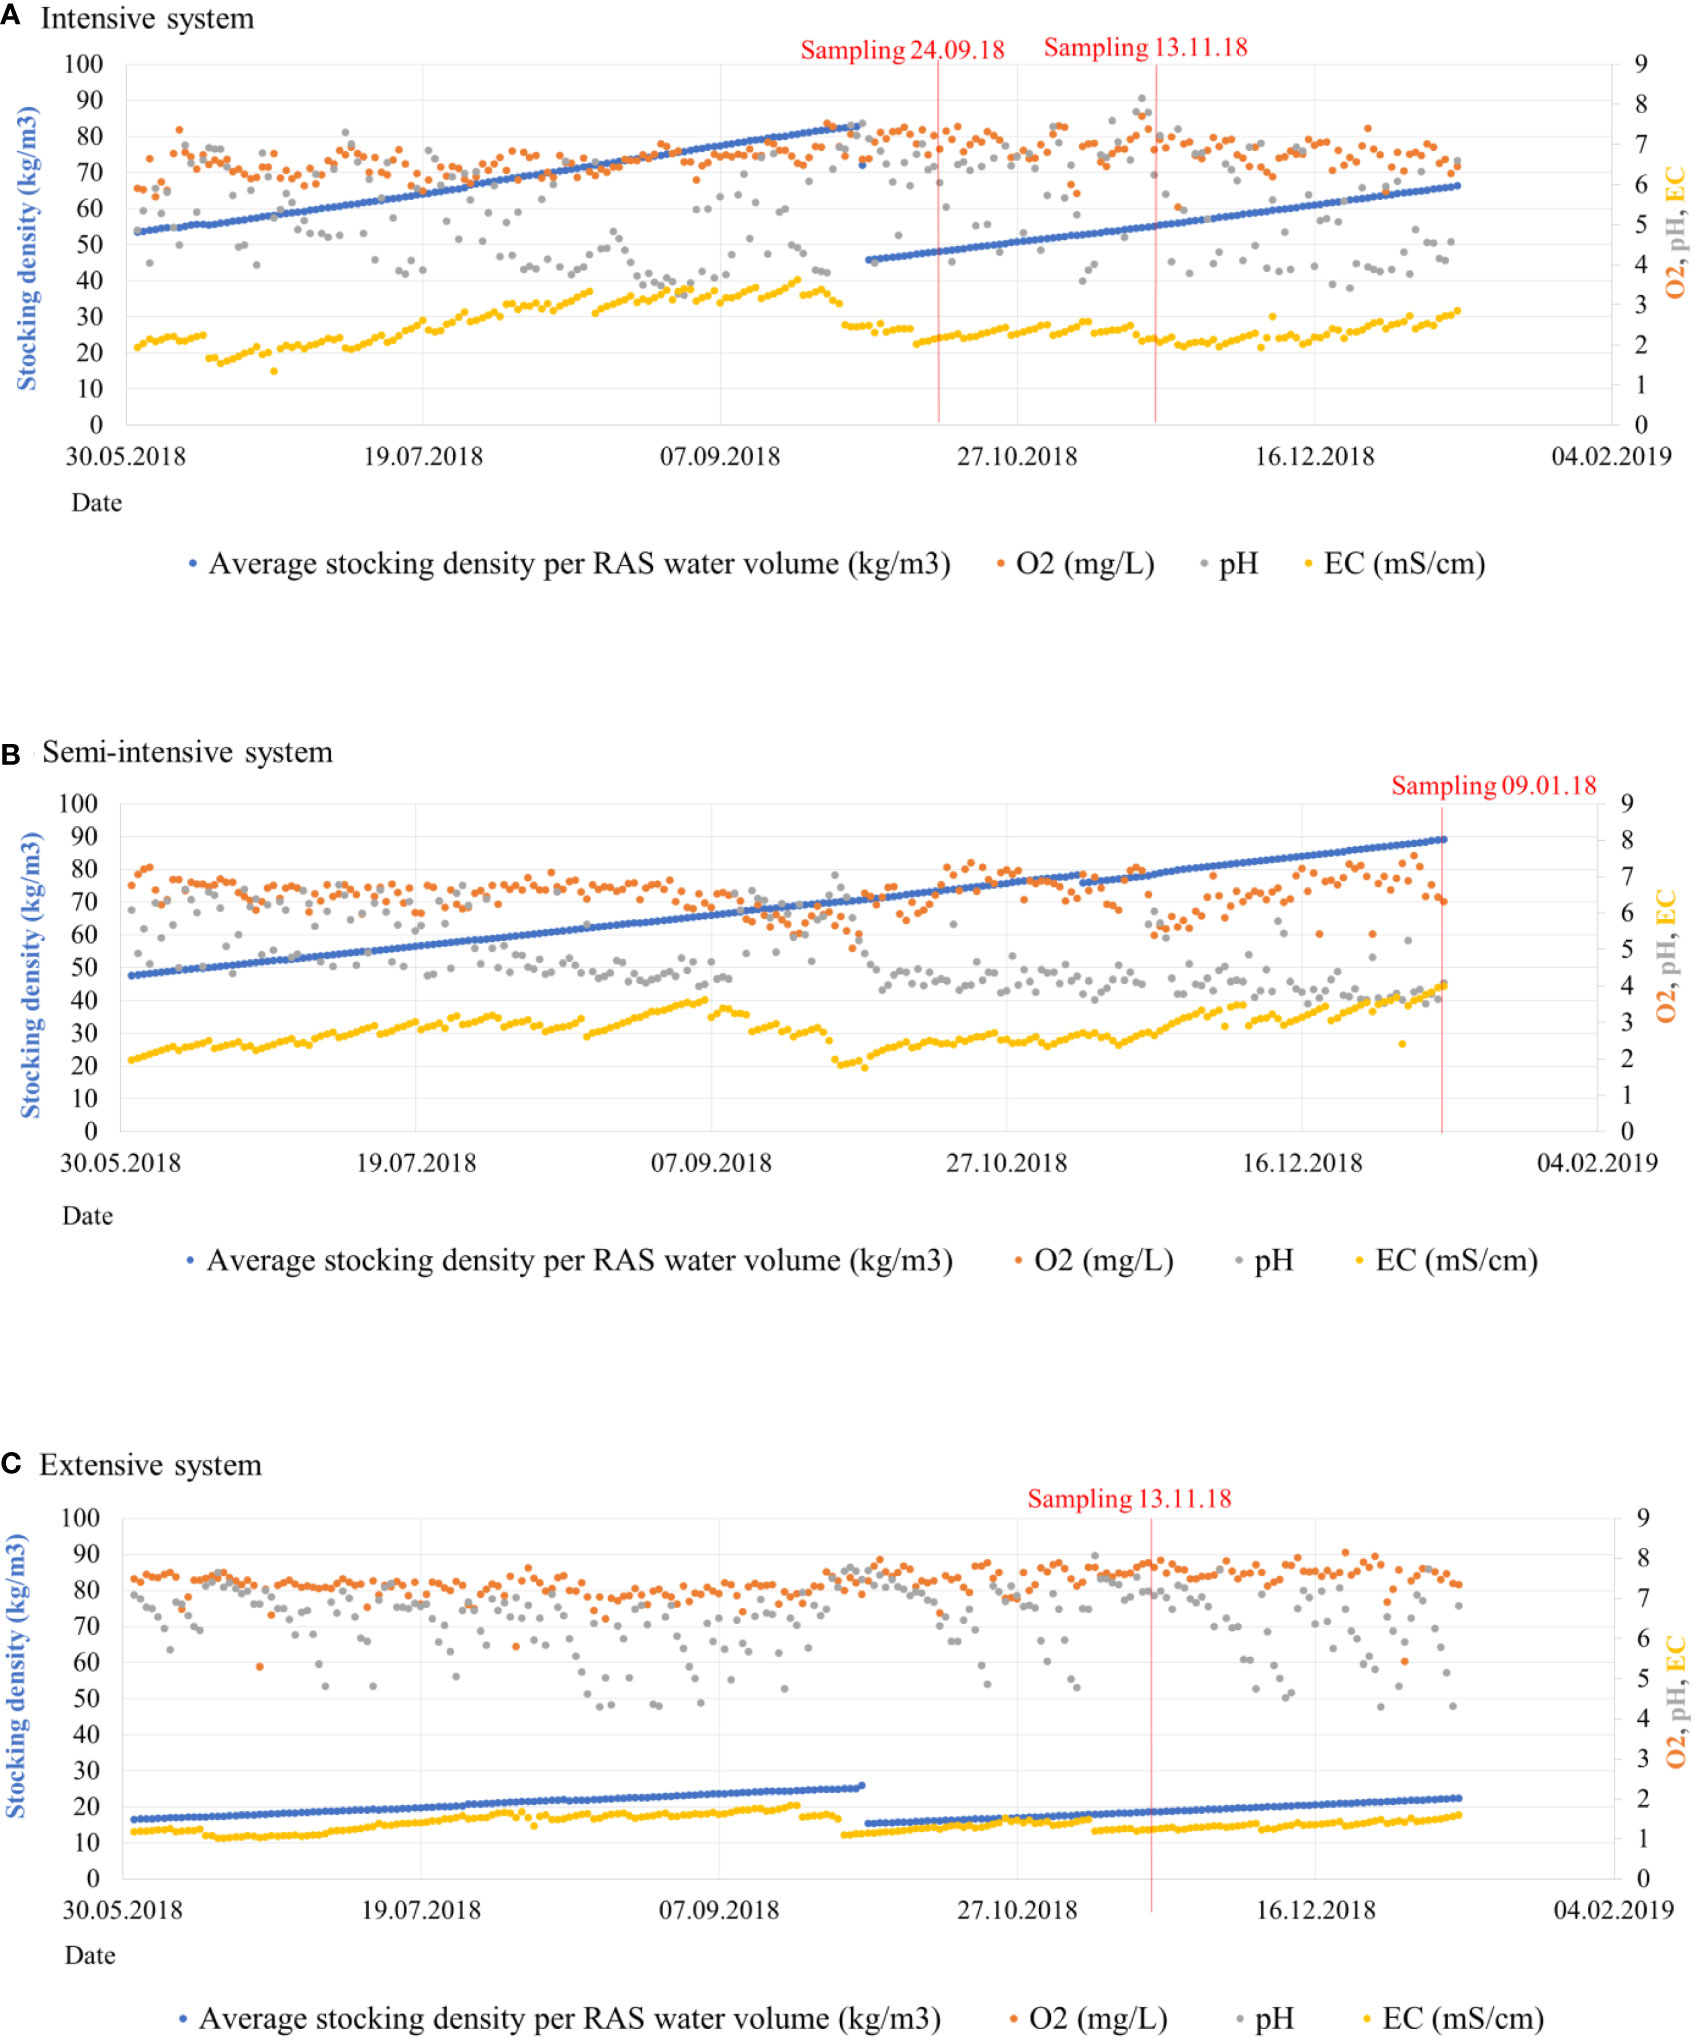
Figure 9 Fish stocking density (kg/m3) of the three sampled systems (A, medium-density system; B, high-density system; C, low-density system) before and after sampling represented in blue color. The red line indicates the date where each sample was obtained. Values of water dissolved oxygen (O2) are represented in orange color, pH in grey and conductivity (EC) in yellow.
The high-density and low-density systems showed different patterns, as taxonomic abundances of certain dominant phyla, such as Bacteroidetes, Firmicutes or Fusobacteria, tended to change between in- and outflow water (Figures 2, 3). Those differences are again evidenced as different clusters at the representation of beta-diversity (Figure 5). Same variations were again evidenced at most of the families represented on the heatmap (Figure 6) and the differential abundances graphs (Figures 4A, E). The fact that the sampling for S1 was scheduled at different times showed how this dynamical shift of the microbial population was observed over the fish production phase. Variability was only observed within the different RAS compartments thus their alpha-diversity values do not differ statistically (Supplementary Figure 1). Heterogeneity of communities is usually attributed to changes in environmental factors, such as temperature, conductivity (Krotman et al., 2020) or water treatment processes (Ma et al., 2017). Our study comparing systems with different fish biomass is a clear example of this community structural variability, where microbial community changes within a production unit could be attributed to fish biomass, fish metabolism, fish skin microbiome and/or amount of feed. Additionally, in the long list of factors that characterizes water quality (temperature, DO concentration, organic matter), some strongly shape aquatic microbial communities and also shift due to its microbiome (Bentzon-Tilia et al., 2016).
In both systems, bacteria encountered at the sedimenter compartment play other roles which may define its community separately from the other water communities. The dominant families encountered at the high- and low- densities have been attributed to several ecological functions. For example, groups strongly detected at sedimenter samples from S1, are highly abundant at water samples from S3, specifically at the outflow water. These dominant groups at S3 correspond to Elusimicrobia (Méheust et al., 2020), recognised as heterotroph or nitrite/nitrate reductor, the photoheterotroph group Chlorobi (Bryant and Liu, 2013), the phosphorous removal group Actinobacteria (Seviour et al., 2008), the methanogen Euyarchaeota (Zou et al., 2020), or the nitrite- oxydizing groups Nitrospiraceae (Liu et al., 2015) and Woesearchaeota (Liu et al., 2021). Proteobacteria families were most frequently found in the sedimenter water of S3 and are essentially involved in sulfate reduction, sulfur oxidation and nitrogen fixation (Kersters et al., 2006). Exceptionally, Fusobacteria is the third most abundant phyla at the S3 sedimenter and appears to mainly colonize microaerobic habitats such as fish microbiomes and feces (Schmautz et al., 2017). This big diversity of ecological functions contributes to the reduction of reactive nitrogen species and other residual compounds produced by fish metabolism, which ensures a balanced microbial ecosystem and more proper water conditions for fish performance at all systems. High abundances of these previous phyla were also obtained in other studies and showed moderate variations depending on fish density, although each RAS model studied differed from one another (Cheng et al., 2014; Chen et al., 2018b; Patin et al., 2018).
At S1, phyla such as Chloroflexi, Ignavibacteriae, Actinobacteria or Parcubacteria appeared highly abundant in the sedimenter but not in inflow and outflow samples, contrary to the S3. Most of the dominant families detected at inflow and outflow water samples at S1 were heterotrophic (Saccharibacteria, Pacearchaeota, Gemmatimonadetes and Spirochaetes) or participate at the nitrogen cycle (Crenarchaeota, Omnitrophica and some Proteobacteria families). It is relatively important in a RAS aquaculture system to have data of the microbiome when working at high fish densities and biomass, since some highly abundant heterotrophs detected, such as Edwardiella or Yersinia, are considered pathogenic agents for fish (Stride et al., 2014; Pawlikowska-Warych and Deptuła, 2016). Our results showed how the actual abundance of certain genera of bacteria which could be potential pathogens for fish was higher in the S2, where fish biomass was also the highest, so fish may be exposed to a higher bacterial load. Fish biomass was higher at S2 compared to the other systems, which means water conditions were comparable to the ones reported at the high-density system on the previous months before the sampling, which was reported at Palm et al. (2018). Resulting from these system conditions, the most abundant potential pathogenic genus appeared to be Mycobacterium sp., followed by Pseudomonas sp. and Edwardsiella sp. (Figures 7, 8). Mycobaceriosis has been documented in a wide range of wild and captive species, including salmonids, cyprinids and others (Bruno et al., 1998; Heckert et al., 2001; Gauthier and Rhodes, 2009; Pourahmad and Nemati, 2013). Members of the Pseudomonas genus are known to cause epithelial lesions on fish skin (Pękala-Safińska, 2018), although simultaneously some species are denitrifiers and could be stablished in RAS biofilters, forming the biofilm (Rurangwa and Verdegem, 2014; Ni et al., 2018). High mortality rates in fish production sites caused by Edwarsiella sp. affecting members from Clariidae and other families have been reported (Reichley et al., 2017; Phuoc et al., 2020). African catfish tolerates a wide range of rearing conditions, although the sum of several stressors could result in a disease outbreak, as it was reported by Walakira et al. (2014). The abundance of potentially pathogens encountered in our study, especially at the intensive and semi-intensive systems with stocking densities of up to approximately 89 kg fish/m3 production volume, may not directly affect fish health and/or growth performance when water quality and other physicochemical parameters are still adequate (Mannan et al., 2012). Additionally, some of the taxonomical groups found, such as Mycobacterium, include species which are not considered opportunistic or pathogens. Consequently, other methodologies able to determinate up to species taxonomical level, such as classical microbiology methods for single growth and identification of the bacterial strain, should be implemented in further studies.
Overall, the observed dissimilarities between the three aquaculture systems were the result of manifold factors, such as the system itself, the species reared or the microorganisms of the water supply, which shape and characterize the microbiome. However, in our case the communities from the biofilter had the same origin. Thus, we observe how the communities share most of the phyla and its composition is highly similar, although fish densities change between S1 and S3. This trait could be observed at the graph for differential abundances (Figure 4C). Other studies report how a mature biofilter may contribute to establish a stable and more resilient water microbiome (Dahle et al., 2022), which would explain the relationship between S1 and S3. Previous microbiome studies only focused on higher taxonomic orders and omit classifying families or genera, suggesting there is some misleading and/or loss of information. In addition, here we obtain a general view of how bacterial community behaves at conditions that commercial production systems would experience. Consequently, the interpretations of bacterial community shifts could have a practical utility for the enhancement of aquaculture practices. In summary, the ability of microbial communities to change within a few days and to adapt their functionality to new physiochemical environmental conditions (Li et al., 2021) makes the definition of the RAS microbiome very difficult. Also in our study, the microbiome seemed to rapidly react to harvesting, water exchange rates and number of fish and feed in the systems, demonstrating the opportunistic nature of the observed taxa and community. The water microbiome is part of the environment and is also strongly influenced by the biofilm of biofilters, fish skin mucus, gut microbiomes and other microbial inputs from the air (Minich et al., 2020). These factors contribute to the formation of a microbial community that has been significantly associated with numerous diseases. Indeed, it is evident that there is an interaction between the surrounding environment and the fish mucus host microorganisms, which plays a key role in the immune system of the fish and forms a barrier against pathogenic agents (Cabillon and Lazado, 2019). Therefore, to localize which compartment of the aquaculture system was especially colonized by potentially pathogenic bacteria and its differences between fish stocking densities and/or kg of fish per tank may be of great utility so as to implement preventive actions against specific pathogens.
Data availability statement
The datasets presented in this study can be found in online repositories. The names of the repository/repositories and accession number(s) can be found below: https://www.ncbi.nlm.nih.gov/, PRJNA875290.
Author contributions
HP and PU proposed the initial project plan and provided overall guidance and support. BK assessed and supervised the molecular analysis of trial samples. JN performed all the statistical analysis, and plot construction. JN also provided interpretation of the statistical results. JC-F contributed to the interpretation of the data, gave a new approach to be used regarding pathogens and wrote the manuscript. All authors provided comment on the manuscript prior to submission. All authors contributed to the article and approved the submitted version.
Funding
Funding for this project was provided by the European Fisheries Fund (EMFF) and the Ministry of Agriculture and Environment from Mecklenburg-Western Pomerania as part of the project Hygiene management and health concept for surface water-dependent partial circulation systems in M-V (project ID MV-II. 12-LM-03. 7302170000013). Purchase of the Illumina MiSeq in the laboratory of BK was kindly supported by the EU-EFRE (European Funds for Regional Development) program and funds from the University Medicine Rostock.
Acknowledgments
We are grateful to the operators and technical workers that maintain the Recirculation Aquaculture System at the facilities from University Rostock. We thank Jana Bull (IMIKRO University Medicine Rostock) for excellent technical assistance during library preparation and sequencing. We give thanks to Lisa Wenzel for her guidance through understanding the water parameters obtained from the aquaculture units. We appreciate the reviewers for presenting their constructive comments and offer interesting points of view which will be taken into consideration for further studies.
Conflict of interest
The authors declare that the research was conducted in the absence of any commercial or financial relationships that could be construed as a potential conflict of interest
Publisher’s note
All claims expressed in this article are solely those of the authors and do not necessarily represent those of their affiliated organizations, or those of the publisher, the editors and the reviewers. Any product that may be evaluated in this article, or claim that may be made by its manufacturer, is not guaranteed or endorsed by the publisher.
Supplementary material
The Supplementary Material for this article can be found online at: https://www.frontiersin.org/articles/10.3389/fmars.2023.1073250/full#supplementary-material
References
Abdel-Wahed R. K., Shaker I. M., Elnady M. A., Soliman M. A. M. (2018). Impact of fish- farming management on water quality, plankton abundance and growth performance of fish in earthen ponds. Egyptian J. Aquat. Biol. Fisheries 22, 49–63. doi: 10.21608/ejabf.2018.7705
Anantharaman K., Hausmann B., Jungbluth S. P., Kantor R. S., Lavy A., Warren L. A., et al. (2018). Expanded diversity of microbial groups that shape the dissimilatory sulfur cycle. ISME J. 12 (7), 1715–1728. doi: 10.1038/s41396-018-0078-0
Baßmann B., Brenner M., Palm H. W. (2017). Stress and welfare of African catfish (Clarias gariepinus burchell 1822) in a coupled aquaponic system. Water 9 (7), 504. doi: 10.3390/w9070504
Baßmann B., Harbach H., Weißbach S., Palm H. W. (2020). Effect of plant density in 613 coupled aquaponics on the welfare status of African catfish, Clarias gariepinus. J. 614 World Aquacult. Soc. 51 (1), 183–199.
Badiola M., Mendiola D., Bostock J. (2012). Recirculating aquaculture systems (RAS) analysis: Main issues on management and future challenges. Aquacultural Eng. 51, 26–35. doi: 10.1016/j.aquaeng.2012.07.004
Bentzon-Tilia M., Sonnenschein E. C., Gram L. (2016). Monitoring and managing microbes in aquaculture - towards a sustainable industry. Microbial Biotechnol. 9 (5), 576–584. doi: 10.1111/1751-7915.12392
Bhakta J. N., Biswas J. K., Bhakta P., Munekage Y., Jana B. B. (2010). Fish stocking density induced growth responses of some biogeochemical cycling bacterial population. Braz. J. Aquat. Sci. Technol. 13(2):45–50. doi: 10.14210/bjast.v13n2.p45-50
Bruno D. W., Griffiths J., Mitchell C. G., Wood B. P., Fletcher Z. J., Drobniewski F. A., et al. (1998). Pathology attributed to Mycobacterium chelonae infection among farmed and laboratory-infected Atlantic salmon Salmo salar. Dis. Aquat. organisms 33 (2), 101–109. doi: 10.3354/dao033101
Bryant D. A., Liu Z. (2013). “Green bacteria: Insights into green bacterial evolution through genomic analyses - chapter four,” in Advances in botanical research, 66, 99–150. United Kingdom: Elsevier. doi: 10.1016/B978-0-12-397923-0.00004-7
Cabillon N., Lazado C. (2019). Mucosal barrier functions of fish under changing environmental conditions. Fishes 4 (1), 2. doi: 10.3390/fishes4010002
Califano G., Castanho S., Soares F., Ribeiro L., Cox C. J., Mata L., et al. (2017). Molecular taxonomic profiling of bacterial communities in a gilthead seabream (Sparus aurata) hatchery. Front. Microbiol. 8. doi: 10.3389/fmicb.2017.00204
Callahan B. J., McMurdie P. J., Rosen M. J., Han A. W., Hohnson A. J., Holmes S. (2016). DADA2: High-resolution sample inference from illumina amplicon data. Nat. Methods 13, 581–583. doi: 10.1038/nmeth.3869
Cheng W., Zhang J., Wang Z., Wang M., Xie S. (2014). Bacterial communities in sediments of a drinking water reservoir. Ann. Microbiol. 64, 875–878. doi: 10.1007/s13213-013-0712-z
Chen X., Shao T., Long X. (2018b). Evaluation of the effects of different stocking densities on the sediment microbial community of juvenile hybrid grouper (♀Epinephelus fuscoguttatus × ♂ Epinephelus lanceolatus) in recirculating aquaculture systems. PLoS One 13 (12), e0208544. doi: 10.1371/journal.pone.0208544
Chen S., Zhou Y., Chen Y., Gu J. (2018a). Fastp: an ultra-fast all–in–one FASTQ preprocessor. Bioinformatics 34, i884–i890. doi: 10.1093/bioinformatics/bty560
Dahle S. W., Attramadal K., Vadstein O., Hestdahl H. I., Bakke I. (2022). Microbial community dynamics in a commercial RAS for production of Atlantic salmon fry (Salmo salar). Aquaculture 546, 737382. doi: 10.1016/j.aquaculture.2021.737382
Destatis Statistisches Bundesamt (2020). “Fisheries,” in Aquaculture production businesses and volume produced in 2021. Available at: https://www.destatis.de. Cited September 20, 2022.
Food and Agriculture Organization of the United Nations (1992). Wastewater treatment and use in aquaculture (FAO irrigation and drainage paper 47). Available at: https://www.fao.org/3/t0551e/t0551e00.htm. Text by Pescod M. B, Rome, Italy Cited May 31, 2022.
Food and Agriculture Organization of the United Nations (2020). The state of world fisheries and aquaculture 2020 (Fisheries and aquaculture department). Available at: https://www.fao.org/3/ca9229en/online/ca9229en.html. Rome, Italy Cited May 31, 2022.
Food and Agriculture Organization of the United Nations (2021). North African catfish – clarias gariepinus (Fisheries and aquaculture department). Available at: http://www.fao.org/fishery/affris/species-profiles/north-african-catfish/north-african-catfish-home/en/. Rome, Italy Cited May 31, 2022.
Food and Agriculture Organization of the United Nations (2022). Clarias gariepinus. cultured aquatic species information programme (Fisheries and Aquaculture Division). Available at: https://www.fao.org/fishery/en/culturedspecies/Clarias_gariepinus/en. Text by Pouomogne, VCited May 31, 2022.
Gauthier D. T., Rhodes M. W. (2009). Mycobacteriosis in fishes: A review. Veterinary J. 180 (1), 33–47. doi: 10.1016/j.tvjl.2008.05.012
Gupta R. S. (2014). “The phylum aquificae,” in The prokaryotes. Eds. Rosenberg E., DeLong E. F., Lory S., Stackebrandt E., Thompson F. (Berlin, Heidelberg: Springer). doi: 10.1007/978-3-642-38954-2_119
Hahn C. R., Farag I. F., Murphy C. L., Podar M., Elshahed M. S., Youssef N. H. (2022). Microbial diversity and sulfur cycling in an early earth analogue: From ancient novelty to modern commonality. mBio 13 (2), e0001622. doi: 10.1128/mbio.00016-22
Heckert R. A., Elankumaran S., Milani A., Baya A. (2001). Detection of a new mycobacterium species in wild striped bass in the Chesapeake bay. J. Clin. Microbiol. 39 (2), 710–715. doi: 10.1128/JCM.39.2.710-715.2001
Hennersdorf P., Kleinertz S., Theisen S., Abdul-Aziz M. A., Mrotzek G., Palm H. W., et al. (2016). Microbial diversity and parasitic load in tropical fish of different environmental conditions. PloS One 11 (3), e0151594. doi: 10.1371/journal.pone.0151594
Jegatheesan V., Shu L., Visvanathan C. (2011). Aquaculture effluent: Impacts and remedies for protecting the environment and human health. Encyclopedia Environ. Health, 123–135. doi: 10.1016/B978-0-444-52272-6.00340-8
Keramat A. (2008). Environmental impact of nutrient discharged by aquaculture waste water on the haraz river. J. Fisheries Aquat. Sci. 3 (5), 275–279. doi: 10.3923/jfas.2008.275.279
Kersters K., De Vos P., Gillis M., Swings J., Vandamme P., Stackebrandt E. (2006). “Introduction to the proteobacteria,” in The prokaryotes: A handbook on the biology of bacteria, 3rd ed, vol. 5 . Eds. Dworkin M., Falkow S., Rosenberg E., Schleifer K. H., Stackebrandt E. (New York, NY, USA: Springer), 3–37. Proteobacteria: Alpha and beta subclasses. doi: 10.1007/0-387-30745-1_1
Krotman Y., Yergaliyev T. M., Alexander Shani R., Avrahami Y., Szitenberg A. (2020). Dissecting the factors shaping fish skin microbiomes in a heterogeneous inland water system. Microbiome 8 (1), 9. doi: 10.1186/s40168-020-0784-5
Lee K., Dunfield P., Stott M. (2014). “Chapter 32,” in The phylum armatimonadetes, 4th Edition (Berlin Heidelberg: Springer-Verlag Berlin Heidelberg). doi: 10.1007/978-3-642-38954-2_388
Lee D. E., Lee J., Kim Y. M., Myeong J. I., Kim K. H. (2016). Uncultured bacterial diversity in a seawater recirculating aquaculture system revealed by 16S rRNA gene amplicon sequencing. J. Microbiol. (Seoul Korea) 54 (4), 296–304. doi: 10.1007/s12275-016-5571-4
Li Z., Che J., Xie J., Wang G., Yu E., Xia Y., et al. (2017). Microbial succession in biofilms growing on artificial substratum in subtropical freshwater aquaculture ponds. FEMS Microbiol. Lett. 364 (4). doi: 10.1093/femsle/fnx017
Li E., Deng T., Yan L., Zhou J., He Z., Deng Y., et al. (2021). Elevated nitrate simplifies microbial community compositions and interactions in sulfide-rich river sediments. Sci. total Environ. 750, 141513. doi: 10.1016/j.scitotenv.2020.141513
Lin S., Zhou X., Zhou T., Jing Z., Song Y. (2016). Performance assessment of large-scale recirculating aquaculture system on nitrogen and phosphorous pollution control. Chin. J. Environ. Eng. 10 (10), 5535–5541. doi: 10.12030/j.cjee.201505041
Liu G., Tang C. M., Exley R. M. (2015). Non-pathogenic neisseria: members of an abundant, multi-habitat, diverse genus. Microbiol. (Reading England) 161 (7), 1297–1312. doi: 10.1099/mic.0.000086
Liu X., Wang Y., Gu J. D. (2021). Ecological distribution and potential roles of woesearchaeota in anaerobic biogeochemical cycling unveiled by genomic analysis. Comput. Struct. Biotechnol. J. 19, 794–800. doi: 10.1016/j.csbj.2021.01.013
Liu H., Ye T., Soon T. K., Zhang H., Cheng D., Li S., et al. (2019). Effects of stocking density on the growth performance, bacterial load and antioxidant response systems of noble scallop Chlamys nobilis. Fish Shellfish Immunol. doi: 10.1016/j.fsi.2019.05.053
Li Z., Yu E., Zhang K., Gong W., Xia Y., Tian J., et al. (2020). Water treatment effect, microbial community structure, and metabolic characteristics in a field-scale aquaculture wastewater treatment system. Front. Microbiol. 11. doi: 10.3389/fmicb.2020.00930
Love M. I., Huber W., Anders S. (2014). Moderated estimation of fold change and dispersion for RNA-seq data with DESeq2. Genome Biol. 15 (12), 550. doi: 10.1186/s13059-014-0550-8
Lucas J. S., Southgate P. C. (2012). “Aquaculture: Farming aquatic animals and plants,” in Water quality, 2nd edition (West Sussex, UK: Wiley-Blackwell), 18–51. doi: 10.1002/9781118687932
Mannan M., Islam S., Rimi R. H., Suravi, Meghla N. T. (2012). Impact of water quality on fish growth and production in semi-intensively managed aquaculture farm. Bangladesh J. Environ. Sci. 23, 108–113.
Ma X., Vikram A., Casson L., Bibby K. (2017). Centralized drinking water treatment operations shape bacterial and fungal community structure. Environ. Sci. Technol. 51 (13), 7648–7657. doi: 10.1021/acs.est.7b00768
Méheust R., Castelle C. J., Matheus Carnevali P. B., Farag I. F., He C., Chen L. X., et al. (2020). Groundwater elusimicrobia are metabolically diverse compared to gut microbiome elusimicrobia and some have a novel nitrogenase paralog. ISME J. 14 (12), 2907–2922. doi: 10.1038/s41396-020-0716-1
Mehrani M. J., Sobotka D., Kowal P., Ciesielski S., Makinia J. (2020). The occurrence and role of nitrospira in nitrogen removal systems. Bioresource Technol. 303, 122936. doi: 10.1016/j.biortech.2020.122936
Michaud L., Blancheton J. P., Bruni V., Piedrahita R. (2006). Effect of particulate organic carbon on heterotrophic bacterial populations and nitrification efficiency in biological filters. Aquacultural Eng. 34 (3), 224–233. doi: 10.1016/j.aquaeng.2005.07.005
Minich J. J., Poore G. D., Jantawongsri K., Johnston C., Bowie K., Bowman J., et al. (2020). Microbial ecology of Atlantic salmon (Salmo salar) hatcheries: Impacts of the built environment on fish mucosal microbiota. Appl. Environ. Microbiol. 86 (12), e00411–e00420. doi: 10.1128/AEM.00411-20
Ni J., Li X. J., Chen F., Wu H. H., Xu M. Y. (2018). Community structure and potential nitrogen metabolisms of subtropical aquaculture pond microbiota. Appl. Ecol. Environ. doi: 10.15666/aeer/1606_76877697
Orlygsson J., Kristjansson J. K. (2014). “The family hydrogenophilaceae,” in The prokaryotes. Eds. Rosenberg E., DeLong E. F., Lory S., Stackebrandt E., Thompson F. (Berlin Heidelberg: Springer-Verlag Berlin Heidelberg). doi: 10.1007/978-3-642-30197-1_244
Pękala-Safińska A. (2018). Contemporary threats of bacterial infections in freshwater fish. J. veterinary Res. 62 (3), 261–267. doi: 10.2478/jvetres-2018-0037
Palm H. W., Knaus U., Waseritz B., Bischoff A. A., Strauch S. M. (2018). Proportional up scaling of African catfish (Claria gariepinus burchell 1822) commercial recirculating aquaculture systems disproportionally affects nutrient dynamics. Aquaculture 491, 155–168. doi: 10.1016/j.aquaculture.2018.09.02
Patin N. V., Pratte Z. A., Regensburger M., Hall E., Gilde K., Dove A., et al. (2018). Microbiome dynamics in a Large artificial seawater aquarium. Appl. Environ. Microbiol. 84 (10), e00179–e00118. doi: 10.1128/AEM.00179-18
Pawlikowska-Warych M., Deptuła W. (2016). Characteristics of chlamydia-like organisms pathogenic to fish. J. Appl. Genet. 57 (1), 135–141. doi: 10.1007/s13353-015-0303-8
Phuoc N. N., Richards R., Crumlish M. (2020). Environmental conditions influence susceptibility of striped catfish Pangasianodon hypophthalmus (Sauvage) to Edwardsiella ictaluri. Aquaculture 523, 735226. doi: 10.1016/j.aquaculture.2020.735
Pourahmad F., Nemati M. (2013). Experimental mycobacteriosis in Atlantic salmon, Salmo salar and rainbow trout, Oncorhynchus mykiss. Eur. J. Exp. Biol. 3 (5), 128–132.
Prüter J., Strauch S. M., Wenzel L. C., Klysubun W., Palm H. W., Leinweber P. (2020). Organic matter composition and phosphorus speciation of solid waste from an African catfish recirculating aquaculture system. Agriculture 10 (10), 466. doi: 10.3390/agriculture10100466
Pujalte M. J., Lucena T., Ruvira M. A., Arahal D. R., Macián M. C. (2014). “The family rhodobacteraceae,” in The prokaryotes. Eds. Rosenberg E., DeLong E. F., Lory S., Stackebrandt E., Thompson F. (Berlin, Heidelberg: Springer). doi: 10.1007/978-3-642-30197-1_377
Reichley S. R., Ware C., Steadman J., Gaunt P. S., García J. C., LaFrentz B. R., et al. (2017). Comparative phenotypic and genotypic analysis of edwardsiella isolates from different hosts and geographic origins, with emphasis on isolates formerly classified as e. tarda, and evaluation of diagnostic methods. J. Clin. Microbiol. 55 (12), 3466–3491. doi: 10.1128/JCM.00970-17
Rosenberg E. (2014). “The family parachlamydiaceae,” in The prokaryotes. Eds. Rosenberg E., DeLong E. F., Lory S., Stackebrandt E., Thompson F. (Berlin, Heidelberg: Springer). doi: 10.1007/978-3-642-38954-2_152
Rurangwa E., Verdegem M. C. J. (2014). Microorganisms in recirculating aquaculture systems and their management. Rev. Aquacult. 7 (2), 117–130. doi: 10.1111/raq.12057
Schmautz Z., Graber A., Jaenicke S., Goesmann A., Junge R., Smits T. H. (2017). Microbial diversity in different compartments of an aquaponics system. Arch. Microbiol. 199 (4), 613–620. doi: 10.1007/s00203-016-1334-1
Schmidt I., Sliekers O., Schmid M., Cirpus I., Strous M., Bock E., et al. (2002). Aerobic and anaerobic ammonia oxidizing bacteria–competitors or natural partners? FEMS Microbiol. Ecol. 39 (3), 175–181. doi: 10.1111/j.1574-6941.2002.tb00920.x
Seviour R. J., Kragelund C., Kong Y., Eales K., Nielsen J. L., Nielsen P. H. (2008). Ecophysiology of the actinobacteria in activated sludge systems. Antonie van Leeuwenhoek 94 (1), 21–33. doi: 10.1007/s10482-008-9226-2
Shanahan J. W., Semmens M. J. (2015). Alkalinity and pH effects on nitrification in a membrane aerated bioreactor: An experimental and model analysis. Water Res. 74, 10–22. doi: 10.1016/j.watres.2014.12.055
Shi Y.-H., Chen J., Li C.-H., Lu X.-J., Zhang D.-M., Li H.-Y., et al. (2012). Detection of bacterial pathogens in aquaculture samples by DNA microarray analysis. Aquaculture 338-341, 29–35. doi: 10.1016/j.aquaculture.2012.01
Stride M. C., Polkinghome A., Nowak B. F. (2014). Chlamydial infections of fish: diverse pathogens and emerging causes of disease in aquaculture species. Veterinary Microbiol. 171 (1-2), 258–266. doi: 10.3923/jfish.2010.31.35
Subhash S. K., Lipton A. (2010). Effect of Stocking Density and Bacterial Load on the Commercial Production of Pearl Oyster Pinctada fucata (Gould) Larvae . Journal of Fisheries International 5, 31–35. doi: 10.3923/jfish.2010.31.35
Subhash S. K., Lipton A., Raj R. (2007). Stocking density dependent bacterial load and its influence on the production of pearl oyster Pinctada fucata (Gould) seed. Indian J. Anim. Sci. 77 (5), 420–423.
Van de Nieuwegiessen P. G., Ramli N. M., Knegtel B. P., Verreth J. A., Schrama J. W. (2010). Coping strategies in farmed African catfish Clarias gariepinus. does it affect their welfare? J. fish Biol. 76 (10), 2486–2501. doi: 10.1111/j.1095-8649.2010.02635.x
Vera L. M., Al-Khamees S., Herv M. (2011). Stocking density affects circadian rhythms of locomotor activity in African catfish, Clarias gariepinus. Chronobiol. Int. 28 (9), 751–757. doi: 10.3109/07420528.2011.606388
Walakira J. K., Akoll P., Engole M., Sserwadda M., Nkambo M., Namulawa V., et al. (2014). Common fish diseases and parasites affecting wild and farmed tilapia and catfish in central and western Uganda. Uganda J. Agric. Sci. 15 (2), 113–125.
Wise A. L., LaFrentz B. R., Kelly A. M., Khoo L. H., Xu T., Liles M. R., et al. (2021). A review of bacterial Co-infections in farmed catfish: Components, diagnostics, and treatment directions. Animals 11 (11), 3240. doi: 10.3390/ani11113240
Keywords: RAS, aquaculture, stocking density, pathogens, fish farming, water microbiome, opportunistic pathogens
Citation: Clols-Fuentes J, Nguinkal JA, Unger P, Kreikemeyer B and Palm HW (2023) Bacterial community in African catfish (Clarias gariepinus) recirculating aquaculture systems under different stocking densities. Front. Mar. Sci. 10:1073250. doi: 10.3389/fmars.2023.1073250
Received: 27 October 2022; Accepted: 02 January 2023;
Published: 26 January 2023.
Edited by:
Wei Huang, Ministry of Natural Resources, ChinaReviewed by:
John Phillip Bowman, University of Tasmania, AustraliaLi Li, Ocean University of China, China
Copyright © 2023 Clols-Fuentes, Nguinkal, Unger, Kreikemeyer and Palm. This is an open-access article distributed under the terms of the Creative Commons Attribution License (CC BY). The use, distribution or reproduction in other forums is permitted, provided the original author(s) and the copyright owner(s) are credited and that the original publication in this journal is cited, in accordance with accepted academic practice. No use, distribution or reproduction is permitted which does not comply with these terms.
*Correspondence: Júlia Clols-Fuentes, julia.fuentes@uni-rostock.de