 Minze Liao
 Xinxin Long1†
 Zihao He
 Jichen Zhao
 Xieyan Chen
 Chengbo Sun
95% of researchers rate our articles as excellent or good
Learn more about the work of our research integrity team to safeguard the quality of each article we publish.
Find out more
ORIGINAL RESEARCH article
Front. Mar. Sci. , 27 September 2022
Sec. Marine Fisheries, Aquaculture and Living Resources
Volume 9 - 2022 | https://doi.org/10.3389/fmars.2022.963331
This article is part of the Research Topic Microbiome dynamics as biomarkers of welfare status in aquatic species View all 6 articles
“Fishery-photovoltaic (PV) Integration” is a novel aquaculture model that provides enormous potential for aquaculture development. However, research on the aquaculture environment and organisms under the “Fishery-PV Integration” mode is presently sparse. This study investigated Penaeus monodon as a model, studying the growth rates of shrimp, water quality conditions, and the micro-ecological environment. After 105 days of rearing, P. monodon (initial weight of 0.006 ± 0.001 g) reached an average body weight of 11.69 ± 0.92 g. The water quality was stable (C() ≤ 1.57 mg/L) during the experimental period. The 16S rRNA gene sequencing results showed that bacterial community structures were significantly distinct among water, effluent and intestinal environments, with a closer relationship between the microbiotas in effluent and water. The dominant phyla present in shrimp intestines, water, and effluent were Proteobacteria, Actinobacteriota, and Bacteroidota. Likewise, Ralstonia, Candidatus Aquiluna, and Vibrio were the dominant genus in the three groups. The relative abundance of Vibrio as a common opportunistic pathogen for shrimp was relatively low, which is beneficial to promote the healthy growth of shrimp. The function of the “Fishery-PV Integration” microbiota was investigated using metagenomic technology. Results showed that microorganisms played an essential role in regulating intestinal amino acids, carbohydrate, and energy metabolisms. Antibiotic resistance genes (ARGs) data indicate that tetH, QnrVC6 and tetX were dominated ARGs in the intestine. At the same time, the ARGs with the highest relative abundance in the water and effluent groups were MexL and adeF. Notably, only 123 ARGs were identified within the “Fishery-PV Integration” pond. This outcome is significantly lower than other studies, indicating that shrimp cultured in the “Fishery-PV Integration” pond had a higher level of food safety. The current study describes the characteristics of the microflora and ARGs distribution in the “Fishery-PV Integration” pond for the first time, providing fundamental information for formulating management strategies for the whole microflora to maintain the health of shrimp.
With the continuous reduction of global fishery resources, aquaculture will play an increasingly important role in the supply of human seafood (Huang et al., 2018). Shrimp farming is a vital component of aquaculture. The giant tiger prawn, P. monodon, is one of coastal China’s most economically important aquaculture shrimps. It is widely cultured worldwide because of its rapid growth rate and strong disease resistance (Nguyen et al., 2020). “Fishery-PV Integration” is a new type of aquaculture model. This set-up combines overwater power generation and underwater aquaculture, which not only continuously produces clean energy above the water but also produces high-quality aquatic products underwater. Furthermore, the “Fishery-PV Integration” mode aligns with the green development concept. Research has shown that the integration of aquaculture and solar power generation can improve the economic efficiency and employment level of aquaculture systems (Dong et al., 2022), playing an important role in aquaculture’s ability to resolve energy demands (Li et al., 2020). Currently, no reports describing the cultivation of P. monodon in “Fishery-PV Integration” ponds have been published.
In an aquaculture ecosystem, aquatic animals interact directly with environmental microbial communities in which beneficial microorganisms play a crucial role in material circulation, water quality regulation, and host health (Blancheton et al., 2013; Giatsis et al., 2015). In contrast, infection by pathogenic microbes can disrupt the dynamic balance of the host’s intestinal environment and reduce the amount of potentially beneficial bacteria, while increasing the levels of harmful bacteria, leading to disease occurrence (Munaeni et al., 2020). Indeed, the diseases affecting shrimp are strongly associated with the composition of the microorganism load in surrounding waters. Zhang D. et al. (2014) found that pond microbial communities in diseased shrimp populations were markedly distinct from those of healthy shrimp populations. They proposed that the composition of a bacterioplankton community can be used as a biological indicator to assess which shrimp diseases may occur. Furthermore, Lucas et al. (2010) argue that microbial loops dominate the water column food web, stating that when a large amount of nutrients are suddenly imported, the microbial cycle function is altered. The abundance of harmful bacteria increases, leading to the outbreak of bacterial disease in shrimp. As a new type of aquaculture, the “Fishery-PV Integration” is still unknown regarding the structure and function of its micro-ecological environment. Therefore, an in-depth study of the relationship between microorganisms and shrimp gut in “Fishery-PV Integration” ponds is necessary to develop management strategies for the whole microbiota to maintain shrimp health.
Antibiotics have long been used in aquaculture to prevent diseases and promote shrimp growth. Nevertheless, the spread of antibiotic resistance genes (ARGs) in aquatic products has raised concerns due to the overuse of antibiotics in aquaculture (Abriouel et al., 2008). As emerging environmental contaminants, ARGs had numerous adverse effects on the ecological environment and human health (Pruden et al., 2006). Consuming fishery products contaminated with antibiotics may cause adverse drug reactions or antibiotic-resistant bacteria in humans (Liu X. et al., 2017). Thus, as a new aquaculture mode, it is necessary to scientifically evaluate the ARGs of cultured animals and their surroundings in a “Fishery-PV Integration” pond.
Although the fish-lighting complementary has considerable potential for development, basic research on its micro-ecological environment and cultured organisms is still lacking. Currently, amplicon and metagenomic sequencing have been widely applied to study the microflora of aquaculture environments, including traditional white shrimp ponds (Zhang et al., 2019), higher-place white shrimp ponds (He et al., 2020), and biofloc-based aquaculture ponds (Chen et al., 2022). This present study cultures P. monodon in the “Fishery-PV Integration” engineering culture system, using metagenomic sequencing and 16S rRNA gene sequencing technologies to compare the composition, function, and ARGs profiles of bacterial communities in shrimp intestines, water, and effluent. The study aims to comprehensively understand the characteristics and functions of microbiota in “Fishery-PV Integration” ponds and contribute to adopting the “Fishery-PV Integration” cultivation mode.
The shrimp “Fishery-PV Integration” culture system consists of a plastic film pond culture system and a PV system (Figure 1A). The plastic film pond culture system consists of four parts: a culture pond with plastic film, an oxygen enrichment system, an influent and effluent system, and a tail water treatment system. The plastic film pond used in this study has an area of 600 m2, with a depth of 1.5 m at the pond edge; the pond dike was 50 cm above the ground, and the bottom of the pond was the shape of a pot with a slope of 45°. The pond center had a sewage outfall with a diameter of 16 cm, and a plastic film with a thickness of 0.1 cm was laid on the bottom and slope of the pond. The oxygen enrichment system comprised a micro-porous aeration disc, oxygen pipeline, and blower. The density of the aeration disc in the pond was 1/10 m2. The influent and effluent system consisted of a pump, a water supply pipe, and a drainpipe. The tail water treatment system used a three-stage aquaculture treatment system: (1) the primary treatment was conducted by herbivorous and omnivorous fish feeding on large particles, feed residues, and excrement in tail water; (2) the secondary treatment system relied on filter-feeding shellfish to remove suspended matter; and (3) the tertiary treatment was an algae-water purification system. The PV system consisted of PV panels and columns. The distance between the columns of the PV panel is 7.5 m, the radius of the column is 16 cm, the size of the PV panel is 1.6 m × 1 m, and the gap between the PV panels is 2.5cm. The maximum and minimum heights of the PV panels were 2.5 m and 2.2 m, and the light transmittance was 30%. A picture of the set-up is shown in Figure 1B.
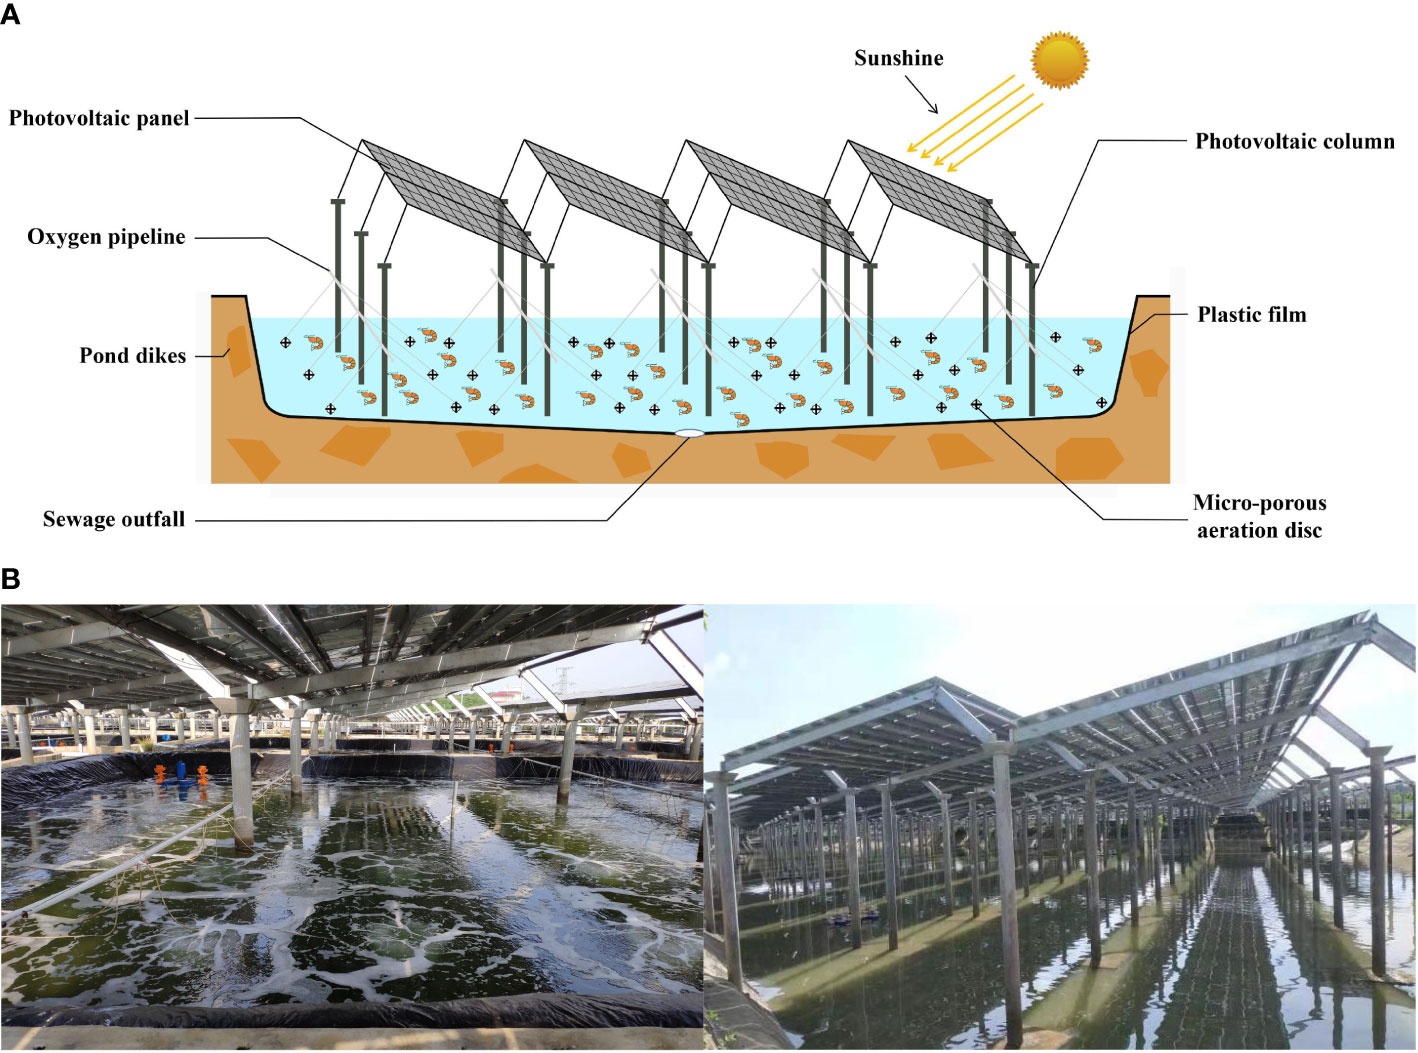
Figure 1 (A) Schematic diagram and (B) actual picture of “Fishery-PV Integration” culture pond.
The culture experiment was conducted at Xinrun Aquaculture Co. Ltd. in Fangchenggang city, Guangxi Province, China. Healthy juvenile P. monodon were purchased from a culture farm on Donghai Island in Zhanjiang (Guangdong, China). They were transferred into three “Fishery-PV Integration” ponds (J1, J2, J3) for rearing at a stocking density of 150 individuals/m2. During the rearing period, the amount of the following day’s feed was determined by the food intake of the shrimp on the previous day. The shrimp were fed with equal amounts of a commercial diet four times daily (7:00, 11:00, 18:00 and 23:00). Ammonia nitrogen, nitrite, and nitrate levels were chemically assessed after 15 days and every five days following (Lei, 2006). The body length and weight of the P. monodon were measured every 15 days. No diseases occurred, and no fishery drugs were used throughout the experimental period.
At the end of the rearing period, water, effluent, and shrimp intestine samples were collected from each of the “Fishery-PV Integration” ponds. 1 L water samples were collected at a depth of 50 cm below the water surface using a multi-point sampling method (four diagonals and the central area of the pond). It was filtered through a membrane (0.45 µm, Jinteng) using a diaphragm vacuum pump (GM-1.0A, Jinteng) and biological samples were collected, labeled as JW1, JW2, and JW3, respectively. Meanwhile, 1 L effluent samples were collected from the sewage outfall in three ponds with a corer sampler, and after standing for 1 to 2 hours, the biological samples were collected by suction filtration with a 0.45 µm membrane, which was labeled as JT1, JT2, and JT3. Approximately 30 healthy shrimp (no disease characteristics) were taken from each pond and subjected to intestinal microbiota analysis. The sampled shrimp had an average body length of 10.69 ± 0.66 cm. Intestinal sampling was conducted according to previously reported methods (Rungrassamee et al., 2016). After the shrimp bodies were washed with water and 75% ethanol, the intestines were stripped with sterilising tools. Then, the intestinal contents of the shrimp from each pond were collected in a 10 ml centrifuge tube and labelled JI1, JI2, and JI3, respectively. All samples were stored at -80°C until DNA extraction.
Total genomic DNA of the shrimp intestines, water, and effluent samples was extracted with TIANamp Soil DNA Kits (TIANGEN, Beijing, China) following the manufacturer’s protocol. 1 L of water or effluent samples were filtered through 0.22 μm millipore filter membranes to collect microorganisms (Jinteng, Tianjin, China), which were aseptically cut into quarters for DNA extraction. Shrimp gut samples were directly used for DNA extraction. DNA concentration and purity were measured using a NanoVuePlus Spectrophotometer (GE Healthcare, Illinois, United States). The quality of the total DNA was monitored on 1% agarose gels. After quality assessment, DNA was stored at −80°C until use.
For further microbial community analysis, nine prepared DNA samples from water, effluent, and intestinal contents were sent to Novogene Biological Information Technology Co. (Tianjin, China). The specific primer pair 515F (5′-GTGCCAGCMGCCGCGGTAA-3′) and 806R (5′-GGACTACHVGGGTWTCTAAT-3′) was applied to amplify the V3-V4 hypervariable region of the 16S rRNA gene, which carries a unique barcode to distinguish samples. All PCR reactions were carried out using a 15 µL of Phusion® High-Fidelity PCR Master Mix (New England Biolabs, Massachusetts, United States). PCR was performed at 98°C for 1 min, followed by 30 cycles at 98°C for 10 s, at 50°C for 30 s, and at 72°C for 30 s, ending at 72°C for 5 min. Afterwards, an equal volume of PCR product was blended with 1× loading buffer (containing SYB green) and used for detection by electrophoresis in 2% agarose gel. Samples with a bright main strip between 400 and 450 bp were chosen for subsequent experimentation. The selected PCR products were mixed to equidensity ratios and purified with Qiagen Gel Extraction Kit (Qiagen, Germany). Sequencing libraries were generated via a TruSeq® DNA PCR-Free Sample Preparation Kit (Illumina, California, United States). The quality of libraries was assessed using a Qubit@ 2.0 Fluorometer (Thermo Fisher Scientific, Massachusetts, United States) and an Agilent Bioanalyzer 2100 (Agilent, California, United States) system. The libraries were finally subjected to Illumina NovaSeq (Illumina, California, United States) platform sequencing. The sequencing datasets are available in Sequence Read Archive database of NCBI with the accession number SRP363824.
Splitting each sample data from the paired-end allows it to be read according to the unique barcode. After the barcode and primer sequences were truncated, the raw tags were generated using FLASH (ver.1.2.7) (Magoč and Salzberg, 2011). Sequences from the raw data were analysed and filtered using QIIME (ver.1.9.1) to obtain high-quality clean tags. Low-quality tags with quality value ≤ 19, homopolymer ≥ 3 bases, and consecutive high-quality bases < 75% were filtered out. The resulting quality-filtered tags were compared with the reference database (Silva Database) using the UCHIME algorithm (Edgar et al., 2011), which detects and removes chimaera sequences, resulting in effective tags.
Sequences with ≥ 97% similarity were assigned to the same operational taxonomic units (OTUs) using Uparse software (ver.7.0.1001) (Edgar, 2013). For each OTU-representative sequence, the SILVA Database (Quast et al., 2012) was used based on the MOTHUR algorithm to annotate taxonomic information with an 80% confidence threshold. In preparation for later analysis, OTU abundance information was normalised according to a sequence number standard corresponding to the sample with the least sequence among the 9 samples. Furthermore, the differences in phyla and genera between groups were compared using one-way analysis of variance (one-way ANOVA) and Tukey’s multiple comparisons. Subsequently, the alpha diversity and beta diversity were calculated using QIIME software (ver. 1.7.0). The alpha diversity index included ACE, Chao1, Observed-species, Shannon, Simpson, and Good’s coverage. The beta diversity index was based on the phylogenetic relationship between OTUs to calculate the Unifrac distance (weighted Unifrac) and beta diversity results using the Principal Components Analysis (PCA). R software (ver.2.15.3) analysed PCA, Unweighted pair group method with arithmetic means (UPGMA), and Venn diagrams based on OTUs. To further explore the differences in community structure among the grouped samples the Linear discriminant analysis Effect Size (LEfSe) method was used to test the significance of the differences in group composition and the community results of the grouped samples to find different species (Segata et al., 2011).
Nine DNA samples from shrimp intestines (JI1, JI2 and JI3), water (JW1, JW2 and JW3), and effluent (JT1, JT2 and JT3) were used for metagenome analysis by Novogene Biological Information Technology Co. (Tianjin, China). The DNA quality and purity were assessed as mentioned above. 1 μg of each sample was utilised as input material for the DNA sample preparations. Sequencing libraries were generated using NEBNext® Ultra™ DNA Library Prep Kits for Illumina (New England Biolabs, Massachusetts, United States), following the manufacturer’s recommendations. Briefly, each DNA sample was randomly fragmented into 350 bp segments via sonication. PCR amplification was performed after they were end-polished, poly A-tailed, and ligated with the full-length adaptor. The library preparations were sequenced on an Illumina HiSeq 2500 (Illumina, California, United States) platform, and paired-end reads were generated.
The raw data obtained above was preprocessed using Readfq (V8) to acquire clean data for subsequent analysis. The specific processing steps are as follows: first, the reads which contained low-quality bases (default quality threshold value ≤ 38) with a default length exceeding 40 bp were removed. Then, the reads in which the N base exceeded 10 bp were removed. Lastly, the reads with adapter contamination above a certain percentage were removed. After filtering, clean data were assembled into scaftigs using the MEGAHIT software (ver. 1.0.4-beta) (Nielsen et al., 2014; Li et al., 2015). ORF prediction of scaftigs (≥ 500 bp) assembled from both single and mixed analyses were performed using MetaGeneMark software (V2.10). The results of the ORF prediction were made de-redundant using CD-HIT software (V4.5.8) to obtain a non-redundant initial gene catalogue (Li and Godzik, 2006; Fu et al., 2012). Subsequently, the clean data of each sample was compared with the initial gene catalogue using Bowtie 2.2.4, yielding the unigenes obtained for subsequent analysis. The sequencing data were deposited into the Sequence Read Archive under accession number SRP367116.
Unigenes were aligned with Bacteria, Fungi, Archaea, and Viruses sequences in the NR database (Version: 2018-01-02) from NCBI using DIAMOND software (V0.9.9). The LCA algorithm was applied to determine species annotation information for the sequence alignment results (Buchfink et al., 2015). Relative abundance profiles at each taxonomic level were then displayed by Krona analysis (Ondov et al., 2011). In the functional analysis, the unigenes were blasted with the KEGG database (Version: 2018-01-01) using DIAMOND software (V0.9.9) (Kanehisa et al., 2014), and the best Blast Hit was selected out of each sequence alignment result for subsequent analysis (Li et al., 2014). The relative abundance of each functional hierarchy was equal to the sum of relative abundances annotated to that functional level. In addition, heatmaps based on z-standardized values of normalised relative abundance were constructed using R software (ver. 3.2.3).
Resistance Gene Identifier (RGI) software was used to align the unigenes to the CARD database (https://card.mcmaster.ca/) (Martínez et al., 2015; Jia et al., 2016) with parameter settings of blastp, evalue ≤ 1e-30. Based on the aligned results, the relative abundance of ARGs was counted. The abundance of ARGs, the abundance bar charts, an abundance cluster heatmap, and the difference in the number of resistance genes between groups are displayed. Analyses of the abundance and distribution of resistance genes in each sample, the resistance genes’ species attribution, and the resistance mechanism of the genes were also undertaken.
The growth performance of P. monodon is presented in Table 1. After rearing for 105 days, the P. monodon samples had an average weight of 11.69 ± 0.92 g, an average length of 10.69 ± 0.66 cm and a carapace length of 2.79 ± 0.04 cm. These data suggest that the growth of P. monodon occurred over three periods: between 0 and 15 days, rapid growth occurred with an SGR of 17.63%; between 30 and 60 days, steady growth occurred with an SGR of 5.20%–6.00%; and after day 75, slow growth occurred with an SGR of 0.75%–2.44%.
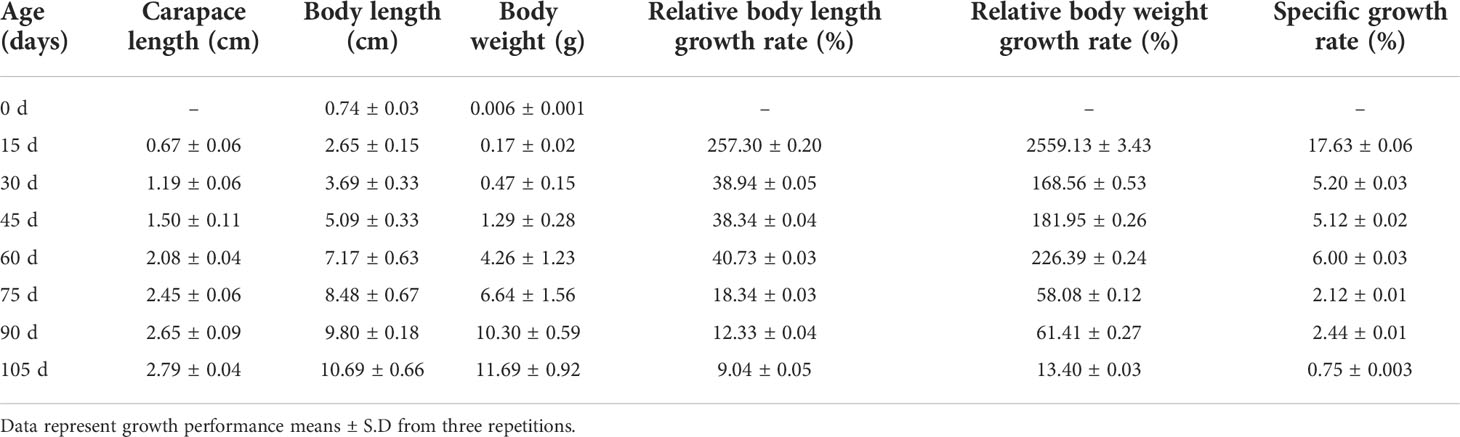
Table 1 Periodic growth performance of P. monodon cultured with “Fishery-PV Integration” engineering for 105 days.
The variation in levels of ammonia nitrogen, nitrite, and nitrate in the aquaculture water of the “Fishery-PV Integration” ponds is shown in Figure 2A. Ammonia nitrogen concentration is maintained at a low level during the rearing period and reached its highest value (1.57 mg/L) when the shrimp were 75 days old. Nitrite levels show an increasing trend until the shrimp are 85 days of age, when a maximum of 4.30 mg/L is reached. Nitrate levels peak when the shrimp is 75 days old at 13.41 mg/L. Throughout the culture trial, the pH and temperature of the seawater remained at approximately7.86 and 29.93 °C.
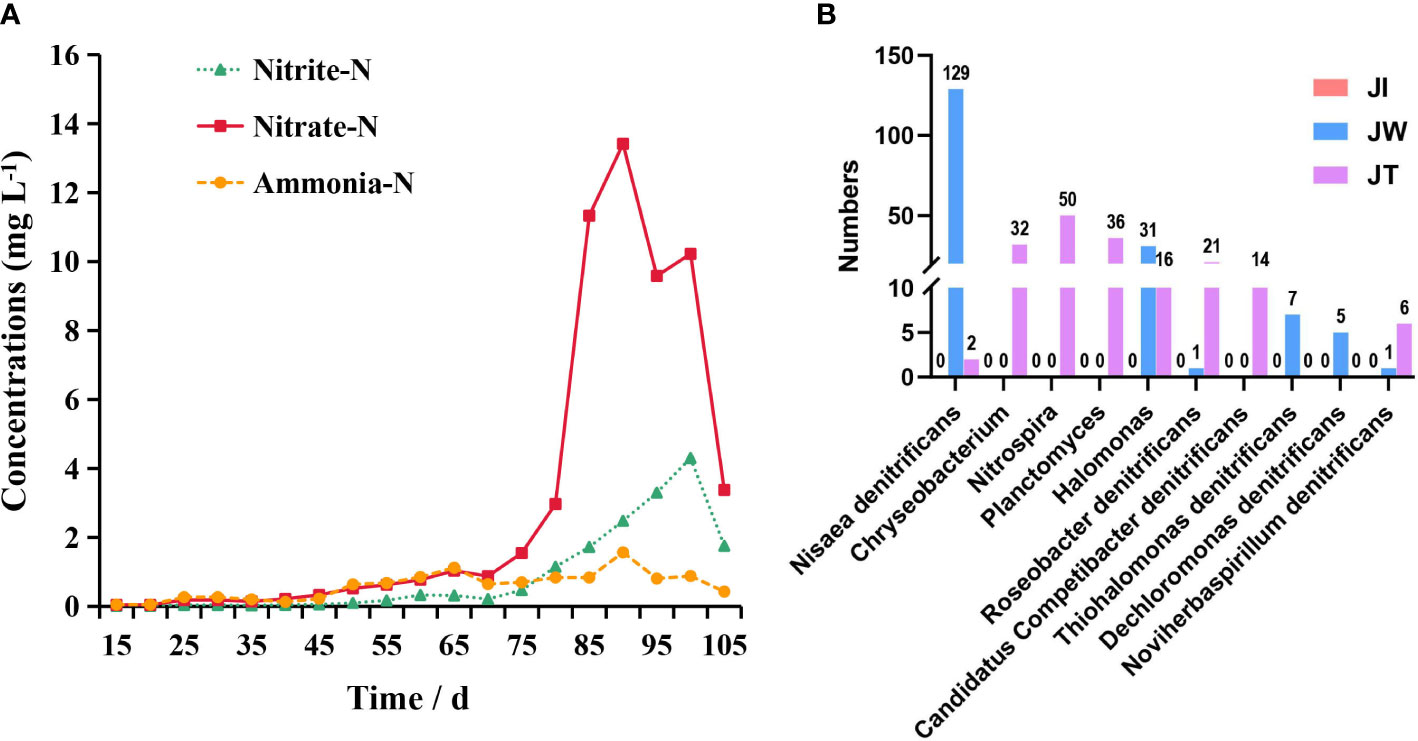
Figure 2 (A) Concentration of ammonia nitrogen (Ammonia-N), nitrite (Nitrite-N), and nitrate (Nitrate-N) over time in the “Fishery-PV Integration” ponds. (B) Bar plots show the distribution of 10 nitrogen-removing bacteria in the pond. The y-axis shows the number of genes annotated to the bacteria; the x-axis shows the name of the nitrogen-removing bacteria.
As shown in Table 2, 77,786-100,016 raw tags, 76,688-98,141 clean tags, 55,500–68,243 effective tags, and 53,443-66,802 taxon tags were obtained from nine samples. The average effective tags length was 413 to 428 nt. After quality filtering and trimming, 898 to 2,044 operational taxonomic units (OTUs) were detected using 97% identity as the cutoff in the samples. Good’s coverage estimations indicated that 99.2%-99.6% of the species were identified in all nine samples. Alpha diversity analysis showed that the Shannon index ranged from 1.016 to 6.765, the Simpson index ranged from 0.156 to 0.947, the Chao1 index from 873.392 to 2045.065, and the ACE index from 925.341 to 2102.897. Community richness indices (ACE and Chao1) and community diversity indices (Simpson and Shannon) showed that the richness and diversity of the water and effluent were significantly higher than the shrimp intestinal samples (P < 0.01) (Table 3).
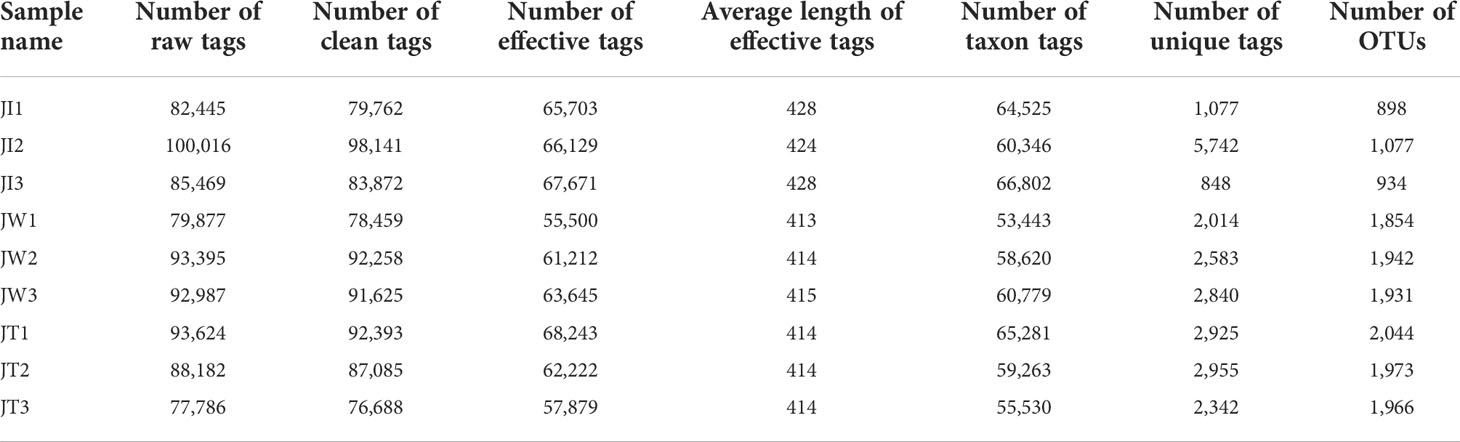
Table 2 16S rRNA gene sequencing results of 9 samples of shrimp intestine (JI), water (JW), and effluent (JT).
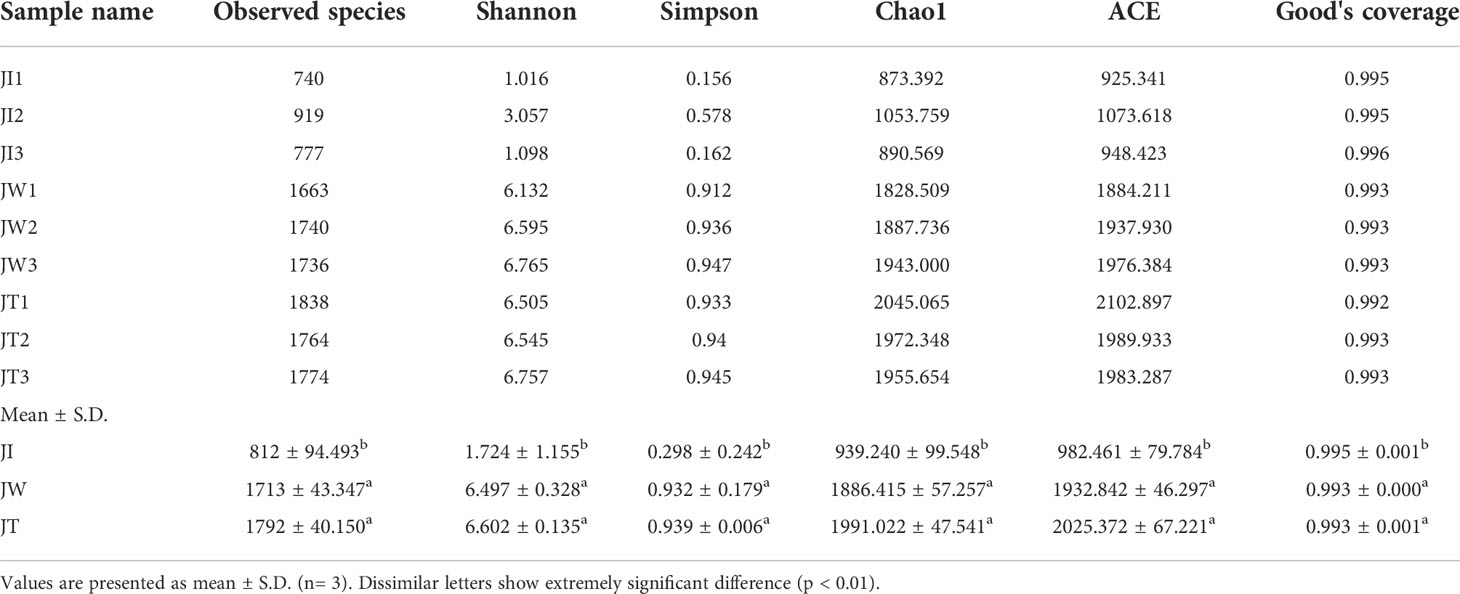
Table 3 Alpha diversity indices of shrimp intestine, water, and effluent.
The 16S rRNA genes from the shrimp intestines, water, and effluent were sequenced to investigate the bacterial community structure of the “Fishery-PV Integration” ponds. According to the abundance of taxa, OTUs were identified as being from 61 phyla. Within effluent (JT) and water (JW) samples, the dominant phyla (relative abundance > 2%) were the same. Proteobacteria (48.90%, 51.01%) was the most abundant phyla in the effluent and water samples, followed by Actinobacteriota (9.30%, 9.14%), Bacteroidota (3.88%, 4.32%), and Verrucomicrobiota (2.73%, 3.22%), in total accounting for 64.81% and 67.69% of all sequences, respectively. The other divisions consistently found in the two groups were Firmicutes and Acidobacteriota (Figure 3A). In shrimp intestinal microbiota (JI), Proteobacteria was the most abundant phyla, accounting for over 92% of all sequences in intestinal samples. In the intestinal samples, most OTUs were mapped to Proteobacteria (Figure 3B), and there was a significant difference between the other two groups (p < 0.05). Notably, the abundance of Actinobacteriota, Verrucomicrobiota, and Bacteroidota in the water and effluent groups were significantly upregulated. The relative abundance of Firmicutes in the water group was significantly increased compared with the other two groups. Interestingly, the microbiota in the water samples closely matched the effluent samples (Figure 3C).
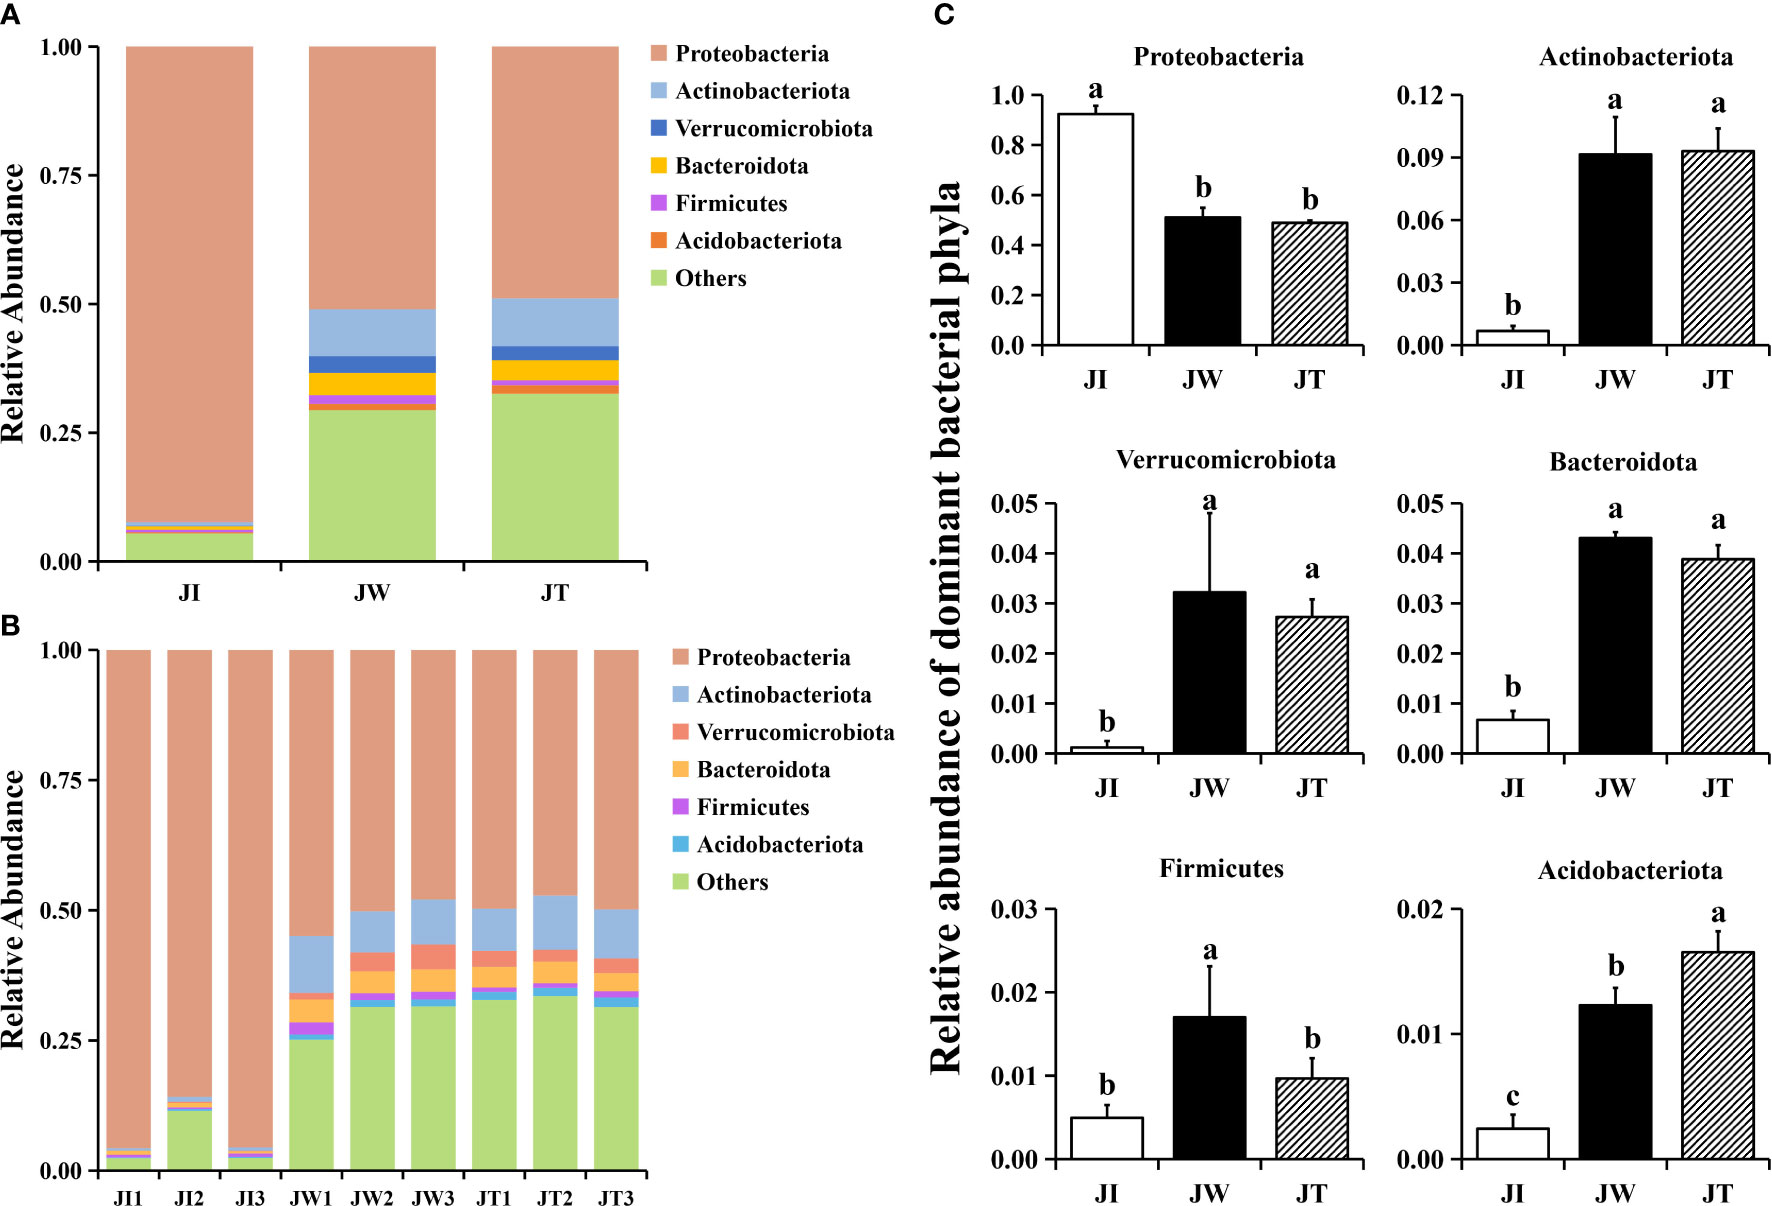
Figure 3 Structure and composition of the intestinal bacterial communities among shrimp intestines (JI), water (JW), and effluent (JT) samples in “Fishery-PV Integration” ponds at the phylum level of taxonomy. (A) Relative abundance of phyla across the three groups, (B) the phyla appearing in each sample, and (C) changes in the abundance of dominant bacterial phyla. Data are presented as mean ± S.D. Dissimilar letters show significant difference (P < 0.05).
When the OTUs were considered at the genus level, 673 taxa were identified in all samples. The top 6 most common genera were Ralstonia, Candidatus Aquiluna, Vibrio, Roseivivax, Terrimicrobium, and Marivita (Figure 4A). Compared with the water and effluent samples, the relative abundance of Ralstonia in intestinal samples was significantly increased (p < 0.05) (Figure 4B). In contrast, the relative abundance of Candidatus Aquiluna, Marivita and Roseivivax in the water and effluent group was higher than the intestinal group. The abundance of Vibrio in the intestinal samples was higher but relatively low (≤ 0.03%). There was no significant difference among the groups (p > 0.05) (Figure 4C). We also screened ten nitrogen-removing bacteria for characterisation at the species level, including Nisaea denitrificans, Chryseobacterium, Nitrospira, Planctomyces, Halomonas, Roseobacter denitrificans, Candidatus Competibacter denitrificans, Thiohalomonas denitrificans, Dechloromonas denitrificans, and Noviherbaspirillum denitrificans (Figure 2B).
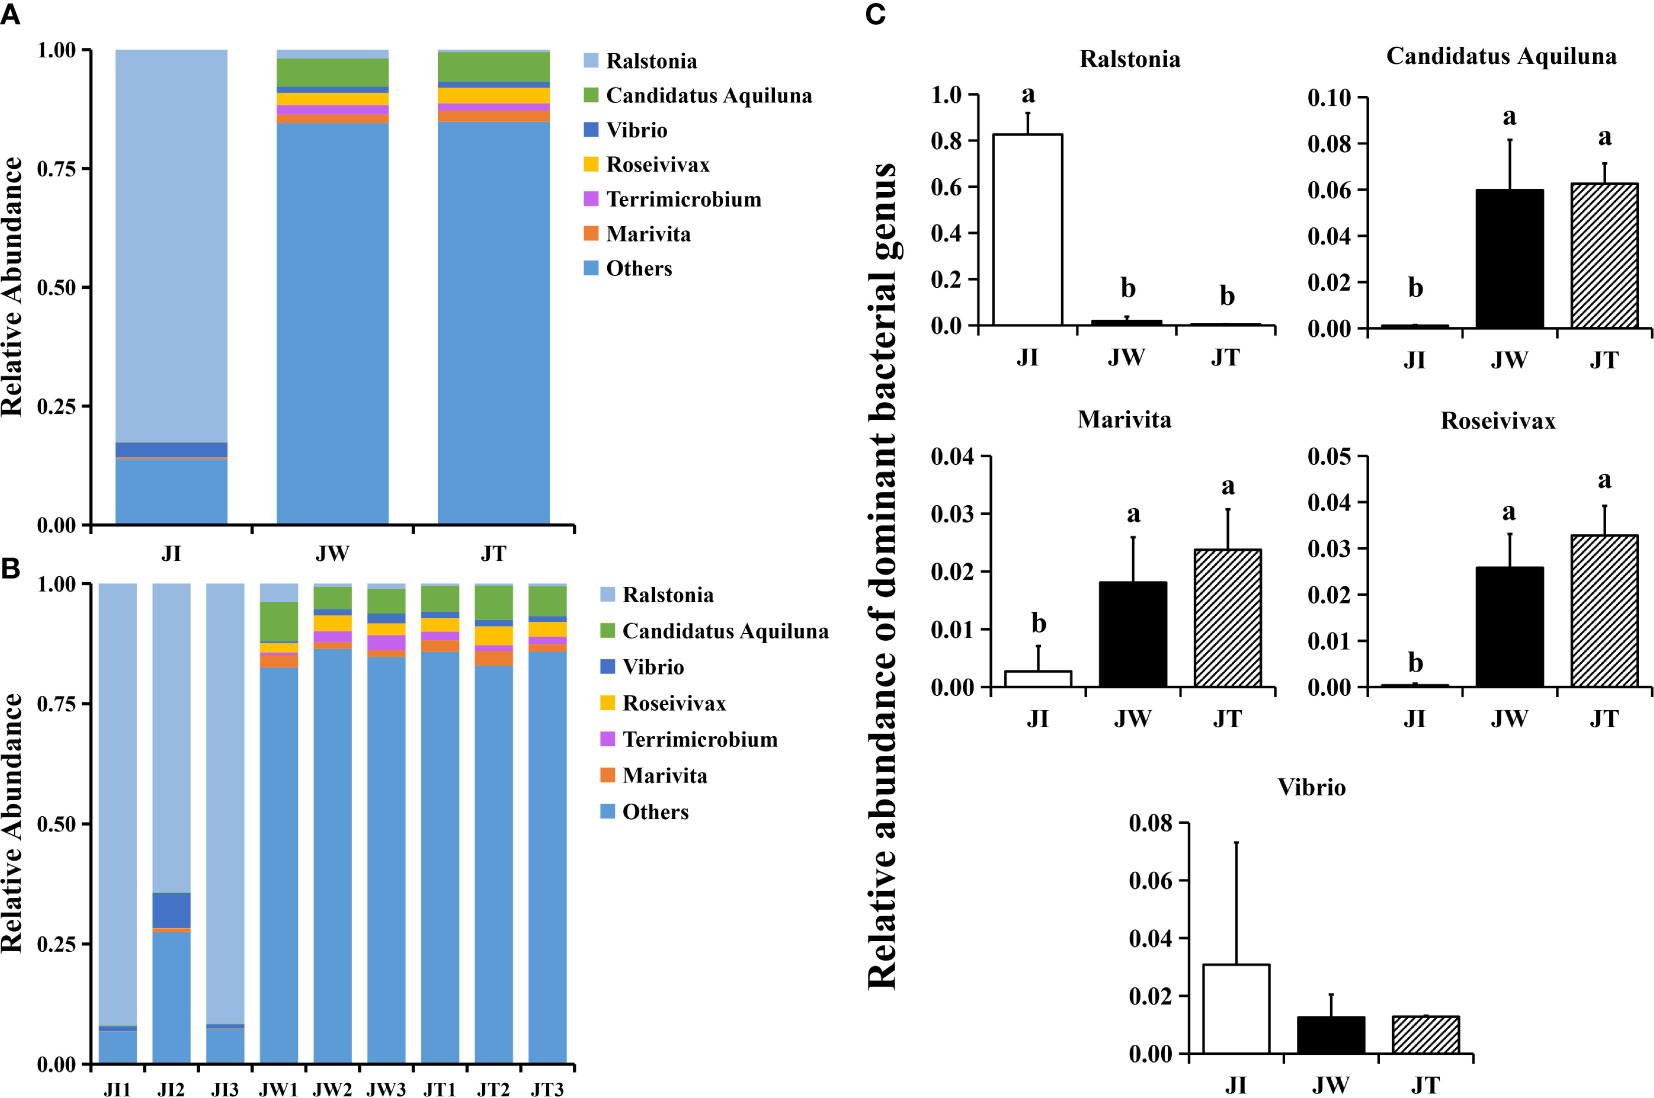
Figure 4 Structure and composition of the intestinal bacterial communities among shrimp intestines (JI), water (JW), and effluent (JT) samples in “Fishery-PV Integration” ponds by genus. (A) Relative abundance of genera across the three groups, (B) the genera appearing in each sample, and (C) the changes in abundance of dominant bacterial genera. Data are presented as mean ± S.D. Dissimilar letters show significant difference (P < 0.05).
The Venn figure shows that the sequences found in shrimp intestinal, water, and effluent samples are clustered into 1631, 2821, and 2817 OTUs, respectively (Figure 5A). 928 OTUs were shared between JI, JW, and JT, accounting for 22.82% of the identified OTUs. Proteobacteria is the most abundant phylum among the shared OTUs, accounting for 31.25% (290 OTUs). Notably, the percent of OTUs shared by JI and JW, JI and JT, and JW and JT were 28.37%, 25.30%, and 47.87%, respectively, indicating that JW and JT shared more identical OTUs. A PCA plot reveals the composition of the microbial communities found in shrimp intestines, water, and effluent samples in the “Fishery-PV Integration” ponds. As shown in Figure 5B, the first two components explain 36.84% of the variation (PC1, 22.97%; PC2, 13.87%). This figure also illustrates that JW and JT samples were closely clustered, while JI samples tended to cluster separately. UPGMA cluster analysis reveals that JW and JT are clustered together (Figure 5C). The weighted UniFrac analysis shows that the abundance of groups found in the JW and JT samples was lower than that of the JI samples. The flora found in the JW samples was most like that of the JT group (Figure 5D). Overall, this data indicates that the compositions of microbial communities are most similar between the JW and JT groups in the “Fishery-PV Integration” ponds.
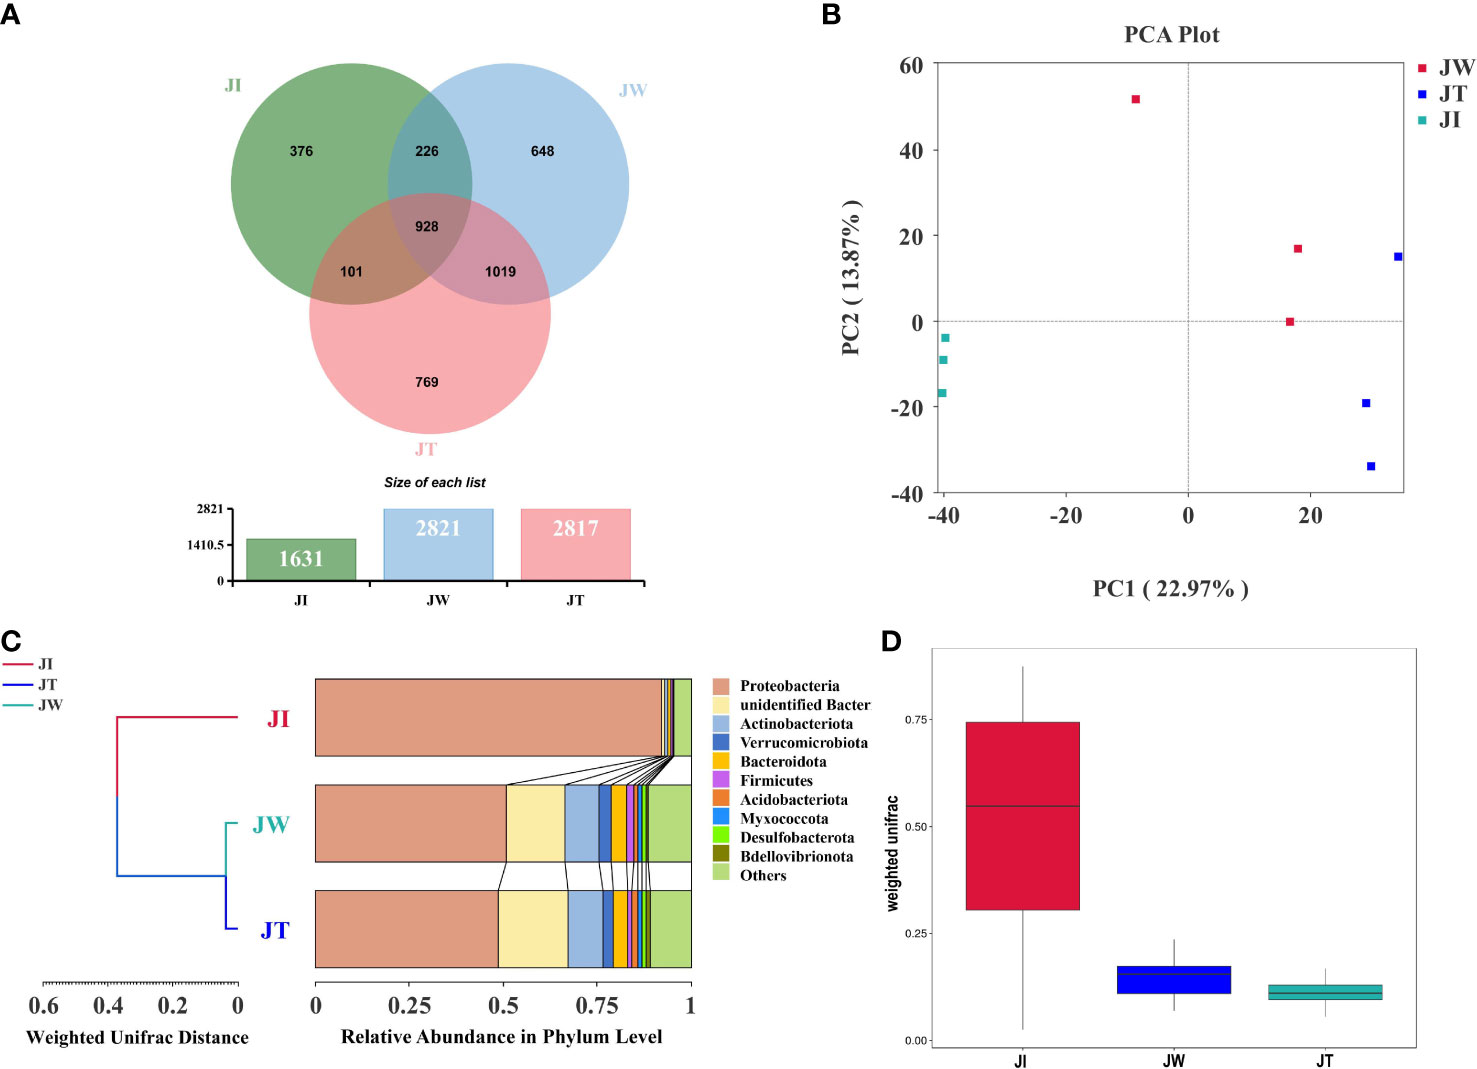
Figure 5 Associations between microbial communities of shrimp intestinal, water, and effluent samples in “Fishery-PV Integration” ponds. (A) Venn diagram of unique and shared bacterial OTUs from intestinal contents (JI), water (JW), and effluent (JT). (B) PCA distribution plot; samples from the same group are clustered closer. (C) UPGMA clustering tree based on the Weighted UniFrac distance at the phylum level. The length of the branches represents the distance between the samples. If the composition of the microbial communities in the samples is similar, they will be clustered together in the clustering tree. (D) Weighted UniFrac analysis of intestinal contents (JI), water (JW), and effluent (JT).
LEfSe analysis was used to reveal specific taxa associated with each sample. As shown in Figure 6, LEfSe analysis was conducted between JI, JW, and JT samples. The bar chart indicates that 11 specific taxa were identified with an LDA score of >4 (Figure 6A). JI had more specific taxa than JT and JW. The relevant taxa in JI, JT, and JW were g_Ralstonia, s_Ralstonia_pickettii, f_Burkholderiaceae, o_Burkholderiales and c_Gammaproteobacteria; p_unidentified_Bacteria, c_Bacteroidia, o_Chitinophagales, and f_Saprospiraceae; c_Bacteroidia and p_Bacteroidota, respectively. Evolutionary branch diagrams of LEfSe analysis based on classification information are given in Figure 6B, showing the different information of all bacteria at the phylum, class, order, family, and genus levels.
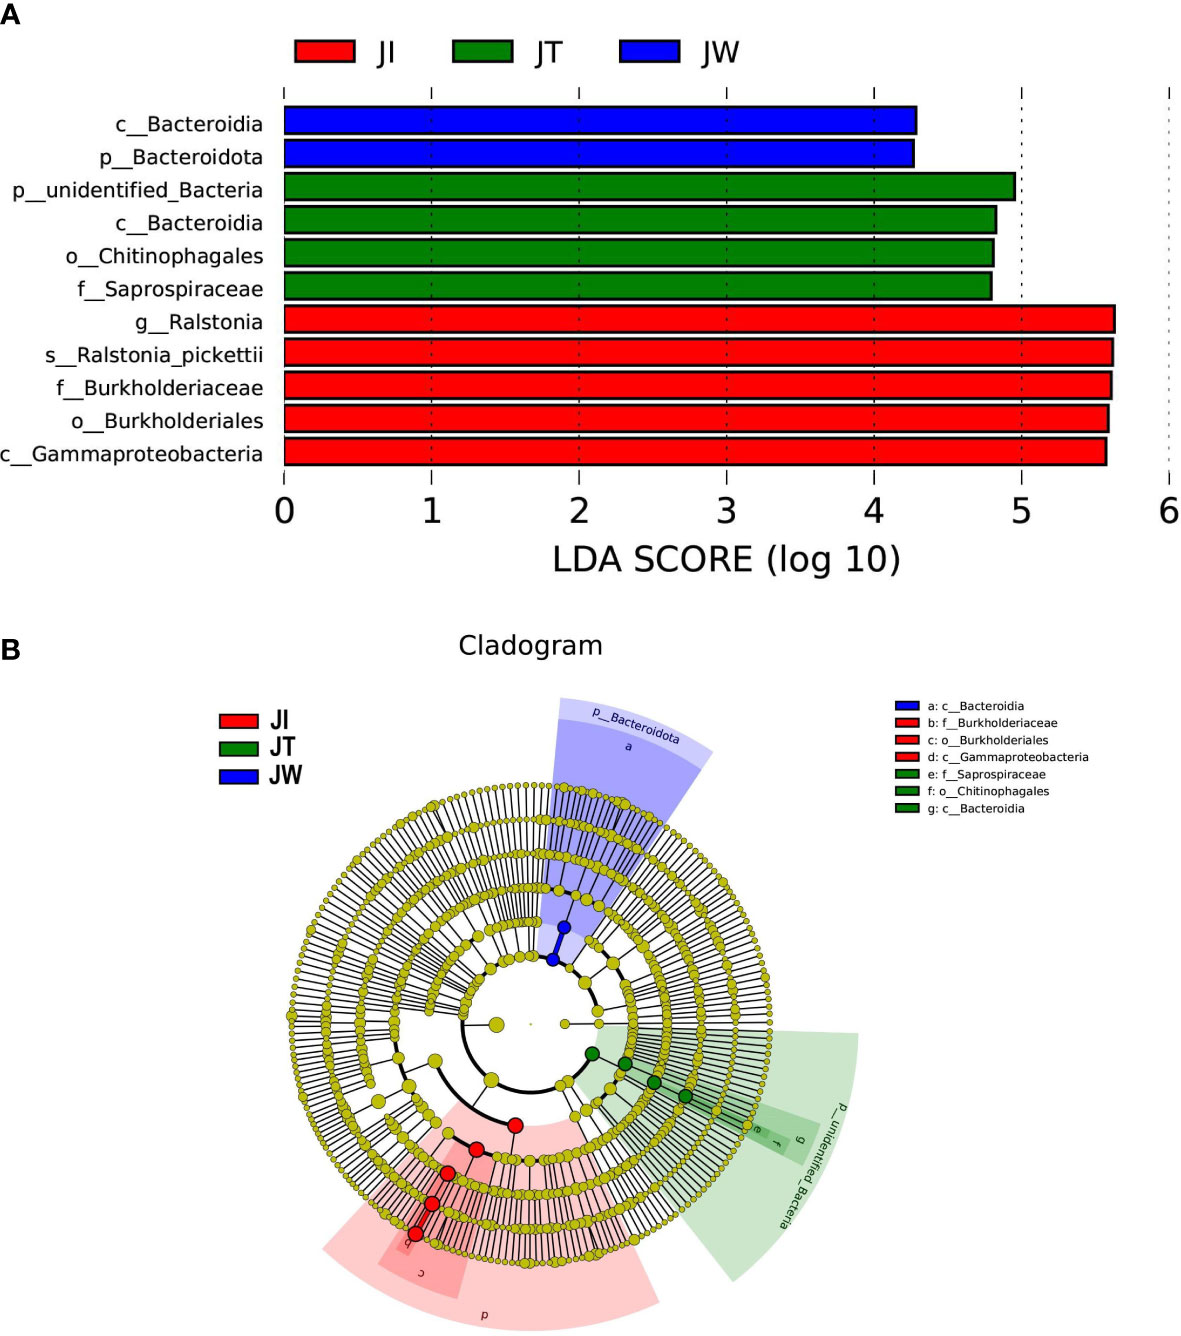
Figure 6 LEfSe analysis of JI, JW, and JT. (A) Only taxa with LDA values (influence value of linear discriminant analysis) higher than four are shown. (B) Evolutionary branch graph of differential bacterial communities or species.
In this study, the microbial DNA samples from shrimp intestines, water, and effluent samples were sequenced using the Illumina HiSeq platform. The data shows that a total of 6323.49–6642.93 M bp of raw data and 6315.43–6534.97 M bp of clean data were obtained from samples JI, JW, and JT. After single-sample and hybrid assembly, 1,844–87,963 scaftigs were obtained with an average N50 of 1371 bp. 2,230–155,869 ORFs (open reading frames) were generated and annotated using the MetaGeneMark software (Ver 2.10). Taxonomic classification according to metagenome shows that most reads in the JW and JT groups were assigned to Bacteria (57.00%–61.67%), whereas the proportion of bacteria in the JI group was only 14%. The relative abundance of Bacteria, Archaea, Eukaryota, and Viruses was 14.00–61.77%, 0.01–0.30%, 0.13–0.33%, and 3.67–5.63%, respectively (Table 4). Figure 7 shows the top 10 dominant bacterial phyla and genera based on the metagenome sequencing profiles. It was observed that Proteobacteria is the most abundant phyla found in all samples (Figure 7A). At the genus level, the abundance of Vibrio in JI was higher than that of JW and JT (Figure 7B). These results are consistent with the amplicon sequencing results.
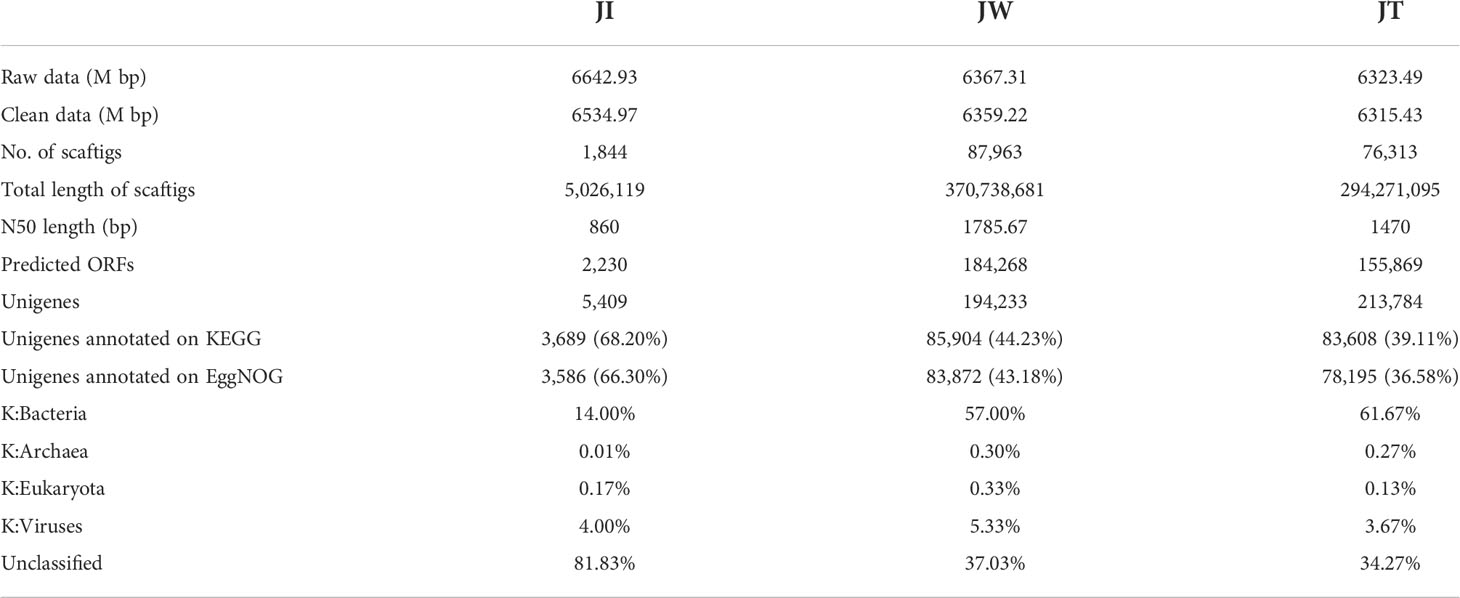
Table 4 Statistics of metagenome sequencing data from JI, JW, and JT in “Fishery-PV Integration” ponds.
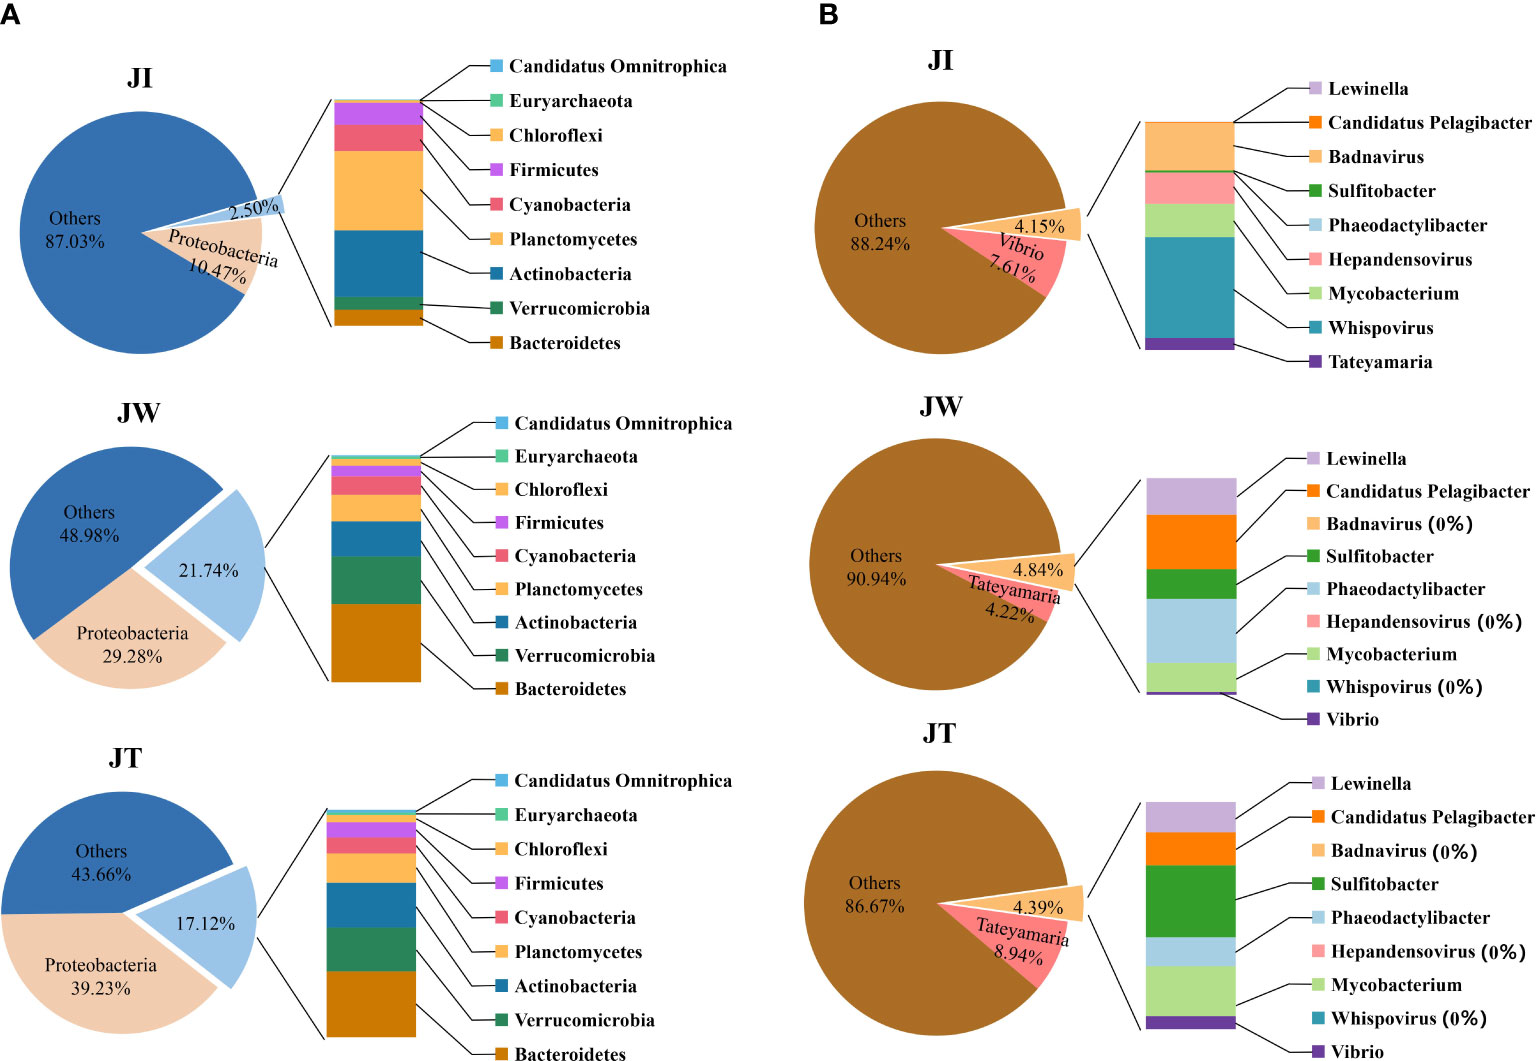
Figure 7 Relative abundances of top 10 dominant bacterial phyla (A) and genus (B) among water (JW), effluent (JT), and shrimp intestines (JI) based on the metagenome sequencing profiles.
Figure 8A indicates that water (JW) and effluent (JT) microbiota had more functional genes than shrimp intestine (JI) samples, suggesting that shrimp intestinal microbiota have functional pathways distinct from those of the water and effluent microbial communities. In KEGG level 1, a high proportion of the gene annotations in shrimp intestines, water, and effluent are mainly associated with “Metabolism,” “Human Diseases,” “Genetic Information Processing,” “Environment Information Processing,” and “Cellular Processes.” Within KEGG level 2, carbohydrate metabolism, amino acid metabolism, energy metabolism, and metabolism of cofactors and vitamins are the most dominant metabolism types. The dominant pathways in “Environmental Information Processing” are membrane transport and signal transduction. The most abundant pathways in the “Genetic Information Processing” category are translation; replication, repair, folding; and sorting and degradation. The “Cellular Processes” category is dominated by the cellular community, cell growth and death, and cell motility pathways. Additionally, 35 of the most abundant pathways at the third level of KEGG are displayed in Figure 8B, among which the most abundant pathways are ABC transporters (ko02010), purine metabolism (ko00230), pyrimidine metabolism (ko00240), quorum sensing (ko02024), two-component system (ko02020), and oxidative phosphorylation (ko00190). Moreover, heatmaps of the top 35 most abundant KEGG level 2 (Figure 9A) and level 3 pathways (Figure 9B) are presented. As Figure 9B suggested, two (ko05034, ko05322), four (ko00670, ko00240, ko00790, ko00970), and eighteen (ko02010, ko02020, ko03070, ko00680, ko00360, ko00630, ko00260, ko02024, ko00280, ko00860, ko00330, ko00650, ko00720, ko00010, ko00051, ko00640, ko00620, ko00030) pathways were notably enriched in JI, JW, and JT, respectively.
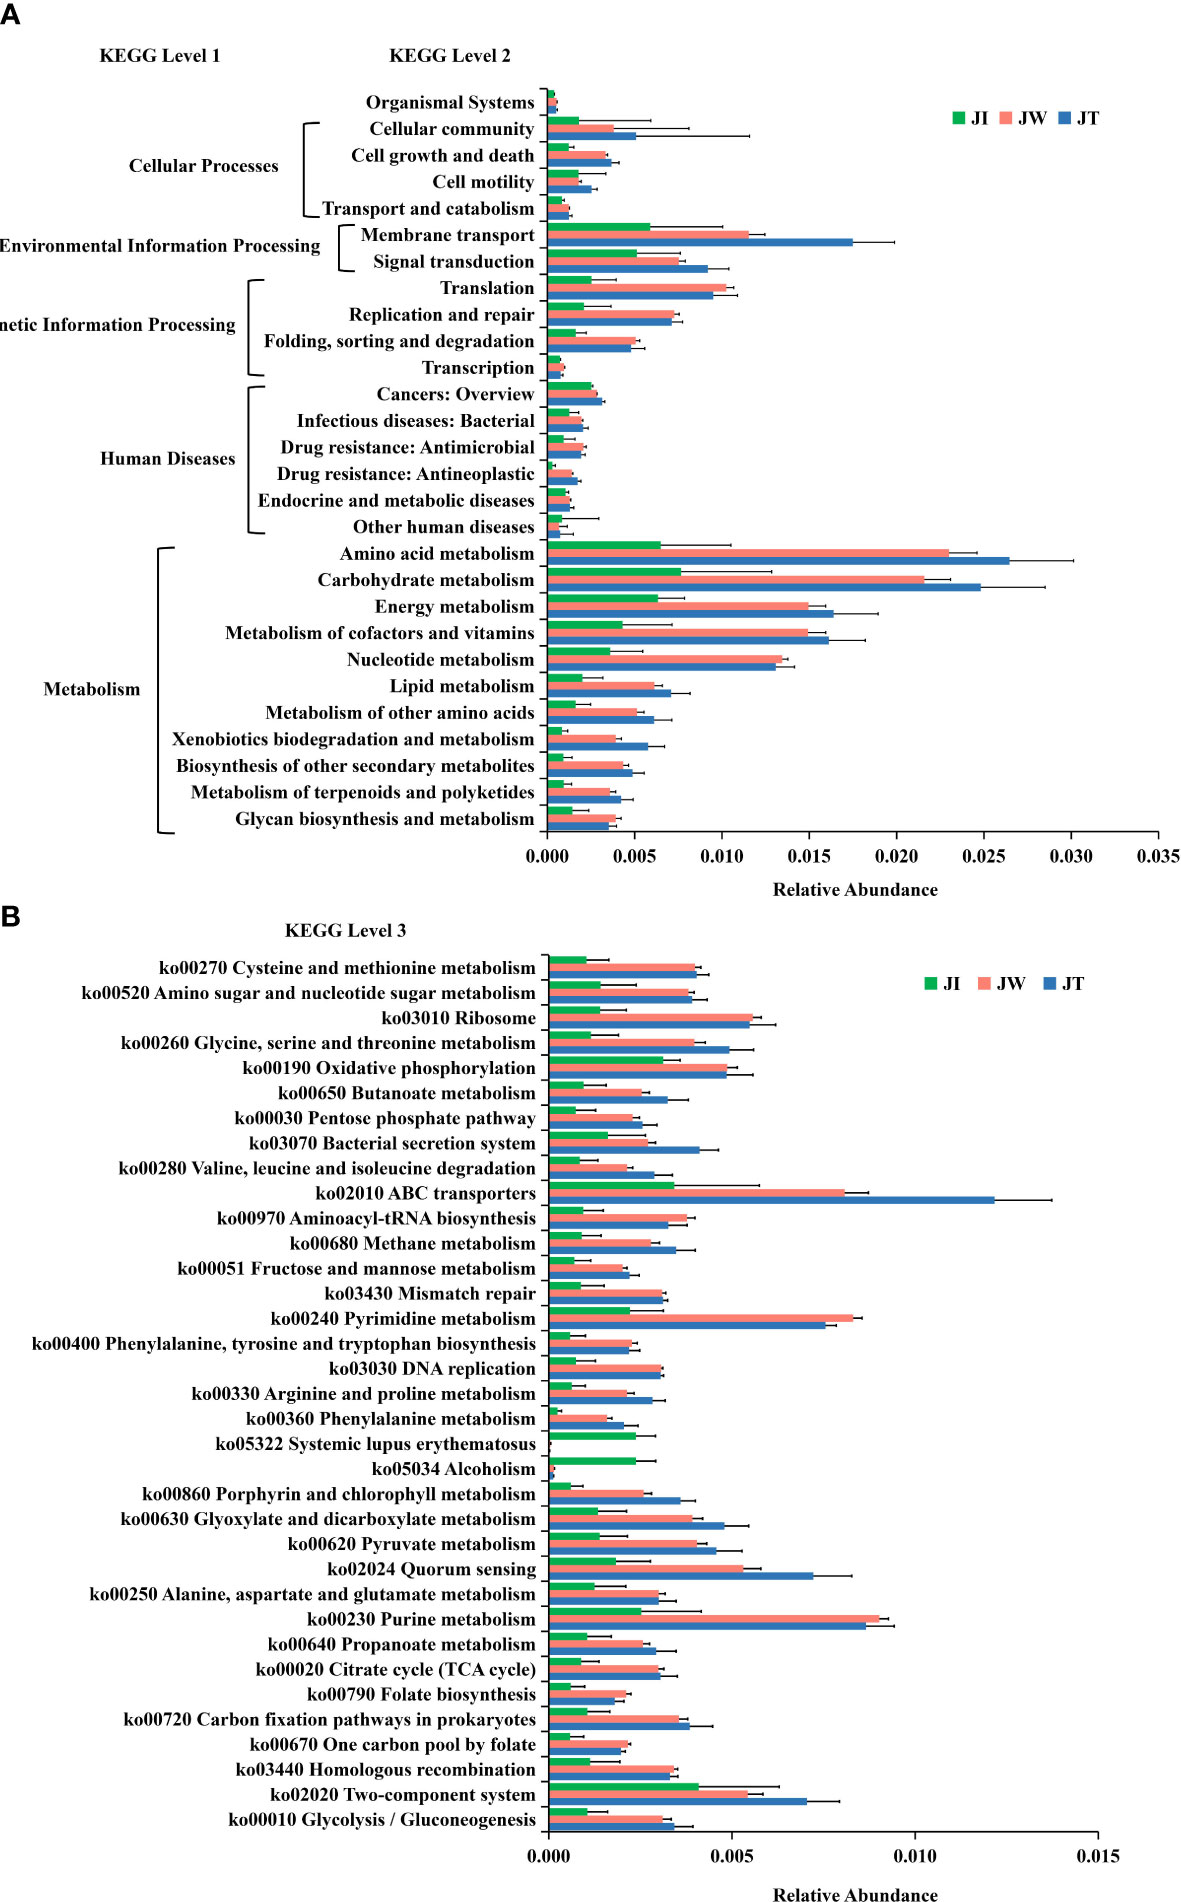
Figure 8 Normalised relative abundance of Unigenes of KEGG level 2 (A) and top 35 abundant KEGG level 3 (B) functional categories in JI, JW, and JT. Data are presented as mean ± S.D.
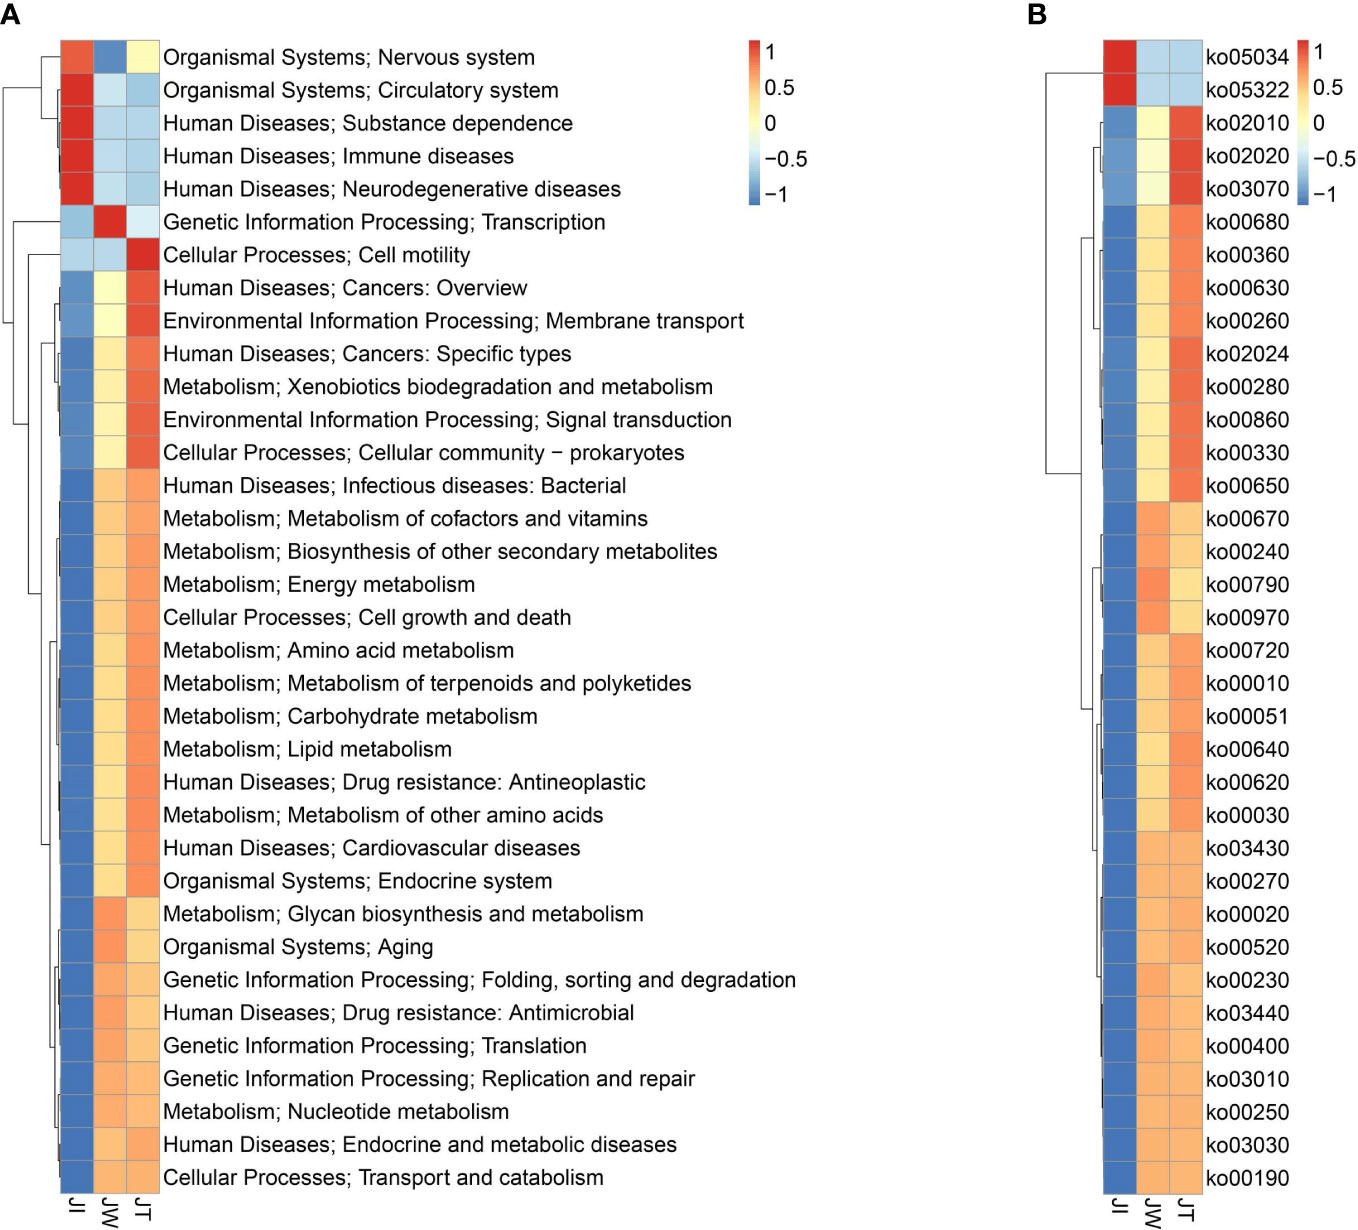
Figure 9 Heatmaps of top 35 abundant KEGG level 2 (A) and level 3 (B) functional categories based on z-standardized values of normalised relative abundance between JI, JW, and JT.
The resistance gene annotation results show that 123 kinds of ARGs were detected in the shrimp gut, pond water and effluent samples. The relative abundance of ARGs in all samples is shown in Figure 10A. In general, the relative abundance of the total ARGs found in JI, JW, and JT are 0.49-2.22 × 10⁻⁴ ppm, 2.59-2.76 × 10⁻⁴ ppm, and 3.71-4.27 × 10⁻⁴ ppm, respectively. Notably, ARGs are significantly more abundant in water and effluent samples than in intestinal samples. As showcased in Figure 10B, the ARGs of the intestinal group are dominated by tetH (10.19-26.56%), QnrVC6 (10.03-23.07%), and tetX (0.98-25.62%). Conversely, in the water and effluent groups, the ARGs with the highest relative abundance were MexL and adeF, ranging from 9.78% to 14.81% in the water group, and 11.84% to 15.29% in the effluent group. Figure 10C shows the association between the resistance mechanism and bacteria in all samples. Antibiotic inactivation and efflux pump were the dominant resistance mechanisms in all samples, with 57 and 48 resistance genes, respectively. Additionally, among the 45 resistance genes successfully annotated to the bacteria, 26 resistance genes were annotated to Proteobacteria. The two-circle diagram shows the relationship between resistance genes and species attribution in the JI, JW, and JT groups (Figure 10D). In JI, bacterial ARGs are mainly derived from Proteobacteria (32%), Planctomycetes (5%), and Actinobateria (6%). In contrast, in JW, bacterial ARGs were mainly found from Proteobacteria (23%) and Bacteroidetes (8%). Similarly, bacterial ARGs in JT are mainly from Proteobacteria (23%) and Bacteroidetes (7%).
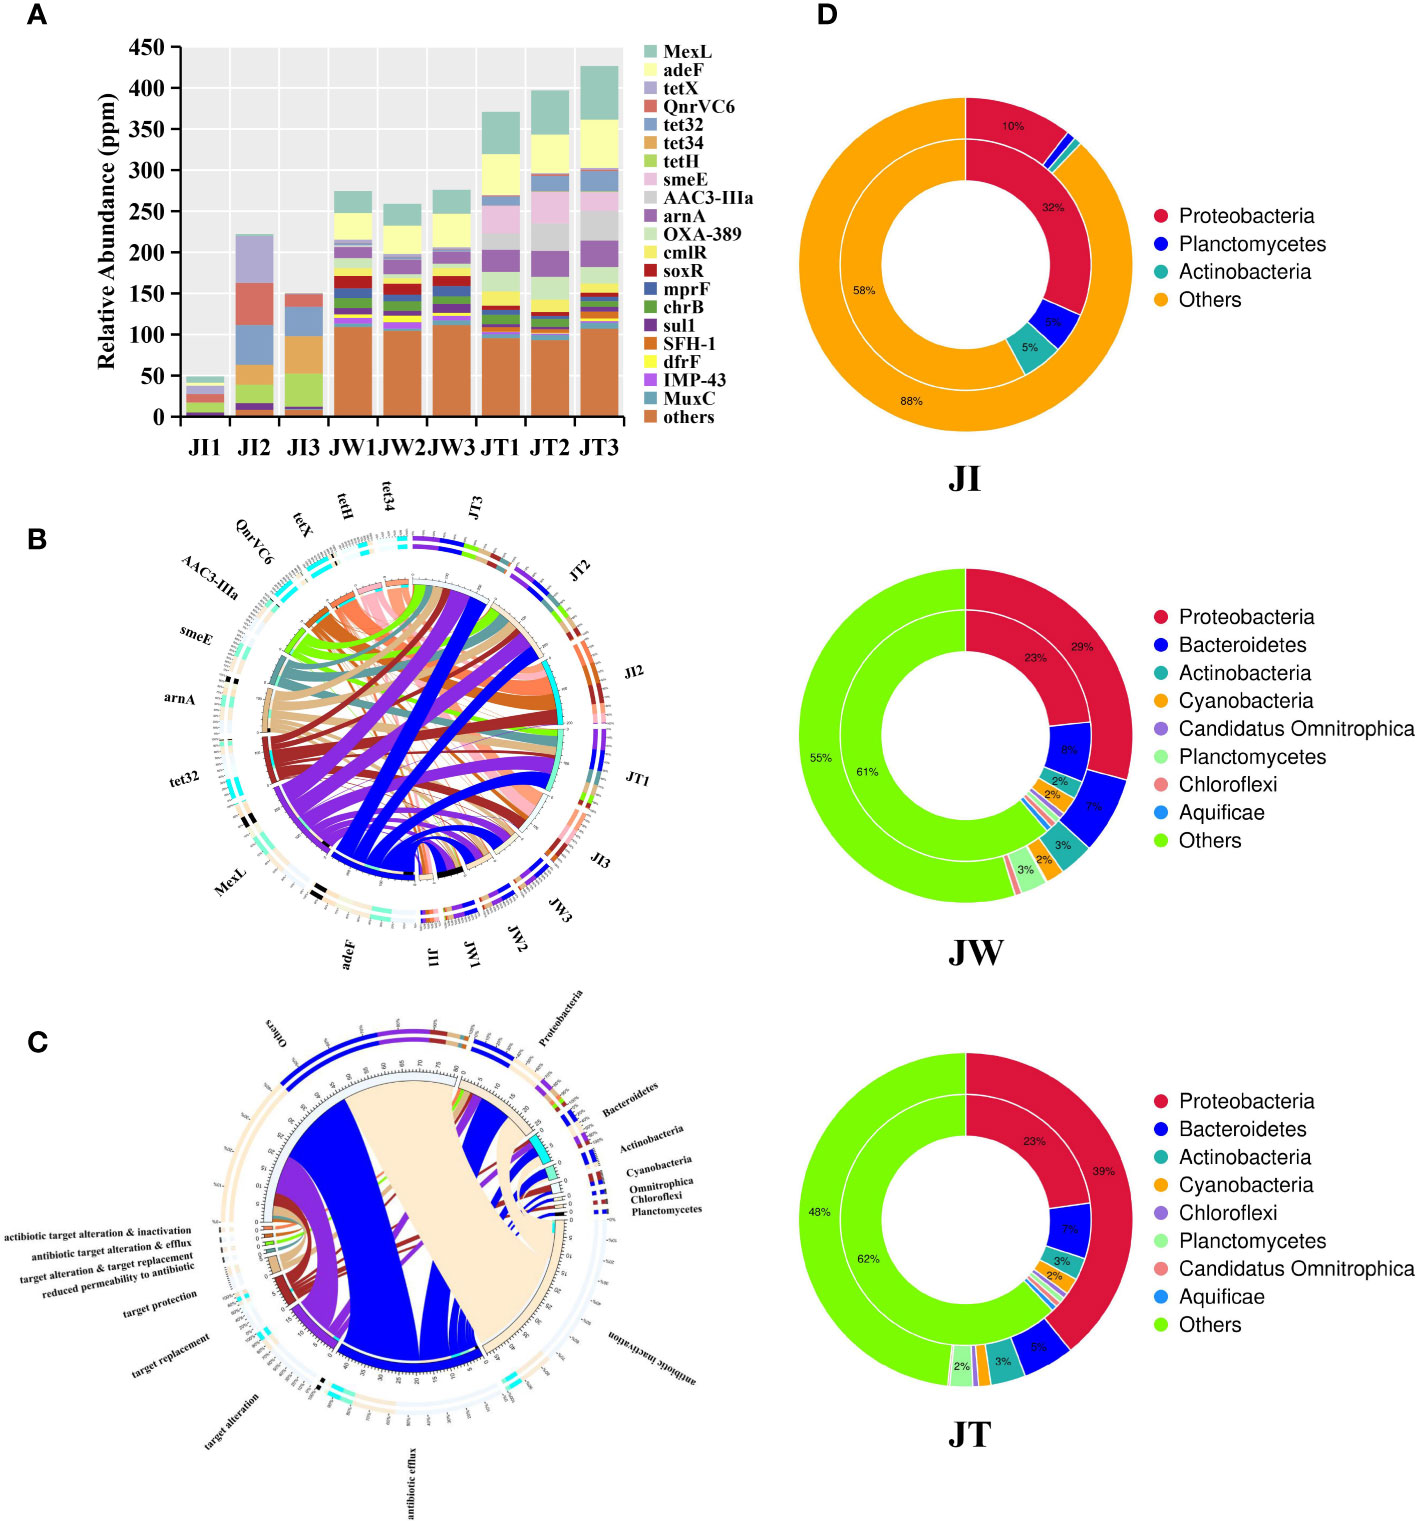
Figure 10 Results of resistance gene annotation in intestinal, water, and effluent samples in “Fishery-PV Integration” ponds. (A) Indicates the relative abundance of all the genes in each ARG sample (in ppm, the result of magnifying the original relative abundance data 106 times). (B) The ten most abundant ARGs are plotted on a circle diagram. The circle diagram is divided into two parts: ARG information on the left and sample information on the right. Different colours of the inner ring represent different samples and ARGs, and their scale represents their relative abundance in ppm. (C) The circle diagram consists of two parts. The species information at the phylum level is on the right side, and the left shows resistance mechanism information. The different colours in the inner circle indicate the resistance mechanisms of different species and resistances, and the scale represents the number of genes. The left side shows the sum of the number of resistance genes in the species that contain this type of resistance mechanism, and the right side shows the sum of the number of resistance genes contained in different resistance mechanisms. (D) Species identification analysis of ARGs in JI, JW, and JT samples. The inner circle represents the species distribution of ARGs, and the outer circle represents the species distribution of all genes in the group.
Compared with traditional aquaculture, “Fishery-PV Integration” improves the single-income and market vulnerability problems. Additionally, it meets the requirements of farming electricity and can be connected to the grid to obtain power income (Pringle et al., 2017). Previous investigations have established that the common P. monodon farming is about 9,000-12,800 kg/hm2, while the average yield of the “Fishery-PV Integration” research bases in this study can reach 10,900 kg/hm2, and the profit can reach 450,500-600,600 CNY/hm2. More importantly, the annual PV power generation can reach more than 92 million kWh, and the output value can exceed 90 million yuan, achieving a double harvest of fishing and electricity. Furthermore, PV panels on water can withstand typhoons, meaning that cultured organisms have a quiet growth environment. The shading effect of PV panels can inhibit the growth of harmful algae, which is beneficial to promote the healthy growth of shrimp. However, although the “Fishery-PV Integration” can achieve the double harvest of fishery and electricity, increasing the income of fishermen, fundamental research detailing “Fishery-PV Integration” has not been reported, and the structure and function of microbial community in its aquaculture environment are still unclear. This study uses a metagenomics approach combined with 16S rRNA gene sequencing to investigate the structure and function of bacterial communities and the diversity of ARGs in three P. monodon “Fishery-PV Integration” ponds in Guangxi Province, China. The water quality index and the growth rate of P. monodon were measured and recorded at regular intervals.
In the “Fishery-PV Integration” pond, Proteobacteria is the most dominant bacteria among the shrimp intestines, water, and effluent, and the abundance of Proteobacteria in intestinal samples was significantly higher than that of the surrounding water and effluent (p < 0.05). Previous studies have shown that Proteobacteria plays a vital role in degrading carbohydrates, amino acids and proteins (Costa et al., 2015). A recent study found that in higher-place shrimp ponds, Proteobacteria play a key role in carbon metabolism and amino acid biosynthesis in the shrimp’s intestine (He et al., 2020). Therefore, in the “Fishery-PV Integration” pond, shrimp may improve the decomposition ability of carbohydrates, amino acids and proteins by increasing the abundance of Proteobacteria in shrimp’s intestine, facilitating their own growth. In addition, it was noted that the abundance of Verrucomicrobiota and Acidobacteriota in the water and effluent is high. Verrucomicrobiota can hinder algae bloom onset by consuming fucose (Orellana et al., 2021), while Acidobacteriota promotes the material cycle (Flieder et al., 2021). These two kinds of bacteria may play a vital role in maintaining the homeostasis of the “Fishery-PV Integration” culture environment. Notably, at the genus level, Vibrio is relatively less abundant (≤ 0.03%), similar to the low levels of Vibrio in green water culture systems (Dash et al., 2017). Previous studies have shown that Vibrio levels in the green water culture system of P. monodon are too low to be detected, which may result from the combined inhibition of Vibrio growth by some bacteria, fungi and phytoplankton associated with this culture system (Lio-Po et al., 2002). In this study, the sampled shrimp were healthy, and no disease occurred during the experiment period. Thus, the “Fishery-PV Integration” culture system may also prevent the increase of Vibrio in the pond, and the low abundance of Vibrio benefits the healthy growth of shrimp. This may be attributed to the presence of bacteria, fungi and algae secreting Vibrio growth inhibitory factors in the “Fishery-PV Integration” culture system, but the specific control mechanism of Vibrio warrants further study. Analyses of alpha and beta diversities showed that water and effluent richness (ACE and Chao1) and diversity (Simpson and Shannon) were significantly higher than shrimp intestines. This could be attributed to the fact that feed residue and shrimp excrement may provide a suitable nutritional growth environment for microflora in the water and effluent (Cornejo-Granados et al., 2017). Notably, the diversity index of intestinal microflora was low. Studies indicate that the reduction of intestinal microbial diversity may decrease functional microflora and weaken the host’s ability to resist the invasion of pathogens (Fändriks, 2017). Therefore, an appropriate number of probiotics should be added to the “Fishery-PV Integration” pond to reduce the risk of disease outbreaks. Water quality data indicate that levels of ammonia nitrogen, nitrite, and nitrate show consistent trends during the breeding period, with maximum values reached between 65 and 85 d, and may be related to increased food intake and excretion of shrimp in the later period of farming (Liu J. et al., 2017). Additionally, more nitrifying and denitrifying bacteria were identified in water and effluent, including Nisaea denitrificans (Urios et al., 2008), Halomonas (Wang and Shao, 2021), Nitrospira (Zhang C. et al., 2014), Dechloromonas denitrificans and Planctomyces (Feng et al., 2019), which all play a role in the nitrogen removal process. Therefore, the enrichment of nitrogen-removing bacteria may be one of the reasons for the rapid decline of the average contents of ammonia, nitrite, and nitrate in the later cultured period.
KEGG level 1 and level 2 annotation results showed that metabolism—particularly amino acid metabolism, carbohydrate metabolism, and energy metabolism—was dominant in the functional categories of microorganisms, followed by environmental and genetic information processing, consistent with many previous studies (Schweinitzer and Josenhans, 2010; LeBlanc et al., 2017). In the intestinal microflora, the abundance of functional pathways related to carbohydrate and energy metabolism was high. One probable reason is that P. monodon digest carbohydrates for energy through the intestinal microflora. In addition, amino acid metabolism pathways were more abundant in water and effluent samples than in intestines, probably because unutilised nutrients or feeds exist in water and effluent, providing a suitable living environment for a microbiota that can make use of amino acids. In-depth analysis based on KEGG level 3 classification reveals that ABC transporters (ko02010) were more abundant in water and effluent. It has been reported that ABC transporters are large membrane-bound proteins, and their functions have been identified to mediate the transport of various substrates, including amino acids, lipids, sugars, and proteins (Chen et al., 2001). Furthermore, previous studies have reported that ABC transporters play a vital role in a protection mechanism against environmental toxins in aquatic invertebrates (Zhou et al., 2009), suggesting that ABC transporters play an important role in biosynthesis and shrimp cell detoxification. Quorum sensing (QS, ko02024) was underrepresented in JI but overrepresented in JW and JT microbiotas. As a ubiquitous communication system among bacteria, QS mediates bacterial biofilm formation and regulates the secretion of virulence factors (Dickschat, 2010). In addition, QS is also an important mechanism for regulating microbial communities’ physiological and metabolic activities (He et al., 2020). The presence of QS may have significant implications for the health of the “Fishery-PV Integration” pond ecosystem. In conclusion, microorganisms in the “Fishery-PV Integration” culture mode not only promote intestinal digestion and absorption in shrimp, but also help to keep the water quality stable.
In recent years, environmental pollution caused by ARGs has become an increasing public health concern (Martínez et al., 2015). As a new aquaculture model, it is necessary to evaluate the security and ecological impact of the “Fishery-PV Integration” pond by analyzing its ARGs. In the current study, the relative abundance of total ARGs in the “Fishery-PV Integration” pond was about 0.49-4.27 × 10⁻⁴ ppm, which was lower than the relative abundance of ARGs in P. monodon biofloc culture (2.46-5.82×10⁻⁴ ppm) (Chen et al., 2022) and coastal industrial mariculture systems (0.27-4.55×10⁻⁴ ppm) (Wang et al., 2018). Furthermore, a total of 123 ARGs were identified in the “Fishery-PV Integration” ponds, significantly lower than the number found in biofloc culture ponds (483 ARGs) (Chen et al., 2022) and freshwater shrimp culture ponds (229 ARGs) (Zhao et al., 2018), indicating that “Fishery-PV Integration” culture ponds are less easily enriched by ARGs than are other aquaculture ponds and thus are safer in terms of public health. Recent studies have found that ARGs in aquaculture will eventually enter the human body after long-term enrichment along with the cycle of matter and food chain transmission, causing harm to human health (Wright et al., 2013; Dong et al., 2021). Therefore, with the increasing demand for food safety, the “Fishery-PV Integration” aquaculture mode will have broad development prospects.
Overall, this paper studied the ecological environment of aquaculture and the growth rate of shrimp under the “Fishery-PV Integration” for the first time. The results show that the microbiota under the “Fishery-PV Integration” not only ensures the healthy growth of shrimp by regulating the intestinal digestion and absorption of shrimp and preserving intestinal homeostasis but also regulates nitrogen transformation in the water body to ensure the stability of the water environment. Overall, this reduces the enrichment of ARGs in the shrimp to ensure food safety.
The datasets presented in this study can be found in the online repository. 16S rRNA gene sequencing and metagenomic sequencing datasets are available in the NCBI Sequence Read Archive (SRA, http://www.ncbi.nlm.nih.gov/Traces/sra) database with the accession numbers SRP363824 and SRP367116, respectively.
ML and CS contributed to the conception and design of the study. ML, XL, ZH, JZ, XC and DZ collected the samples and performed the experiments. ML wrote the first draft of the manuscript. XL helped to perform statistical analysis, conceptual analysis and manuscript revision. CS performed the writing review and editing and contributed to the project administration and funding acquisition. All authors contributed to manuscript revision and read and approved the submitted version.
This research was funded by the key research and development projects in Guangdong Province (Grant No.2020B0202010009), the 2019 Annual Guangdong Provincial Special Financial Fund (Grant No.231419025) Project, the project of the innovation team for the innovation and utilization of Economic Animal Germplasm in the South China Sea (Grant No.2021KCXTD026) and the Fangchenggang Science and Technology Plan Project (Grant No. AD19008017).
The authors declare that the research was conducted in the absence of any commercial or financial relationships that could be construed as a potential conflict of interest.
All claims expressed in this article are solely those of the authors and do not necessarily represent those of their affiliated organizations, or those of the publisher, the editors and the reviewers. Any product that may be evaluated in this article, or claim that may be made by its manufacturer, is not guaranteed or endorsed by the publisher.
Abriouel H., Omar N. B., Molinos A. C., López R., Ma J. G., Martínez-Viedma P., et al. (2008). Comparative analysis of genetic diversity and incidence of virulence factors and antibiotic resistance among enterococcal populations from raw fruit and vegetable foods, water and soil, and clinical samples. Int. J. Food Microbiol. 123, 38–49. doi: 10.1016/j.ijfoodmicro.2007.11.067
Blancheton J. P., Attramadal K. J. K., Michaud L., d’Orbcastel E. R., Vadstein O. (2013). Insight into bacterial population in aquaculture systems and its implication. Aquacult. Eng. 53, 30–39. doi: 10.1016/j.aquaeng.2012.11.009
Buchfink B., Xie C., Huson D. H. (2015). Fast and sensitive protein alignment using DIAMOND. Nat. Methods 12, 59–60. doi: 10.1038/nmeth.3176
Chen X., He Z., Zhao J., Liao M., Xue Y., Zhou J., et al. (2022). Metagenomic analysis of bacterial communities and antibiotic resistance genes in Penaeus monodon biofloc-based aquaculture environments. Front. Mar. Sci. 8. doi: 10.3389/fmars.2021.762345
Chen J., Sharma S., Quiocho F. A., Davidson A. L. (2001). Trapping the transition state of an ATP-binding cassette transporter: evidence for a concerted mechanism of maltose transport. Proc. Natl. Acad. Sci. 98, 1525–1530. doi: 10.1073/pnas.98.4.1525
Cornejo-Granados F., Lopez-Zavala A. A., Gallardo-Becerra L., Mendoza-Vargas A., Sánchez F., Vichido R., et al. (2017). Microbiome of pacific whiteleg shrimp reveals differential bacterial community composition between wild, aquacultured and AHPND/EMS outbreak conditions. Sci. Rep. 7, 1–15. doi: 10.1038/s41598-017-11805-w
Costa P. S., Reis M. P., Avila M. P., Leite L. R., de Araújo F. M., Salim A. C., et al. (2015). Metagenome of a microbial community inhabiting a metal-rich tropical stream sediment. PloS One 10, e0119465. doi: 10.1371/journal.pone.0119465
Dash P., Avunje S., Tandel R. S., KP S., Panigrahi A. (2017). BBiocontrol of luminous vibriosis in shrimp aquaculture: A review of current approaches and future perspectives. Rev. Fisheries Sci. Aquacult. 25, 245–255. doi: 10.1080/23308249.2016.1277973
Dickschat J. S. (2010). Quorum sensing and bacterial biofilms. Natural Product Rep. 27, 343–369. doi: 10.1039/b804469b
Dong H., Chen Y., Wang J., Zhang Y., Zhang P., Li X., et al. (2021). Interactions of microplastics and antibiotic resistance genes and their effects on the aquaculture environments. J. Hazard. Mater. 403, 123961. doi: 10.1016/j.jhazmat.2020.123961
Dong S.I., Dong Y. W., Cao L., Verreth J., Olsen Y., Liu W. J., et al. (2022). Optimization of aquaculture sustainability through ecological intensification in China. Rev. Aquacult. 14, 1249–1259. doi: 10.1111/raq.12648
Edgar R. C. (2013). UPARSE: highly accurate OTU sequences from microbial amplicon reads. Nat. Methods 10, 996–998. doi: 10.1038/nmeth.2604
Edgar R., Haas B. J., Clemente J. C., Quince C., Knight R. (2011). UCHIME improves sensitivity and speed of chimera detection. Bioinformatics 27, 2194–2200. doi: 10.1093/bioinformatics/btr381
Fändriks L. (2017). Roles of the gut in the metabolic syndrome: an overview. J. Internal Med. 281, 319–336. doi: 10.1111/joim.12584
Feng Q., Sun Y., Wu Y., Xue Z., Cao J. (2019). Physicochemical and biological effects on activated sludge performance and activity recovery of damaged sludge by exposure to CeO2 nanoparticles in sequencing batch reactors. Int. J. Environ. Res. Public Health 16, 4029. doi: 10.3390/ijerph16204029
Flieder M., Buongiorno J., Herbold C. W., Hausmann B., Rattei T., Lloyd K. G., et al. (2021). Novel taxa of acidobacteriota implicated in seafloor sulfur cycling. ISME J. 15, 3159–3180. doi: 10.1038/s41396-021-00992-0
Fu L., Niu B., Zhu Z., Wu S., Li W. (2012). CD-HIT: accelerated for clustering the next-generation sequencing data. Bioinformatics 28, 3150–3152. doi: 10.1093/bioinformatics/bts565
Giatsis C., Sipkema D., Smidt H., Heilig H., Benvenuti G., Verreth J., et al. (2015). The impact of rearing environment on the development of gut microbiota in tilapia larvae. Rep 5, 18206. doi: 10.1038/srep18206
He Z., Pan L., Zhang M., Zhang M., Huang F., Gao S. (2020). Metagenomic comparison of structure and function of microbial community between water, effluent and shrimp intestine of higher place Litopenaeus vannamei ponds. J. Appl. Microbiol. 129, 243–255. doi: 10.1111/jam.14610
Huang F., Pan L., Song M., Tian C., Gao S. (2018). Microbiota assemblages of water, sediment, and intestine and their associations with environmental factors and shrimp physiological health. Appl. Microbiol. Biotechnol. 102, 8585–8598. doi: 10.1007/s00253-018-9229-5
Jia B., Raphenya A. R., Alcock B., Waglechner N., Guo P., Tsang K. K., et al. (2016). CARD 2017: expansion and model-centric curation of the comprehensive antibiotic resistance database. Nucleic Acids Res. 45, D566-D573. doi: 10.1093/nar/gkw1004
Kanehisa M., Goto S., Sato Y., Kawashima M., Furumichi M., Tanabe M. (2014). Data, information, knowledge and principle: back to metabolism in KEGG. Nucleic Acids Res. 42, D199–D205. doi: 10.1093/nar/gkt1076
LeBlanc J. G., Chain F., Martín R., Bermúdez-Humarán L. G., Courau S., Langella P. (2017). Beneficial effects on host energy metabolism of short-chain fatty acids and vitamins produced by commensal and probiotic bacteria. Microb. Cell Factories 16, 1–10. doi: 10.1186/s12934-017-0691-z
Lei (2006). Environmental chemistry experiment in aquaculture water Vol. 5-6 (Beijing: China Agriculture Press), 56–70.
Li P., Gao X., Jiang J., Yang L., Li Y. (2020). Characteristic analysis of water quality variation and fish impact study of fish-lighting complementary photovoltaic power station. Energies 13, 4822. doi: 10.3390/en13184822
Li W., Godzik A. (2006). Cd-hit: a fast program for clustering and comparing large sets of protein or nucleotide sequences. Bioinformatics 22, 1658–1659. doi: 10.1093/bioinformatics/btl158
Li J., Jia H., Cai X., Zhong H., Feng Q., Sunagawa S., et al. (2014). An integrated catalog of reference genes in the human gut microbiome. Nat. Biotechnol. 32, 834–841. doi: 10.1038/nbt.2942
Li D., Liu C.-M., Luo R., Sadakane K., Lam T.-W. (2015). MEGAHIT: an ultra-fast single-node solution for large and complex metagenomics assembly via succinct de bruijn graph. Bioinformatics 31, 1674–1676. doi: 10.1093/bioinformatics/btv033
Lio-Po G. D., Leaño E. M., Usero R. C., Guanzon N. G. Jr. (2002). Vibrio harveyi and the'green water culture'of Penaeus monodon, disease control in fish and shrimp aquaculture in southeast Asia–diagnosis and husbandry techniques: Proceedings of the SEAFDEC-OIE seminar-workshop on disease control in fish and shrimp aquaculture in southeast Asia–diagnosis and husbandry techniques, 4-6 December 2001, iloilo city, Philippines. Aquacult. Department Southeast Asian Fisheries Dev. Center, 172–180.
Liu J., Fu X., Liu J. (2017). Variation of physical and chemical factors in ponds of shrimp Litopenaeus vannamei with different cultural patterns. J. Guangdong Ocean Univ. 37, 113–117.
Liu X., Steele J. C., Meng X. Z. (2017). Usage, residue, and human health risk of antibiotics in Chinese aquaculture: A review. Environ. pollut. 223, 161–169. doi: 10.1016/j.envpol.2017.01.003
Lucas R., Courties C., Herbland A., Goulletquer P., Marteau A. L., Lemonnier H. (2010). Eutrophication in a tropical pond: Understanding the bacterioplankton and phytoplankton dynamics during a vibriosis outbreak using flow cytometric analyses. Aquaculture 310, 112–121. doi: 10.1016/j.aquaculture.2010.10.022
Magoč T., Salzberg S. L. (2011). FLASH: fast length adjustment of short reads to improve genome assemblies. Bioinformatics 27, 2957–2963. doi: 10.1093/bioinformatics/btr507
Martínez J. L., Coque T. M., Baquero F. (2015). What is a resistance gene? ranking risk in resistomes. Nat. Rev. Microbiol. 13, 116–123. doi: 10.1038/nrmicro3399
Munaeni W., Widanarni, Yuhana M., Setiawati M., Wahyudi A. T. (2020). Impact of dietary supplementation with Eleutherine bulbosa (Mill.) urb. on intestinal microbiota diversity and growth of white shrimp, Litopenaeus vannamei - ScienceDirect. Aquaculture 528. doi: 10.1016/j.aquaculture.2020.735466
Nguyen T. V., Ryan L. W., Nocillado J., Groumellec M. L., Ventura T. (2020). Transcriptomic changes across vitellogenesis in the black tiger prawn (Penaeus monodon), neuropeptides and G protein-coupled receptors repertoire curation. Gen. Comp. Endocrinol. 298, 113585. doi: 10.1016/j.ygcen.2020.113585
Nielsen H. B., Almeida M., Juncker A. S., Rasmussen S., Li J., Sunagawa S., et al. (2014). Identification and assembly of genomes and genetic elements in complex metagenomic samples without using reference genomes. Nat. Biotechnol. 32, 822–828. doi: 10.1038/nbt.2939
Ondov B. D., Bergman N. H., Phillippy A. M. (2011). Interactive metagenomic visualization in a web browser. BMC Bioinf. 12, 1–10. doi: 10.1186/1471-2105-12-385
Orellana L. H., Francis T. B., FerrARGs M., Hehemann J.-H., Fuchs B. M., Amann R. I. (2021). Verrucomicrobiota are specialist consumers of sulfated methyl pentoses during diatom blooms. ISME J. 16, 1–12. doi: 10.1038/s41396-021-01105-7
Pringle A. M., Handler R., Pearce J. M. (2017). Aquavoltaics: Synergies for dual use of water area for solar photovoltaic electricity generation and aquaculture. Renewable Sustain. Energy Rev. 80, 572–584. doi: 10.1016/j.rser.2017.05.191
Pruden A., Pei R., Storteboom H., Carlson K. (2006). Antibiotic resistance genes as emerging contaminants: Studies in northern Colorado. Environ. Sci. Technol. 40, 7445. doi: 10.1021/es060413l
Quast C., Pruesse E., Yilmaz P., Gerken J., Schweer T., Yarza P., et al. (2012). The SILVA ribosomal RNA gene database project: improved data processing and web-based tools. Nucleic Acids Res. 41, D590–D596. doi: 10.1093/nar/gks1219
Rungrassamee W., Klanchui A., Maibunkaew S., KARGsonuthaisiri N. (2016). Bacterial dynamics in intestines of the black tiger shrimp and the pacific white shrimp during Vibrio harveyi exposure. J. Invertebrate Pathol. 133, 12–19. doi: 10.1016/j.jip.2015.11.004
Schweinitzer T., Josenhans C. (2010). Bacterial energy taxis: a global strategy? Arch. Microbiol. 192, 507–520. doi: 10.1007/s00203-010-0575-7
Segata N., Izard J., Waldron L., Gevers D., Miropolsky L., Garrett W. S., et al. (2011). Metagenomic biomarker discovery and explanation. Genome Biol. 12, 1–18. doi: 10.1186/gb-2011-12-6-r60
Urios L., Michotey V., Intertaglia L., Lesongeur F., Lebaron P. (2008). Nisaea denitrificans gen. nov., sp. nov. and nisaea nitritireducens sp. nov., two novel members of the class Alphaproteobacteria from the Mediterranean. Int. J. Systematic Evol. Microbiol. 58, 2336–2341. doi: 10.1099/ijs.0.64592-0
Wang J.-H., Lu J., Zhang Y.-X., Wu J., Luo Y., Liu H. (2018). Metagenomic analysis of antibiotic resistance genes in coastal industrial mariculture systems. Bioresource Technol. 253, 235–243. doi: 10.1016/j.biortech.2018.01.035
Wang L., Shao Z. (2021). Aerobic denitrification and heterotrophic sulfur oxidation in the genus Halomonas revealed by six novel species characterizations and genome-based analysis. Front. Microbiol. 12, 390. doi: 10.3389/fmicb.2021.652766
Wright S. L., Thompson R. C., Galloway T. S. (2013). The physical impacts of microplastics on marine organisms: a review. Environ. pollut. 178, 483–492. doi: 10.1016/j.envpol.2013.02.031
Zhang C., Liang Z., Hu Z. (2014). Bacterial response to a continuous long-term exposure of silver nanoparticles at sub-ppm silver concentrations in a membrane bioreactor activated sludge system. Water Res. 50, 350–358. doi: 10.1016/j.watres.2013.10.047
Zhang M., Pan L., Huang F., Gao S., Su C., Zhang M., et al. (2019). Metagenomic analysis of composition, function and cycling processes of microbial community in water, sediment and effluent of Litopenaeus vannamei farming environments under different culture modes. Aquaculture 506, 280–293. doi: 10.1016/j.aquaculture.2019.03.038
Zhang D., Wang X., Xiong J., Zhu J., Wang Y., Zhao Q., et al. (2014). Bacterioplankton assemblages as biological indicators of shrimp health status. Ecol. Indic. 38, 218–224. doi: 10.1016/j.ecolind.2013.11.002
Zhao Y., Zhang X.-X., Zhao Z., Duan C., Chen H., Wang M., et al. (2018). Metagenomic analysis revealed the prevalence of antibiotic resistance genes in the gut and living environment of freshwater shrimp. J. Hazard. Mater. 350, 10–18. doi: 10.1016/j.jhazmat.2018.02.004
Zhou J., He W. Y., Wang W. N., Yang C. W., Wang L., Xin Y., et al. (2009). Molecular cloning and characterization of an ATP-binding cassette (ABC) transmembrane transporter from the white shrimp Litopenaeus vannamei. Comp. Biochem. Physiol. Toxicol. Pharmacol. 150, 450–458. doi: 10.1016/j.cbpc.2009.06.012
Keywords: Fishery-PV Integration, microbial community, antibiotic resistance genes, Penaeus monodon, metagenomics, 16S rRNA gene sequencing
Citation: Liao M, Long X, He Z, Zhao J, Chen X, Zhu D and Sun C (2022) The effect of “Fishery-PV Integration” on Penaeus monodon culture and research on the micro-ecological environment. Front. Mar. Sci. 9:963331. doi: 10.3389/fmars.2022.963331
Received: 07 June 2022; Accepted: 07 September 2022;
Published: 27 September 2022.
Edited by:
Bin Xia, Qingdao Agricultural University, ChinaReviewed by:
Yunfei Sun, Shanghai Ocean University, ChinaCopyright © 2022 Liao, Long, He, Zhao, Chen, Zhu and Sun. This is an open-access article distributed under the terms of the Creative Commons Attribution License (CC BY). The use, distribution or reproduction in other forums is permitted, provided the original author(s) and the copyright owner(s) are credited and that the original publication in this journal is cited, in accordance with accepted academic practice. No use, distribution or reproduction is permitted which does not comply with these terms.
*Correspondence: Chengbo Sun, c3VuY2JAZ2RvdS5lZHUuY24=
†These authors have contributed equally to this work
Disclaimer: All claims expressed in this article are solely those of the authors and do not necessarily represent those of their affiliated organizations, or those of the publisher, the editors and the reviewers. Any product that may be evaluated in this article or claim that may be made by its manufacturer is not guaranteed or endorsed by the publisher.
Research integrity at Frontiers
Learn more about the work of our research integrity team to safeguard the quality of each article we publish.