 Liam D. H. Elbourne1,2,3†Brodie Sutcliffe1†William Humphreys4Amaranta Focardi5Mattia Saccò6Matthew A. Campbell6Ian T. Paulsen1,2,3*Sasha G. Tetu1,2,3*
- 1School of Natural Sciences, Macquarie University, Sydney, NSW, Australia
- 2Biomolecular Discovery Research Centre, Macquarie University, Sydney, NSW, Australia
- 3ARC Centre of Excellence in Synthetic Biology, Macquarie University, Sydney, NSW, Australia
- 4School of Biological Sciences, University of Western Australia, Perth, WA, Australia
- 5Climate Change Cluster, University of Technology Sydney, Sydney, NSW, Australia
- 6School of Molecular and Life Sciences, Curtin University, Perth, WA, Australia
Bundera sinkhole, located in north-western Australia, is the only known continental anchialine system in the Southern Hemisphere. Anchialine environments are characterised by stratified water columns with complex physicochemical profiles spanning hypoxic and anoxic regions, often displaying high levels of endemism. Research on these systems has focused on eukaryotic fauna, however interest in the microbial diversity of these environments is growing, enabled by next-generation DNA sequencing. Here we report detailed analyses of the microbial communities across a depth profile within Bundera sinkhole (from 2 to 28 m), involving parallel physicochemical measurements, cell population counts and 16S rRNA amplicon analyses. We observed clear shifts in microbial cell counts, community diversity, structure and membership across the depth profile, reflecting changing levels of light, organic and inorganic energy sources as well as shifts in pH and salinity. While Proteobacteria were the most abundant phylum found, there was a high degree of taxonomic novelty within these microbial communities, with 13,028 unique amplicon sequence variants (ASVs) identified, belonging to 67 identifiable bacterial and archaeal phyla. Of these ~4,600, more than one third of the total, were unclassified below family level. A small number of ASVs were highly abundant at select depths, all of which were part of the set not classified below family level. The 2 m and 6 m samples had in common two highly abundant ASVs, belonging to the Ectothiorhodospiraceae and Thiotrichaceae families, while the 8 m community contained a single predominant ASV belonging to family Thioglobaceae. At lower depths a different Ectothiorhodospiraceae ASV comprised up to 68% relative abundance, peaking at 26 and 28 m. Canonical correspondence analyses indicated that community structure was strongly influenced by differences in key physicochemical parameters, particularly salinity, dissolved organic and inorganic carbon, phosphate and sulphate concentrations. This work highlights the potential for anchialine systems to house considerable microbial novelty, potentially driven by adaptations to the specific physicochemical makeup of their local environment. As only a small number of anchialine systems have been examined via microbial community studies to date, this work is particularly valuable, contributing new insight regarding the microbial residents of these important and sensitive environments.
Introduction
Anchialine ecosystems, also known as subterranean estuaries, are sites in which freshwater and marine water meet in an enclosed, subterranean environment resulting in influences from both marine and terrestrial realms (Iliffe, 1992; Bishop et al., 2015). Such systems most commonly form in limestone regions, but are also observed in some volcanic terrains and can house a wide variety of organisms, many showing adaptations to cave life (Iliffe, 1992; Yager and Humphreys, 1996; García et al., 2009; Bishop et al., 2015). The environmental conditions of anchialine systems include stratified water columns with complex physicochemical profiles spanning hypoxic and anoxic regions (Bianchi et al., 2018). Microenvironments formed in these waters as a result of these clines may vary considerably in multiple physiological parameters, resulting in differing selection pressures and leading to distinct species mixtures, making these sites particularly interesting for species diversity studies [(Hoffman et al., 2017) and references therein]. These habitats are increasingly exposed to climate-change related threats (Iliffe, 2002), however comprehensive ecosystem risk assessment of the vast majority of natural [e.g., sea-level fluctuation, (Van Hengstum et al., 2019)] and human-induced [e.g., contamination, erosion, etc., (Martínez and Gonzalez, 2018)] impacts is still incomplete (Marrack et al., 2021).
While for many years anchialine research largely focused on eukaryotic fauna, interest in exploring the microbial diversity of these environments is growing [e.g., (Davis and Garey, 2018; Ruiz-González et al., 2021)]. This is in part due to past research showing these environments can harbour considerable microbial genetic novelty, along with recognition that food webs within these caves (including macroorganisms) may be supported, at least in part, by chemosynthetic microorganisms (Pohlman, 2011). Next generation sequencing platforms, such as Illumina MiSeq sequencing, have facilitated such investigations, enabling deep sequencing of these microbial communities to reveal the taxonomic diversity contained within these environments.
In-depth analyses of microbial communities using next-generation sequencing methods have been reported for anchialine water columns from the Eastern Adriatic Sea Islands in a recent study (Kajan et al., 2021) and before this for Sansha Yongle Blue Hole in the South China Sea (He et al., 2019), Indonesian anchialine lakes (Cleary and Polónia, 2017) and Yucatan Peninsula coastal aquifers (Brankovits et al., 2017). These locations whilst differing considerably in their physical structure, all show features typical of anchialine systems and contained diverse microbial populations. Kajan et al. (2021) compared microbial communities at three regions (fresh to brackish waters, within and below the halocline) in four independent anchialine systems within Kornati National Park (Adriatic Sea) showing these systems were reservoirs of biodiversity. They observed commonalities at higher levels of taxonomic designation, with Proteobacteria consistently the dominant phyla, but note that very few (2%) OTUs were shared between the sites in this study, speaking to the novelty of these environments, stratified not only vertically in the water column, but also between individual sinkholes. The Sansha Yongle Blue Hole, considered the world’s deepest anchialine cave, was sampled at depths down to 300 m, observing 3 main regions in terms of microbial cohorts; a surface photic region ranging down to 30 m, an intermediate layer extending from 30 m down to 90 m and a deep anoxic level. Proteobacteria were the dominant phyla at all depths, with intermediate levels also containing Actinobacteria, SAR406, Euryarcheota and Cyanobacteria, while the deep level contained Candidatus OP3 and Parcubacteria, Planctomycetes and uncultured phyla. Cleary and Polonia (2017), examining the microbial populations in four Indonesian anchialine lakes also report diverse suites of microbes in each sampled site, although this work compared lake water, sediment and the indigenous mussel-associated microbial communities rather than focusing on stratification of the water column. Here the population was again abundant in Proteobacteria, as well as hosting Archaea from the Crenarcheaota, Euryarcheota and Parvarcheaota phyla. The work by Brankovits et al. (2017) in the Yucatan Peninsula, utilised both 16S rRNA amplicon and shotgun metagenome sequencing, enabling efforts to associate specific taxa with certain biogeochemical cycling processes. This work showed that areas of the water column contained methanogens, nitrite oxidisers, methanogenic archaea and bacteria, as well as bacterial and archaeal ammonia oxidisers, with methane and soil-derived organic matter proposed to be significant energy inputs for these ecosystems.
Bundera sinkhole, situated on the Cape Range peninsula in north-western Australia, is the only known continental anchialine system in the Southern Hemisphere (Western Australian Department of Biodiversity, 2022). The only known entrance to the Sinkhole is approximately 10 x 20 m and is situated 1.7 km inland from the Indian Ocean (Yager and Humphreys, 1996). The cave system itself is thought to extend down ~70 m, although divers have explored just 33 m of this (Yager and Humphreys, 1996; Humphreys, 1999). Waters within this explored region appear to be brackish to marine (Humphreys, 1999; Seymour et al., 2007), with the upper layer the least saline, followed by a mixing zone at approximately 7-15 m, and more saline waters at greater depths (Humphreys, 1999; Seymour et al., 2007). Past sampling has shown dissolved oxygen declines to hypoxic conditions (<2 mg L-1) by 6 m (Yager and Humphreys, 1996; Humphreys, 1999). Subsurface peaks of dissolved oxygen have been seen to occur at ~10 and 20 m, although these peak concentrations typically remain below 2 mg L-1 (Yager and Humphreys, 1996; Humphreys, 1999; Seymour et al., 2007).
Exploration of microbial communities within Bundera sinkhole have been conducted previously based on a sampling event in 2005 (Seymour et al., 2007; Humphreys et al., 2012). Microbial assemblages within the sinkhole were examined first with flow cytometry (Seymour et al., 2007) and later with limited 454 sequencing of 16S ribosomal RNA (rRNA) gene amplicons from Whatman FTA card-preserved samples (Humphreys et al., 2012). These studies indicated that microbial communities were stratified throughout the depth profile and hinted at considerable phylogenetic novelty and varied chemolithotrophic metabolisms. Among the most abundant organisms were Gammaproteobacteria belonging to lineages predicted to be involved in sulphur-oxidation, with ammonia-oxidising Thaumarchaeota also observed at high levels, particularly further down the depth profile (Humphreys et al., 2012). Here we conducted deep 16S rRNA amplicon sampling across a depth profile within Bundera sinkhole to better understand community dynamics and composition across microenvironments within this system which differ in key physicochemical parameters. We hypothesised that there would be significant shifts in community composition throughout the depth profile, reflecting changing availability of light, organic and inorganic energy sources as well as shifts in pH and salinity. Given the small number of detailed microbial community studies on anchialine systems available at this time, and paucity of data for Southern Hemisphere ecosystems, this work significantly expands our knowledge of the microbial residents of these diverse and fascinating environments.
Methods
Site Description and Sampling
Bundera Sinkhole is located in a karstic environment 1.7 km inland from the Indian Ocean in north-western Australia (22° 23’ S, 113° 47’ E) (Figure 1). The water surface of the sinkhole is situated roughly 5 m below ground level, reducing exposure to the prevailing winds and limiting vertical mixing, likely contributing to the meromictic nature of the water column. The top section of the sinkhole (down to ~7-10 m) is composed of a 15 m wide basin that funnels into a narrow (1 to 5 m wide) cave, extending 70 m from its mouth to a depth of 33 m underground (Figure 1). The water column in Bundera Sinkhole is subject to the marine tidal cycle, the amplitude of which is dampened to ca. 16% of that at the coast (Humphreys et al., 1999). Water can be pumped from the main sinkhole at depths down to ~8 m, while four previously installed boreholes allow water samples to be pumped up from specific depths from 8 m and below, including from the cave sections of the sinkhole (Figure 1). Water samples were collected from depths of 2, 6, 8, 16, 17, 18, 22, 24, 26 and 28 m between the 29th of June and the 1st of July 2015 for physicochemical and microbial community analyses. Water sampling was carried out using a 12 V plastic submersible impellor pump (Monsoon High Performance, ECT Engineering Inc.). The pump-head was located at the required depth and flushed with two tubing-volumes of water. Following this, water from the set depth was pumped into the three buckets to fill and rinse each bucket with this water three times, once conditioning was complete each of the buckets was then filled with new water from this depth to enable sampling following methodology described below.
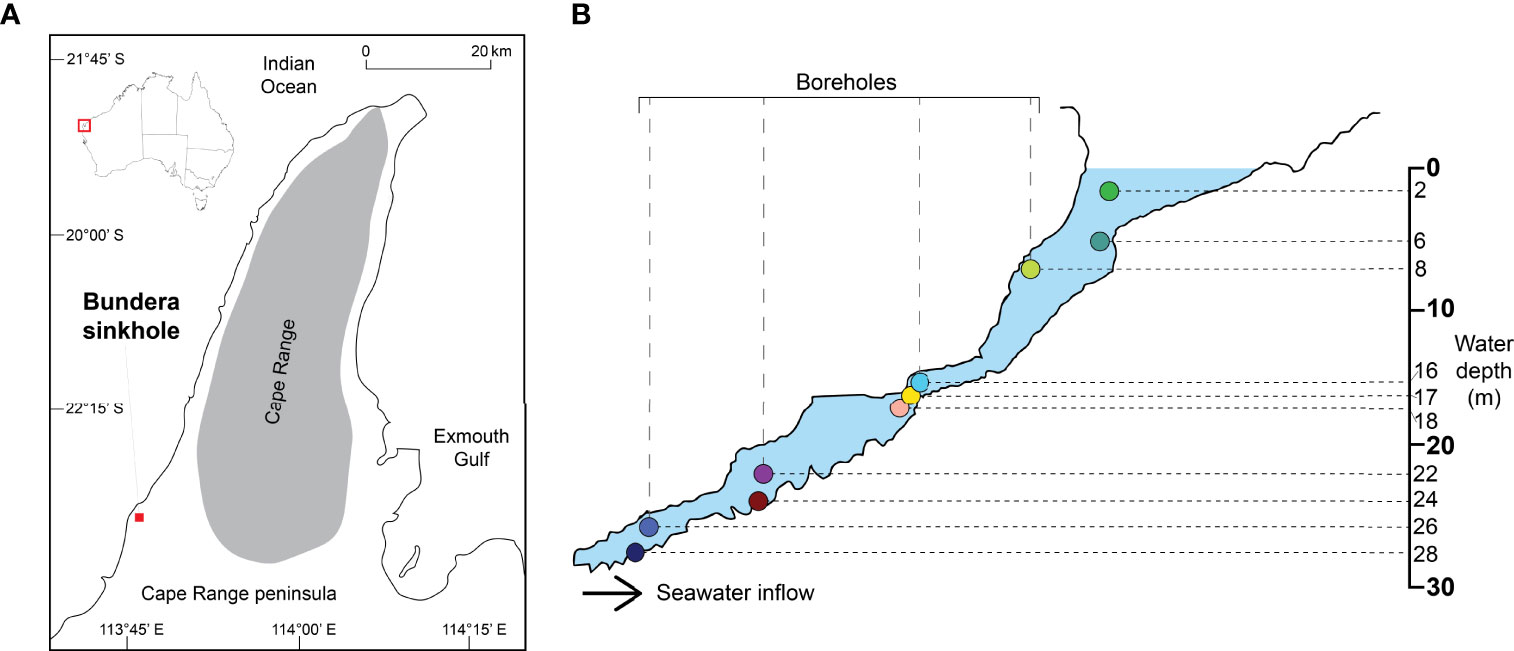
Figure 1 (A) Location of the Bundera sinkhole at the Cape Range peninsula in Western Australia, adapted from (Gadagkar et al., 2008). (B) Topology of the sinkhole and sample extraction sites for both the physicochemical data and microbial mass study, adapted from Humphreys, 1999. For each depth sampled the colour arbitrarily assigned here is consistently used for all figures.
Physicochemical Measurements
On the day prior to sample collection (28/06/15), a Quanta-G (Hydrolab Corporation) was used to measure temperature, salinity, pH, dissolved oxygen (DO) and oxidation reduction potential (redox, ORP) at intervals of 1 m for each of the boreholes described in Figure 1 (Supplementary Table 1), and this information was used to select the sampling depths for this study to span the physicochemical gradients within the sinkhole. For the main sampling effort ammonia (NH3) and hydrogen sulphide (H2S) were each determined immediately from 25 mL water samples using CHEMetrics test kits (CHEMets sulphide R-9510 and ammonia R-1402). For dissolved inorganic and organic carbon (DIC & DOC) analyses, 150 mL of water was collected from each sampled depth, filtered through a 0.45 μm cellulose acetate filter (Minisart) and frozen at -19°C. For methane (CH4) analysis, 40 ml glass VOA vial was filled with water samples ensuring there was no headspace, to prevent bubbling with air. Vials were stored upside down at ~4° C until analysis. Separate samples were also collected at each depth to measure electrical conductivity, additional nutrients (ammonia (NH3), nitrate , nitrite , phosphate and suphate as well as elements iron (Fe) and silicon (Si), with nutrient samples stored at -19°C prior to analyses and element analysis samples kept cool but not frozen. These samples were processed using standard methods at the Chemistry Centre analytical laboratories, Perth, Western Australia a National Association of Testing Authorities (NATA) accredited site (Date of Accreditation 01 Nov 1950, Accreditation No. 8 Site No. 1).
Microbial Community Sampling
For microbial community analysis ~4 L of water was pumped from each selected depth, pre-filtered using a 60 µm filter (Millipore Type NY60), then passed through triplicate 0.2 μm Sterivex filters, providing three biological replicates per depth, to collect microbial biomass for amplicon sequencing. After pumping the filters dry, 1.6 mL of RNAProtect (Qiagen) was added to each filter and the outlet/inlet ports sealed with Bluetac. Filters were then snap frozen and stored at -19°C prior to DNA extractions being performed. Flow cytometry samples were collected in duplicate for each depth by filtering 4.5 mL of bore water through a 60 µm filter (Millipore Type NY60), immediately adding 400 µL of paraformaldehyde and mixing well. These were then incubated in the dark for 15 min, snap frozen and stored at -19°C until analysis.
Flow Cytometry Analysis
Standard protocols were followed for staining, identifying, and quantifying heterotrophic bacteria populations (Marie et al., 1997) with minor modifications as described here. To enumerate heterotrophic bacteria, samples were thawed at 34°C and diluted 1 in 10 with Tris-EDTA buffer pre-filtered through a 0.2 µm filter. Samples were stained using SYBR green I (Invitrogen) after performing a 10-4 dilution of the supplied commercial product and then kept in the dark for 15 minutes prior to analysis. Samples were run on a BD-Influx (Becton Dickenson) equipped with a 50 mW blue laser (488 nm). At least two different populations of bacteria were identified based on different side scatter values and SYBR green intensities (Supplementary Figure 1).
DNA Extraction and Sequencing
Sterivex filters carrying microbial cells from each depth replicate were cut from their casing and DNA extractions carried out using the PowerWater DNA extraction kit (MoBio), according to the manufacturer’s instructions. For each depth replicate the 16S ribosomal RNA (rRNA) amplicons were generated by performing triplicate PCRs using the Earth Microbiome protocol and primers (515F: GTGCCAGCMGCCGCGGTAA, 806R: GGACTACHVGGGTWTCTAAT – 300 bp fragment of the V4 region) (Caporaso et al., 2012). Golay barcodes were present on reverse primers uniquely identifying each replicate for each depth, allowing for downstream sample pooling. Each reaction was performed in 20 µL volumes containing 200 nmol of each primer, 1× MyFi HS Mix (Bioline) and 3-5 µL template DNA. PCR cycling conditions used a hot-start of 95°C for 3 min, 35 cycles of 95°C for 15 sec, 50°C for 15 sec and 72°C for 60 sec, followed by a final extension of 72°C for 3 min. For each depth the triplicate PCRs were pooled, then quantified using the Quant-iT PicoGreen dsDNA Assay Kit (Life Technologies). Following quantification, all replicates for all depth samples were pooled at equimolar amounts, before being run on an agarose gel. The DNA band corresponding with the expected size range for the 16S rRNA amplicons was excised, and the DNA extracted using the QIAEX II extraction kit (Qiagen). This 16S rRNA library was sequenced on the MiSeq Illumina platform using the MiSeq reagent v2 2 x 250 bp PE read kit at the Ramaciotti Centre for Genomics, Sydney, Australia.
Sequence Analysis
Sequence preprocessing was conducted with QIIME2 version 2020.02 (Bolyen et al., 2019), which was used in a Ubuntu Linux environment for initial read sequence file importation, demultiplexing, denoising, clustering, and taxonomic assignation as follows. The QIIME2 utility DEMUX was utilise to demultiplex and denoise the imported read set, the DADA2 2020.8.0 (Callahan et al., 2016) utility was used to identify all amplicon sequence variants (ASVs) within the dataset. The Silva 16S sequence database https://www.arb-silva.de, version 132, 99% OTUs) (Quast et al., 2012) was used to train a native Bayes classifier via the QIIME2 utility FEATURE-CLASSIFIER with the fit-classifier-native-bayes option. This classifier/model was subsequently utilised to taxonomically assign all the reads sequenced with FEATURE-CLASSIFIER utilising the classify-sklearn option, reads that matched plastids (chloroplast and mitochondria) were filtered. QIIME2’s EXPORT function was utilised to export the feature table, taxonomy assignations and rooted phylogenetic tree (inferred by the QIIME2 PHYLOGENY align-to-tree-mafft-fasttree option), all QIIME2’s internal read names were converted to names with the format “ASV_nnnnnnn” where n is a seven digit number uniquely identifying the sequence (QIIME2 FEATURE-TABLE rename-ids option). To facilitate clarity in text and figures, the underscore and leading zeros were subsequently trimmed for presentation purposes. A biom format file from the exported data was created using the Python BIOM utility 2.0 (Mcdonald et al., 2012).
Subsequent processing, analysis and plotting was performed using the r packages Phyloseq 1.36.0 (Watson et al., 2013), Vegan 2.5.7 (Oksanen et al., 2020) and the Heatplus package utility ANNHEATMAP2 3.0.0 (Ploner, 2021) in a Darwin Unix environment. The biom file created above, along with the taxonomy, phylogeny and metadata files were imported into r scripts and used to instantiate a phyloseq object. Within the phyloseq object taxa that comprised less than 5 counts in fewer than half of the samples were removed using the SUBSET function, and reads were transformed to even coverage as per McHardy and Holmes (Mchardy et al., 2014). Ordination and plotting of alpha (Shannon, Simpson and Chao1) and beta (PCoA) diversity were conducted with phyloseq functions ORDINATE and plot_ORDINATION. To generate functional profiles, 16S rRNA amplicon data was processed through the Tax4Fun2 pipeline using the default settings (Wemheuer et al., 2020). These profiles were clustered into Kyoto Encyclopedia of Genes and Genomes (KEGG) Orthologs (KOs) (Kanehisa et al., 2007) for downstream analysis. Analysis focussed on the subset of pathways that are found within the ‘microbial metabolism in diverse environments’ KEGG pathway set (MAP01120).
Constrained canonical analysis (CCA) was performed with phyloseq ordination and plotting functions, with environmental variables calculated and analysed using CCA ordination with the vegan function ENVFIT. A heatmap of the most abundant species was constructed utilising ANNHEATMAP2. Stacked bar plots were generated from the data in the phyloseq object utilising GGPLOT2 (Wickham, 2016).
Statistical Tests
For all statistical tests involving multiple sample comparisons the Bonferroni multiple-comparison correction was applied and all p-values presented represent the adjusted p-values following this correction. Student’s t-test was used to determine if flow cytometry cell counts differed significantly for sampled depths. Alpha diversity was explored using Shannon, Simpson and Chao metrics within the r phyloseq package with Student’s t-test subsequently conducted to determine where differences in alpha diversity between depths were significant. An ANOVA supporting intergroup distinction for the alpha diversity plotting was also conducted and overlaid on the plotted alpha diversity data by GGPUBR 0.4.0 (Kassambara, 2020).
In investigating microbial community composition across the sampled depths, permutational multivariate analysis of variance (PERMANOVA) was conducted to explore separation of groups observed in PCoA ordination using the vegan utility ADONIS as implemented in PAIRWISE.ADONIS 2 0.4 (Martinez Arbizu, 2020). Adonis2 was also used to determine the significance of the physicochemical measurements in relation to the community structure overall. Support for the significance of physicochemical parameters/data, and selection of the most significant combination or model was generated with the vegan utility BIOENV, PERMANOVA was used to establish the significance of the physicochemical parameters in relation to community structure, and the CCA was tested with ANOVA.
Sequence Accession Numbers
The bacterial microbiome sequence data generated in this study are deposited in the European Nucleotide Archive under the BioProject number PRJEB50681.
Results
Physicochemical Analyses
Physiochemical measurements were taken across a depth profile within Bundera sinkhole to explore the abiotic characteristics of this environment and select depths appropriate for sampling microbial communities. All sampling depths were between 18 and 33 practical salinity scale (pss), classifying them as brackish waters (Supplementary Table 1). As expected, however, the shallower depths (2 and 8 m) had the lowest pss values (average 18.8 pss), depths 17-28 m were relatively stable (average 31.9 pss), while the 8 m depth had an intermediate salinity value of 25.5 pss. Temperatures were ~22°C at 2 and 6 m, with 8 m noticeably warmer (25.6°C) and then maintaining a relatively stable 26.4 – 26.6°C at depths below this. Dissolved oxygen (DO) concentrations showed a polyphasic profile with depth, although all but the shallowest sampling depth (2 m) would be classified as hypoxic (< 2 mg L-1) (Supplementary Table 1). Values for DO ranged from 2.75 mg L-1 at 2 m to 0.14 mg L-1 at 26 m, however, there was a small peak at 18 and 22 m, with DO measurements of 0.46 and 0.47 mg L-1, respectively. Based on these measurements, sampling for in-depth biological and physicochemical analyses was conducted the following day at depths of 2, 6, 8, 16, 17, 18, 22, 24, 26, 28 m (Supplementary Table 2).
The subsequent in-depth physicochemical analyses performed on samples taken in parallel with those for microbial analyses supported the preliminary testing, showing a water column varying considerably for most parameters across the depth profile, including concentrations of key nutrients that are likely to be linked to differences in microbial community structure (Figure 2). DOC was present at measurable levels at three sampling depths, with concentrations of 1.1 mg L-1 in the two shallowest depths (2 and 6 m) and 1 mg L-1 at the deepest depth sampled (28 m) (Figure 2). DIC concentrations were highest in the 2 and 6 m depths at ~62.5 mg L-1, before declining to 49 mg L-1 in the 8 m and stabilising with an average of 31.5 mg L-1 in the depths at 16-28 m. Hydrogen sulphide concentrations showed a clear peak at 16 m (0.25 ppm), and a smaller peak at 24 m. Iron concentrations also peaked at 16 m, but were slightly higher at the lower depths than they were at 2 m. Ammonia measurements varied somewhat between the Chemet tests and subsequent lab testing, but in both peaked at 16 m. Nitrate had a maximum of 60 µg L-1 at 24 m, and slightly smaller peaks of 50 µg L-1 at 8 and 18 m depths. In contrast, sulphate concentrations were relatively high throughout the water column, ranging from 1.4 g L-1 at 2 m and 2.6 g L-1 at 22 m (Figure 2). Phosphate concentrations showed a bimodal distribution, with peaks of 20 µg L-1 at 16 m and 26-8 m. Silicon concentrations peaked at 8 m with a concentration of 4.5 mg L-1. Methane was only detected at 16 m, with a concentration of 0.02 mg L-1.
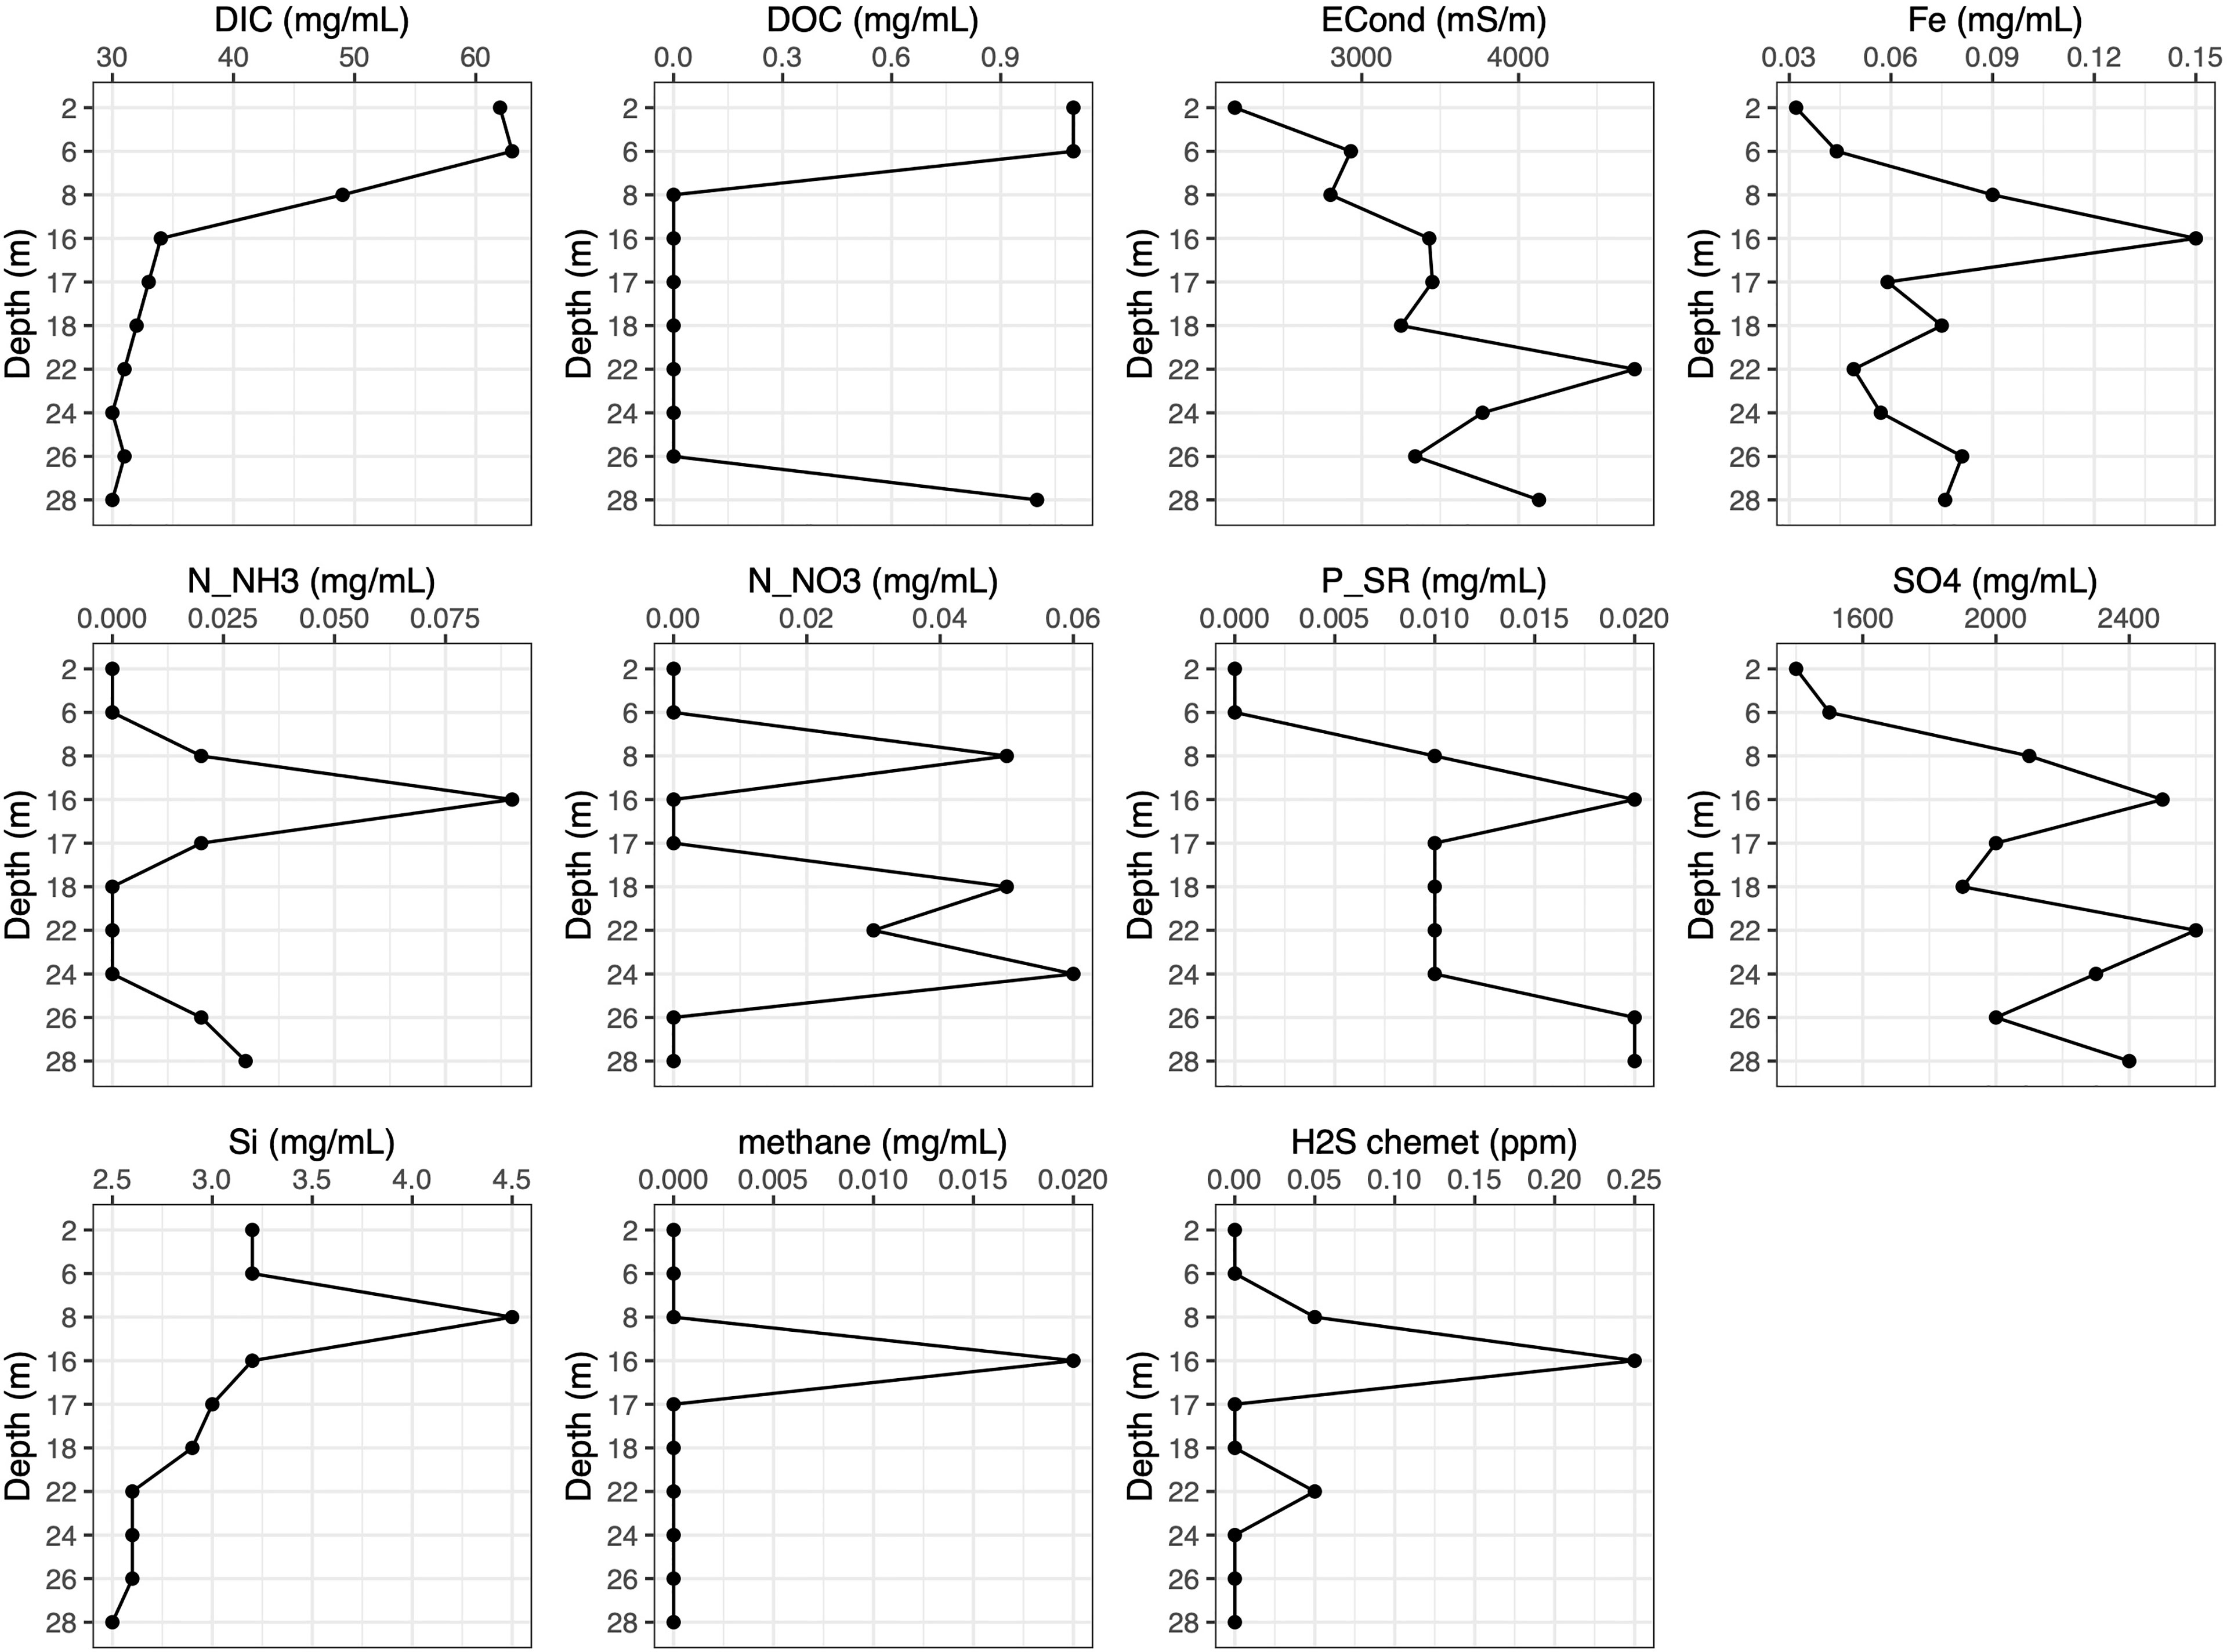
Figure 2 Physicochemical data plots for samples taken in parallel to microbial sample collection. DIC, dissolved inorganic carbon; DOC, dissolved organic carbon; ECond, Electrical conductivity; Fe, total iron; N_NH3 – NH3, nitrogen available as ammonia; N_NO3 – , nitrogen available as nitrate; P_SR, phosphate soluble reactive; SO4, SO4, sulphate; Si, silicon; methane, CH4, H2S – H2S, hydrogen sulphide.
Microbial Cell Densities From Flow Cytometry
The microbial cell density in the sinkhole samples was determined by flow cytometry. Cell counts were highest in the shallowest sampling depths, with >2.5 million cells mL-1 at 2 and 6 m (Supplementary Figure 1A). For all other sampling depths (≤8 m), cell abundances were <0.8 million cells mL-1 (Supplementary Figure 1A). Despite this, marked variation occurred at these deeper depths, with two abundance peaks occurring at 16 and 17 m (average, 0.7 million cells mL-1), and 26 m (0.5 million cells mL-1). However, a Student’s t-test indicated that only 2 and 6m were significantly different from the other depths in regards to cell counts, whilst not significantly different from each other (Supplementary Table 3).
Microbial Diversity and Community Structure
Prokaryotic diversity was examined via 16S rRNA amplicon sequencing for ten depths within the sinkhole. From a total of 23,406,366 sequence reads, 11,703,183 merged high-quality reads were recovered, with an average of 390,106 ± 84,182 reads for each individual sample. A total of 13,028 unique amplicon sequence variants (ASVs) were detected overall, with an average of 1,019 ± 441 reads per sample.
The microbial community diversity (Simpson and Shannon) and richness (Chao1) was determined for each depth (Figure 3). Shannon diversity values ranged between 3-4 for all samples except for 26 m and 28 m, which were significantly lower (p < 0.05) at around 2. There was a trend towards increasing Shannon and Simpson diversity as depth increased from 2 m through to 24 m, then a decline in community diversity at both 26 and 28 m (Supplementary Table 4A). Microbial community richness was also highest for 24 m (Figure 3) with an average Shannon diversity at this depth of 4.1, and average Simpson value of 0.93 (maximum value for the Simpson index is 1). Pairwise statistical analyses (Student’s t-test) across all depths are provided in Supplementary Tables 4B–D for all diversity measures.
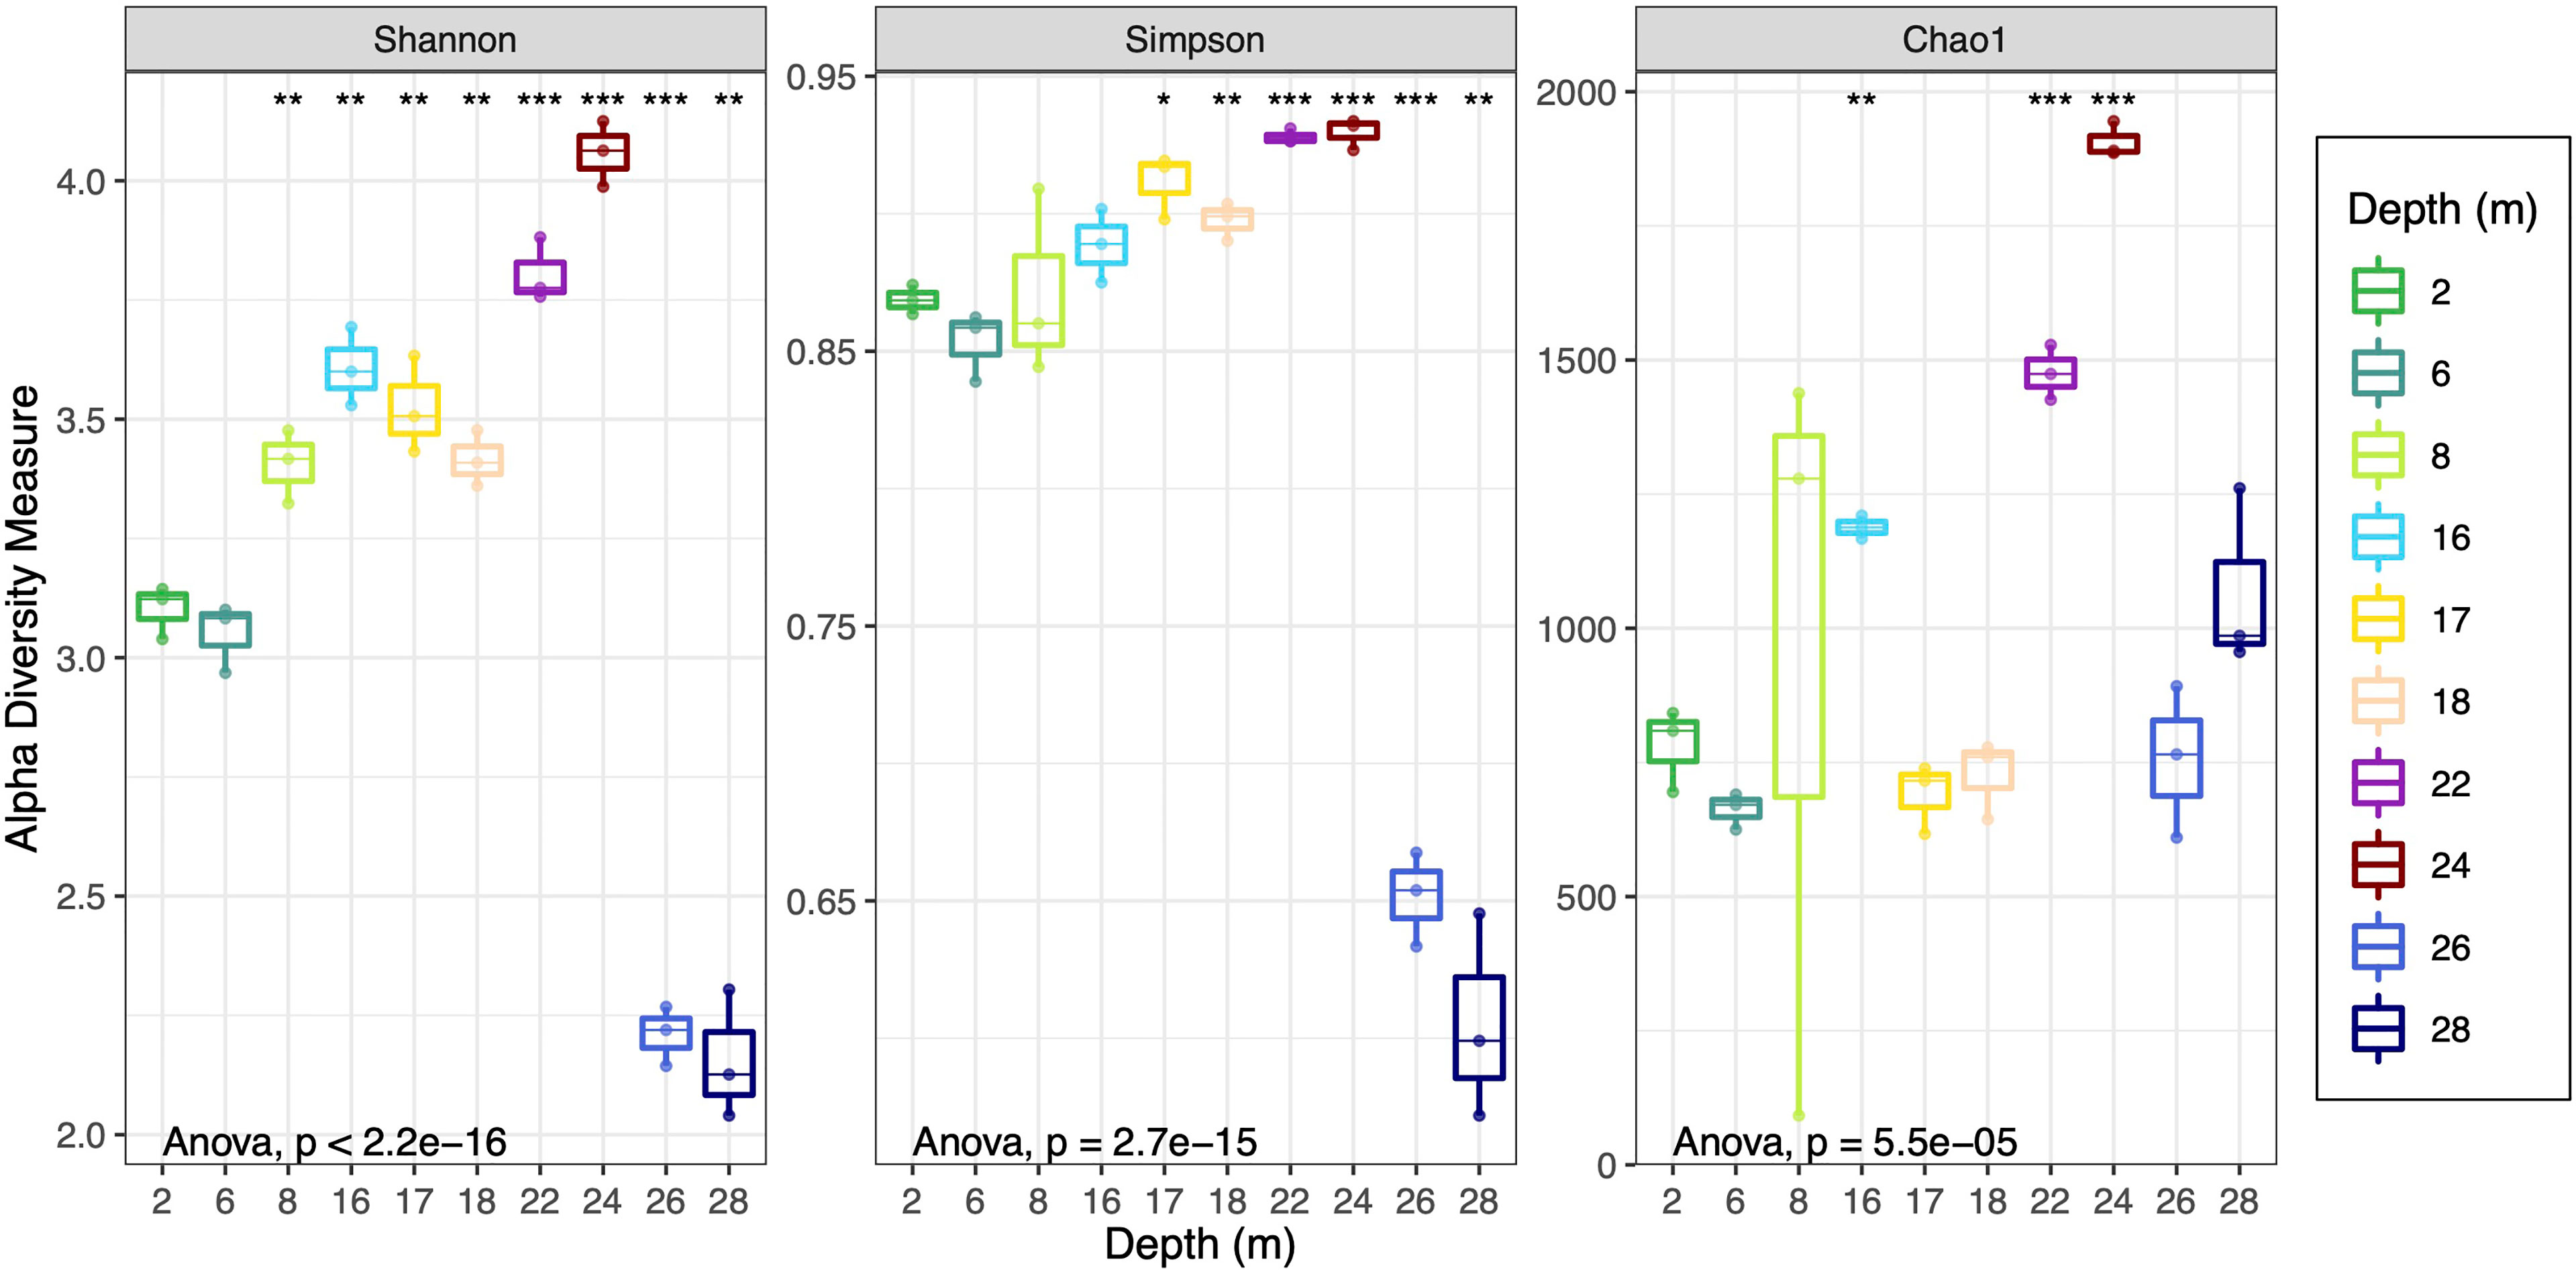
Figure 3 Shannon, Simpson and Chao1 alpha diversity metrics for all depths as box-and-whisker plots. Replicates are represented by dots on the box plots. Each box represents interquartile range; the line inside the box is the median. The results of an ANOVA to indicate the level of support for intergroup difference overall are shown in the bottom of each panel. Pairwise comparisons using Student’s t-test were also conducted and asterisks at the top of each panel represent significance of the difference between the 2 m samples and the sample the asterisk is above, where “*”, “**” and “***”, respectively represent p-values than less or equal to 0.05, 0.01 and 0.001 and no asterisk indicates p-values were above 0.05. Supplementary Tables 4B–D contain all the pairwise test p-values.
Microbial community composition across the sampled depths was investigated with Principal Coordinate analyses (PCoA). The first axis contained 62.9% of the variation, while the second axis explained 18.4% of the variation (Figure 4). Samples from 2 m and 6 m clustered tightly together and were clearly distinct from other depths along axis 1. The 8 m samples were well separated from all other depths by the second axis, while the remaining depths showed some degree of clustering, with 16 m and 17 m located in close proximity to each other, 18 m, 22 m and 24 m representing a third cluster and 26 m and 28 m a fourth, separate cluster. These clusters were supported by PERMANOVA analyses with the exception of the 8 m sample, which was not statistically significantly different from 26 m and 28 m (Supplementary Table 4).
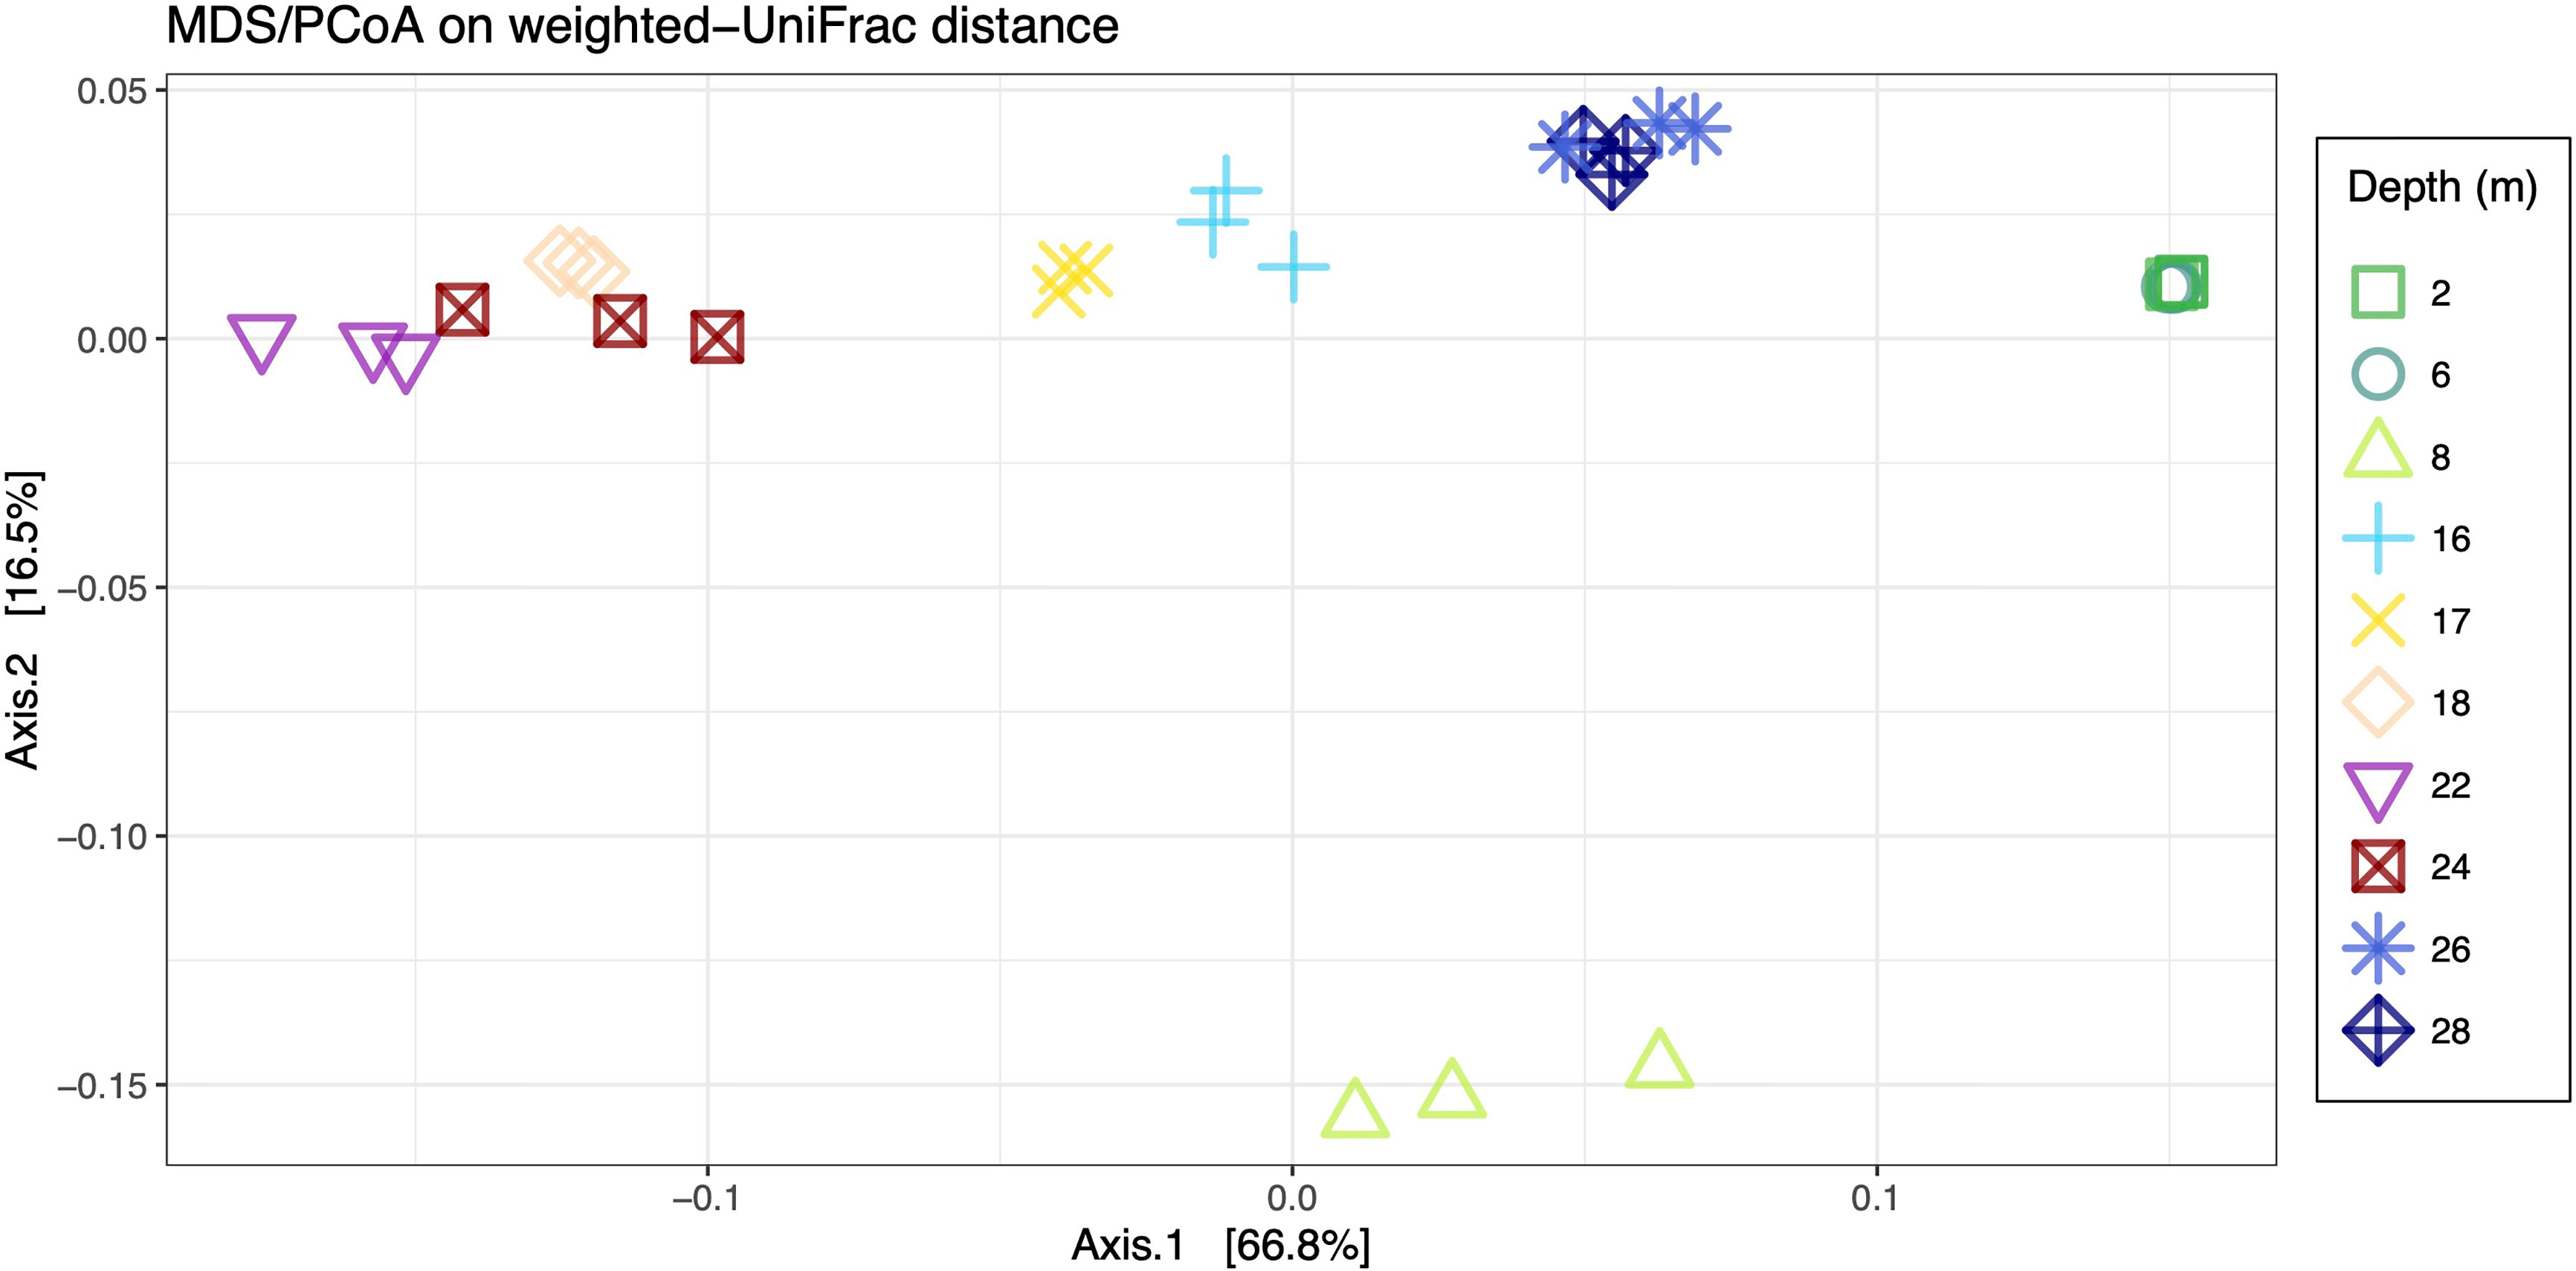
Figure 4 Two dimensional plot of PCoA analysis showing the first two axes which captured approximately 80% of the total variance. Inter-sample distances were calculated on weighted-Unifrac distance.
Microbial Taxonomic Composition
Recovered ASVs across all depths were found to represent a total of 67 identifiable phyla, of which 58 were bacteria and 9 were archaea. Archaeal phyla were observed to contribute less than 0.5% relative abundance at depths 2 m and 6 m, but contributed between ~3-30% in all other depths, and were highest in the 18-24 m samples (Figure 5A and Supplementary Table 6A). In all samples, the dominant phylum was Proteobacteria, constituting 32-84%, with Gammaproteobacteria being the predominant class, followed by Deltaprotobacteria and Alphaproteobacteria (Figure 5B and Supplementary Table 6B). Other Proteobacteria were observed at lower abundances including Magnetococcia, observed at 16 m and below and Zetaproteobacteria which were restricted to 16-24 m. For depths 16-28 m, Marinimicrobia (formerly the SAR406 clade) made up a sizable component of the communities, with highest relative abundances of ~25% in depths 22 and 24 m. Archaeal phyla Nanoarchaeaeota and Thaumarchaeota were observed to contribute substantially to community relative abundance in depths 8 m and below. Other phyla showed higher relative abundance in the samples closer to the surface, most notably Bacteroidetes, which constituted ~13-15% relative abundance at 2 m and 6 m, declining in relative abundance at lower depths. The Epsilonbacteraeota showed a peak in relative abundance at the 8 m depth, where they constituted ~11%, while relative abundances were ~2% or less at other depths. A large number of additional phyla, including Nitrospirae and Nitrospina also showed variable distribution patterns across the depth profile (Figure 5B).
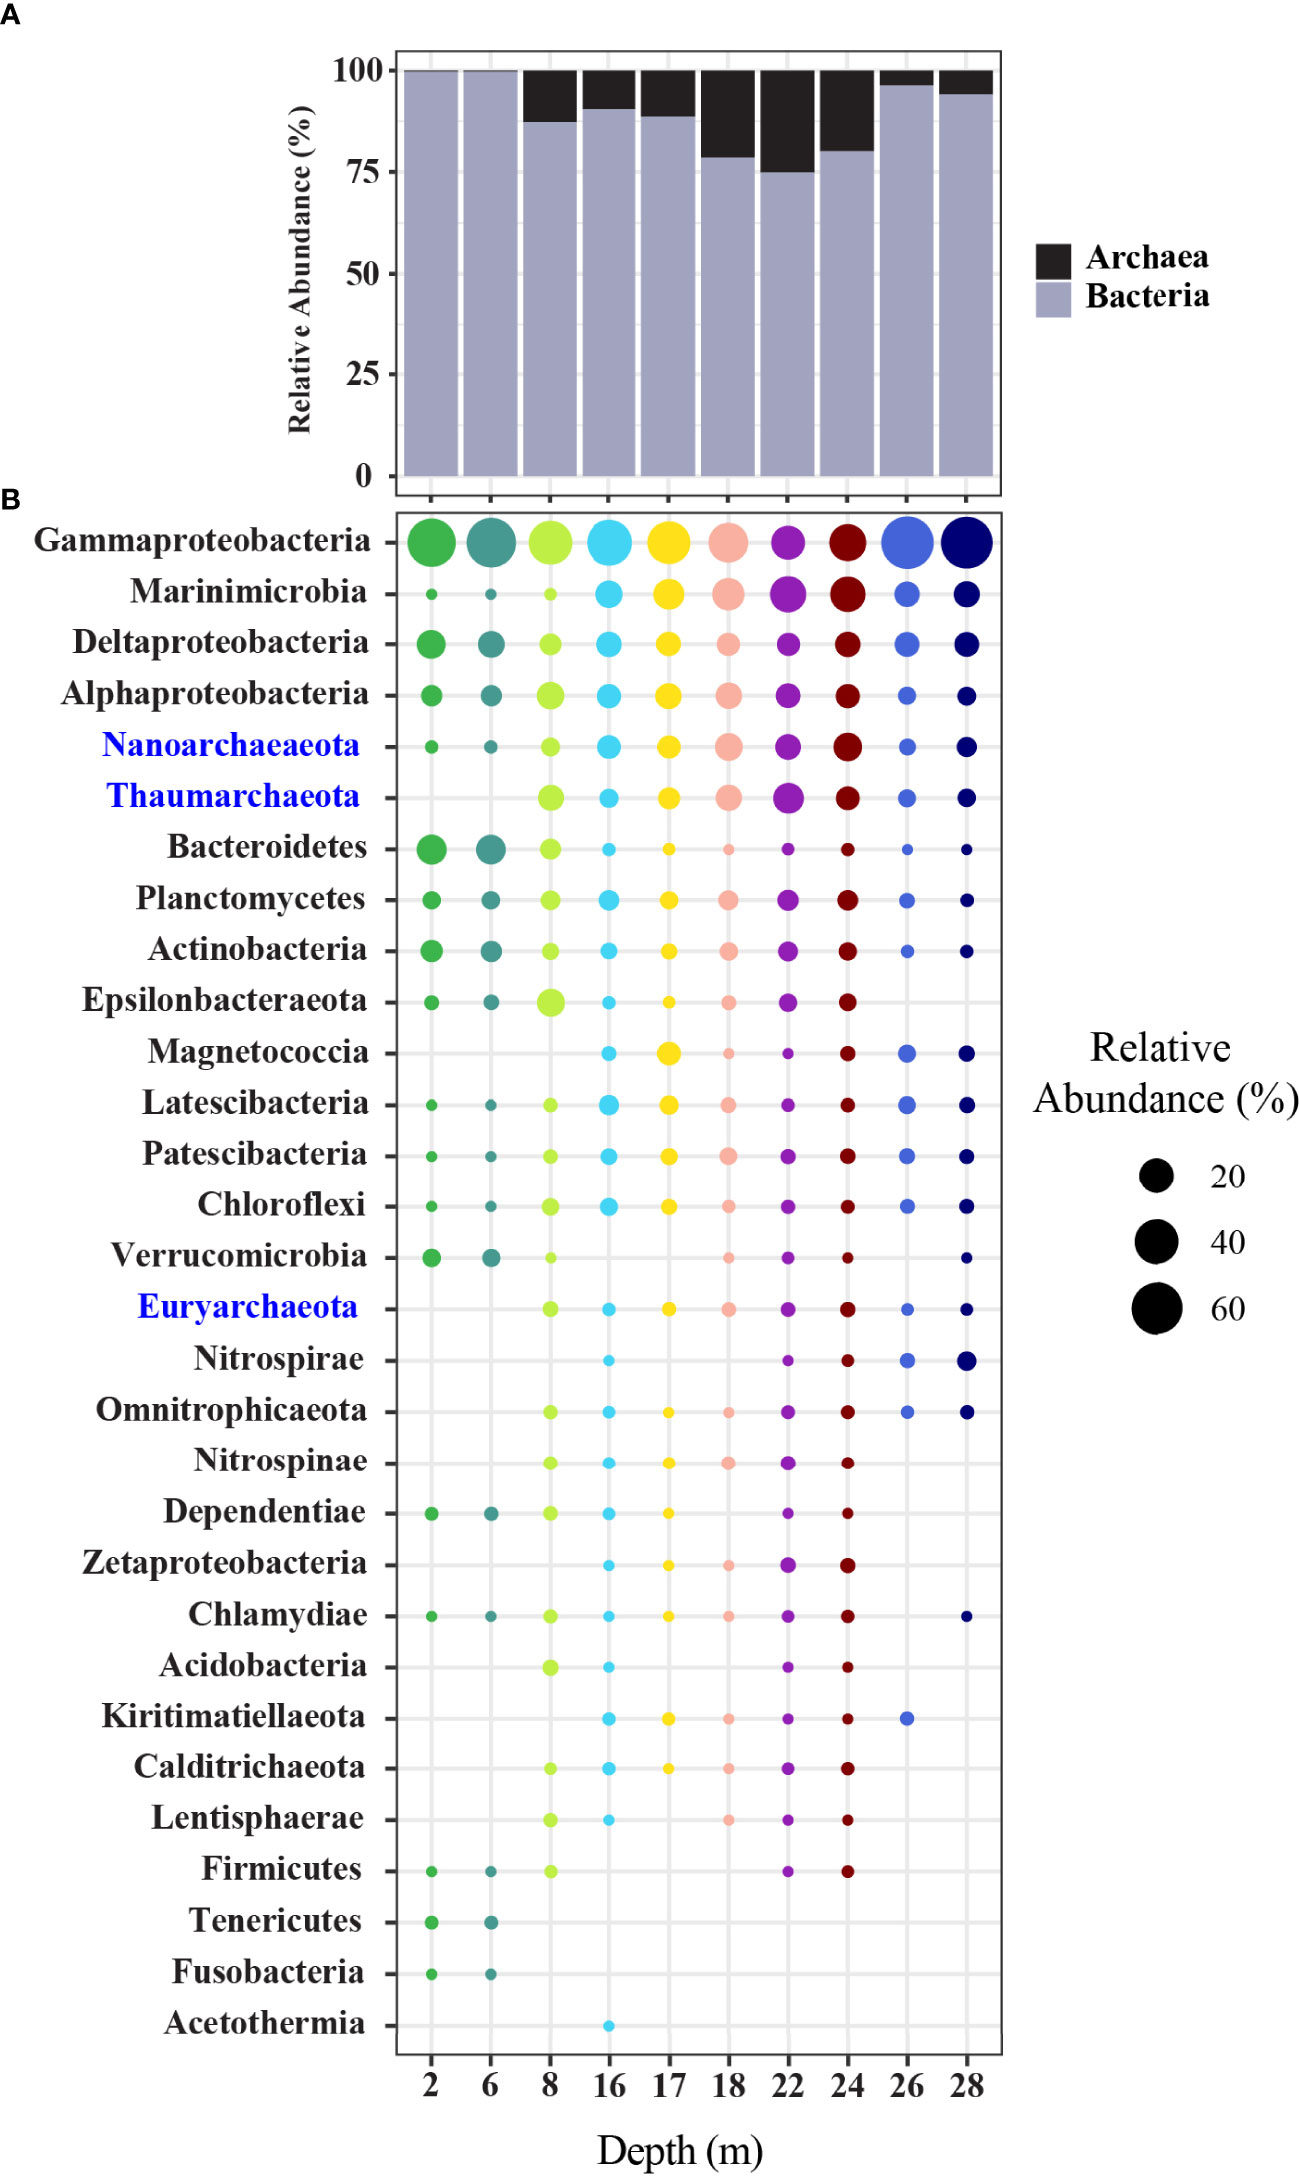
Figure 5 (A) Bar chart displaying the summed composition and relative abundance of Archaea and Bacteria. (B) Dot plot displaying the composition and abundance of the top 30 most abundant phyla (Proteobacteria shown at class level). Archaeal phyla names are shown in blue.
The ASVs recovered were assigned to a total of 1,143 families, however only 21 families contributed to >1% relative abundance in at least one sample (Supplementary Figure 2 and Table 6C). Members of the proteobacterial family Ectothiorhodospiraceae (purple sulphur bacteria), were observed across all depths but their percentage contribution to relative abundance varied considerably. They were most abundant in the intermediate depths, contributing ~45% relative abundance in 16 m and were also important at 2 m and 6 m, contributing ~27% relative abundance, but made up only ~4% relative abundance in the 8 m sample. Representatives of a family of uncultured Deferribacteres (phylum Marinimicrobia) were important members of the community at 16 m and below, contributing ~8-22% relative abundance in these depths, but less than 0.1% in the higher depths. The archaeal Nitrosopumilaceae family were observed in depths of 8 m and below (highest at 22 m at 15% relative abundance). Three families of Nanoarchaeaeota, all unnamed at family level but belonging to class Woesearchaeia, showed a similar depth distribution to the Nitrosopumilaceae. At 2 m and 6 m depths, the Thiotrichaceae family contributed ~22-25% relative abundance, but was observed at levels of < 0.2% in the lower depths.
To explore community membership at the ASV level, a heatmap was generated based on the relative abundance of the most predominant ASVs, showing that there is clear clustering of samples at specific depths, based on their ASV profiles (Figure 6, Supplementary Table 6D). The top two depths 2 m and 6 m had in common two highly abundant ASVs, ASV4, belonging to the Ectothiorhodospiraceae, and ASV5, belonging to the Thiotrichaceae (~27% and 23% relative abundance across both depths, for these respective ASVs). In the 8 m community a single ASV, ASV6 belonging to family Thioglobaceae, was observed to be predominant, comprising ~34% relative abundance, while being observed to make up less than 1% relative abundance of the communities at other depths. At lower depths the ASV which contributed the highest overall percent relative abundance was ASV1, belonging to the Ectothiorhodospiraceae, comprising between 17-68% of the communities between 16 m and 28 m, with relative abundance highest at 26 and 28 m. ASV2, a member of Marinimicrobia, which is unclassified at lower taxonomic levels, was also abundant between 16-28 m (7-19%), but peaked in relative abundance in 22 and 24 m and dropping down in the two lowest depths.
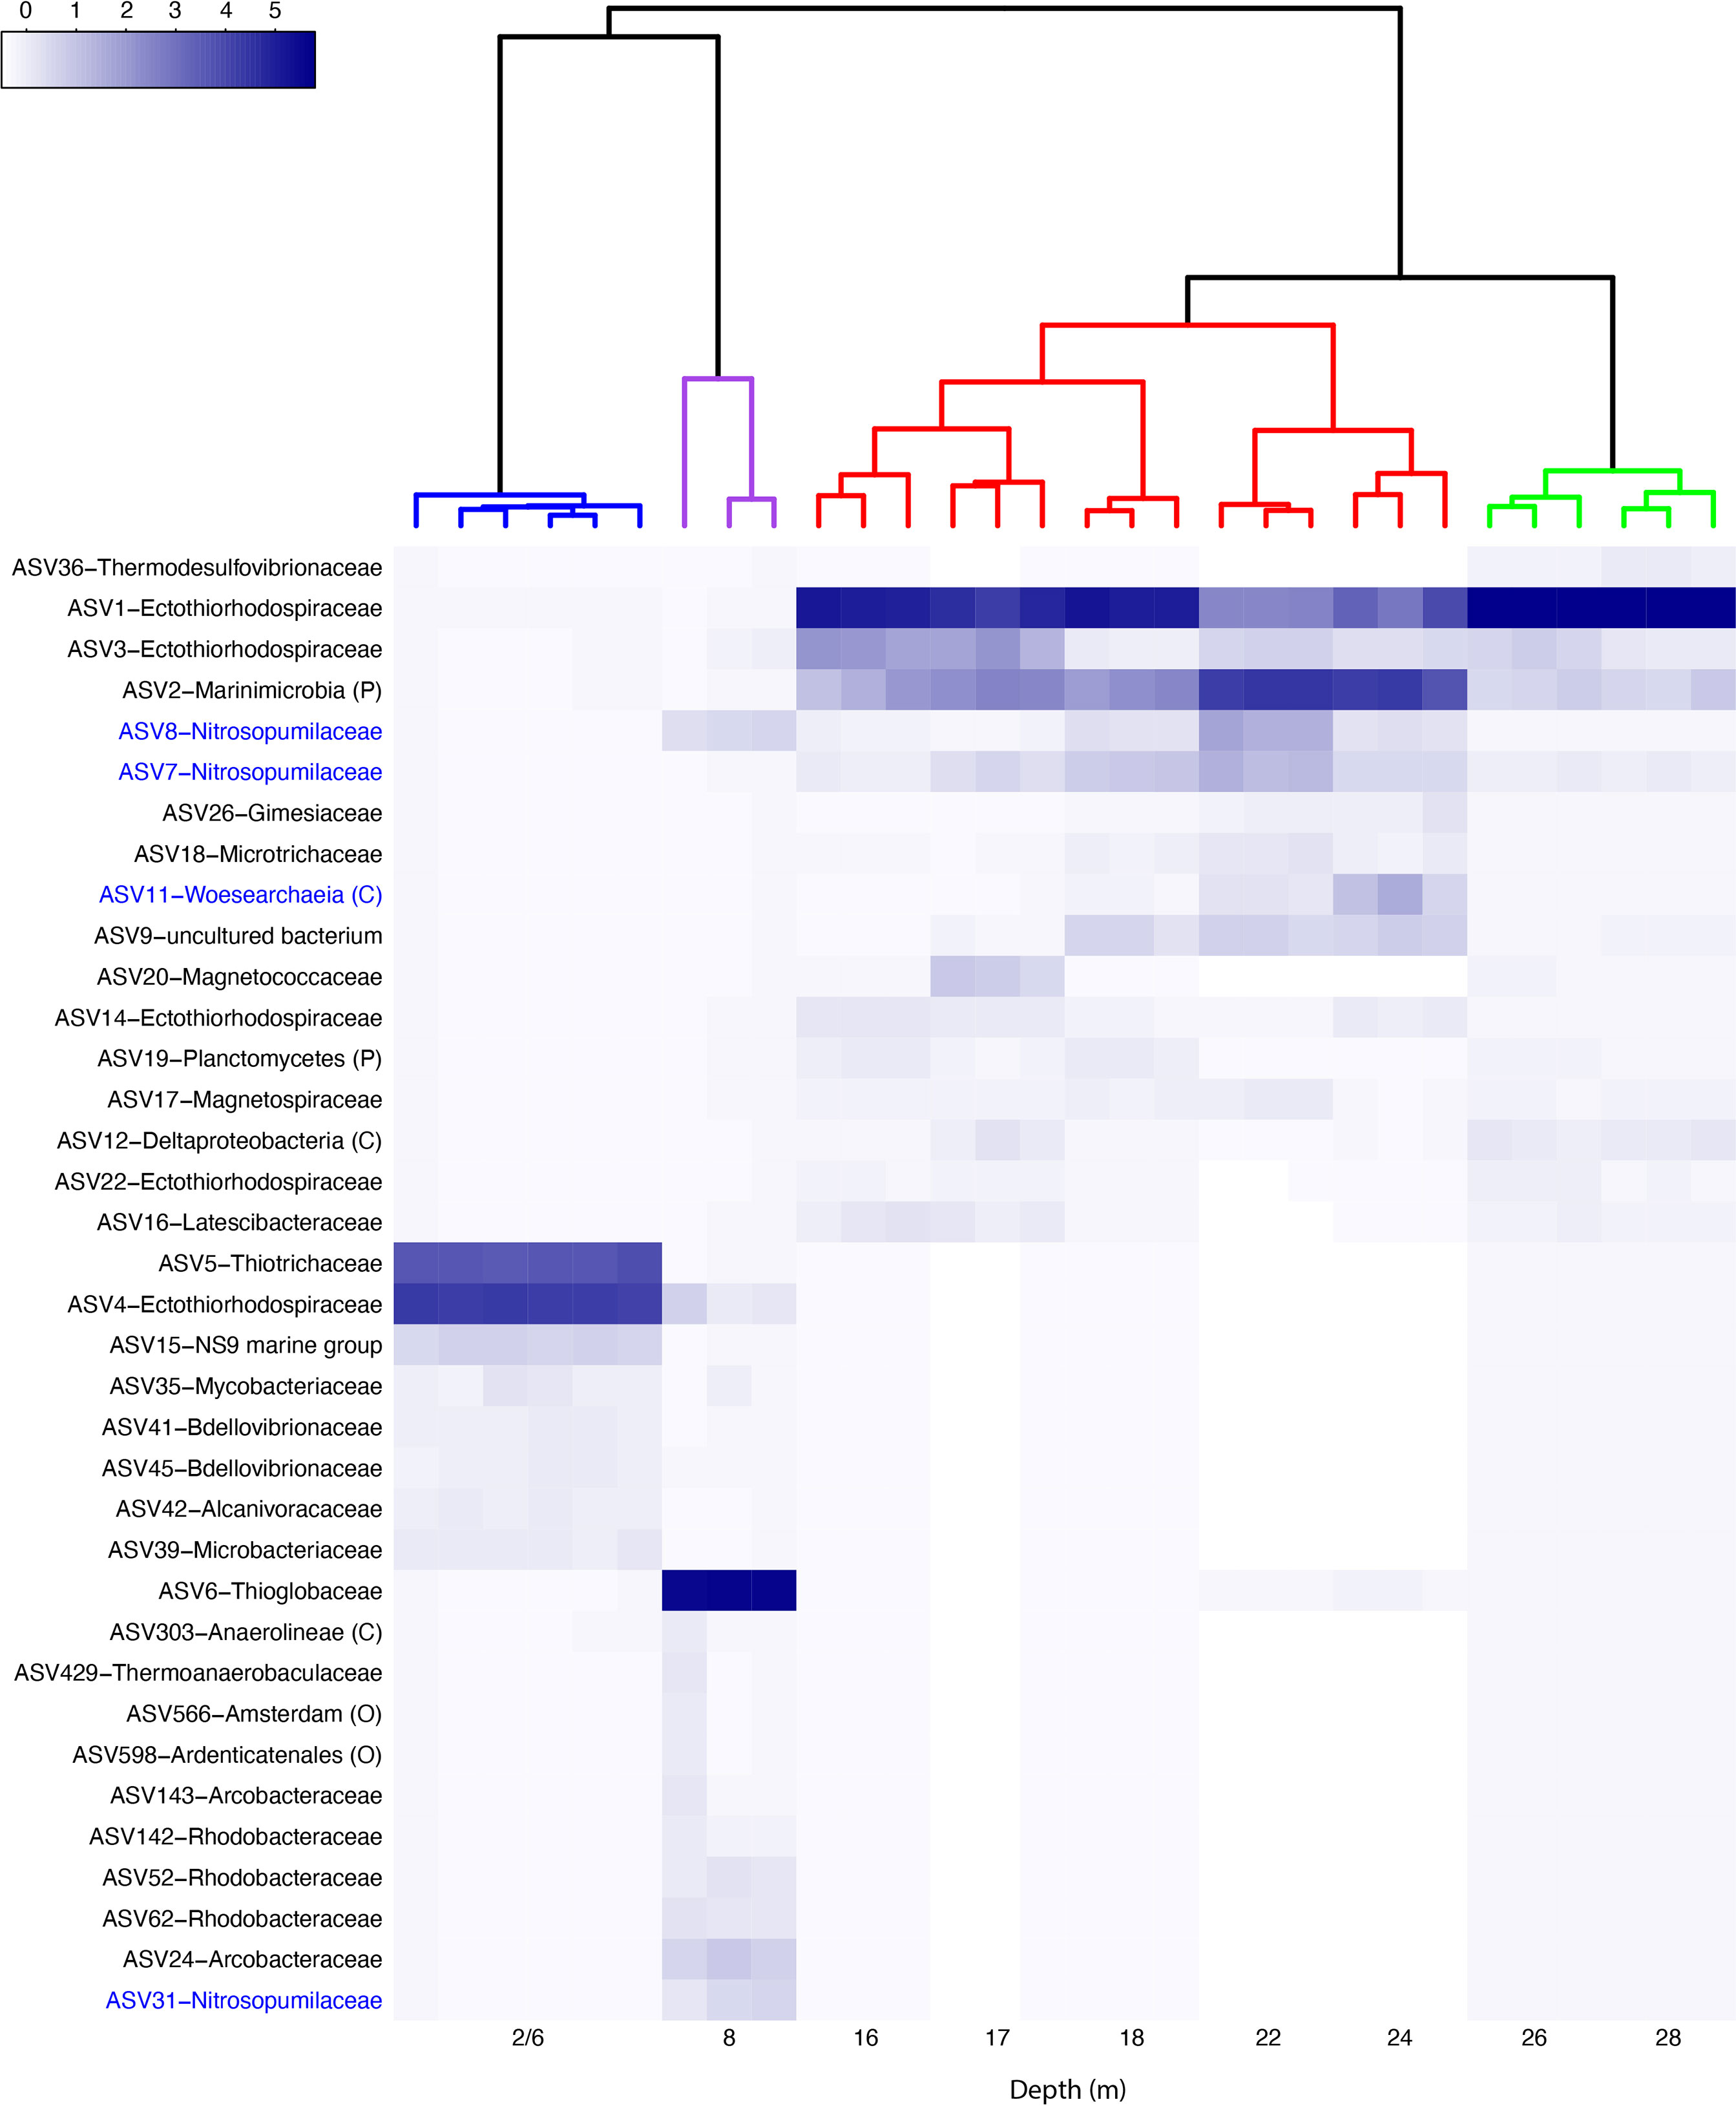
Figure 6 Heatmap and dendrogram based on Bray Curtis dissimilarity matrix. The 36 ASVs visualised are present in at least one sample at a relative abundance greater than 2%. The coloured clusters are supported by PERMANOVA (Supplementary Table 5) with the exception of the 8 m replicates, which were not significantly different based on this analysis. Dendrogram based on Bray-Curtis distance metric hierarchical clustering of ASV relative abundance for each replicate sample (2 and 6 m were not distinguishable from each and are shown as one cluster). The family name is shown after the ASV designation where that has been determined, otherwise the lowest taxonomic ranking obtained is shown (O – Order, C – Class, P – Phylum). Archaeal ASVs’ labels are blue. Relative abundance values are in Supplementary Table 6D.
Functional Profiling of the Sinkhole Microbiome
Based on Tax4Fun2 functional profiling, a total of 42 functional pathways, within seven broader functional categories (from KEGG) were predicted (Figure 7 and Supplementary Table 7). Of these, 17 pathways were predicted to be present at all depths but tending to vary in relative abundance across the depths. Within carbohydrate metabolism, there were three ubiquitous and relatively abundant pathways: the ethylmalonyl pathway, pentose phosphate pathway, and methylaspartate cycle. The Entner-Doudoroff pathway was predicted to be present in 2, 6, 16, 24, 26 and 28 m samples. Ascorbate degradation was only seen in relatively low relative abundance at the surface 2 and 6 m samples. Carbon fixation pathways tended to be fairly uniform in their predicted relative abundance across the depths, with the reductive citrate cycle, the dicarboxylate-hydroxybutyrate cycle and 3-hydroxypropionate bi-cycle found at all depths, while the reductive acetyl-CoA pathway was found at all depths below 2 m samples, and the phosphate acetyltransferase-acetate kinase pathway was only found at 2, 6, 24 and 28 m samples.
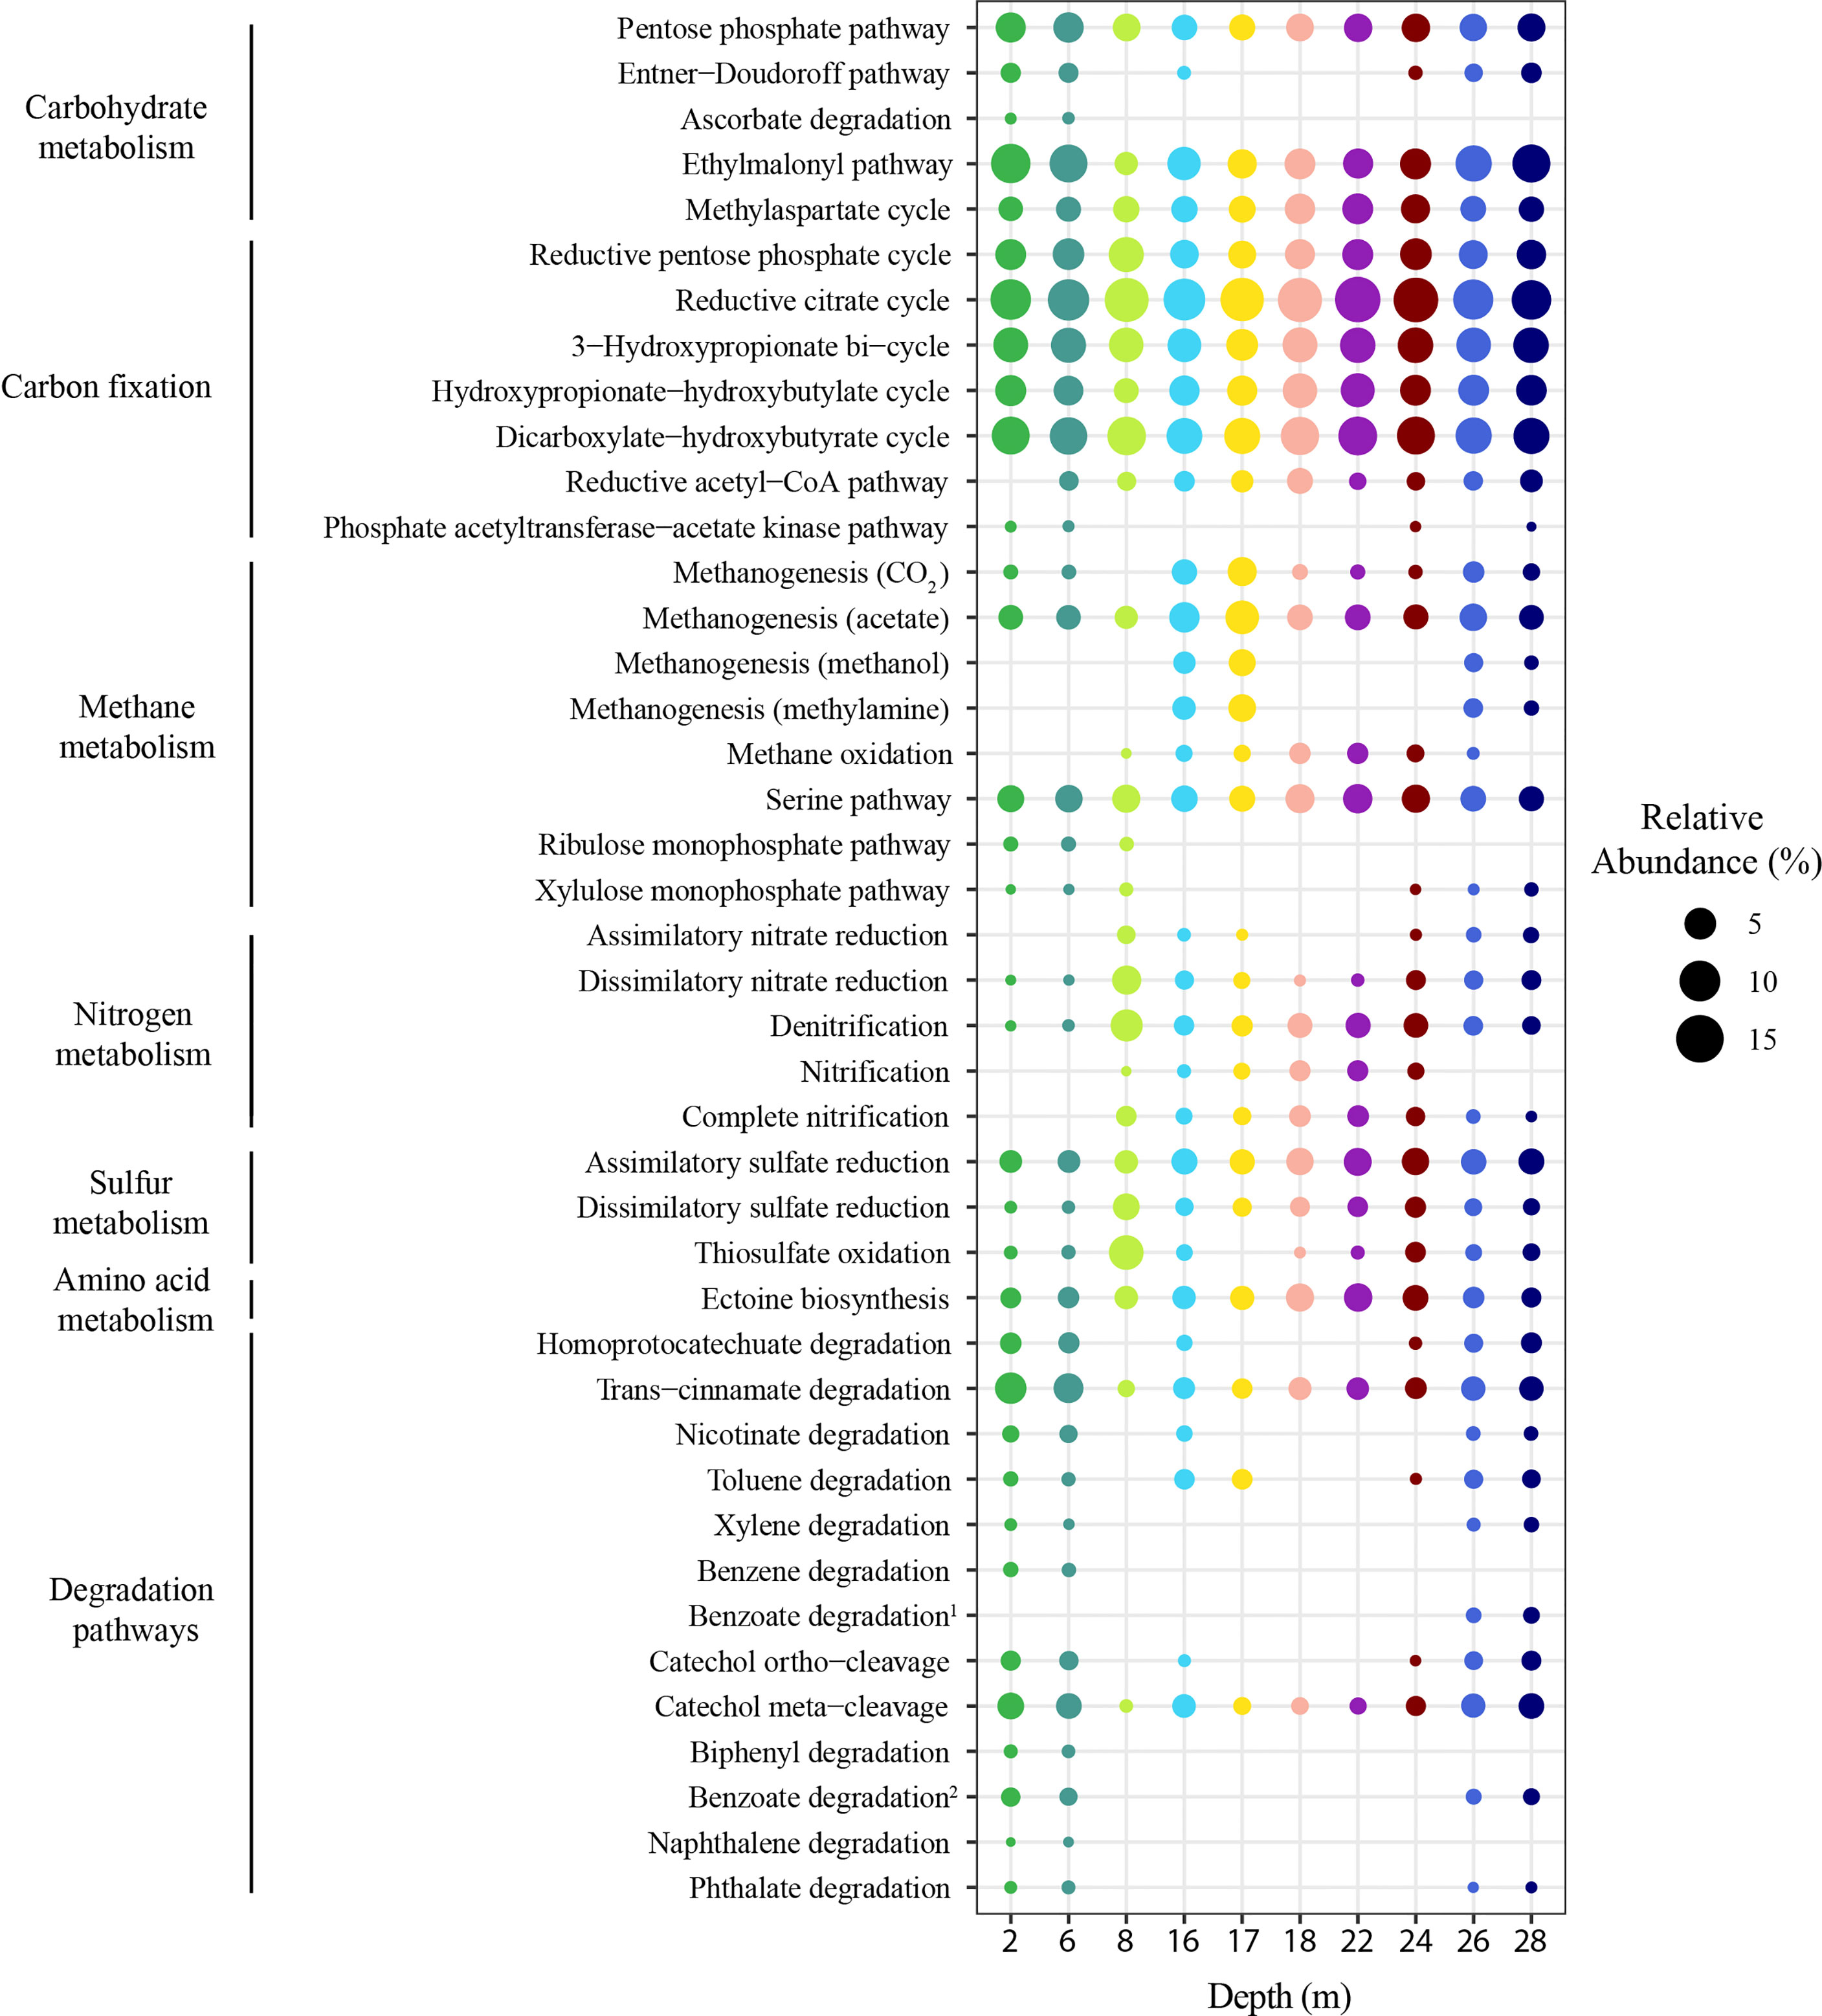
Figure 7 Predicted metabolic potential of the stratified microbial communities occurring in the Bundera Sinkhole. Dot plot displaying the Tax4Fun2 predicted functional profiles for each sampled depth as relative abundance of predicted microbial metabolisms (Reference KEGG pathway: map01120). Replicates were averaged to show one representative value per depth with colours used to represent depths as used in other figures. Benzoate degradation1 represents the degradation of benzoate to methylcatechol and Benzoate degradation2 represents the degradation of benzoate to pimeloyl-CoA.
Key pathways associated with metabolism of methane, nitrogen and sulphur compounds were also well represented in this analysis. For methane metabolism methanogenesis of acetate and the serine pathway, both responsible for assimilation of formaldehyde, were ubiquitous and relatively abundant. The functional capacity for methanogenesis of methanol and methylamine were predicted to be present at 16 and 17 m and were also observed at 24, 26 and 28 m but at low relative abundances (Supplementary Table 7). Ribulose and xylulose monophosphate pathways, likely associated with plant decomposition, were only seen in the upper depths (2, 6 and 8 m). For nitrogen metabolism both dissimilatory and denitrification pathways were present at all depths, but were observed at higher relative abundance below 6 m. Both dissimilatory nitrate reduction and denitrification were predicted to peak at 8m. Nitrogen pathways were more represented in the depths between 8-24 m. Sulphur metabolism was represented by three pathways, with sulfate assimilatory and dissimilatory reduction ubiquitous, and thiosulfate oxidation only absent at 17 m.
The homoprotocatechuate degradation pathway, involved in breakdown of complex organic compounds, was predicted to be found in the 2, 6, 16, 24, 26 and 28 m depths, following a similar pattern as seen with many other degradation pathways (Figure 7). The trans-cinnamate degradation and catechol meta-cleavage were the most relatively abundant degradation pathways across all depths and both were most abundant at the 2, 6, 26, 28 m depths.
Drivers of Community Structure
Canonical correspondence analysis was used to examine which physicochemical parameters contribute to the observed differences in community composition (Figure 8). The total inertia of the plot was 2.37; of this the constrained inertia was 2.28 (an ANOVA of the ordination with environmental vectors was significant, with P = 0.001). A total of 40.4% of the constrained inertia was expressed by the CCA1 axis, while CCA2 captured a further 31%. On the CCA1 axis, separation of samples from 2 and 6 m from all other depths is likely driven by the higher levels of both DIC and DOC in these two samples relative to all others. Samples from 16 m and below clustered closely with each other and separate from both the 8 m samples and the 2 and 6 m samples, likely driven by higher phosphate, sulphate and iron concentrations as well as higher salinity (electrical conductivity) in these depths. Samples from 8 m were located near 0 on the CCA1 axis and were clearly separated from all other depths based on CCA2, likely driven by increased silicon and nitrate levels compared to the other depths. Bioenv and PERMANOVA analyses were conducted to further explore the relationships between community structure and the physicochemical parameters and were consistent with the results from the CCA (Supplementary Table 8).
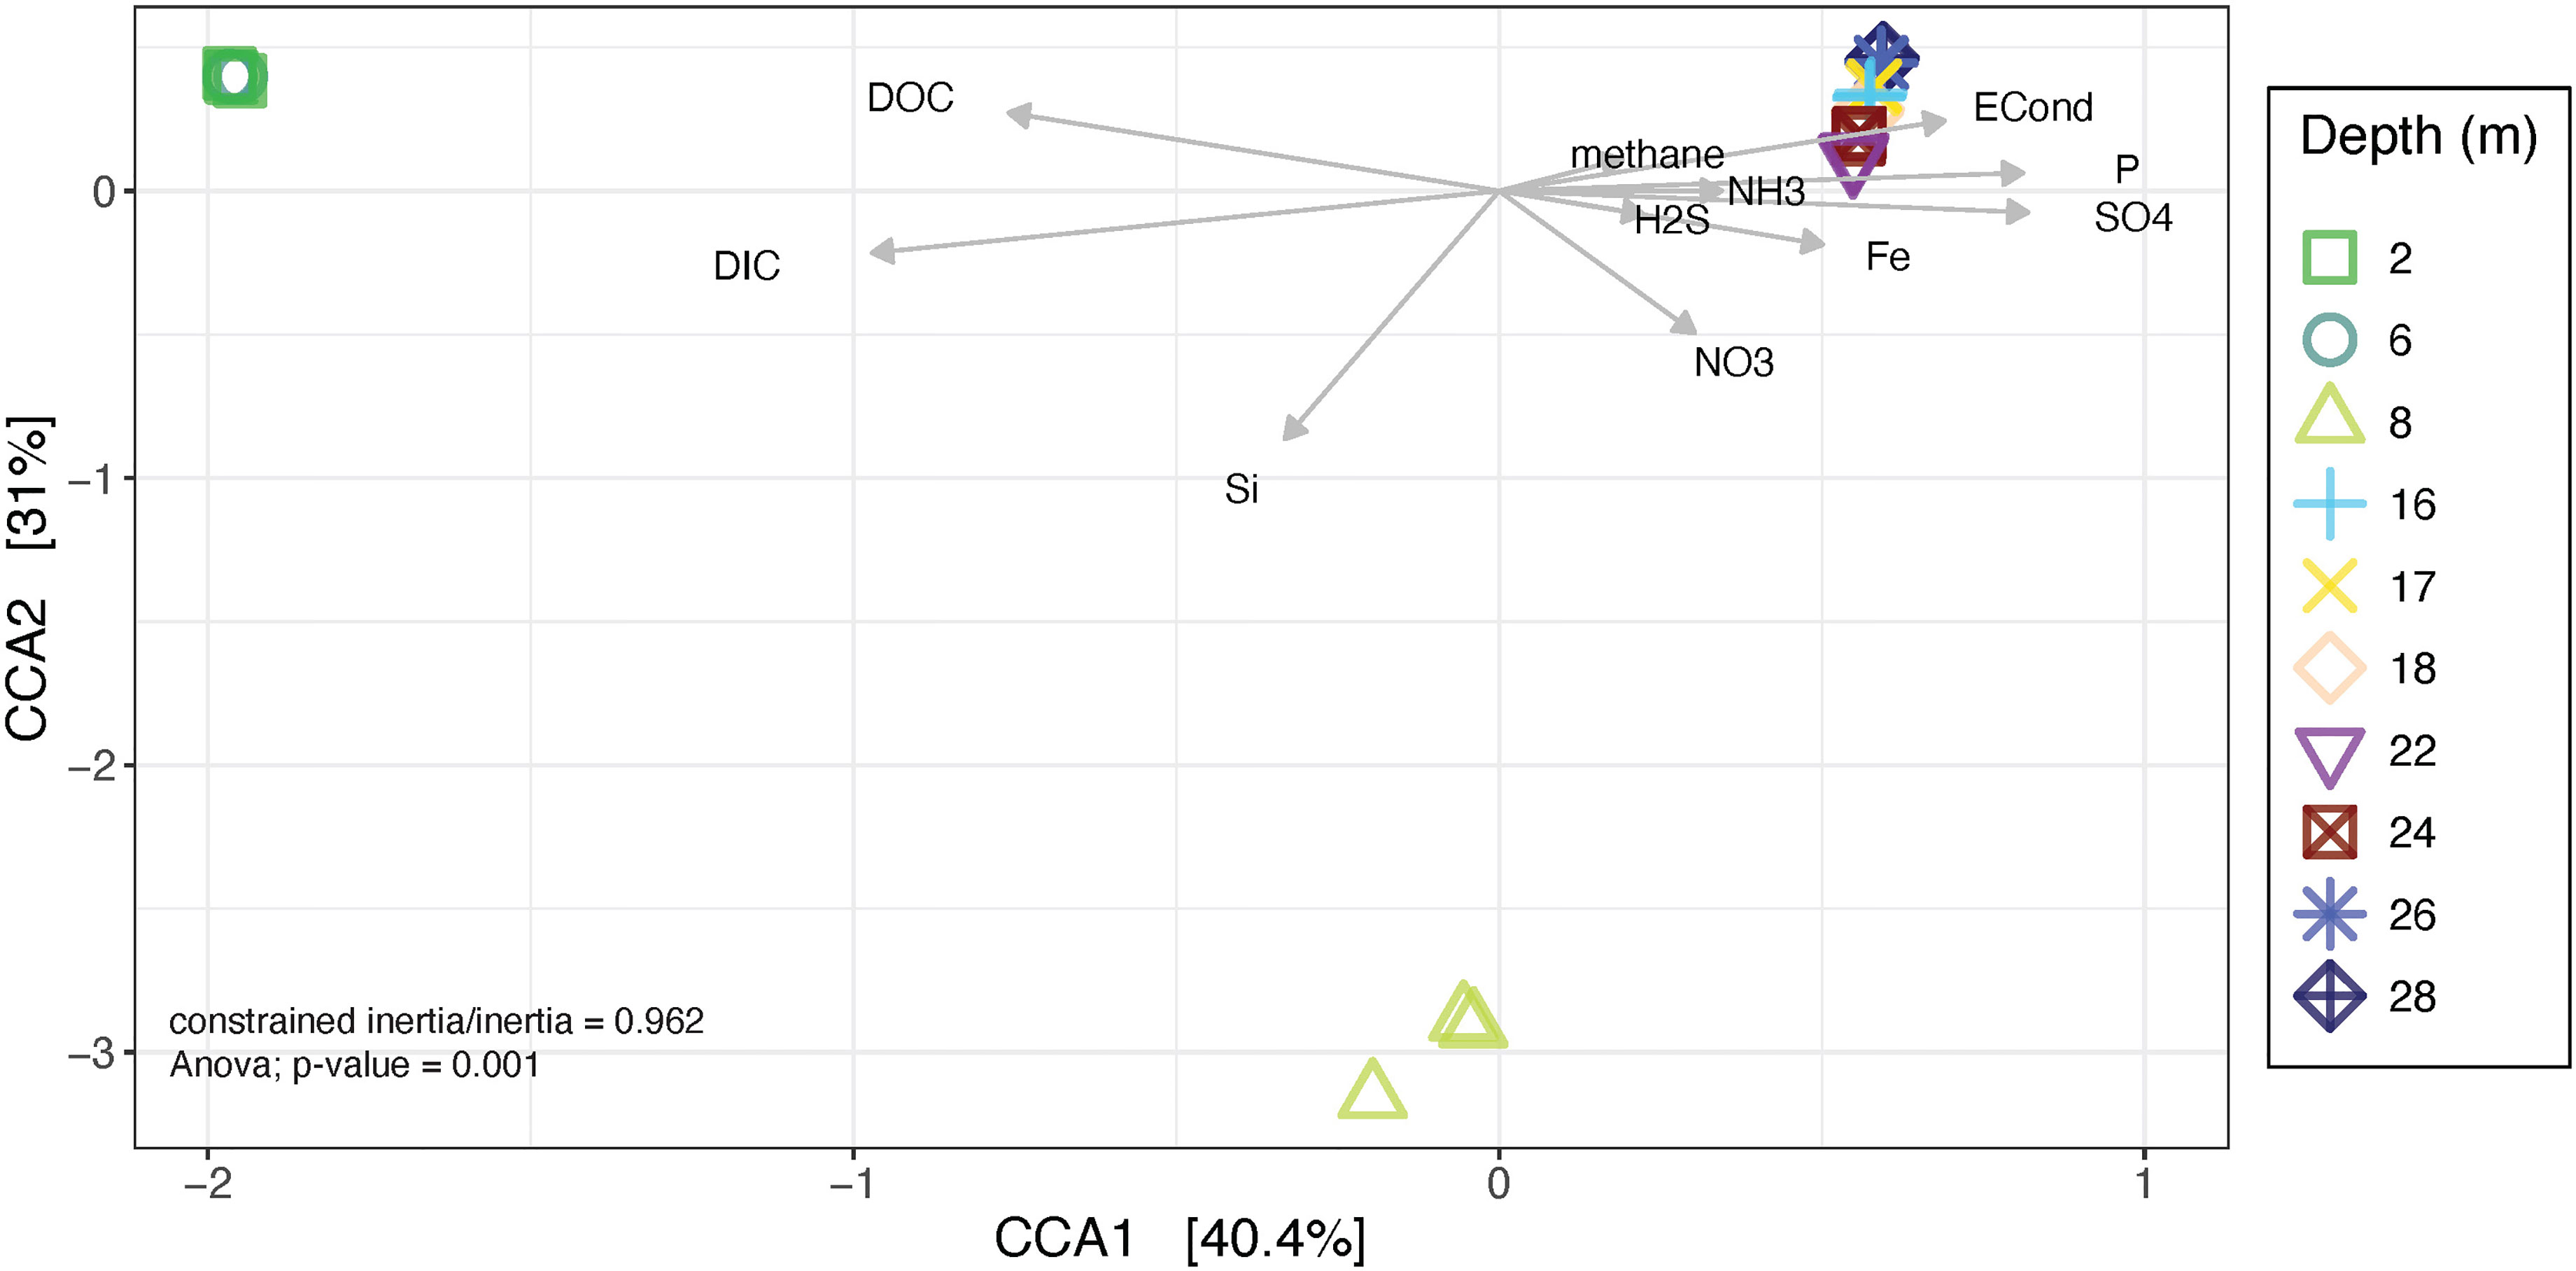
Figure 8 Canonical Correspondence Analysis (CCA) plot of microbial community composition with environmental data plotted as explanatory variables. Each point represents a replicate at the depth indicated in the legend. Arrows show quantitative explanatory variables with the arrowhead indicating the direction of increase.
Discussion
The physicochemical profiles of Bundera sinkhole from this study were generally consistent with earlier sampling efforts carried out at Bundera sinkhole based on sampling from 2005 (Seymour et al., 2007; Humphreys et al., 2012). While some parameters were relatively stable, the depth of some key anchialine features did shift between these surveys. Salinity measurements were comparable, dissolved oxygen in this study peaked at 2 m (2.75 mg l-1) and declined at lower depths, differing from the 2005 pattern where levels were found to be very low at 2.5 m (0.2 mg l-1) and peaked at ~9 m (1.6 mg l-1). The 2005 dissolved oxygen profile may have been linked to the fact that an emu (Domaius novaehollandiae) had died in the sinkhole 16 days before the 2005 sampling was conducted (Seymour et al., 2007; Humphreys et al., 2012). The location of the hydrogen sulphide peak also shifted, with the 2005 study showing highest concentrations between 1 and 7 m, while here it was observed at 16 m. Similarly, both studies showed one main peak in ammonia concentrations, but the location of this shifted from 6 m in 2005 to 16 m in this work. In this current study we additionally measured concentrations of methane, iron, phosphate and silicon across the depth profile. All showed peaks at various intermediate depths, indicating that they were probably present due to endogenous biotic activity, rather than from external inputs.
Comparing microbial community population counts and composition with 2005 sampling revealed commonalities as well as some changes. The bacterial counts across the depth profiles were consistent, with 2 - 6 m depths containing populations of 2.5 x 10⁶ per mL, then dropping down to around 0.5 x10⁶ per mL for lower depths in both studies (Seymour et al., 2007). The microbial amplicon sequencing used in the earlier pilot study, also adhered to the Earth Microbiome protocol and used 454 sequencing technology but generated only ~1,400 reads per sample spanning 23 phyla, while the current work performed deep sequencing resulting in ~300 X more reads per sample and identifying roughly three times as many phyla. The earlier work provided an overview of microbial communities at the phylum level, revealing a community comprised largely of Proteobacteria, along with Thaumarchaeota, with some signs of stratification. Deep sequencing of Bundera in 2015 reveals there are also clear changes in the microbial distribution patterns at phylum level.
In the Bundera microbial communities sampled in 2005 the depths corresponding to the hydrogen sulphide peak, around 5 m, had an abundant population of Deltaproteobacteria which were associated with reduction of sulphate and sulphite. In the current study, by contrast, Deltaproteobacteria were observed to be abundant at all depths, contributing to ~5-13% relative abundance. This association with sulphur cycling is supported by the functional predictions, where both the assimilatory and dissimilatory sulphur reduction pathways were inferred to be present at all depths. The Epsilonproteobacteria [now recognized as a phylum: Epsilonbacteraeota (Waite et al., 2017)], also observed to be most abundant around 6 m in the earlier work, were seen to have a peak in relative abundance in this work as well, however in this case it was at 8 m, which does not correspond with the hydrogen sulphide peak but was where the silicon concentration peaked. It is possible this silicon peak is linked to diatom abundance and Epsilonproteobacteria have previously been reported to be found in association with diatoms (Koedooder et al., 2019) and this is clearly an area of interest for further studies. Epsilonproteobacteria have also been observed associated with other host organisms in hydrothermal vents (Campbell et al., 2006; Dubilier et al., 2008; Goffredi, 2010; Petersen et al., 2010), as well as in mussels in anchialine lakes (Cleary and Polónia, 2017), so their abundance may alternatively be correlated with other larger eukaryotes, such as remipedes and thermatocypridid ostracods, which have previously been identified in Bundera sinkhole (Humphreys, 1999). The other major phyla observed in the earlier work, Thaumarchaeaota, known for ammonia oxidation, showed similar distribution patterns in 2005 and this work, with highest abundances between 8-24 m, which also corresponds to the depths at which our functional predictions indicate nitrification pathways are most prevalent.
From both earlier work and this study, there is good support for both sulphur and nitrogen cycling being key processes in this anchialine system. Whilst endogenous ammonia and sulphate is likely provided by the groundwater/seawater input, at the surface some may also be provided by degradation of complex carbon compounds (Körner et al., 1997). In the uppermost samples (2 and 6 m) we observed populations of organisms that are potential degraders of complex organic matter, including Bacteroidetes and Verrucomicrobia. The most abundant order of Bacteroidetes present, Flavobacteriales, seen predominately at the surface, is known to be strictly aerobic (Jules, 2019) and associated with degradation of complex organic compounds, the breakdown of which may provide some ammonia to the system (Thomas et al., 2011). The two other phyla which are predominantly seen at 2 and 6 m and at much lower levels at other depths are Verrucomicrobia and Tenericutes, the former are likely associated with polysaccharide degradation, the latter are likely parasites of some eukaryotes although there is some possibility they could be free-living (Razin et al., 1998; Skennerton et al., 2016; Sichert et al., 2020).
In this study we identified specific ASVs that were highly abundant at particular depths. Two of the most abundant ASVs were assigned to the Ectothiorhodospiraceae, ASV4 in 2 m and 6 m samples, as well as ASV1, abundant at depths of 16 m and below but at low abundance at depths closer to the surface. While these belong to the same family, they shared only 90% nucleic acid identity, indicating that they are likely to belong to different species/genus groups (Supplementary Figure 3). Characterized members of this family are known to be typically halophilic and use reduced sulphur compounds as an electron donor (Oren, 2014). Most are obligate anaerobic phototrophs, however this group also includes chemolithotrophs and chemoheterotrophs. Best blast hits for each of these ASVs are to uncultured bacteria, with the highest match for ASV4 to a clone (KM270432), recovered from a seawater lake (Menning et al., 2014) while ASV1 matched most closely with an uncultured isolate (FJ436522) observed in seawater sampled from a depth of 235 m from Cariaco Basin, a marine anoxic basin in the Caribbean Sea, off the coast of Venezuela (Rodriguez-Mora et al., 2013). The distribution of ASV1 below 16 m, where there is little light penetration, and its similarity to a marine isolate below the photic zone is suggestive that it is not a phototroph, whereas the distribution of ASV4 is consistent with a potentially phototrophic lifestyle.
The second ASV observed to be highly abundant within the 2 m and 6 m communities, ASV5, was again not able to be classified below family level. This was classified as a member of the Thiotrichaceae; this family includes various sulphur oxidising bacteria as well as chemoheterotrophs, making it difficult to infer likely metabolism for this ASV (Kersters et al., 2006). Blast searches with this sequence recovered only uncultured isolates, with the top hit a sequence recovered from Southern Korean coastal waters (accession KY275774).
At 8 m a single ASV, ASV6 was observed to be highly abundant, but appeared to be almost entirely restricted to this sampling depth. This was classified as a member of the Thioglobaceae (SUP05 clade), a group which includes both thioautotrophs that use sulphide and fix inorganic carbon and frequently live associated with eukaryotic hosts, and marine aerobic heterotrophs that grow on sulphonates and methylated compounds. Based on the physicochemistry of Bundera and the closest blast match being an uncultured marine Mediterranean sea bacteria (KP008732) we suggest that this ASV is more likely to be heterotrophic.
Marinimicrobia ASV2 contributed substantially to relative abundance in communities from 16-28 m (7-19%, highest in 22 and 24 m), corresponding to the region where dissolved oxygen levels were 0.47 mg/L or lower. This phylum, previously known as SAR406, has been reported to be widespread in the ocean within sub-euphotic regions, being particularly abundant in oxygen minimum zones (OMZs). At this time there is limited information on Marinimicrobia metabolism, with most of what we know based on bioinformatic assessments from metagenome-assembled genomes, indicating possible involvement in denitrification as well as the potential for aerobic carbon monoxide (CO) oxidation, polysulphide metabolism and hydrogen utilization for some subset of these inferred genomes (Bertagnolli et al., 2017). Representatives of this phylum were also observed to be one of the dominant phyla in the Yongle Blue Hole, showing highest relative abundance in their intermediate depths (in this case 80 - 100 m), which was consistent with their association with oxygen minimum zones (He et al., 2019).
The archaeal Nitrosopumilaceae family were observed in depths of 8 m and below (highest at 22 m at 15% relative abundance) (ASV7 and 8). This group, widely observed in marine waters and a key contributor to nitrification in these environments (Santoro et al., 2010), is presumably also undertaking ammonia oxidation in Bundera sinkhole. The depth at which these two ASVs are most abundant correlates with the ammonia concentration falling below detectable levels and a bimodal nitrate concentration peaks between 18 m and 24 m. This archaeal family were also observed to be the dominant taxa within Weebubbie cave microbial slime communities, found in submerged passages within the South Australian Nullarbor caves (Tetu et al., 2013).
Nanoarchaeaeota representatives belonging to class Woesearchaeia but unclassified at family level or below, showed a similar population distribution across the different depths to the Nitrosopumilaceae. Characterised members of the Nanoarchaeaeota have been shown to be obligate symbionts of a small number of archaea, the original and most characterised association being that between Nanoarchaeum equitans and Ignicoccus hospitalis (Huber et al., 2002; Forterre et al., 2009). It is tempting to speculate that the similar depth distributions of the Nanoarchaeaeota ASVs and Nitrosopumilaceae ASVs may reflect an analogous symbiotic relationship between these taxa (Jarett et al., 2018).
Also observed alongside the ammonia oxidising archaea are known nitrite oxidising bacterial phyla, including Nitrospirae and Nitrospinae, (Han et al., 2018), both of which were present at higher relative abundance below the surface depths (2 m and 6 m). Interestingly, members of the Nitrospirae and Nitrospinae phyla had somewhat different distribution patterns to each other, with Nitrospirae relative abundance highest at 28 m, while Nitrospinae relative abundance was largely limited to the 8 m to 24 m zone, presumably reflecting niche specific requirements of the individual taxa comprising these phyla.
While only a handful of other anchialine ecosystems have been examined using in-depth microbiome analyses, and these represent a diverse array of environments, there are some broad parallels in community composition, at least at the higher taxonomic levels (Brankovits et al., 2017; He et al., 2019; Kajan et al., 2021). In each of these studies, stratified and taxonomically diverse microbial communities were described, with Proteobacteria consistently at high relative abundance throughout the water column and substantial populations of archaea observed at lower depths. At lower taxonomic levels, however, these environments all stand out for their high degree of microbial endemism, which parallels established patterns of endemism of higher eukaryotes described in these anchialine systems (Bianchi et al., 2018; Gonzalez et al., 2020).
Brankovits et al. (2017) in their work on Cenote Bang in the Yucatan Peninsula, looked at biogeochemical cycling processes within the microbial communities utilising both shotgun and 16S rRNA, showing that methane along with soil-derived organic matter were likely to be the major energy inputs for these ecosystems. Functional predictions from our 16S rRNA data indicate methane as well as sulphur utilisation are likely important processes occurring in the Bundera sinkhole at all depths, while nitrate and ammonia utilisation are also likely important processes below the surface layer (8-28 m). This is similar to observations made by He et al. regarding Yongle Blue Hole, South China Sea, where sulphur oxidation and nitrate reduction were the most abundant predicted ecological functions (He et al., 2019; Kajan et al., 2021).
Conclusions
The Bundera sinkhole contains multiple distinct communities along the sampled depth profile, differing substantially in community composition and likely also in key metabolisms. Evidence for chemolithotrophic processes within Bundera, including sulphur, ammonia and nitrite oxidation is strengthened by this work. However, the high level of taxonomic novelty in the system means that it was not possible to attribute metabolic functions to many of the key players. Future work involving shotgun metagenome sequencing has the potential to provide some insight into the specialised metabolisms being utilised by the novel microbes found in these depths. Additionally, studies involving sampling across a time series would be useful in providing insight into community stability over time. Anchialine systems, as hosts of complex, often specialised microbial communities, are uniquely important for understanding microbial diversity and adaptive processes. Work to understand these communities, which in many instances are under threat from anthropogenic disturbance, is therefore timely and valuable.
Data Availability Statement
The datasets presented in this study can be found in online repositories. The names of the repository/repositories and accession number(s) can be found below: https://www.ebi.ac.uk/ena, PRJEB50681.
Author Contributions
ST, WH and IP conceived the study. WH performed the sampling. BS performed the DNA extractions and library preparation. Data analyses were performed by LE, AF, MC and BS. ST, LE and IP coordinated discussion and drafted the manuscript. All authors contributed to discussing and interpreting the results and improving the manuscript.
Funding
IP was assisted by an Australian Research Council Laureate Fellowship (FL140100021).
Conflict of Interest
The authors declare that the research was conducted in the absence of any commercial or financial relationships that could be construed as a potential conflict of interest.
Publisher’s Note
All claims expressed in this article are solely those of the authors and do not necessarily represent those of their affiliated organizations, or those of the publisher, the editors and the reviewers. Any product that may be evaluated in this article, or claim that may be made by its manufacturer, is not guaranteed or endorsed by the publisher.
Acknowledgments
The authors thank Rae Young for her help with sample collection, Dr Martin Ostrowski for input into microbial sampling, storage and flow cytometry protocols, Tanya Smith for help with flow cytometry sample processing and Dr David Midgley for helpful discussions regarding these subterranean microbial communities.
Supplementary Material
The Supplementary Material for this article can be found online at: https://www.frontiersin.org/articles/10.3389/fmars.2022.872082/full#supplementary-material
References
Bertagnolli A. D., Padilla C. C., Glass J. B., Thamdrup B., Stewart F. J. (2017). Metabolic Potential and in Situ Activity of Marine Marinimicrobia Bacteria in an Anoxic Water Column. Environ. Microbiol. 19, 4392–4416. doi: 10.1111/1462-2920.13879
Bianchi C. N., Calderón-Gutiérrez F., Sánchez-Ortiz C. A., Huato-Soberanis L. (2018). Ecological Patterns in Anchialine Caves. PloS One 13. doi: 1371/journal.pone.0202909
Bishop R. E., Humphreys W. F., Kršinić F., Sket B., Iliffe T. M., Žic V., et al. (2015). ‘Anchialine’ Redefined as a Subterranean Estuary in a Crevicular or Cavernous Geological Setting. J. Crust. Biol. 35, 511–514. doi: 10.1163/1937240X-00002335
Bolyen E., Rideout J. R., Dillon M. R., Bokulich N. A., Abnet C. C., Al-Ghalith G. A., et al. (2019). Reproducible, Interactive, Scalable and Extensible Microbiome Data Science Using QIIME 2. Nat. Biotechnol. 37, 852–857. doi: 10.1038/s41587-019-0209-9
Brankovits D., Pohlman J. W., Niemann H., Leigh M. B., Leewis M. C., Becker K. W., et al. (2017). Methane- and Dissolved Organic Carbon-Fueled Microbial Loop Supports a Tropical Subterranean Estuary Ecosystem. Nat. Commun. 8. doi: 10.1038/s41467-017-01776-x
Callahan B. J., Mcmurdie P. J., Rosen M. J., Han A. W., Johnson A. J. A., Holmes S. P. (2016). DADA2: High-Resolution Sample Inference From Illumina Amplicon Data. Nat. Methods 13, 581–583. doi: 10.1038/nmeth.3869
Campbell B. J., Engel A. S., Porter M. L., Takai K. (2006). The Versatile ϵ-Proteobacteria: Key Players in Sulphidic Habitats. Nat. Rev. Microbiol. 4, 458–468. doi: 10.1038/nrmicro1414
Caporaso J. G., Lauber C. L., Walters W. A., Berg-Lyons D., Huntley J., Fierer N., et al. (2012). Ultra-High-Throughput Microbial Community Analysis on the Illumina HiSeq and MiSeq Platforms. ISME. J. 6, 1621–1624. doi: 10.1038/ismej.2012.8
Cleary D. F. R., Polónia A. R. M. (2017). Bacterial and Archaeal Communities Inhabiting Mussels, Sediment and Water in Indonesian Anchialine Lakes. Antonie. van. Leeuwenhoek. 111, 237–257. doi: 10.1007/s10482-017-0944-1
Davis M., Garey J. (2018). Microbial Function and Hydrochemistry Within a Stratified Anchialine Sinkhole: A Window Into Coastal Aquifer Interactions. Water 10. doi: 10.3390/w10080972
Dubilier N., Bergin C., Lott C. (2008). Symbiotic Diversity in Marine Animals: The Art of Harnessing Chemosynthesis. Nat. Rev. Microbiol. 6, 725–740. doi: 10.1038/nrmicro1992
Dworkin M., Falkow S., Rosenberg E., Schleifer K.-H., Stackebrandt E. (2006). The Prokaryotes . doi: 10.1007/0-387-30745-1
Forterre P., Gribaldo S., Brochier-Armanet C. (2009). Happy Together: Genomic Insights Into the Unique Nanoarchaeum/Ignicoccus Association. J. Biol. 8. doi: 10.1186/jbiol110
Gadagkar S., Page T. J., Humphreys W. F., Hughes J. M. (2008). Shrimps Down Under: Evolutionary Relationships of Subterranean Crustaceans From Western Australia (Decapoda: Atyidae: Stygiocaris). PloS One 3, e1618. doi: 10.1371/journal.pone.0001618
García A. M., Palmero A. M., Del Carmen Brito M., Núñez J., Worsaae K. (2009). Anchialine Fauna of the Corona Lava Tube (Lanzarote, Canary Islands): Diversity, Endemism and Distribution. Mar. Biodiv. 39, 169–182. doi: 10.1007/s12526-009-0023-6
Goffredi S. K. (2010). Indigenous Ectosymbiotic Bacteria Associated With Diverse Hydrothermal Vent Invertebrates. Environ. Microbiol. Rep. 2, 479–488. doi: 10.1111/j.1758-2229.2010.00136.x
Gonzalez B., Martínez A., Olesen J., Truskey S., Ballou L., Allentoft-Larsen M., et al. (2020). Anchialine Biodiversity in the Turks and Caicos Islands: New Discoveries and Current Faunal Composition. Int. J. Speleolog. 49, 71–86. doi: 10.5038/1827-806X.49.2.2316
Han S., Li X., Luo X., Wen S., Chen W., Huang Q. (2018). Nitrite-Oxidizing Bacteria Community Composition and Diversity Are Influenced by Fertilizer Regimes, But Are Independent of the Soil Aggregate in Acidic Subtropical Red Soil. Front. Microbiol. 9. doi: 10.3389/fmicb.2018.00885
He H., Fu L., Liu Q., Fu L., Bi N., Yang Z., et al. (2019). Community Structure, Abundance and Potential Functions of Bacteria and Archaea in the Sansha Yongle Blue Hole, Xisha, South China Sea. Front. Microbiol. 10. doi: 10.3389/fmicb.2019.02404
Hoffman S. K., Seitz K. W., Havird J. C., Weese D. A., Santos S. R. (2017). Diversity and the Environmental Drivers of Spatial Variation in Bacteria and Micro-Eukarya Communities From the Hawaiian Anchialine Ecosystem. Hydrobiologia 806, 265–282. doi: 10.1007/s10750-017-3365-2
Huber H., Hohn M. J., Rachel R., Fuchs T., Wimmer V. C., Stetter K. O. (2002). A New Phylum of Archaea Represented by a Nanosized Hyperthermophilic Symbiont. Nature 417, 63–67. doi: 10.1038/417063a
Humphreys W. F. (1999). Physico-Chemical Profile and Energy Fixation in Bundera Sinkhole, an Anchialine Remiped Habitat in North-Western Australia. J. R. Soc. West. Aust. 82, 89–98.
Humphreys W. F., Poole A., Eberhard S. M., Warren D. (1999). Effects of Research Diving on the Physico-Chemical Profile of Bundera Sinkhole, an Anchialine Remiped Habitat at Cape Range, Western Australia. J. R. Soc West. Aust. 82, 99–108.
Humphreys W., Tetu S., Elbourne L., Gillings M., Seymour J., Mitchell J., et al. (2012). Geochemical and Microbial Diversity of Bundera Sinkhole, an Anchialine System in the Eastern Indian Ocean. Natur. Croatic.: Periodic. Musei. Histor. Natural0 Croatic. 21, 59–63.
Iliffe T. M. (2002). Conservation of Anchialine Cave Biodiversity (Karst Frontiers Karst Institure Special Publication).
Jarett J. K., Nayfach S., Podar M., Inskeep W., Ivanova N. N., Munson-Mcgee J., et al. (2018). Single-Cell Genomics of Co-Sorted Nanoarchaeota Suggests Novel Putative Host Associations and Diversification of Proteins Involved in Symbiosis. Microbiome 6. doi: 10.1186/s40168-018-0539-8
Kajan K., Cukrov N., Cukrov N., Bishop-Pierce R., Orlić S. (2021). Microeukaryotic and Prokaryotic Diversity of Anchialine Caves From Eastern Adriatic Sea Islands. Microbial. Ecolog. doi: 10.1007/s00248-021-01760-5
Kanehisa M., Araki M., Goto S., Hattori M., Hirakawa M., Itoh M., et al. (2007). KEGG for Linking Genomes to Life and the Environment. Nucleic Acids Res. 36, D480–D484. doi: 10.1093/nar/gkm882
Kassambara A. (2020). Ggpubr: 'Ggplot2' Based Publication Ready Plots. Available at: http://www.sthda.com/english/rpkgs/ggpubr.
Kersters K., De Vos P., Gillis M., Swings J., Vandamme P., Stackebrandt E. (2006). Introduction to the Proteobacteria. In: The Prokaryotes Dworkin M., Falkow S., Rosenberg E., Schleifer K.-H., Stackebrandt E. (eds) New York: Springer, 3–37
Koedooder C., Stock W., Willems A., Mangelinckx S., De Troch M., Vyverman W., et al. (2019). Diatom-Bacteria Interactions Modulate the Composition and Productivity of Benthic Diatom Biofilms. Front. Microbiol. 10. doi: 10.3389/fmicb.2019.01255
Körner I., Brilsky H., Jensen U., Ritzkowski M., Stegmann R. (1997). “Possibilities for the Regulation of the Composting Process to Optimize the Nutrient Composition of Compost,” in Orbit 97dorganic Recovery and Biological Treatment (Into the Next Millennium) (Manchester, UK: Zeebra Publishing), 211e219.
Marie D., Partensky F., Jacquet S., Vaulot D. (1997). Enumeration and Cell Cycle Analysis of Natural Populations of Marine Picoplankton by Flow Cytometry Using the Nucleic Acid Stain SYBR Green I. Appl. Environ. Microbiol. 63, 186–193. doi: 10.1128/aem.63.1.186-193.1997
Marrack L., Wiggins C., Marra J. J., Genz A., Most R., Falinski K., et al. (2021). Assessing the Spatial–Temporal Response of Groundwater-Fed Anchialine Ecosystems to Sea-Level Rise for Coastal Zone Management. Aquat. Conserv.: Mar. Freshw. Ecosyst. 31, 853–869. doi: 10.1002/aqc.3493
Martinez Arbizu P. (2020). Pairwiseadonis: Pairwise Multilevel Comparison Using Adonis. R Package Version 0.4. Available at: https://github.com/pmartinezarbizu/pairwiseAdonis
Martínez A., Gonzalez B. C. (2018). “"Volcanic Anchialine Habitats of Lanzarote,",” in Cave Ecology, 399–414.
Mcdonald D., Clemente J. C., Kuczynski J., Rideout J. R., Stombaugh J., Wendel D., et al. (2012). The Biological Observation Matrix (BIOM) Format or: How I Learned to Stop Worrying and Love the Ome-Ome. GigaScience 1. doi: 10.1186/2047-217X-1-7
Mchardy A. C., Mcmurdie P. J., Holmes S. (2014). Waste Not, Want Not: Why Rarefying Microbiome Data Is Inadmissible. PloS Comput. Biol. 10. doi: 10.1371/journal.pcbi.1003531
Menning D., Boop L., Graham E., Garey J. (2014). Molecular Analyses of Microbial Abundance and Diversity in the Water Column of Anchialine Caves in Mallorca, Spain. Int. J. Speleolog. 43, 217–226. doi: 10.5038/1827-806X.43.2.9
Oksanen J., Blanchet F. G., Friendly M., Kindt R., Legendre P., Mcglinn D., et al. (2020). Vegan: Community Ecology Package. Available at: https://github.com/vegandevs/vegan/
Oren A. (2014). "The Family Ectothiorhodospiraceae," in The Prokaryotes: Gammaproteobacteria. Eds. Rosenberg E., Delong E. F., Lory S., Stackebrandt E., Thompson F. (Berlin, Heidelberg: Springer Berlin Heidelberg), 199–222.
Petersen J. M., Ramette A., Lott C., Cambon-Bonavita M.-A., Zbinden M., Dubilier N. (2010). Dual Symbiosis of the Vent Shrimprimicaris Exoculatawith Filamentous Gamma- and Epsilonproteobacteria at Four Mid-Atlantic Ridge Hydrothermal Vent Fields. Environ. Microbiol. doi: 10.1111/j.1462-2920.2009.02129.x
Ploner A. (2021). Heatplus: Heatmaps With Row and/or Column Covariates and Colored Clusters. Available at: https://github.com/alexploner/Heatplus
Pohlman J. W. (2011). The Biogeochemistry of Anchialine Caves: Progress and Possibilities. Hydrobiologia 677, 33–51. doi: 10.1007/s10750-011-0624-5
Quast C., Pruesse E., Yilmaz P., Gerken J., Schweer T., Yarza P., et al. (2012). The SILVA Ribosomal RNA Gene Database Project: Improved Data Processing and Web-Based Tools. Nucleic Acids Res. 41, D590–D596. doi: 10.1093/nar/gks1219
Razin S., Yogev D., Naot Y. (1998). Molecular Biology and Pathogenicity of Mycoplasmas. Microbiol. Mol. Biol. Rev. 62, 1094–1156. doi: 10.1128/MMBR.62.4.1094-1156.1998
Rodriguez-Mora M. J., Scranton M. I., Taylor G. T., Chistoserdov A. Y. (2013). Bacterial Community Composition in a Large Marine Anoxic Basin: A Cariaco Basin Time-Series Survey. FEMS Microbiol. Ecol. 84, 625–639. doi: 10.1111/1574-6941.12094
Ruiz-González C., Rodellas V., Garcia-Orellana J. (2021). The Microbial Dimension of Submarine Groundwater Discharge: Current Challenges and Future Directions. FEMS Microbiol. Rev. 45. doi: 10.1093/femsre/fuab010
Santoro A. E., Casciotti K. L., Francis C. A. (2010). Activity, Abundance and Diversity of Nitrifying Archaea and Bacteria in the Central California Current. Environ. Microbiol. 12, 1989–2006. doi: 10.1111/j.1462-2920.2010.02205.x
Seymour J. R., Humphreys W. F., Mitchell J. G. (2007). Stratification of the Microbial Community Inhabiting an Anchialine Sinkhole. Aquat. Microbial. Ecol. 50, 11–24. doi: 10.3354/ame01153
Sichert A., Corzett C. H., Schechter M. S., Unfried F., Markert S., Becher D., et al. (2020). Verrucomicrobia Use Hundreds of Enzymes to Digest the Algal Polysaccharide Fucoidan. Nat. Microbiol. 5, 1026–1039. doi: 10.1038/s41564-020-0720-2
Skennerton C. T., Haroon M. F., Briegel A., Shi J., Jensen G. J., Tyson G. W., et al. (2016). Phylogenomic Analysis of Candidatus ‘Izimaplasma’ Species: Free-Living Representatives From a Tenericutes Clade Found in Methane Seeps. ISME. J. 10, 2679–2692. doi: 10.1038/ismej.2016.55
Tetu S. G., Breakwell K., Elbourne L. D., Holmes A. J., Gillings M. R., Paulsen I. T. (2013). Life in the Dark: Metagenomic Evidence That a Microbial Slime Community is Driven by Inorganic Nitrogen Metabolism. ISME. J. 7, 1227–1236. doi: 10.1038/ismej.2013.14
Thomas F., Hehemann J.-H., Rebuffet E., Czjzek M., Michel G. (2011). Environmental and Gut Bacteroidetes: The Food Connection. Front. Microbiol. 2, 93. doi: 10.3389/fmicb.2011.00093
Van Hengstum P. J., Cresswell J. N., Milne G. A., Iliffe T. M. (2019). Development of Anchialine Cave Habitats and Karst Subterranean Estuaries Since the Last Ice Age. Sci. Rep. 9, 11907.
Van Hengstum P. J., Cresswell J. N., Milne G. A., Iliffe T. M. (2019). Development of Anchialine Cave Habitats and Karst Subterranean Estuaries Since the Last Ice Age. Sci. Rep. 9, 11907. doi: 10.1038/s41598-019-48058-8
Waite D. W., Vanwonterghem I., Rinke C., Parks D. H., Zhang Y., Takai K., et al. (2017). Comparative Genomic Analysis of the Class Epsilonproteobacteria and Proposed Reclassification to Epsilonbacteraeota (Phyl. Nov.). Front. Microbiol. 8. doi: 10.3389/fmicb.2017.00682
Watson M., Mcmurdie P. J., Holmes S. (2013). Phyloseq: An R Package for Reproducible Interactive Analysis and Graphics of Microbiome Census Data. PloS One 8. doi: 10.1371/journal.pone.0061217
Wemheuer F., Taylor J. A., Daniel R., Johnston E., Meinicke P., Thomas T., et al. (2020). Tax4Fun2: Prediction of Habitat-Specific Functional Profiles and Functional Redundancy Based on 16S rRNA Gene Sequences. Environ. Microbio. 15. doi: 10.1186/s40793-020-00358-7
Western Australian Department of Biodiversity, C.a.A (2022). "Cape Range Remipede Community (Bundera Sinkhole)" (C.a.A. Department of Biodiversity).
Wickham H. (2016). "Ggplot2 : Elegant Graphics for Data Analysis", in: Use R!. 2nd ed (Cham: Springer International Publishing : Imprint: Springer).
Keywords: anchialine, Bundera sinkhole, microbial ecology, 16S rRNA amplicon analysis, anchialine systems
Citation: Elbourne LDH, Sutcliffe B, Humphreys W, Focardi A, Saccò M, Campbell MA, Paulsen IT and Tetu SG (2022) Unravelling Stratified Microbial Assemblages in Australia’s Only Deep Anchialine System, The Bundera Sinkhole. Front. Mar. Sci. 9:872082. doi: 10.3389/fmars.2022.872082
Received: 09 February 2022; Accepted: 12 April 2022;
Published: 23 June 2022.
Edited by:
Efrain Miguel Chavez Solis, Autonomous University of Baja California, MexicoReviewed by:
Mario Alberto Martínez Núñez, Universidad Nacional Autónoma de México, MexicoKeith A Crandall, George Washington University, United States
Copyright © 2022 Elbourne, Sutcliffe, Humphreys, Focardi, Saccò, Campbell, Paulsen and Tetu. This is an open-access article distributed under the terms of the Creative Commons Attribution License (CC BY). The use, distribution or reproduction in other forums is permitted, provided the original author(s) and the copyright owner(s) are credited and that the original publication in this journal is cited, in accordance with accepted academic practice. No use, distribution or reproduction is permitted which does not comply with these terms.
*Correspondence: Ian T. Paulsen, Ian.paulsen@mq.edu.au; Sasha G. Tetu, Sasha.tetu@mq.edu.au
†These authors share first authorship