 Hongbo Guo1,2
 Chong Huang
95% of researchers rate our articles as excellent or good
Learn more about the work of our research integrity team to safeguard the quality of each article we publish.
Find out more
ORIGINAL RESEARCH article
Front. Mar. Sci. , 25 January 2022
Sec. Global Change and the Future Ocean
Volume 8 - 2021 | https://doi.org/10.3389/fmars.2021.804541
This article is part of the Research Topic Artificial Intelligence-Based Forecasting and Analytic Techniques for Environment and Economics Management View all 21 articles
Modeling the direct economic losses of storm surge disasters can assess the disaster situation in a timely manner and improve the efficiency of post-disaster management in practice, which is acknowledged as one of the most significant issues in clean production. However, improving the forecasting accuracy of direct economic losses caused by storm surge disasters remains challenging, which is also a major concern in the field of disaster risk management. In particular, most of the previous studies have mainly focused on individual models, which ignored the significance of reduction and optimization. Therefore, a novel direct economic loss forecasting system for storm surge disasters is proposed in this study, which includes reduction, forecasting, and evaluation modules. In this system, a forecasting module based on an improved machine learning technique is proposed, which improves the generalization ability and robustness of the system. In addition, the key attributes and samples are selected by the proposed reduction module to further improve the forecasting performance from the two innovative perspectives. Moreover, an evaluation module is incorporated to comprehensively evaluate the superiority of the developed forecasting system. Data on the storm surge disasters from three typical provinces are utilized to conduct a case study, and the performance of the proposed forecasting system is analyzed and compared with eight comparison models. The experimental results show that the mean absolute percentage error (MAPE) predicted by the Extreme Learning Machine (ELM) model was 16.5293%, and the MAPE predicted by the proposed system was 1.0313%. Overall, the results show that the performance of the proposed forecasting system is superior compared to other models, and it is suitable for the forecasting of direct economic losses resulting from storm surge disasters.
Four portions are introduced in the section. The main issues are introduced in the first part, the second reviews the related literature and works, the third presents the main contributions, whereas the fourth provides the structure of this article.
Marine disasters caused by abnormal marine environments or extreme climate change have a significant impact on marine security, economic and social development, and clean production. However, storm surge disasters have resulted in a considerable threat to human life and production, causing the most serious impact. The China Marine Disaster Bulletin (China Marine Disaster Bulletin, 2020–2021) shows that the total loss due to marine disasters was about 11.64 billion in 2019 and 832 million in 2020, of which the direct economic losses caused by storm surge disasters account for 99.44 and 97.36%, respectively. The importance of research on the economic impact of storm surge disasters has recently become clear (Neumann et al., 2015; Guo and Li, 2020; Zhou et al., 2020). The rapid and accurate forecasting of losses caused by storm surge disasters can provide strategic decision support for the prevention and reduction of disasters, disaster situation warnings, and rescue management. However, due to the particularity and irregularity of natural disasters, it is difficult to rapidly and accurately forecast marine disaster losses. Therefore, the development of an appropriate method to model the economic losses caused by storm surge disasters is required, as this is widely considered a key concern in clean production (Yang et al., 2019a).
In disaster loss assessment and forecasting, scholars have mainly focused on earthquakes (Jena et al., 2020; Kim et al., 2020; Pulinets et al., 2021), tropical cyclones (Qi and Du, 2018; Sawant et al., 2019; Giffard-Roisin et al., 2020; Zeng et al., 2021), and floods (Zhi et al., 2020; Soltani et al., 2021), but few studies have been conducted on storm surge. With the background and impact of global climate change (Hao et al., 2021), the problem of marine disasters (Fang et al., 2017; Yan et al., 2020) is becoming increasingly obvious. Among the losses caused by marine disasters, storm surge disaster losses account for a large proportion, so it is necessary to pay attention to the research on storm surge disasters (Arns et al., 2015). Most studies have focused on storm surge and its forecasting methods (Sahoo and Bhaskaran, 2018; Ohz et al., 2020), but only few on direct economic loss assessment. Three methods are commonly adopted in this forecasting field. (1) In previous studies, physical methods were mainly used in data monitoring, early warning, and forecasting. Meanwhile, a large number of data were outputted to assist the research and the forecasting (Lakshmi et al., 2017; Nahornyi et al., 2021). Physical models employ meteorological information or related physical information as input, and require a great deal of historical information to judge the specific relationship between disaster sequences and physical information to perform forecasting. However, the amount of data comprising this information is large and difficult to obtain, and consequently forecasting is difficult. (2) Statistical methods such as autoregressive integrated moving average (ARIMA) and generalized autoregressive conditional heteroskedasticity (GARCH) have exhibited good results in solving low-dimensional weakly non-linear problems (Yi et al., 2021). However, disasters themselves are complex problems, whereas disaster loss assessment and forecasting are multi-dimensional and non-linear problems. The traditional statistical methods have obvious disadvantages. (3) In machine learning methods, machine learning algorithms have shown stronger ability to fit complex non-linear data, and, thus, have been highly regarded. Machine learning methods had been widely applied in some forecasting fields such as electricity price forecasting (Yang et al., 2022). Support-vector machine (SVM), extreme learning machine (ELM), and backpropagation neural networks (BPNN) are commonly used forecasting methods. Xiong et al. (2018) successfully improved ELM to predict the seasonal price of vegetables. Liu et al. (2020) proposed a combined model using self-organizing map (SOM), kernel principal components analysis (KPCA), and an SVM to classify and to forecast the patent quality in the biomedical industry. Li et al. (2021) proposed the gray-BPNN model to predict the grain output of Henan Province. These three methods have been proposed to form different models for forecasting, such as single model, hybrid model (Sahin, 2019; Wang et al., 2019b; Yang et al., 2019b), combined model (Niu and Wang, 2019; Wang et al., 2019a), and ensemble model (Hao and Tian, 2019).
In the field of marine disaster forecasting, single models have been widely proposed. Wang et al. (2021) proposed GIS and open data to quantitatively evaluate the storm surge and to estimate the direct physical losses. Yin et al. (2017) established a gray relational model based on the panel data dispersion, which was applied to the study of storm surge disaster losses in the coastal areas of China. Hybrid models have been widely proposed in the field of disaster forecasting. Young et al. (2017) combined the traditional physical hydrological simulation method with the SVR to form a hybrid forecasting model in predicting the hourly runoff of Chishan River Basin in southern Taiwan. Compared with the physical hydrological model, ANN, SVR, and two hybrid models (HEC-HMS-ANN, HEC-HMS-SVR) which were based on a hydrologic modeling system, the novel model exhibited some advantages, especially a higher accuracy in long-term forecasting. However, the individual model research methods on the economic impact of disasters are relatively inaccurate. The combination model was developed to improve the forecasting accuracy. Chen et al. (2018) introduced a new combined model method to forecast disaster losses caused by tropical cyclones, hence, using the model combination method, GA-Elman neural network, SVR, and GRNN were combined into a comprehensive evaluation model. The results showed that their proposed model performed better than the single model. Feng and Liu (2017) established an index system with gray correlation analysis. Compared with the single model, the combined model of BP and SVM was proposed to better forecast the direct economic losses and the number of populations affected by storm surge. Zhao et al. (2020) combined the results of ENN and GRNN with a definite integral to achieve interval forecasting, and obtained a large number of high-precision results of the annual storm surge disaster economic losses. At present, ensemble models are widely proposed to reduce bias and to improve forecasting accuracy (Liu and Xu, 2020; Bravo and Ayuso, 2021), but the application of this model in the field of marine disaster forecasting remains rare (Ding et al., 2020). Zhao et al. (2019) proposed an ensemble learning model called Adaboost-BPNN which is designed to forecast direct economic losses of marine disasters. Considering the interaction between pressure, topographic constraints, and the resonant characteristics of the basin, Žust et al. (2020) proposed an integrated sea level forecasting method called HIDRA. In the field of direct economic losses of storm surge disasters forecasting, those methods have been developed gradually, but they ignore the significance of attributes and of sample reduction, as well as the model optimization.
Therefore, with the goal of exceeding the limitations of the above-mentioned models and methods, a novel hybrid forecasting system is proposed herein to forecast the direct economic losses of storm surge disasters. In contrast to most of the previous studies, it improves the forecasting performance by considering the complexity of the loss factors and the similarity of data. More specifically, the system consists of three modules, including a reduction module for data processing, a forecasting module, and an evaluation module. Specifically, the key attributes in the economic loss assessment attribute set of storm surge disasters are selected by the reduction module to obtain the optimal input of each sample. Subsequently, the forecasting module is designed to obtain the forecasting loss results for each storm surge disaster based on the optimal input. Afterward, the evaluation module comprehensively evaluates the performance of the developed forecasting system. To test the feasibility and the superiority of the forecasting system, real data samples of direct economic losses of storm surge disasters from 1989 to 2019 were collected for numerical experiments. The experimental results showed that the proposed approach exhibited good performance, which was superior compared to that of other models, and it is suitable for the forecasting of direct economic losses resulting from storm surge disasters in practical applications.
The main contributions of this study are summarized as follows:
(1) Modeling of direct economic losses of storm surge disasters is achieved by a novel hybrid forecasting system. Previous studies have mainly focused on improving the forecasting performance by introducing different individual models, which ignored the potential forecasting power of a hybrid modeling. Therefore, a novel hybrid forecasting system is proposed, which can bridge the research gap in current studies.
(2) An advanced reduction module is proposed to simultaneously obtain the key attributes and samples. Reduction is an effective method to improve forecasting performance. However, it is ignored by majority of the previous studies. Therefore, in this study, we combine rough sets with a SOM, reduce the samples after attribute reduction, and horizontally and vertically process the data to improve the forecasting accuracy of the system.
(3) A Forecasting module based on an improved machine learning technique is proposed to improve the generalization ability and robustness of the system. The advanced machine learning technique, named as ELM architectures, has, thus, long been ignored in modeling of direct economic losses from storm surge disasters, despite its superiority in other forecasting fields. Hence, the forecasting module is developed based on an improved ELM to further improve the performance of the forecasting systems.
The remainder of this article is organized as follows. Section Detailed Process of the Developed Hybrid Forecasting System introduces the reduction module and forecasting module, respectively. In section The Direct Economic Loss Forecasting System, the direct economic loss forecasting system is presented. The experimental setup and a summary of the results are shown in sections Experiments and Summary. Section Conclusions and Future work generalizes the conclusions and suggests some possible directions for future research.
The hybrid forecasting system based on intelligent algorithm is successfully developed, which includes three modules: reduction module, forecasting module, and evaluation module.
In the process of forecasting the direct economic losses caused by regional storm surge disasters, many indicators affect the data. Varying time intervals of storm surge have different contributions to each other, and various factors have different effects on the loss results. Therefore, the processing of sample data and the selection of storm surge samples affect the accuracy of the forecasting results. The reduction module is applied to simultaneously reduce the indices and samples, so as to identify the key indices affecting the loss values and to select the samples with a strong forecasting correlation. Accuracy is also improved by an effective dataset.
To maintain the integrity and validity of the index system, the availability and accuracy of storm surge disaster loss data should be considered. By combining frequency statistics with theoretical analysis of disaster economic loss assessment (Yin and Sun, 2011; Yin et al., 2011), an economic assessment of the index system of storm surge disasters was constructed, and the initial attribute set of the module was formed. Attribute classification and spatiotemporal clustering were carried out for factors under the four dimensions of the risk of disaster-caused factors, economic loss index, vulnerability to hazards, and the adaptability of storm surge disasters. The initial attribute set is composed of 19 factors that affect the economic losses caused by storm surge disasters, as shown in Figure 1.
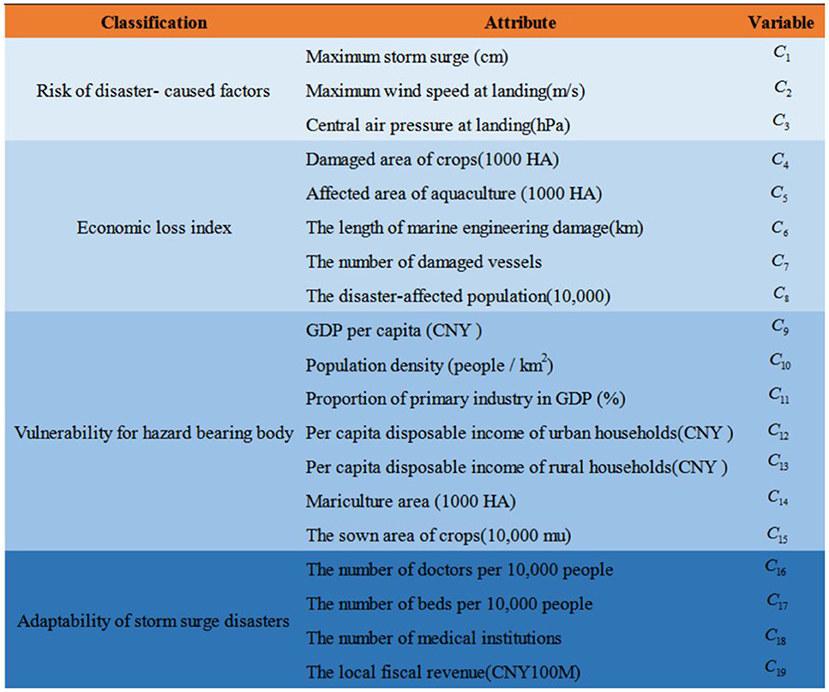
Figure 1. Attribute set for economic loss assessment of storm surge disasters.
The choice of rough set theory as a tool for feature selection is based on two considerations. First, rough set theory does not require a priori knowledge and the mathematical technology is mature. Second, a rough set theory can directly analyze and infer data so as to discover the hidden knowledge between the data and to reveal potential patterns. Thus, it is an effective method of knowledge discovery.
Definition 1. In Pawlak's rough set (Pawlak, 1982) attribute reduction theory, an equivalence relation is central and primitive. The theory begins with the notion of an information system, which is considered as IS = (U, AT, g, V), where is a non-empty set of finite objects, U = {x1, …, xi, …, xn}, it is called the universe. AT is a non-nullable collection of attributes. The information function isg : U × AT → V, which expresses the value of xi under a, that is g(xi, a) ∈ Va(a ∈ AT, xi ∈ U), Va is the domain that attribute what a may take.
Definition 2. Given anyA ⊆ AT, there is an indiscernible relation IND(A) on U.
If(xi, xj) ∈ IND(A), then and cannot be discernible by attributes from A. Generated by IND(A), the partition of is denoted as
With regard to attribute set AT, [Xi]A are equivalent classes of indiscernible relation, which can describe arbitrary subsets of U. The equivalence classes of IND(A) and the empty set ∅ are the base sets in the information system IS.
Definition 3. Let X ⊆ U, it may not be represented exactly and clearly in U. One can describe an arbitrary subset X by a pair of lower and upper approximations. They are defined, respectively, as
The pair is termed as the rough set of X in regard to the set of attributesAT.
Definition 4. Let A and B be the two equivalence relations over U. Then the regions of B: positive region, negative region and boundary region can be defined as, respectively,
Definition 5. An information system is called a decision system if the collection of attributes AT can be divided into condition attribute set A and decision attribute set B. In order to clearly illustrate these mathematical definitions, an example will be employed to explain the principle. In this case, four conditional attributes (a, b, c, d), one decision attribute e, and eight objects are represented in Table 1.
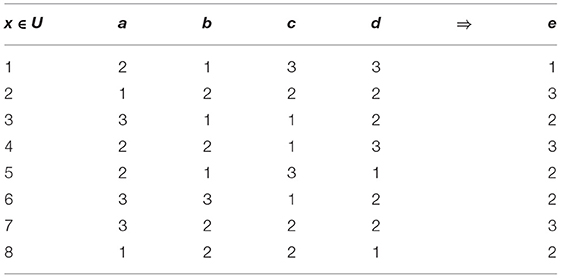
Table 1. Example dataset.
In the system, one of the significant matters in data analysis is to find the dependency relationship between attributes. The dependency between A and B can be defined in the following way:
If γA(B) = 1, B depends totally on A, if 0 < γA(B) < 1, B depends partially on A, and if γA(B) = 0, then does not depend on A.
For example, if A = {b, c} then objects 2, 7, and 8 are indiscernible, 1 and 5 are indiscernible. The partition of U can be shown as
IfA = {b, c}and B = {e}, then
It follows that in attribute set A, objects 3, 4, and 6 can definitely be classified as one class for attribute e. The rest of the objects, however, cannot be classified.
Hence, The dependency of {e} from {b, c} is
Definition 6. Given A, and an attribute a ∈ A, the significance of the attribute a is defined as
The more the dependency changes, the more important the attribute becomes. If the significance is 0, that means POSA(B) = POSA−[a](B), then the attribute is dispensable. Otherwise, a is said to be relatively indispensable in A. In E, if every attribute is relatively indispensable and POSE(B) = POSA(B), So is called a relative reduction in condition attribute set A.
For example, if A = {a, b, c} and B = {e}, then
so the significance of a, b, c is calculated as follows:
Hence, attribute a is relatively indispensable, while, attribute b and c can be dispensable. By experimenting, the final relative reduction can be built.
On the basis of the data, the features of storm surge disaster direct economic losses. The SOM is put forward to classify the samples automatically. The samples with high correlation degree are gathered and retained, while the samples with low correlation degree are separated and removed to achieve a sample reduction.
Definition 1. Self-Organizing Map (Kohonen, 1990) is an unsupervised learning method, which can reduce the dimension of an n-dimensional input space X to a two-dimensional output plane, thus, forming a topology of M neurons. The weight vector Wi(i ∈ 1, …, M) represents each neuron, which is an n-dimensional vector related to the input samples. The SOM system schematic is described in Figure 2.
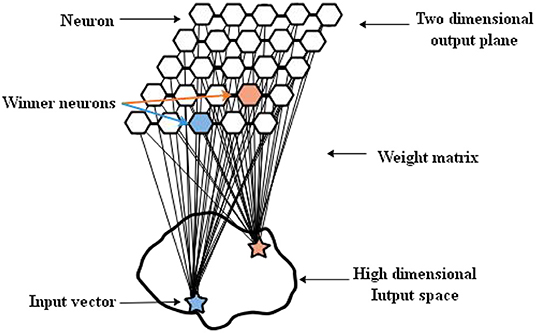
Figure 2. The Self-Organizing Map (SOM) system schematic.
Definition 2. In the initial stage, the weight of neurons is varied to initialize the network with different topologies. When the input vectors are sent through the SOM neural network, each neuron varies its position by calculating the distance between the weight and the input vector. At time step t, a new input sample X(t) is presented to SOM, and a winner neuron is stated:
Then, the weight vectors are updated,
where η(t) is a decaying learning rate and Ψ(i, WX(t)) is called the neighborhood function,
σ2(t) is the neighborhood radius, ||WX(t) − Wi|| is the Euclidean distance between the neurons. After repeated iterative training, the similar weight vectors are close, can even be clustered, while the dissimilar weight vectors are separated.
The prediction module mainly adopts the Marine Predators Algorithm (MPA) to optimize the ELM. The MPA (Faramarzi et al., 2020) was developed as a novel meta-heuristic algorithm, which is primarily modeled on ocean predators to select an optimal foraging strategy according to the prey location. In the forecasting module, the position of the predator is represented by the multi-dimensional vector composed of input weights and hidden layer thresholds, which can determine the performance of the ELM. Then, the optimal parameters are obtained based on the optimization criteria. These two theoretical principles will briefly introduce the following.
Definition 1. Extreme learning machine (Huang et al., 2004) was proposed as an easy-to-use and effective single hidden-layer feedforward neural network method. Instead of iteratively adjusting the weights and biases of the network, the hidden layer parameters are assigned randomly, and the least square method is proposed to generate the unique optimal solution. Therefore, it has the advantages of fast training speed, avoiding over fitting, and local optimization to a certain degree.
Definition 2. Given the original training dataset (xj, tj), where xj is the input variables, , and tj is the output variables, . D is the number of hidden neurons. The output matrix of ELM is shown as follow:
where is the output weights matrix between the ith hidden neuron and the output layer nodes, g(·) is the activation function of the hidden layer, is the input weight matrix that connects the ith hidden layer node and input layer nodes, and bi is the bias of the ith hidden layer node.
The above-mentioned matrix can be indicated as below:
where H is the hidden layer output matrix:
Definition 3. In the training dataset, the inputs samples and its corresponding targets are already given. The input weight matrix a and bias b can be given randomly, then the output weight matrix β can be calculated by Moore-Penrose generalized inverse to get its least square solution:
where is called the Moore-Penrose generalized inverse of matrix. Then the orthogonal projection approach is taken to calculate H+that is H+ = HT(HHT)−1.
The network architecture of ELM is displayed as (Figure 3).
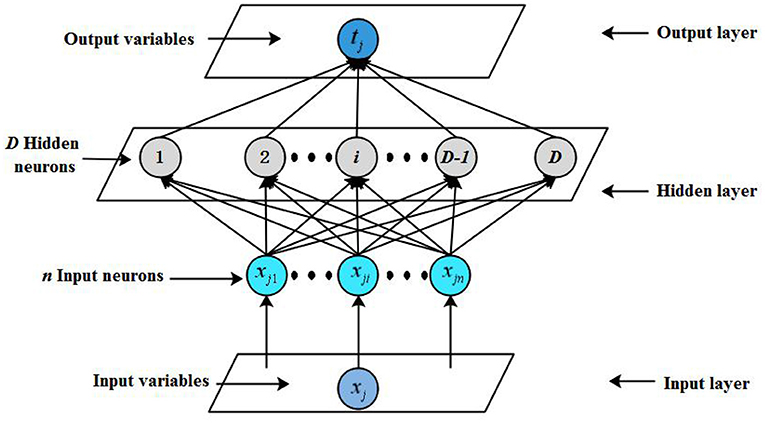
Figure 3. Network structure of extreme learning machine (ELM).
As mentioned above, the input weight matrix a and bias b are the two crucial parameters that are presented in ELM.
According to the theory of “survival of the fittest,” the predator determines the optimal strategy ensuring a reasonable contact rate with the prey. The MPA starts from the initial stage of the population, then goes through the three optimization stages considering different speed ratio and simultaneously simulating the whole life cycle of the predator and prey.
Definition 1. At initialization stage, the initial populations for both the prey and the predator can be randomly located in the search space via the following mathematical expression:
where lb and ub are the lower and upper boundaries for variables, and rand*is a random number in the range of 0–1. According to the formula 14, the initial location matrix of prey can be established, as below:
In Equation (17), n is the number of search agents, while d is the number of dimensions.
Definition 2. Inspired by the concept of survival of the fittest, the first-class predators have the best foraging techniques. Therefore, when establishing the Elite matrix, the fittest population is selected as the first-class predator. On the basis of the location information of the prey, the digit group of the elite matrix is updated by searching and finding the quarry. At the end of each iteration, if the first-class predator was replaced by a better one, the Elite matrix would be altered.
Definition 3. In the initial iteration stage of optimization, , (Iter is the current iteration, Max_Iter is the maximum one), the prey searches for food in the exploration field, while the predator chooses the optimal strategy of immobility. Therefore, the location of the prey is determined by the following equations.
where RB indicates a vector including random numbers (based on the normal distribution of Brownian motion), ⊗ represents entry-wise multiplications. The P = 0.5. is a constant number and R ∈ [0, 1] is a random number coming from a uniform distribution. The multiplication of RB and prey imitates its movement.
Definition 4. In the intermediate iteration stage of optimization, , not only do the prey and predator change their positions to seek food, but they also move at the equal velocity. The population is divided into two parts. The first part (i.e., prey) of the agents is allocated for exploitation, and the second half (i.e., predator) is in charge of exploration. Equation (21) imitates the movement of the first half of the population.
where RL represents a random number vector based on the Lévy distribution. The multiplication of RL by prey emulates the motion of prey, while the second half of the agents perform the following equations. The second half of the population is represented by the following mathematical formula:
where CF is the adaptive parameter that controls the step size for the predator motion.
Definition 5. In the final iteration stage of optimization, , the speed of prey is slower than that of predator. The predator adopts exploitation strategy based on Lévy migration and its location is updated as follows:
Definition 6. Faramarzi et al. believed that the external environmental factors make the behavior of the population change more or less, such as the eddy formation or Fish Aggregating Devices (FADs) effects. In order to avoid the local optimization, longer jumps should be considered in the simulation process. Hence, Equation (27) shows the mathematical model of the FADs effects,
In Equation (27), where FADs represent the probability of affecting the search process and is set equivalent to 0.2, and M is the binary solution (0 or 1) corresponding to the stochastic solution. If the array is <0.2, the array is altered to zero. If the array is >0.2, the array is converted to one. The notation r ∈ [0, 1] defines a random number. The r1 and r2 are the random indices of the prey.
Definition 7. An important feature of marine predators is that they have a specific memory of their successful foraging position. In MPA, this feature is simulated by saving the optimum solution of the previous iteration, and the performance of each solution of the current iteration is compared with the previous one. If it is better, the previous solution will be replaced, which is helpful for fast optimization.
The MPA has a good ability of optimization. The input weight matrix and bias b of ELM are optimized. The forecasting module is constructed. The loss of training set is considered as the fitness function of MPA, and the calculation is shown in Equation (28),
where Y is the actual value and Ŷ is the predicted value.
The pseudo code of forecasting module is described as follows:
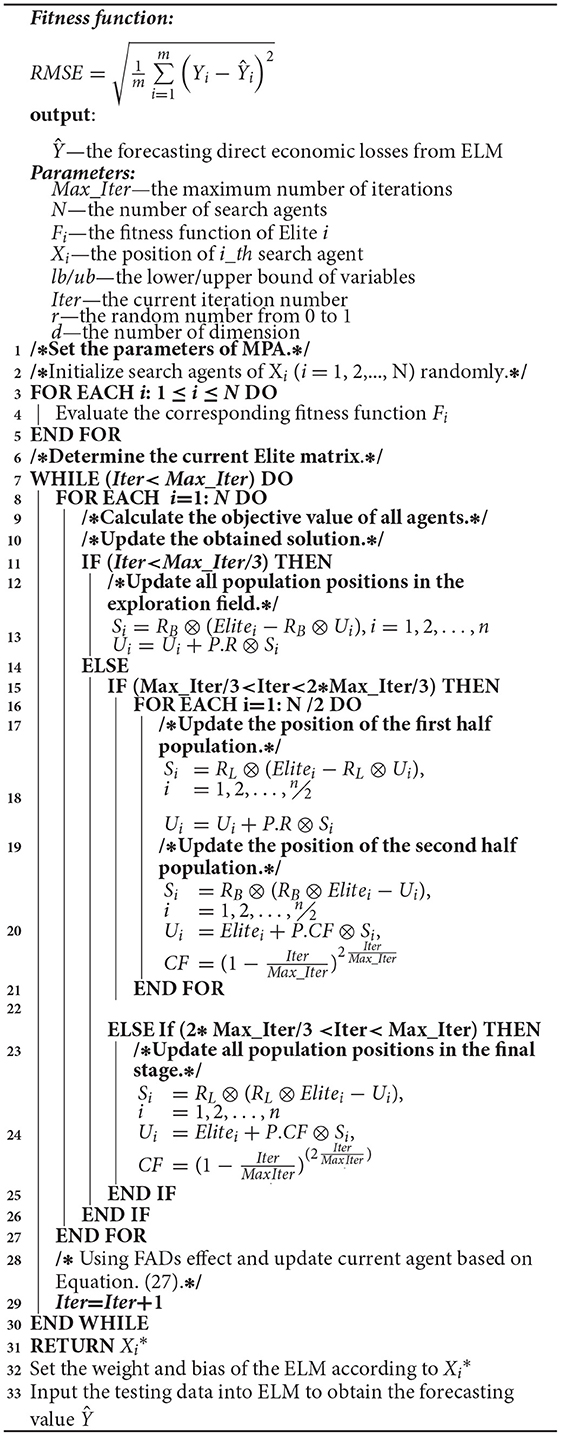
Algorithm 1. MPA-ELM
The flowchart of forecasting module is shown in Figure 4, the steps can be summarized as the following:
Step 1: Initialize positions for the prey and the predator, construct the matrices of prey and Elite according to Equations (17) and (18), and accomplish a memory saving. The position coordinates of each predator are composed of parameters a and b.
Step 2: Select the best predator. On the basis of the location information of the prey and the previous memory of predator to capture its food successfully, the best predator matrix is assigned.
Step 3: Determine the update criteria according to the range of Iter. If , the process is in the stage 1, execute Step 4, otherwise, execute Step 5.
Step 4: Update the solutions based on Equations (19) and (20), and then skip to Step 8.
Step 5: If , the process is in the stage 2, execute Step 6, otherwise, the process is in the stage 3,execute Step 7.
Step 6: Update the positions of the prey and predator based on Equations (21–24). The first half part performs Equations (21) and (22), and the other half follows Equations (23) and (24), and then skip to Step 8.
Step 7: Update the positions of the prey and predator based on Equations (25) and (26), and then skip to Step 8.
Step 8: Apply the model of the FADs effects using Equation (27), and then skip to Step 9.
Step 9: Evaluate the objective function, and then skip to Step 10.
Step 10: Determine whether the termination condition is satisfied. If it is met, the program ends, and the best position parameter is the output. Otherwise, skip to step 2.
Step 11: Obtain the optimal ELM.
Step 12: Calculate the error, output the predicted result.
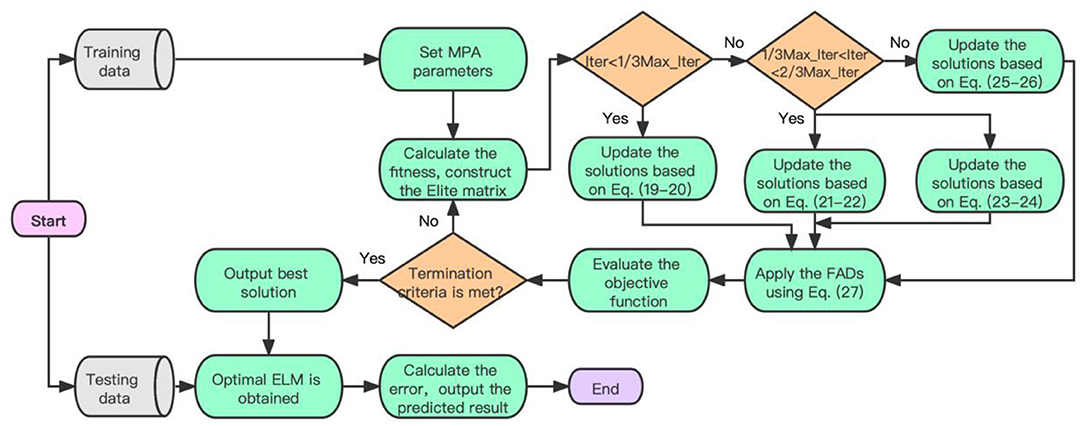
Figure 4. The flowchart of marine predators algorithm (MPA)-ELM forecasting module.
In order to evaluate the effectiveness of the proposed system, an evaluation module is provided. There is no unified standard to confirm the validity of various models. Therefore, by consulting the relevant literature in the field of prediction (Wang et al., 2018; Gu et al., 2021), a variety of error metrics are adopted in this paper, including mean square error (MSE), mean absolute error (MAE), and mean absolute percentage error (MAPE), PMSE, PMAE, and PMAPE, as shown in Table 2. Where m represents the number of testing data, A and F represent the collected and predicted economic losses data, respectively. The is the average value of the actual data, and is the average value of forecasting results. Specifically, MSE, MAE, and MAPE can be considered to evaluate the forecasting accuracy, and the smaller value of these indicators shows better forecasting performance. Performance improvement percentage indicators namely PMSE, PMAE, and PMAPE further evaluate the improvement between different models to quantitatively describe the degree of performance improvement. The evaluation module evaluates the forecasting accuracy, the degree of performance improvement, and the forecasting ability of the system. In summary, six indicators are selected, which can focus on a comprehensive scientific evaluation.
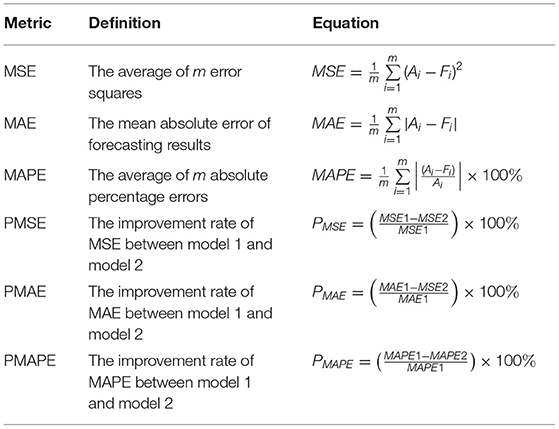
Table 2. Performance metric rules.
A new hybrid forecasting system RS-SOM&MPA-ELM is proposed for the prediction of the direct economic losses caused by storm surge disasters. Figure 5 illustrates the hybrid forecasting framework of our proposed new hybrid approach. The proposed hybrid approach is generalized as given below:
Step 1: Data collection and processing. Before being input to the model, the data is processed into a pattern that meets its requirements, including data normalization, discretization, and processing of the training format. At the same time, the data set is divided into training data set and testing data set.
Step 2: Attribution and sample reduction. Rough sets are proposed to reduce initial attributes, and the key features affecting the direct economic losses are selected. The decision table, composed of normalized and discretized data sets of direct economic loss factors of storm surge disasters, is reduced by positive region reduction rules and by dependency reduction rules. Then, according to the features extracted from RS, disaster-related parameters of several storm surge are input into the SOM as the initial training set. Subsequently, sample sets that contribute to improving prediction performance are selected as the new training set.
Step 3: The MPA optimization. First, the parameters of ELM are initialized. Second, ELM is embedded into the MPA for calculation, including the input weight and the bias update. Finally, after the embedded model training is completed, the algorithm judgment conditions are checked to determine whether the maximum iteration times has been satisfied. If the requirement is met, the optimized parameters are output, otherwise, repeat the above process.
Step 4: Final system performance test. After the completion of the third step, the optimized model is obtained, the test data set is input into the forecasting module. Then, the result is output, and the forecasting performance is tested.
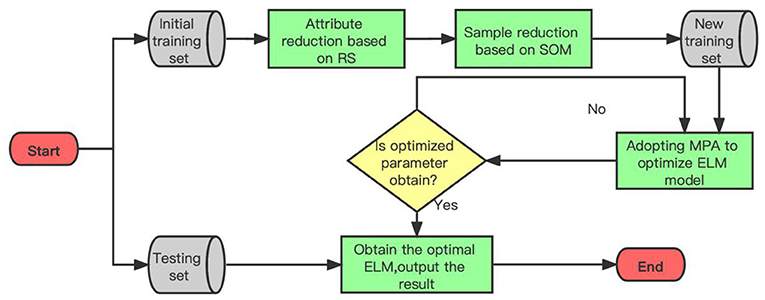
Figure 5. The forecasting framework of forecasting system.
To verify the superior performance of the system and to ensure the diversity of data, experiments were carried out on the data of three provinces. The experimental environment is macOS 10.14.6, on a system with an Intel(R) Core CPU (Core-i5 2.6 GHz), and 8 G RAM. Different tools were used to implement the methods of this paper. Rough sets were implemented in Python 3.8.3, and all the other models were implemented in the MATLAB R2016b software package.
This study involves 19 variables, including 18 characteristic variables of attribute sets and direct economic losses of storm surge disasters. This paper selected 60 relatively complete records of storm surge disasters in Guangdong, Zhejiang and Fujian provinces from 1989 to 2019 as the research objects (Because there are no complete storm surge samples collected in 2020 and 2021, the selected samples extend to 2019). To ensure the validity and dependability of the data, the relevant data obtained are from the public sources in Table 3.
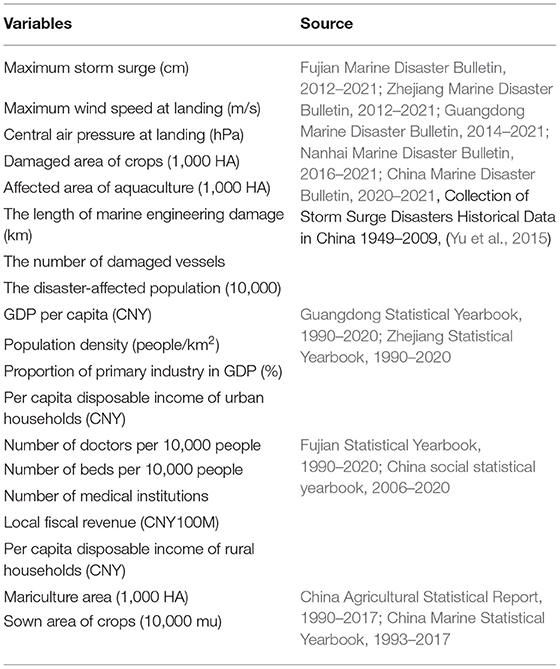
Table 3. Data sources.
Each sample in the original data table has 19 different attributes, and each attribute represents different meanings about the economic losses caused by storm surges disasters, including data about the natural attributes of storm surges and information about the affected areas. Each group of data has different dimensions. To eliminate the dimensional influence between indicators and to speed up the training speed, the general data processing method should be the normalization before entering data into the model. The normalization calculation method is shown in Equation (29), where xj is the input data of the j-th node in the input layer of the model, xmax and xmin are the maximum and minimum values of the input sequence, respectively, and is the normalized data with the range of [0, 1].
To reduce the attributes based on rough set theory, it is necessary to initially discretize the data. The sample variables are divided into several intervals, and each interval is regarded as a category. This process of categorizing data variables is often called discretization. All values within each category are mapped to the same value, converting the actual value to a numeric attribute of the symbol. The equal distance partition algorithm is proposed for discretization. After discretization, the original decision table is replaced by a new decision table of numerical attributes.
To verify the effectiveness and robustness of the developed prediction system, two experiments will be done, denoted as Experiment I: compared with the traditional single models, Experiment II: compared with the improved hybrid models.
To verify the superiority of the proposed RS-SOM&MPA-ELM forecasting system in predicting the economic losses caused by storm surge disasters, some forecasting models are selected as comparison models. Therefore, the single neural network algorithm models, different hybrid models, and different optimization algorithm-based models are considered. To sum up, eight comparative models are established to evaluate the developed hybrid forecasting system. These comparison models are listed in Table 4.
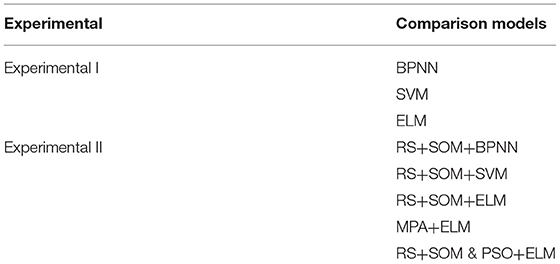
Table 4. Comparison models.
To ensure the fairness of the comparison between the models, the basic parameters of each algorithm are set according to the default values. To ensure fairness, some parameter settings in the original literature are maintained for competing models, while some parameters are shared. For example, the number of iterations or the frequency of training of all models is set to 50, and each model was performed 250 times to output statistically stable results. To judge the number of SOM clustering categories, two, three, and four values are selected to do the experiment. The results show that 60 samples are classified according to the occurrence time. To reflect the classification features to the greatest extent and to ensure the sufficient number of samples, the optimum clustering numbers of SOM is determined as 2. The BPNN and ELM adopt Sigmoid function as the activation function. The Radial Basis Function is adopted in SOM and SVM as kernel function. The regularization parameter C and kernel parameter in all SVM-based comparison models are searched in grid ranges of [2−8, 28] and [2−5, 25] with step 0.5. The specific experimental parameters are shown in Table 5.
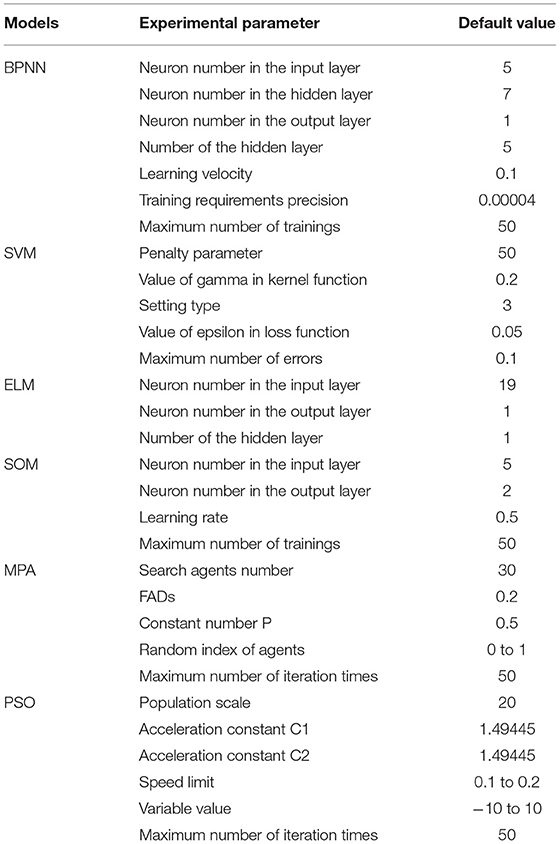
Table 5. Experimental parameter values.
Moreover, due to the uncertainty of the occurrence of storm surge disasters and the incompleteness of statistical data, the economic loss forecasting of storm surge disasters exhibited the characteristics of small sample size. In the proposed system and comparison models, two groups of data are proposed as the testing set, which are the economic loss samples of regional storm surge disasters in 2019 and 2018. At the same time, two storm surges are coded sequentially: the first sample and the second sample. The remaining samples constitute the initial training data set. The SOM is proposed to, respectively, select the corresponding new training set for the samples. The results are as follows. The new training set of the first sample is from sample 35 to sample 59, whereas that of the second sample is from sample 34 to sample 58. Subsequently, for the five attributes selected by RS, the test and error test should be carried out by minimizing the MAE and the MAPE of the training set to verify whether all of them are input. The results show that in the training set of test samples, regardless of which of the five factors selected by RS is removed, good performance is not obtained. Hence, five attributes are determined as the input of forecasting module.
In Experiment I, three single models are adopted for forecasting through the comparison of performance forecasting standards, where BPNN and SVM are the most popular machine learning models. The ELM is the method related to the forecasting model that we use. Researchers have shown that these models have good performance in forecasting. All the performance metrics of each single model are shown in Table 6.
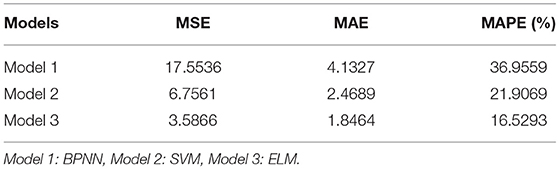
Table 6. Forecasting performance of comparison models.
For the direct economic losses forecasting, in terms of the comparison among the results of single models, ELM has the best forecasting performance, followed by SVM and BPNN. The difference of calculation results of the three models shows that the ELM for this kind of structure is more suitable for the considered problem. Therefore, it is selected as the basic forecasting module of the proposed forecasting system. Although ELM results are better than the other two models, the forecasting results of single model are not ideal.
In Experiment II, a series of hybrid methods are selected to apply to multi factor forecasting. Taking proposed forecasting method ELM as an example, the first type of hybrid approaches only employed the forecasting module (MPA-ELM), the second type of hybrid approaches only conducted a reduction operation (RS+SOM+ELM), whereas another type of hybrid approaches only changed the optimization algorithm for the proposed model (RS+SOM&PSO+ELM).
After attribute reduction on the basis of RS, five attributes are obtained: the length of marine engineering damage C6, the disaster-affected population C8, proportion of primary industry in GDP C11, mariculture area C14, and the number of beds per 10,000 people C17. Through SOM neural network training, according to the occurrence time of storm surge, 60 storm surge samples are divided into two groups: one group comprised of 32 storm surges from 1989 to 2008, and the other group comprised of 28 storm surges from 2008 to 2019. The recent storm surges were selected as the testing samples, and the storm surges samples from 2008 to 2017 were selected as the training set.
After training, the parameters of the proposed model and other models for forecasting are obtained. The MSE, MAE, and MAPE [Equation (24)] are used as indices to evaluate the forecasting performance. To ensure the reliability and stability of forecasting results, considering the inherent randomness of MPA and ELM, these models run 250 times, and the average forecasting value is taken as the final result.
The comparison between the results obtained by the above hybrid models and by the actual values is shown in Table 7. The MSE, MAE, and MAPE for the predicted values of each model are listed in Table 8. The IR between different approaches is presented in Table 9. The results of the tables also demonstrate the following:
(1) The experimental results show that the forecasting performance of all hybrid models is better than that of the single models.
(2) The proposed system significantly outperformed all models compared in terms of level of accuracy for the forecasting of direct economic losses caused by storm surge disasters. This verifies that the proposed forecasting system is an effective tool for forecasting direct economic losses caused by storm surge disasters, with the lowest MSE, MAE, and MAPE of 0.0133, 0.1154, and 1.0313%, respectively.
(3) Table 9 displays the contribution of reduction module operation in attribute reduction and sample selection, in which Models 1, 2, and 3 represent BPNN, SVM, and ELM, respectively, and Models 5, 6, and 7 refer to approaches that, respectively, combined RS-SOM with the above models. For each corresponding group, Models 5–7 outperformed Models 1–3, respectively, according to the positive IR values. Through the positive PMAPE and PMAE criteria, the results clearly show that the models with the reduction module obtained higher levels of forecasting accuracy, which indicates that reduction module is very helpful to improve forecasting performance. Thus, it is particularly significant to master the features and preprocess the data.
(4) The performance of the models with the optimization algorithm is better than other models, which proves that the optimization algorithm can significantly improve the forecasting ability and stability of the model. Among them, the model with MPA algorithm is better in forecasting performance, and the optimization time is relatively short.
(5) The forecasting performance of model 9 is improved compared with models 5 and 6. The performance of the models with forecasting module is better than that with other forecasting models. In general, BPNN and SVM showed strong performance in the forecasting field in the past, but poor performance in this research framework. This is primarily due to the characteristics of the disaster loss data, small sample problems, and the instability of forecasting results. The stability and forecasting performance of the system RS-SOM &MPA-ELM proposed in this paper is superior to that of the existing methods.

Table 7. Predicted results of testing set.
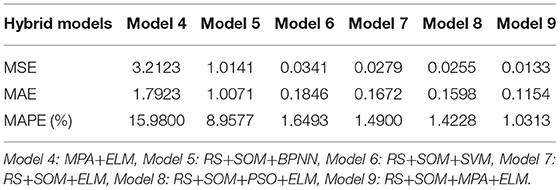
Table 8. Forecasting performance of hybrid models.
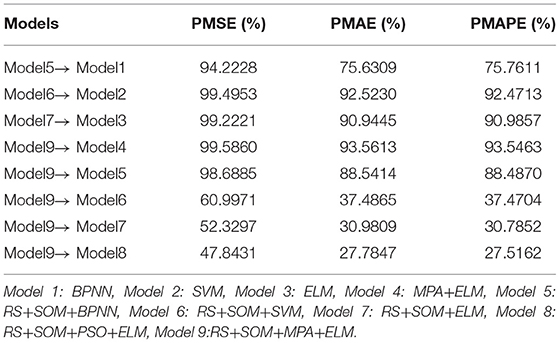
Table 9. IR between different approaches.
According to the performance comparisons of both single models and hybrid models above, it is obvious that the forecasting results of RS-SOM&MPA-ELM are better than other models. Moreover, the forecasting performance of hybrid models is better than that of single models. In addition, some interesting phenomena are found during the study, as noted briefly below:
(1) The results of hybrid models are better than those of single models, and these single models cannot directly obtain satisfactory results. The main factors that affected the forecasting results are the redundancy and the non-linearity of the original influence factors. It is necessary to preprocess the direct economic loss factor table of storm surge disasters, so as to further improve the forecasting accuracy.
(2) In the contrast experiment, with or without RS-SOM, the forecasting results of the models with RS-SOM are better than those without RS-SOM. The RS can remove the redundant factors and screen out the key factors to improve the accuracy of forecasting. When the samples are clustered by SOM, there is a significant correlation between the sample classification and the occurrence time of storm surges. Other samples within 10 years (including 10 years) from the occurrence time of forecasting samples are more relevant to their data. This paper attempts to explain the reasons for this result: if the time interval between the two storm surges is longer, the gap between the industrial structure, economic level, forecasting technology level, and social management level is larger. The items causing economic losses are also different. On the contrary, the closer the occurrence time is, the higher the similarity of samples will be.
(3) In this work, risk of disaster-caused factors are not selected as critical factors, and different factors are chosen in other papers. Different methods and different samples lead to different choices, but the forecasting performance of the proposed approach is good, which verifies the rationality of the factor selection. However, it can be considered that different feature selection methods can be proposed for cross-validation in future work.
(4) Compared with the comparison models, the new forecasting system can obtain better accuracy in the forecasting of direct economic losses caused by storm surge disasters. The data presents the characteristics of small samples. Therefore, the forecasting system can be applied to other areas for small sample forecasting, such as economic loss forecasting for ice disasters, red tides, tsunamis, and other disasters, short-term time series forecasting, and so on.
(5) Although the proposed hybrid model has been verified to have a good forecasting ability in the small sample forecasting of economic losses caused by storm surge disasters, it still has some limitations and needs to be improved. First of all, in terms of data, the collection of economic loss evaluation index of storm surge disasters is limited by the practical difficulty, and the initial 18 index selection is subjective. Secondly, although the proposed optimization algorithm MPA improves the forecasting accuracy, it increases the forecasting time and the model complexity.
Storm surge disaster is the most serious source of marine disaster losses, which causes massive losses to coastal areas every year. Reasonable disaster loss assessment and forecasting help to carry out disaster management and reduce losses effectively. Therefore, direct economic loss forecasting of storm surge disasters has become an important topic. The proposed RS-SOM&MPA-ELM system is composed of three modules: one of which is the reduction module of RS-SOM, the second is the forecasting module of MPA-ELM, and the last is the evaluation module. The reduction module reduces the attributes and samples of the initial data simultaneously, to obtain the key input set of the forecasting module. In terms of model performance, the training set processed by reduction module performs better on single ELM model, the PMAPE can reach 90.9857%. The random allocation parameters of ELM are selected and optimized by MPA. Experimental results show that the performance of the system optimized by MPA is better than that of RS+SOM+ELM model. The improvement rate of MAPE between the models is 30.7852 %. Based on the data sets of storm surge disasters in Fujian, Zhejiang, and Guangdong, the proposed forecasting system is effective. The module is friendly to small sample forecasting, and the performance of the proposed system is better than other comparison models.
In the article, all the data are numerical data, while multi-source data can be added to the later system. At present, we focus on the samples under normal circumstances. In the future research, we would focus on the special sample data and pay more attention to huge disasters with extreme risks. It would be expected to establish a forecasting system with good performance for sparse samples.
The original contributions presented in the study are included in the article/supplementary material, further inquiries can be directed to the corresponding author/s.
HG: conceptualization, methodology, software, data curation, formal analysis, investigation, and writing–original draft. CH: conceptualization, visualization, supervision, writing–reviewing, and editing. KY: supervision, project administration, and funding acquisition. All authors contributed to the article and approved the submitted version.
This work was supported by Major Program of National Social Science Foundation of China (Grant No. 14ZDB151).
The authors declare that the research was conducted in the absence of any commercial or financial relationships that could be construed as a potential conflict of interest.
All claims expressed in this article are solely those of the authors and do not necessarily represent those of their affiliated organizations, or those of the publisher, the editors and the reviewers. Any product that may be evaluated in this article, or claim that may be made by its manufacturer, is not guaranteed or endorsed by the publisher.
The authors appreciate the valuable suggestions and objective comments made by the reviewers.
Arns, A., Wahl, T., Dangendorf, S., and Jensen, J. (2015). The impact of sea level rise on storm surge water levels in the northern part of the German Bight. Coast. Eng. 96, 118–131. doi: 10.1016/j.coastaleng.2014.12.002
Bravo, J. M., and Ayuso, M. (2021). Forecasting the retirement age: a bayesian model ensemble approach. Adv. Intell. Syst. Comput. 136, 123–135. doi: 10.1007/978-3-030-72657-7_12
Chen, S., Tang, D., Liu, X., and Chunhua, H. (2018). Assessment of tropical cyclone disaster loss in Guangdong Province based on combined model. Geom. Nat. Hazards Risk 9, 431–441. doi: 10.1080/19475705.2018.1447024
China Agricultural Statistical Report. (1990–2017). Available online at: https://data.cnki.net/trade/Yearbook/Single/N2019120059?z=Z009 (accessed August 2, 2021).
China Marine Disaster Bulletin. (2020–2021). Available online at: https://www.mnr.gov.cn/sj/sjfw/hy/gbgg/zghyzhgb/ (accessed June 2, 2021).
China Marine Statistical Yearbook. (1993–2017). Available online at: https://data.cnki.net/area/Yearbook/Single/N2019060088? z=D20 (accessed August 2, 2021).
China social statistical yearbook. (2006–2020). Available online at: https://data.cnki.net/yearbook/Single/N2021030171 (accessed August 2, 2021).
Ding, Y., Ding, T., Rusdin, A., Zhang, Y., and Jia, Y. (2020). Simulation and prediction of storm surges and waves using a fully integrated process model and a parametric cyclonic wind model. J. Geophys. Res. Oceans 125, e2019JC015793. doi: 10.1029/2019JC015793
Fang, J., Liu, W., Yang, S., Brown, S., Nicholls, R. J., Hinkel, J., et al. (2017). Spatial-temporal changes of coastal and marine disasters risks and impacts in Mainland China. Ocean Coast. Manag. 139, 125–140. doi: 10.1016/j.ocecoaman.2017.02.003
Faramarzi, A., Heidarinejad, M., Mirjalili, S., and Gandomi, A. H. (2020). Marine predators algorithm: a nature-inspired metaheuristic. Expert Syst. Appl. 152, 113377. doi: 10.1016/j.eswa.2020.113377
Feng, Q., and Liu, Q. (2017). Pre-assessment for the loss caused by storm surge based on the SVM-BP neural network. Mar. Environ. Res. 36:7. doi: 10.13634/j.cnki.mes.2017.04.021
Fujian Marine Disaster Bulletin. (2012–2021). Available online at: http://hyyyj.fujian.gov.cn/search/?key=%E6%B5%B7%E6%B4%8B%E7%81%BE%E5%AE%B3%E5%85%AC%E6%8A%A5. (accessed August 2, 2021).
Fujian Statistical Yearbook. (1990–2020). Available online at: http://tjj.fujian.gov.cn/xxgk/ndsj/ (accessed August 2, 2021).
Giffard-Roisin, S., Yang, M., Charpiat, G., Bonfanti, C. K., and Monteleoni, C. (2020). Tropical cyclone track forecasting using fused deep learning from aligned reanalysis data. Front. Big Data 3, 1. doi: 10.3389/fdata.2020.00001
Gu, B., Zhang, T., Meng, H., and Zhang, J. (2021). Short-term forecasting and uncertainty analysis of wind power based on long short-term memory, cloud model and non-parametric kernel density estimation. Renew. Energy 164, 687–708. doi: 10.1016/j.renene.2020.09.087
Guangdong Marine Disaster Bulletin. (2014–2021). Available online at: http://nr.gd.gov.cn/gkmlpt/search?keywords=%E5%B9%BF%E4%B8%9C%E7%9C%81%E6%B5%B7%E6%B4%8B%E7%81%BE%E5%AE%B3%E5%85%AC%E6%8A%A5 (accessed August 2, 2021).
Guangdong Statistical Yearbook. (1990–2020). Available online at: https://data.cnki.net/Yearbook/Single/N2020110011 (accessed August 2, 2021).
Guo, T., and Li, G. (2020). Study on methods to identify the impact factors of economic losses due to typhoon storm surge based on confirmatory factor analysis. Nat. Hazard. 100, 515–534. doi: 10.1007/s11069-019-03823-w
Hao, Y., Niu, X., Wang, J. I. (2021). Impacts of haze pollution on China's tourism industry: a system of economic loss analysis. J. Environ. Manage. 295, 113051. doi: 10.1016/j.jenvman.2021.113051
Hao, Y., and Tian, C. (2019). A novel two-stage forecasting model based on error factor and ensemble method for multi-step wind power forecasting. Appl. Energy 238, 368–383. doi: 10.1016/j.apenergy.2019.01.063
Huang, G-B., Zhu, K.-Y., and Siew, C.-K. (2004). “Extreme learning machine: a new learning scheme of feedforward neural networks,” in IEEE International Joint Conference on Neural Networks (IEEE Cat. No.04CH37541) (Budapest). doi: 10.1109/IJCNN.2004.1380068
Jena, R., Pradhan, B., Beydoun, G., Alamri, A. M., Ardiansyah, Nizamuddin, et al. (2020). Earthquake hazard and risk assessment using machine learning approaches at Palu, Indonesia. Sci. Total Environ. 749, 141582. doi: 10.1016/j.scitotenv.2020.141582
Kim, T., Song, J., and Kwon, O. S. (2020). Pre- and post-earthquake regional loss assessment using deep learning. Earthquake Eng. Struct. Dyn. 49, 657–678. doi: 10.1002/eqe.3258
Kohonen, T. (1990). The self-organizing map. IEEE. Proc Icnn. 1, 1–6. doi: 10.16/S0925-2312(98)00030-7
Lakshmi, D. D., Murty, P. L. N., Bhaskaran, P. K., Sahoo, B., Kumar, T. S., Shenoi, S. S. C., et al. (2017). Performance of WRF-ARW winds on computed storm surge using hydodynamic model for Phailin and Hudhud cyclones. Ocean Eng. 131, 135–148. doi: 10.1016/j.oceaneng.2017.01.005
Li, B., Zhang, Y., Zhang, S., and Li, W. (2021). Prediction of grain yield in Henan province based on grey bp neural network model. Discrete Dyn. Nat. Soc. 2021, 1–13. doi: 10.1155/2021/9919332
Liu, B., Lai, M., Wu, J. L., Fu, C., and Binaykia, A. (2020). Patent analysis and classification prediction of biomedicine industry: som-kpca-svm model. Multimedia Tool. Appl. 79, 10177–10197. doi: 10.1007/s11042-019-7422-x
Liu, W., and Xu, Y. (2020). Randomised learning-based hybrid ensemble model for probabilistic forecasting of PV power generation. IET Gener. Transm. Distrib. 14, 5909–5917. doi: 10.1049/iet-gtd.2020.0625
Nahornyi, V., Panda, A., Straser, V., and Pandova, I. (2021). Forecasting an vibration by monitoring the dynamics of changes its precursors of various physical nature. MM Sci. 2, 4396–4399. doi: 10.17973/MMSJ.2021_6_2021019
Nanhai Marine Disaster Bulletin (2016–2021). Available online at: http://scs.mnr.gov.cn/scsb/gbytj/list.shtml (accessed 2 August, 2021).
Neumann, J. E., Emanuel, K., Ravela, S., Ludwig, L., Kirshen, P., Bosma, K., et al. (2015). Joint effects of storm surge and sea-level rise on US Coasts: new economic estimates of impacts, adaptation, and benefits of mitigation policy. Clim. Change 129, 337–349. doi: 10.1007/s10584-014-1304-z
Niu, X., and Wang, J. (2019). A combined model based on data preprocessing strategy and multi-objective optimization algorithm for short-term wind speed forecasting. Appl. Energy 241, 519–539. doi: 10.1016/j.apenergy.2019.03.097
Ohz, A., Klein, A. H. F., and Franco, D. (2020). “A multiple linear regression-based approach for storm surge prediction along South Brazil,” in Climate Change, Hazards and Adaptation Options, eds W. Leal Filho, G. Nagy, M. Borga, P. Chávez Muñoz, and A. Magnuszewski (Cham: Springer), 27–50. doi: 10.1007/978-3-030-37425-9_2
Pulinets, S., Krankowski, A., Hernandez-Pajares, M., Marra, S., Cherniak, I., Zakharenkova, I., et al. (2021). Ionosphere sounding for pre-seismic anomalies identification (inspire): results of the project and perspectives for the short-term earthquake forecast. Front. Earth Sci. 9, 610193. doi: 10.3389/feart.2021.610193
Qi, P., and Du, M. (2018). Multi-factor evaluation indicator method for the risk assessment of atmospheric and oceanic hazard group due to the attack of tropical cyclones. Int. J. Appl. Earth Obs. Geoinf. 68, 1–7. doi: 10.1016/j.jag.2018.01.015
Sahin, S. (2019). Forecasting of Turkey's greenhouse gas emissions using linear and nonlinear rolling metabolic grey model based on optimization. J. Cleaner Prod. 239, 118079. doi: 10.1016/j.jclepro.2019.118079
Sahoo, B., and Bhaskaran, P. K. (2018). Multi-hazard risk assessment of coastal vulnerability from tropical cyclones—a GIS based approach for the Odisha coast. J. Environ. Manag. 206, 1166–1178. doi: 10.1016/j.jenvman.2017.10.075
Sawant, S., Mohite, J., Sakkan, M., and Pappula, S. (2019). “Near real time crop loss estimation using remote sensing observations,” in 8th International Conference on Agro-Geoinformatics, Agro-Geoinformatics (Istanbul). doi: 10.1109/Agro-Geoinformatics.2019.8820217
Soltani, K., Ebtehaj, I., Amiri, A., Azari, A., Gharabaghi, B., and Bonakdari, H. (2021). Mapping the spatial and temporal variability of flood susceptibility using remotely sensed normalized difference vegetation index and the forecasted changes in the future. Sci. Total Environ. 770, 145288. doi: 10.1016/j.scitotenv.2021.145288
Wang, D., He, W., and Shi, R. (2019a). How to achieve the dual-control targets of china's CO2 emission reduction in 2030? future trends and prospective decomposition. J. Cleaner Prod. 213, 1251–1263. 1 doi: 10.1016/j.jclepro.2018.12.178
Wang, J., Yang, W., Du, P., and Li, Y. (2018). Research and application of a hybrid forecasting framework based on multi-objective optimization for electrical power system. Energy 148, 59–78. doi: 10.1016/j.energy.2018.01.112
Wang, S., Mu, L., Qi, M., Yu, Z., Yao, Z., and Zhao, E. (2021). Quantitative risk assessment of storm surge using GIS techniques and open data: a case study of Daya Bay Zone, China. J. Environ. Manage. 289, 112514. doi: 10.1016/j.jenvman.2021.112514
Wang, S., Zhao, Y., and Wiedmann, T. (2019b). Carbon emissions embodied in china–australia trade: a scenario analysis based on input–output analysis and panel regression models. J. Cleaner Prod. 220, 721–731. doi: 10.1016/j.jclepro.2019.02.071
Xiong, T., Li, C., and Bao, Y. (2018). Seasonal forecasting of agricultural commodity price using a hybrid stl and elm method: evidence from the vegetable market in china. Neurocomputing 275, 2831–2844. doi: 10.1016/j.neucom.2017.11.053
Yan, Z., Liang, B., Wu, G., Wang, S., and Li, P. (2020). Ultra-long return level estimation of extreme wind speed based on the deductive method. Ocean Eng. 197, 106900. doi: 10.1016/j.oceaneng.2019.106900
Yang, W., Sun, S., Hao, Y., and Wang, S. (2022). A novel machine learning-based electricity price forecasting model based on optimal model selection strategy. Energy. 238, 121989. doi: 10.1016/j.energy.2021.121989
Yang, W., Wang, J., Lu, H., Niu, T., and Du, P. (2019a). Hybrid wind energy forecasting and analysis system based on divide and conquer scheme: a case study in China. J. Clean. Prod. 222, 942–959. doi: 10.1016/j.jclepro.2019.03.036
Yang, W., Wang, J., Niu, T., and Du, P. (2019b). A hybrid forecasting system based on a dual decomposition strategy and multi-objective optimization for electricity price forecasting. Appl. Energy 235, 1205–1225. doi: 10.1016/j.apenergy.2018.11.034
Yi, A., Yang, M., and Li, Y. (2021). Macroeconomic uncertainty and crude oil futures volatility–evidence from china crude oil futures market. Front. Environ. Sci. 9, 636903. doi: 10.3389/fenvs.2021.636903
Yin, K., Zhang, Y., and Li, X. (2017). Research on storm-tide disaster losses in China using a new grey relational analysis model with the dispersion of panel data. Int. J. Environ. Res. Public Health 14, 1330. doi: 10.3390/ijerph14111330
Yin, K. D., and Sun, W. J. (2011). Study on economic loss evaluation index system of storm surge disaster, Fish. Econ. China. 29:4. doi: 10.3969/j.issn1009-590X.2011.03.013
Yin, K. D., Wang, B., and Ma, J. (2011). Empirical Study on economic early warning index system of storm surge disaster, China Science and Technology Forum Fam. Plan. West. Hemisph. 8. doi: 10.3969/j.issn.1002-6711.2011.07.017
Young, C. C., Liu, W. C., and Wu, M. C. (2017). A physically based and machine learning hybrid approach for accurate rainfall-runoff modeling during extreme typhoon events. Appl. Soft Comput. 53, 205–216. doi: 10.1016/j.asoc.2016.12.052
Yu, F., Dong, J., and Ye, L. (2015). Collection of storm surge disasters historical data in China 1949–2009, 1st Edn. Beijing: China Ocean Press.
Zeng, D., Zhang, H., Li, Q., and Ellingwood, B. R. (2021). Tropical cyclone damage assessment of distributed infrastructure systems under spatially correlated wind speeds. Struct. Saf. 91, 102080. doi: 10.1016/j.strusafe.2021.102080
Zhao, X., Li, H., Ding, L., and Liu, M. (2019). Research and application of a hybrid system based on interpolation for forecasting direct economic losses of marine disasters. Int. J. Disaster Risk Reduct. doi: 10.1016/j.ijdrr.2019.101121
Zhao, X., Li, H., Ding, L., Wang, W., and Xue, Y. (2020). Forecasting direct economic losses of marine disasters in China based on a novel combined model. Int. J. Disaster Risk Reduct. 51, 101921. doi: 10.1016/j.ijdrr.2020.101921
Zhejiang Marine Disaster Bulletin. (2012–2021). Available online at: http://search.zj.gov.cn/jrobotfront/search.do?websiteid=330000000000014andpg=andp=1andtpl=2330andcategory=andq=%E6%B5%99%E6%B1%9F%E7%9C%81%E6%B5%B7%E6%B4%8B%E7%81%BE%E5%AE%B3%E5%85%AC%E6%8A%A5andx=0andy=0 (accessed August 2, 2021).
Zhejiang Statistical Yearbook. (1990–2020). Available online at: https://data.cnki.net/Yearbook/Single/N2020090355. (accessed August 2, 2021).
Zhi, G., Liao, Z., Tian, W., and Wu, J. (2020). Urban flood risk assessment and analysis with a 3D visualization method coupling the PP-PSO algorithm and building data. J. Environ. Manage. 268:110521. doi: 10.1016/j.jenvman.2020.110521
Zhou, L., Hu, W., Jia, Z., Li, X., Li, Y., Su, T., et al. (2020). Integrated visualization approach for real-time and dynamic assessment of storm surge disasters for China's seas. ISPRS Int. J. Geo-Inf. 9, 51. doi: 10.3390/ijgi9010051
Keywords: storm surge, hybrid forecasting, forecasting, optimization algorithm, economic losses
Citation: Guo H, Yin K and Huang C (2022) Modeling of Direct Economic Losses of Storm Surge Disasters Based on a Novel Hybrid Forecasting System. Front. Mar. Sci. 8:804541. doi: 10.3389/fmars.2021.804541
Received: 29 October 2021; Accepted: 16 December 2021;
Published: 25 January 2022.
Edited by:
Yiliao Song, University of Technology Sydney, AustraliaReviewed by:
Hongmin Li, Northeast Forestry University, ChinaCopyright © 2022 Guo, Yin and Huang. This is an open-access article distributed under the terms of the Creative Commons Attribution License (CC BY). The use, distribution or reproduction in other forums is permitted, provided the original author(s) and the copyright owner(s) are credited and that the original publication in this journal is cited, in accordance with accepted academic practice. No use, distribution or reproduction is permitted which does not comply with these terms.
*Correspondence: Chong Huang, aHVhbmdjaG9uZ0BzZHVmZS5lZHUuY24=
Disclaimer: All claims expressed in this article are solely those of the authors and do not necessarily represent those of their affiliated organizations, or those of the publisher, the editors and the reviewers. Any product that may be evaluated in this article or claim that may be made by its manufacturer is not guaranteed or endorsed by the publisher.
Research integrity at Frontiers
Learn more about the work of our research integrity team to safeguard the quality of each article we publish.