 Rebecca Haughey
- 1Cetacean Ecology, Behaviour and Evolution Lab, College of Science and Engineering, Flinders University, Adelaide, SA, Australia
- 2Ecosystem Ecology Lab, College of Science and Engineering, Flinders University, Adelaide, SA, Australia
- 3Stenella Marine & Social Science, Perth, WA, Australia
Assessments of species distributions are crucial for informing conservation and management action. In this study, we used ensemble modelling to explain the distribution of Near Threatened Indo-Pacific (IP) bottlenose dolphins (Tursiops aduncus) in coastal waters at the North West Cape (NWC), Western Australia (WA), an area encompassing a marine protected area (MPA) and adjacent unprotected coastal waters. Analyses used dolphin sighting data collected during boat-based surveys conducted from 2013 to 2015 and 2018 to 2019. Overall, the distribution of IP bottlenose dolphins was best explained by distance to coast (up to 2,000 m) and distance to boat ramp (up to 7,000 m). Areas of high probability of occurrence for dolphins extended from the tip and down the eastern side of the NWC and overlapped with designated sanctuary zones as well as waters beyond the boundaries of the Ningaloo Marine Park (NMP). Distribution and habitat preferences varied slightly with season. In autumn, dolphin distribution was best explained by distance to coast and water depth with a higher likelihood of observing dolphins 1,000–2,000 m from the coast and in water depths of 7–10 m deep. During winter months, distance to coast (1,000–2,000 m) and sea surface temperature (SST) (21.5–23.5°C) were the most important explanatory variables, with presence in coastal lagoons to the west of the NWC more likely than other seasons. During spring, areas of moderate to high probability of dolphin occurrence were mainly located outside the NMP, with marine park zone (outside the NMP and Sanctuary zones within the NMP, the two zones with the highest probability of IP bottlenose dolphin occurrence) and water depth (waters 7–13 m deep) best explaining dolphin distribution. This study highlights the importance of inshore areas of the NWC for IP bottlenose dolphins and the potential vulnerability of this species to increasing and cumulative anthropogenic stressors associated with these areas. Results of this study should be considered in future zoning reviews and adaptive management efforts of the NMP allowing for effective management of this Near Threatened species.
Introduction
Coastal marine ecosystems and their associated habitats are among the most productive ecosystems and are considered to be of great ecological importance and societal value (Costanza et al., 1997). These ecosystems, their habitats and the species that reside within them are under ever-increasing pressure from a variety of anthropogenic activities such as overfishing, habitat degradation, pollution, urbanisation, disturbance from vessels and climate change (Brown and McLachlan, 2002; Lotze et al., 2006; Halpern et al., 2007; Diaz and Rosenberg, 2008; Crain et al., 2009; Davidson et al., 2012). Coastal ecosystems are key areas for marine megafauna, particularly marine mammals, which have been identified as both indicator and umbrella species with their presence often used as a potential signal of ecosystem health (Moore, 2008; Bossart, 2011). Marine mammal conservation actions are likely to benefit the protection of other organisms and the wider ecosystem because of top-down and bottom-up ecosystem processes and the roles marine mammals play as top predators (Paine, 1969, 1995; Roberge and Angelstam, 2004; Roman and McCarthy, 2010). In addition, marine mammals are important culturally and economically, with marine ecotourism benefits spanning from increased education and appreciation of the marine environment to sustaining local economies (Muloin, 1998; Corkeron, 2004; Stamation et al., 2007; O’Connor et al., 2009).
Marine Protected Areas (MPAs) are defined by the IUCN as “a clearly defined geographical space, recognised, dedicated and managed, through legal or other effective means, to achieve the long-term conservation of nature with associated ecosystem services and cultural values” (Dudley, 2008; Day et al., 2012). MPAs have been identified as a tool to manage anthropogenic threats and safeguard the biodiversity of coastal ecosystems (Halpern et al., 2010; TardinI, Maciel et al., 2020). Yet, despite many studies demonstrating positive effects of MPAs, this is not always the case (Lester et al., 2009). There is evidence that MPA’s can be effective conservation tools for highly mobile, wide-ranging species such as marine mammals, when their boundaries encompass areas that are biologically and ecologically relevant to populations and management measures are enforced (Hooker et al., 1999; Hooker and Gerber, 2004; Wilson et al., 2004; Hartel et al., 2015; Lambert et al., 2017; Dwyer et al., 2020). Without the inclusion of adequate spatial and biological information, habitats can be under-protected, compromising the conservation and management of important marine species and ecosystems (Davidson et al., 2012; Gregr et al., 2013; Guisan et al., 2013; Hartel et al., 2015). Thus, information on the spatial distribution of marine mammals and the physical and biological environmental factors influencing such distribution is essential to inform and evaluate conservation and management decisions and future environmental impacts (Zanardo et al., 2017; Passadore et al., 2018; Hunt et al., 2020).
A key tool for identifying and predicting the relationship between species occurrence and the environmental and anthropogenic conditions associated with their habitat are species distribution models (SDMs) (Guisan and Zimmermann, 2000; Elith and Leathwick, 2009; Franklin, 2010). SDMs examine the relationship between the distribution (e.g., occurrence) of a species and the environmental variables that influence habitat selection, and have been used widely on terrestrial and marine fauna (MacLeod et al., 2008; Rickbeil et al., 2014; James et al., 2017; Zacarias and Loyola, 2018), including dolphins (Zanardo et al., 2017; Passadore et al., 2018; Sprogis et al., 2018a; Vargas-Fonesca et al., 2018; Dwyer et al., 2020; Hunt et al., 2020; TardinI, Maciel et al., 2020). SDMs can help to understand which areas are used more often by animals and the environmental features that are correlated with species distributions (Garraffo et al., 2011; Marini et al., 2015; Vargas-Fonesca et al., 2018). In turn, such information can be useful for developing management practices to improve species conservation.
Indo-Pacific bottlenose dolphins (Tursiops aduncus, IP bottlenose dolphins), recently re-listed as Near Threatened by the IUCN (Braulik et al., 2019), are long lived, slow to sexually mature, display a high degree of parental care to offspring and inhabit shallow, coastal habitats (Mann et al., 2000; Wang and Chu Yang, 2009; Hammond et al., 2012; Braulik et al., 2019). Increasing urbanisation and human use of coastal areas exposes IP bottlenose dolphins to repeated and cumulative stressors that have the potential to disrupt and displace individuals (Lusseau and Higham, 2004; Bejder et al., 2006; Smith et al., 2016). Therefore, identifying habitat preferences and areas of high probability of occurrence is a key priority for effective spatial planning and management of IP bottlenose dolphins, as well as other coastal dolphin populations.
Marine habitats are, in general, spatially heterogeneous and the distribution of marine mammals such as bottlenose dolphins, have been linked to a number of biotic (e.g., habitat type, prey distribution, interspecific competition), abiotic [e.g., sea surface temperature (SST), bathymetry, distance to coast], and anthropogenic variables (e.g., fishing activity, boat traffic, and MPAs) (Ingram and Rogan, 2002; Bearzi et al., 2008; La Manna et al., 2010; Hartel et al., 2015; Inoue et al., 2017; Zanardo et al., 2017; Passadore et al., 2018; Sprogis et al., 2018a; Vargas-Fonesca et al., 2018; Bilgmann et al., 2019). The range of variables driving bottlenose dolphin presence around the world is indicative of the broad behavioural and ecological plasticity of bottlenose dolphins relative to prey and predator distribution; highlighting the need to understand and manage individual populations as discrete units and incorporate a range of variables into species distribution models (Connor et al., 2000; Bilgmann et al., 2019).
Coastal waters of the North West Cape (NWC) encompassing the northern section of the Ningaloo Marine Park (NMP) and Exmouth Gulf in Western Australia, are inhabited by a relatively large population of IP bottlenose dolphins. The population is composed of 141 individuals who display moderate levels of site fidelity to the NWC and a slightly larger number of individuals (229) who display low site fidelity, and range beyond the NWC and the boundaries of the NMP (Haughey et al., 2020; Figure 1). The NMP is a multi-use MPA primarily located to the west of the NWC falling within the Ningaloo Coast World Heritage Area (NCWHA) (CALM and MPRA, 2005; UNESCO, 2011). Dolphins have been recognised to be of ecological value to the NMP (CALM and MPRA, 2005), but designation of boundaries and zones were determined prior to ecological studies on the range and habitat requirements of inshore dolphins, and should be considered in future reviews of the management plan (Hunt et al., 2020). On the eastern side of the NWC and outside the NMP, lies the Exmouth Gulf, which is recognised as an important ecosystem containing globally significant features and supporting high biodiversity, yet remains unprotected (Fitzpatrick et al., 2019). The Exmouth Gulf has not received as much attention as the NMP and many knowledge gaps of the marine ecosystem exist, posing problems for its overall conservation and management (Fitzpatrick et al., 2019).
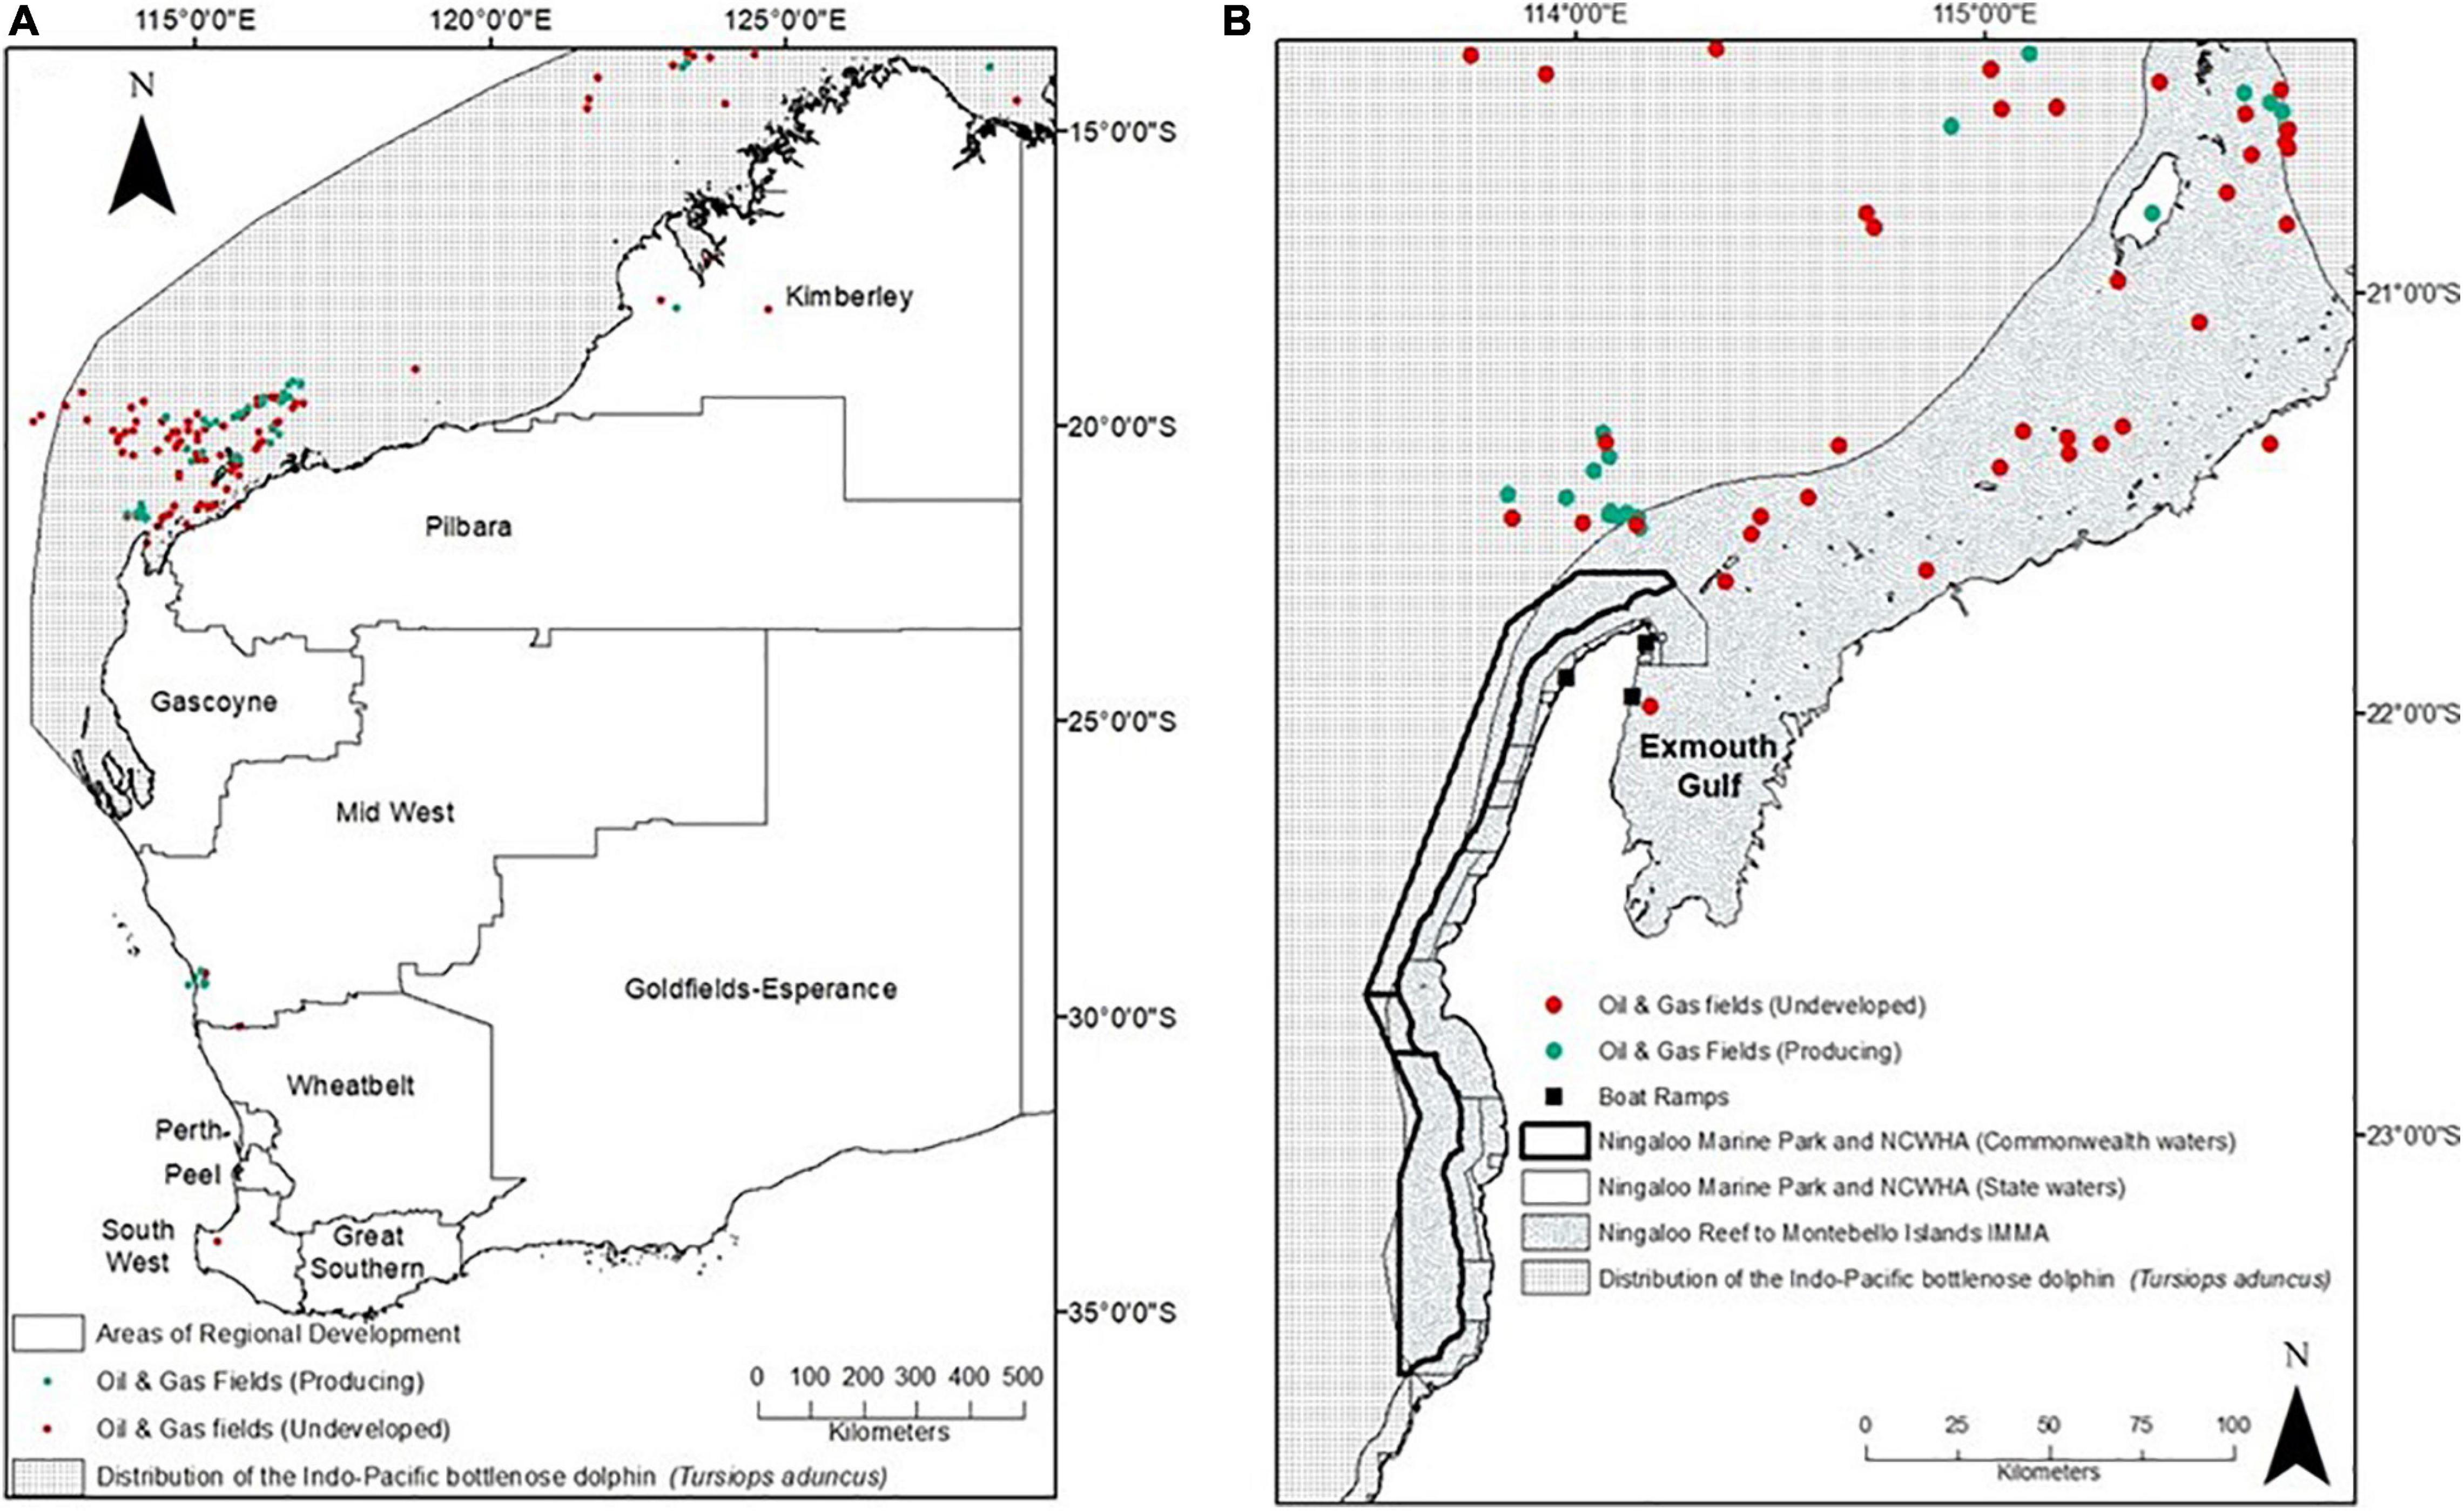
Figure 1. (A) Map of Western Australia showing the inferred distribution of Indo-Pacific bottlenose dolphins, the location of producing and undeveloped oil and gas fields, the boundaries of Western Australia’s areas of regional development and the location of North West Cape (in box). (B) Map of the North West Cape showing the distribution of Indo-Pacific bottlenose dolphins, boat ramp locations, oil and gas fields, the boundaries of the State and Commonwealth Ningaloo Marine Parks and the marine component of the Ningaloo Coast World Heritage Area (NSWHA) and the Ningaloo Reef to the Montebello Islands Important Marine Mammal Area (IMMA) (IUCN-MMPATF, 2020).
The Gascoyne region which encompasses the NWC is home to both marine and terrestrial species that attract domestic and international interest, creating a high demand for both water and land based recreational activities (Gascoyne Development Commission et al., 2013). Additionally significant oil and gas activities operate in waters off the coast of this region (SGS Economics and Planning, 2011). The Gascoyne region’s gross regional product continues to grow annually, with significant contributions from the tourism, retail, agriculture, fishing, and mining sectors and an estimated gross regional product of $1,740 million AUD by 2050 (SGS Economics and Planning, 2011; Gascoyne Development Commission, 2015). The Pilbara region, which borders the eastern side of Exmouth Gulf, has been estimated to produce more money than the individual economies of 119 countries (DPMC, 2015). Although the development boom appears to be slowing, coastal north-western Australia is likely to remain an area of high anthropogenic activity, with the Australian Government prioritising northern Australia for future growth in energy export, local human populations and tourist visitation (Gascoyne Development Commission et al., 2013; DPMC, 2015; Gascoyne Development Commission, 2015; Hanf, 2015).
Most coastal development and anthropogenic pressures overlapping with the distribution of IP bottlenose dolphins have preceded baseline ecological information and an accurate assessment of these threats. A broad scale dolphin SDM, using opportunistic sightings from a dugong aerial survey, indicated that waters north-east of the NWC and within the Exmouth Gulf, were highly likely to contain IP bottlenose dolphins, in waters depths of 10–25 m, particularly around the 20 m depth contour and in steeper seafloor gradients (Hanf, 2015). Seasonally, SST influenced dolphin distribution with a positive response in warmer waters and a negative response when waters are cooler (Hanf, 2015). Given the high number of IP bottlenose dolphins using the coastal waters of the NWC and the varying levels of marine protection in the area, establishing a baseline dataset for the species, including distribution, is a critical next step towards their effective conservation and management.
Here we used dedicated boat-based surveys and ensemble species distribution modelling to (1) understand the biotic, abiotic and anthropogenic variables influencing distribution and habitat selection and (2) identify the distribution patterns and areas of high probability of occurrence of IP bottlenose dolphins at the NWC. Our results add to the understanding of IP bottlenose dolphin spatial ecology and highlight key areas for spatial conservation prioritisation at the NWC, a critical next step for their effective conservation and management.
Materials and Methods
Study Site
Our study area encompassed the coastal waters surrounding the NWC in north-western Australia from Exmouth Marina in the Exmouth Gulf, around the tip of the NWC and south to Mangrove Bay (Figure 1). Approximately 150 km2 of the 237 km2 study area falls within the NMP, while the remaining 87 km2 falls within the unprotected Exmouth Gulf. Boat-based surveys for Indo-Pacific (IP) bottlenose dolphins in this study took place both inside and outside the boundary of the NMP (Figure 2). In a recent global conservation initiative for marine mammals, the NWC was recognised to be important to marine mammals and was included in a large Important Marine Mammal Area (IMMA) spanning from the Ningaloo Reef further north to the Montebello Islands (Figure 1).
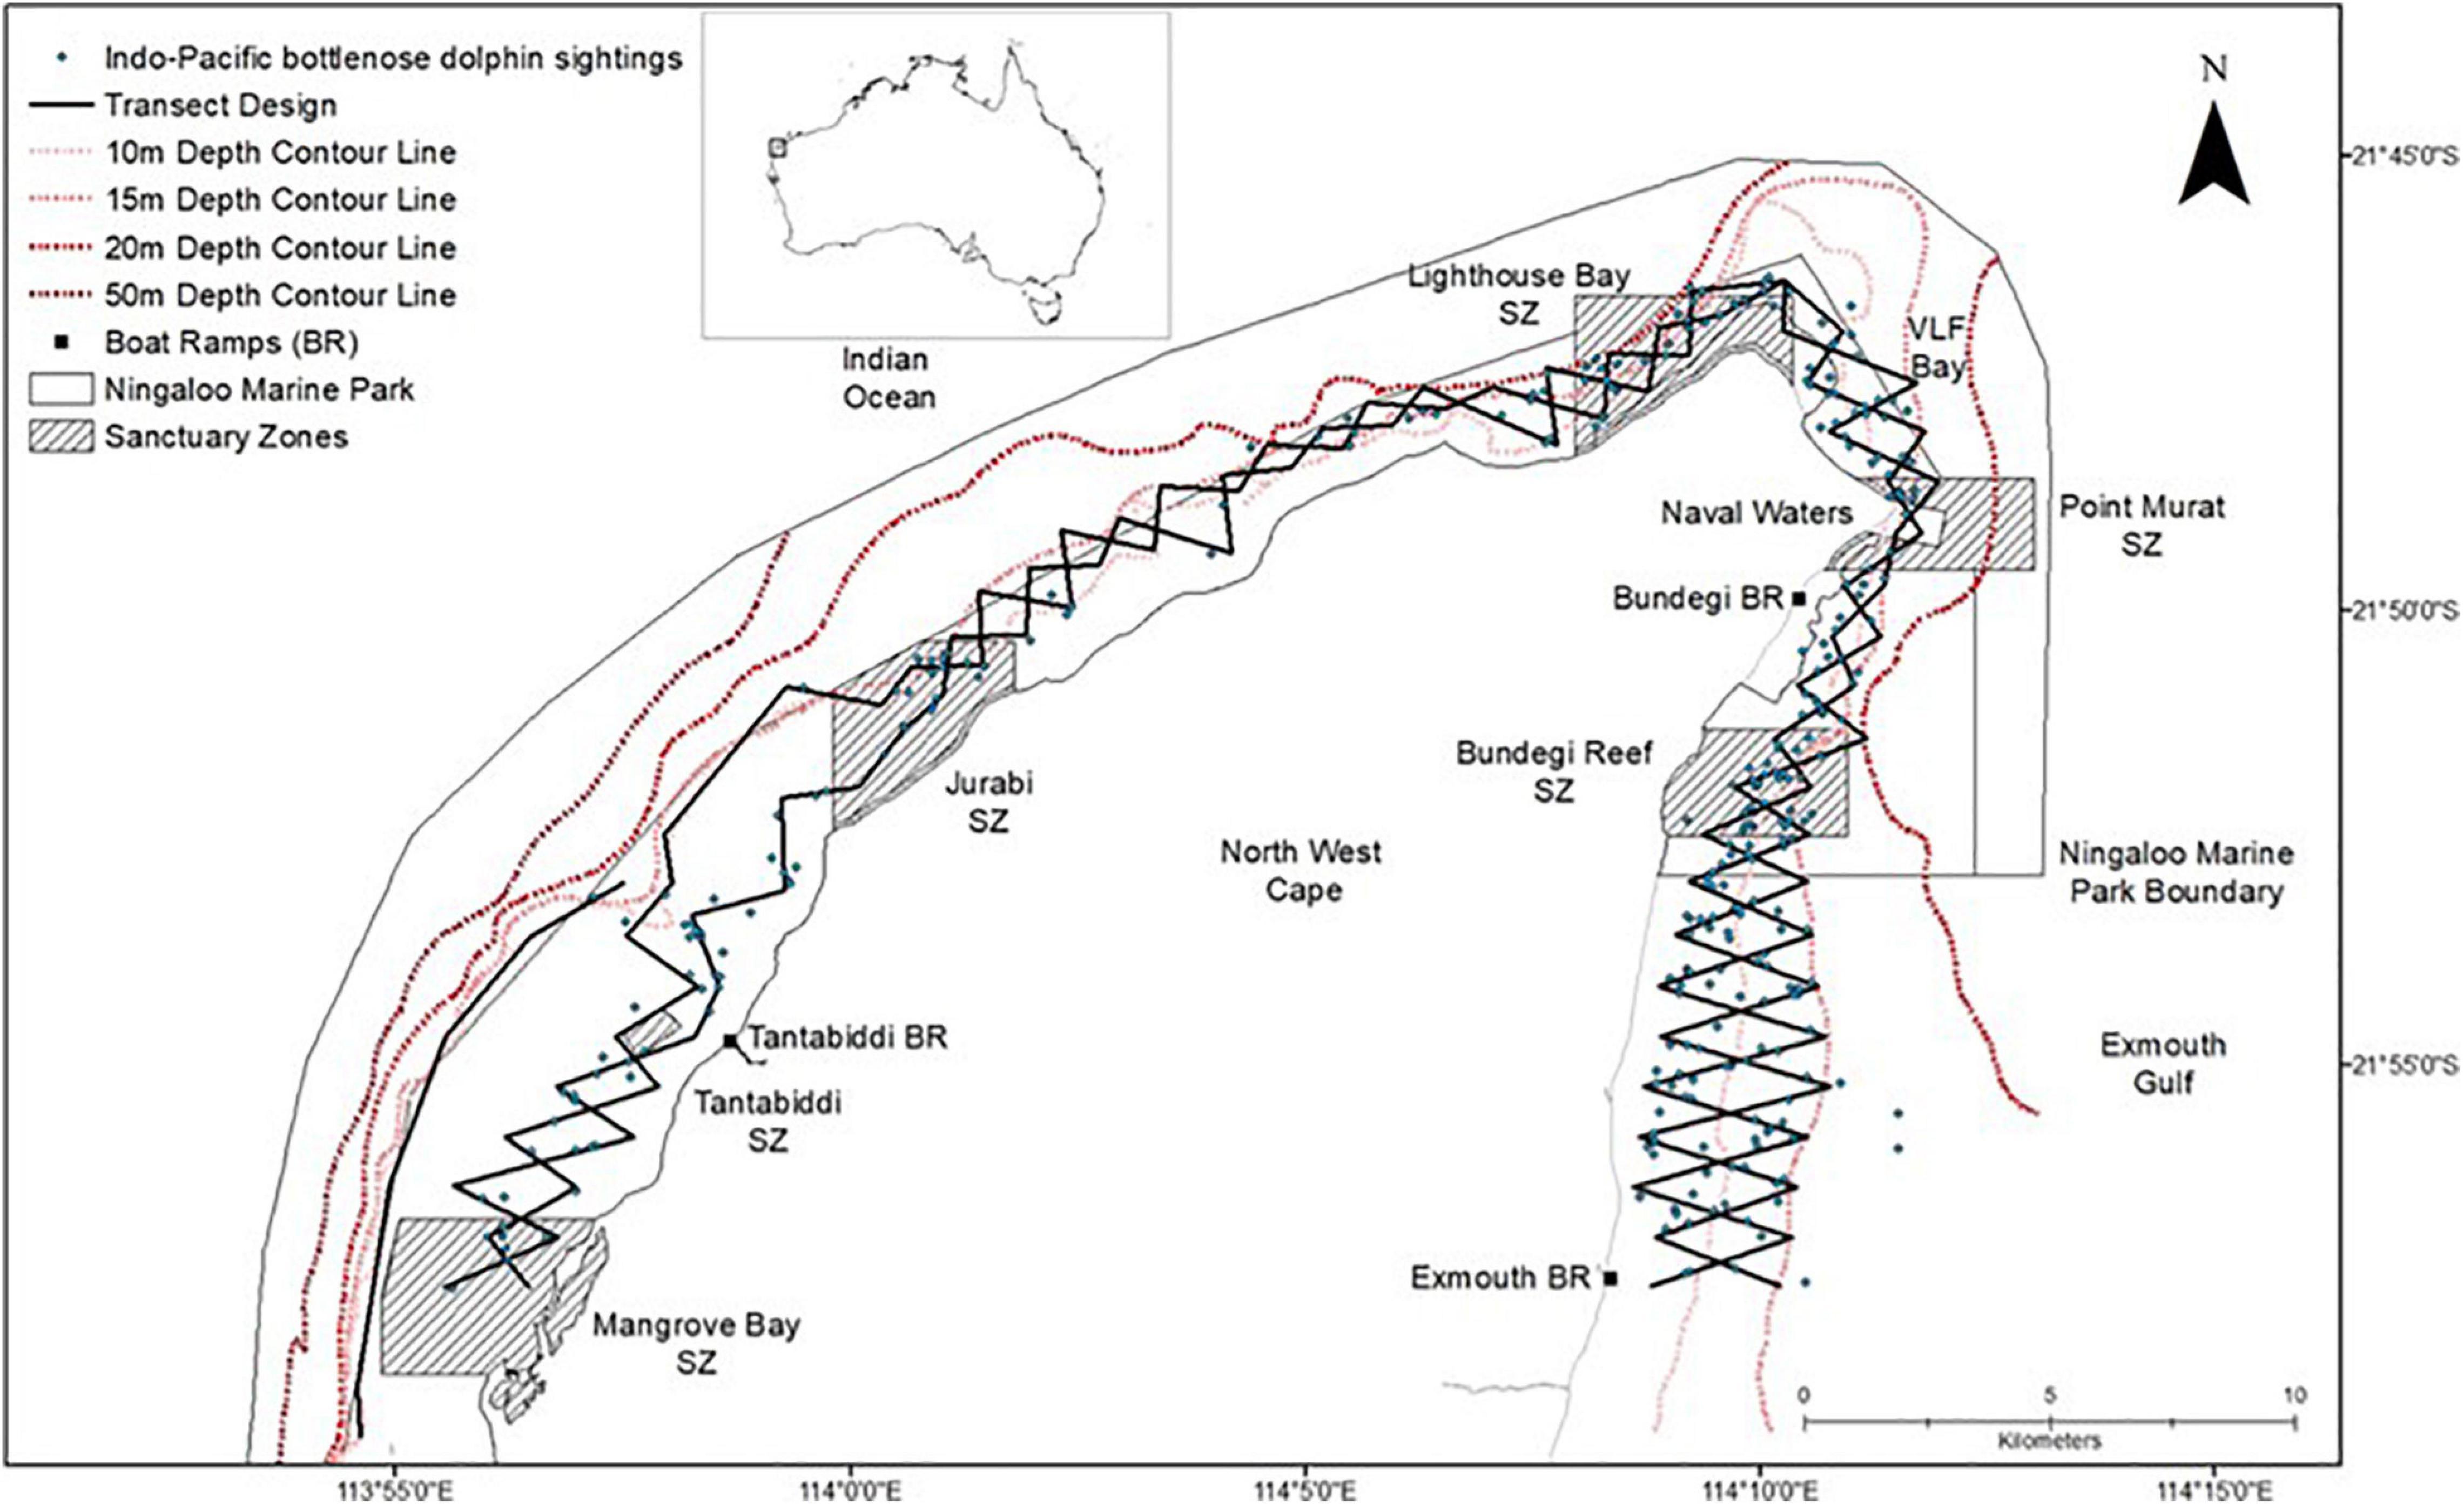
Figure 2. Map of the North West Cape (NWC) study site in Western Australia (WA) including transect layout and Indo-Pacific bottlenose dolphin sightings (n = 323) encountered between 2013–2015 and 2018–2019.
The western side of the NWC features a mostly sandy substrate and a fringing coral reef system (CALM and MPRA, 2005; Cassata and Collins, 2008). The fringing (sub-tidal) reef system is separated from the coast by shallow sandy lagoons and coral communities (i.e., less than 5 m deep) (Collins et al., 2003). After the subtidal ocean edge of the reef, the continental shelf drops off quickly exposing the reef to considerable wave action (e.g., swell height > 2 m) (Collins et al., 2003; CALM and MPRA, 2005; Cassata and Collins, 2008).
On the eastern side of the NWC is the Exmouth Gulf, a large sub-tropical inverse estuary which reaches depths of 21 m, with a mean depth of 10–12 m (Ayukai and Miller, 1998; Brunskill et al., 2001; Fitzpatrick et al., 2019). The Gulf is comprised of mostly subtidal sandy bottoms and limestone reefs, but also a large arid zone mangrove ecosystem (Brunskill et al., 2001; Lyne et al., 2006; Twiggs and Collins, 2010; Fitzpatrick et al., 2019).
The NWC, is subject to high commercial and recreational boat pressure resulting from marine tourism and fishing activities (Smallwood and Beckley, 2012; Smallwood et al., 2012). From March to October, whale shark and humpback whale swim tours depart daily from Tantabiddi boat ramp (Catlin and Jones, 2010; Sprogis et al., 2020). The NMP is managed using a zoning system including Sanctuary, Recreational, Special Purpose (Shore-Based), and General Use Zones (CALM and MPRA, 2005). Sanctuary Zones, also termed “no take zones,” are areas where extractive activities such as fishing are prohibited, but other recreational activities (i.e., boating and non-powered vessels are permitted); Recreational Zones allow recreational activities such as fishing, boating and activities involving non-powered vessels; and General Use Zones permit both recreational and sustainable commercial activities (i.e., commercial fishing and swim-with whale sharks (Rhincodon typus) and humpback whales (Megaptera novaeangliae), in addition to previously mentioned recreational activities) (CALM and MPRA, 2005). In the Special Purpose (Shore-Based) Zones adjacent to the Point Murat, Lighthouse Bay and Jurabi Sanctuary Zones (Figure 2), recreational line fishing from the beach is permitted. Outside the NMP boundaries, there is no restriction on the recreational or commercial activities permitted.
Data Collection
Boat based surveys searching for IP bottlenose dolphins were conducted onboard a 5.6 m research vessel during the hours of 0700 and 1800 at speeds of 10–12 km/hr from May to October in 2013, April to October in 2014, May to October in 2015 and April to September in both 2018 and 2019. Sampling periods spanned the austral seasons of Autumn (March–May), Winter (June–August) and Spring (September–November). Sampling was not conducted during summer and early autumn months (December–February, and March, respectively) due to extreme temperatures, higher risk of tropical cyclones and high wind conditions, which are consistently unfavourable for surveys. Surveys were conducted in favourable sighting conditions (i.e., wind speed typically lower than 15 km/hr, Beaufort Sea State of ≤ 3 and no rain) and followed a systematic line transect layout (i.e., 2 × 93 km opposing zig-zag lines and 1 × 13 km single line; Figure 1) covering a range of water depths, benthic habitats, and marine park zones within the study area. However, majority of transects fall within the NMP and as a result, survey effort is higher within the NMP boundaries (Figure 1).
A crew of three to five (mode = four) observers searched for dolphins forward of the vessel’s beam using a combination of the naked eye and 7 × 50 zoom binoculars. When a school of dolphins was sighted, search effort was suspended and dolphins were approached to within 5–30 m. Here we recorded a GPS location, predominant school behaviour (i.e., the school behaviour in which more than 50% of the animals in the school are involved; Mann, 1999) within the first five minutes of observation, conducted photo-identification and collected environmental data (i.e., water depth, SST, and water visibility). In addition, these environmental data were collected in situ at the beginning and end point of transects, every 60 min of transect survey effort, at sightings of other marine megafauna (i.e., whales, turtles, and manta rays) and at “off-effort” dolphin sightings in order to incapsulate the environmental conditions throughout a wider range within the study area (for the locations where environmental data was collected, see raw survey tracks Supplementary Material 1). Water depth was recorded using the research vessel’s depth sounder, SST was recorded using a handheld multiparameter probe, and water visibility was measured using a secchi disk. We added additional weights to the down-facing side of the Secchi disk so it would descend quickly while minimising influence of horizontal water movements. Data used to derive other predictor variables were derived from available shape files (see “Predictor Variables” section).
Data Analysis
Analysis of data to identify IP bottlenose dolphin habitat preferences and space use patterns at the NWC involved a series of steps; (1) mapping the location (presence-absence) of dolphin sightings onto a 500 by 500 m grid resolution, (2) selecting predictor variables that were appropriate for our chosen resolution, (3) collinearity testing of predictor variables, (4) model algorithm selection, (5) model building, (6) model assessment, and (7) model estimation (i.e., determining variable importance). The procedures followed to create spatial layers of response (dolphin presence-absence) and predictor variables at a 500 × 500 m grid resolution are summarised in Figure 2 and described in detail in sections “Predictor variables” and “Presence-Absence of Dolphins.” All SDM analysis is also explained in Supplementary Material 2 following the Overview, Data, Model, Assessment, and Prediction (ODMAP) protocol recommended by Zurell et al. (2020).
Predictor Variables
Predictor variables used to model IP bottlenose dolphin distribution and occurrence were classified as: abiotic (i.e., water depth, slope, SST, distance to coast, and water visibility), biotic (i.e., benthic habitat type, for Ningaloo MP SDM only, see Supplementary Materials 3, 4) and anthropogenic (i.e., distance to boat ramp and marine park zone) (Table 1). Predictor variables used in this study were selected because they are known or have been suggested to affect the presence of bottlenose dolphins or their prey, with some variables acting as proxies for prey distribution (i.e., SST), predation risk (i.e., water visibility), and areas of high human use and anthropogenic disturbance (i.e., distance to boat ramp and marine park zone) (Heithaus and Dill, 2002; Ingram and Rogan, 2002; Zanardo et al., 2017; Sprogis et al., 2018a). Proxies for areas of high human use and therefore, anthropogenic disturbance included distance to boat ramp and marine park zone (Passadore et al., 2018; Hunt et al., 2020). Marine park zones have varying levels of restrictions (see section “Study Site”) and commercial and recreational boat users frequently launch from boat ramps (personal observations) so it was inferred that these sites indicated various levels of anthropogenic pressure.
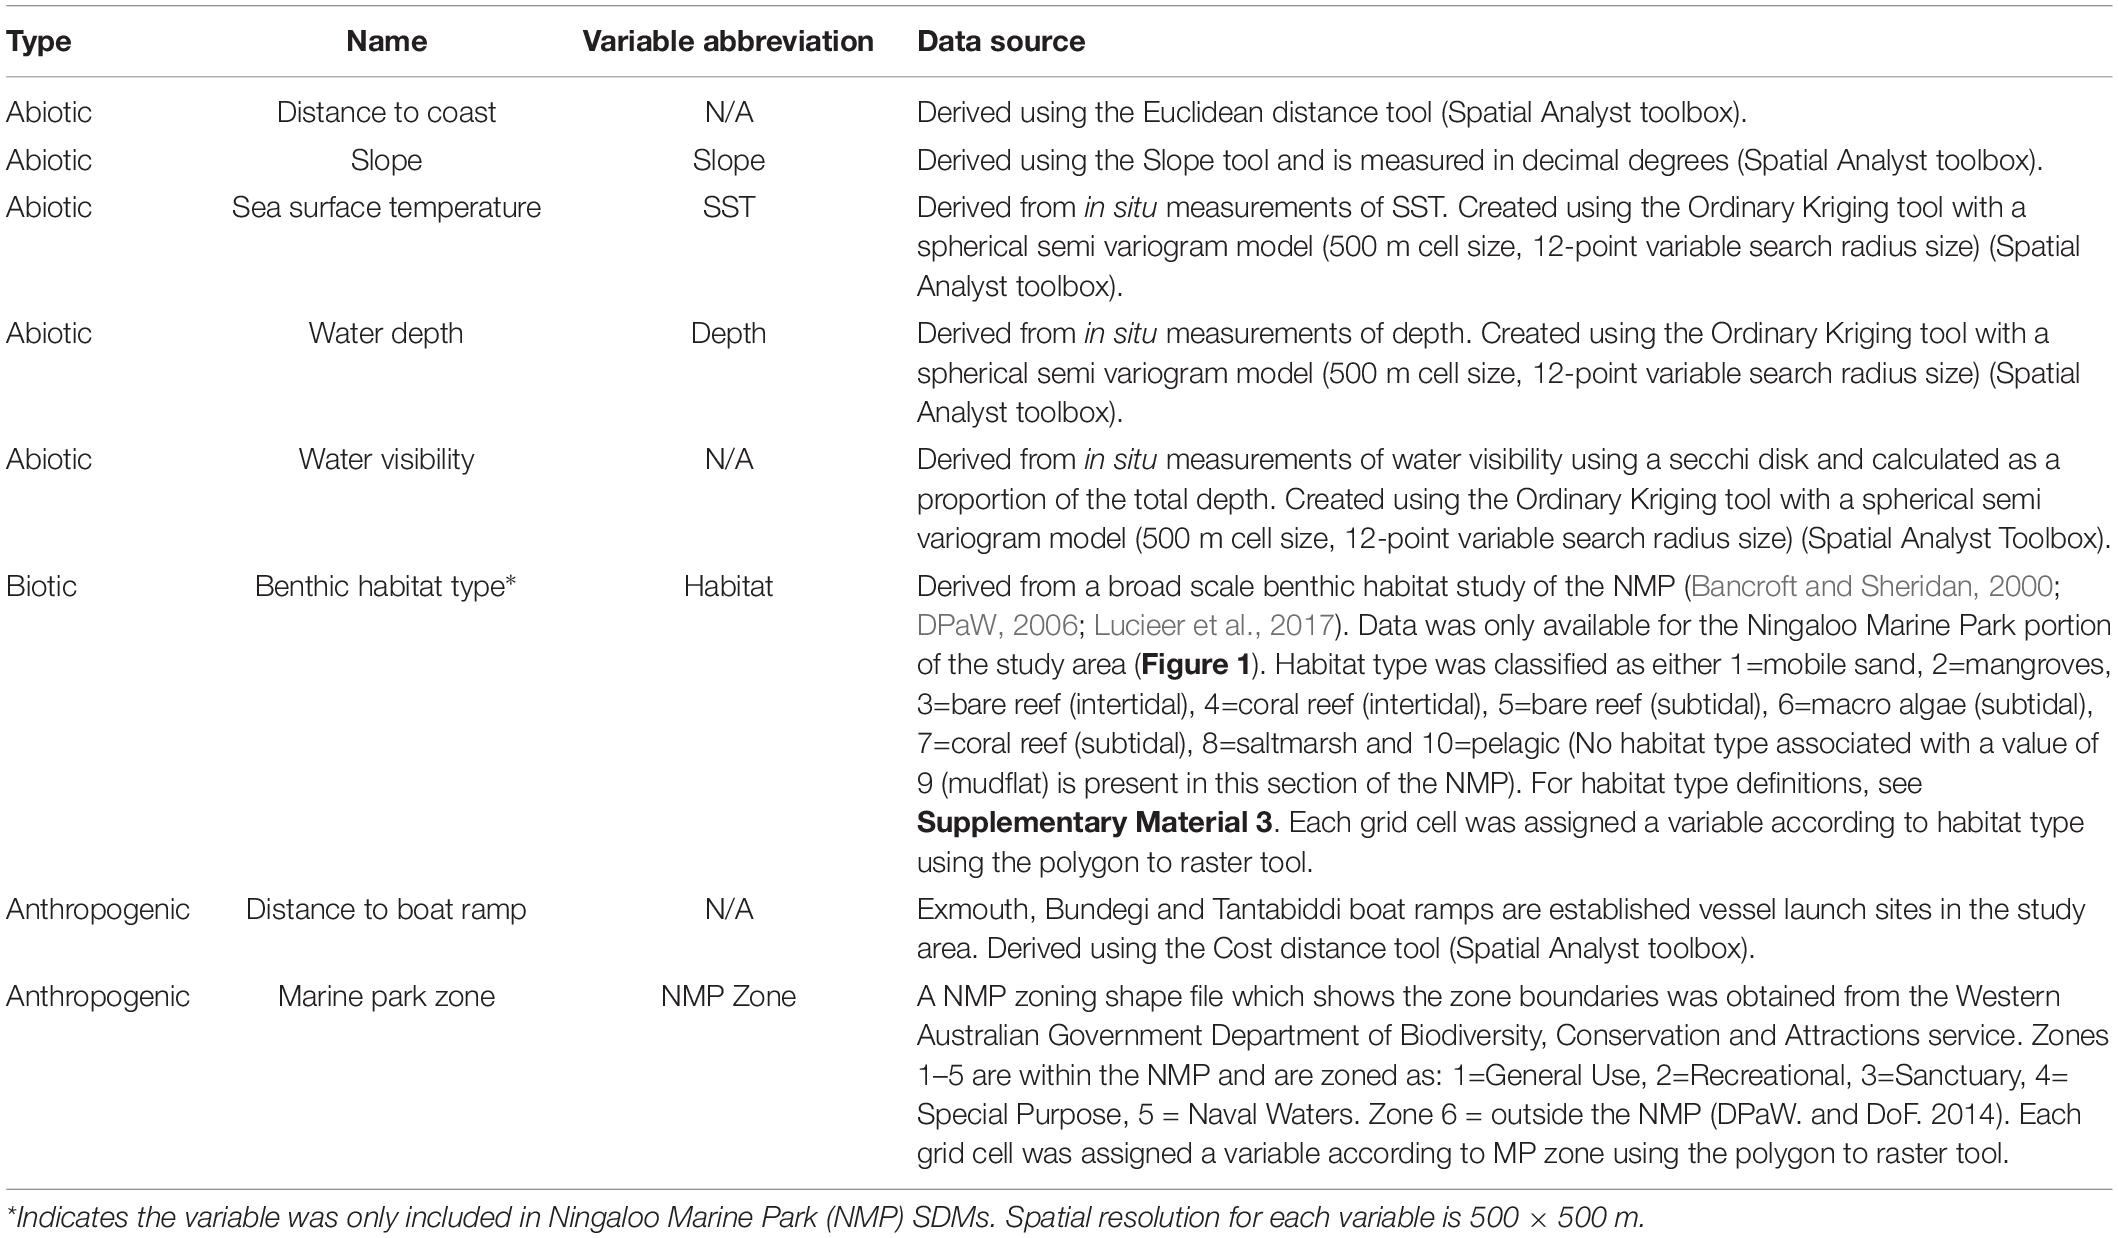
Table 1. List of predictor variables used in species distribution modelling (SDMs) of Indo-Pacific bottlenose dolphins in the coastal waters of the North West Cape, Western Australia, their associated data source and how they were derived in ArcMap.
Most predictor variable layers were created using the Spatial Analyst extension in ArcMap 10.7 (ESRI). The Euclidean distance tool calculated the shortest straight-line distance for distance to coast, the Cost distance tool calculated the shortest distance factoring in land, given the study area wraps around a peninsula for distance to boat ramp (see Table 1). SST, water visibility and water depth were calculated using the Ordinary Kriging interpolation tool with a spherical semi variogram model (500 m cell size, 12 point variable search radius size; Table 1). Seabed slope was derived using the slope tool (Table 1).
Benthic habitat data only exist for the NMP portion of the study area (for NMP boundaries see Figure 1). This data, and the predictor variable raster layer, were derived from a broad scale benthic habitat study using remotely sensed imagery (25 m pixels) and aerial photographs (Bancroft and Sheridan, 2000; DPaW, 2006; Table 1).
The use of remotely sensed data for additional environmental parameters was considered but was not included for a number of reasons. Firstly, available remote sensing data did not cover the entire study area, excluding waters closest to the coast. Secondly, due to the optical complexity of coastal waters, the imprecise correction of imagery and over correction of land contamination, certain remotely sensed variables (i.e., chlorophyll-a and salinity) were not considered reliable in predicting the distribution of dolphins in coastal waters (Dinnat et al., 2019; Cui et al., 2020). Thirdly, the resolution of available remote sensing data do no match the fine-scale resolution, 500 m × 500 m grid cell size, used in this study. As covariate environmental data was collected in situ it is considered the most accurate environmental data for that period.
A shape file of marine park zoning data was obtained from the Western Australian Government Department of Biodiversity, Conservation and Attractions in order to evaluate the relevance of the marine park zoning for the distribution and space use of IP bottlenose dolphins within the study area. Each grid cell was assigned a variable (1–6) according to MP zone using the polygon to raster tool (Table 1).
Presence-Absence of Dolphins
ArcMap was used to create spatial layers of response (dolphin presence-absence) and predictor variables at a 500 × 500 m grid resolution (see Table 1 and Figure 2). This resolution ensured sufficient detail of each predictor variable throughout our study area. This grid cell size was also chosen to reflect the distance dolphins could be reliably observed from the boat under a variety of sea conditions and for comparison to previous studies of other delphinds within our study area. All spatial layers were projected to Universal Transverse Mercator Zone 50 South, based on the WGS 1984 datum. The GPS locations of dolphins sighted whilst on transect and survey tracks were imported into ArcMap to create a presence-absence layer of dolphin presence per grid cell (1 indicating dolphin presence and 0 indicating dolphin absence). To ensure independence of data points (since bottlenose dolphins exhibit flexible grouping patterns; Wells et al., 1987), only the location where the initial group members were first encountered when the transect was broken and the boat approached where the school first been seen was included in analysis.
Obtaining true absences for mobile species is difficult (MacKenzie and Royle, 2005). As true absence data were not available for our presence-absence models, we generated inferred absence data (pseudo-absences) by incorporating survey effort as per previous studies (Rayment et al., 2015; Zanardo et al., 2017; Passadore et al., 2018; Hunt et al., 2020). In order to reduce false absences (i.e., determining an absent cell when individuals may in fact occur in that area), pseudo-absence cells were defined based on areas which had the highest survey effort (Phillips et al., 2009) (summarised in Figure 2). Pseudo-absence cells were based on those grid cells with the highest survey effort and with no presence of dolphins. This definition of pseudo-absence allows us to assume that selected grids are as close to “true” absences as possible, since they were surveyed several times during the study period without dolphin detections. Survey effort was quantified using the total area of “on-effort” survey tracks within each 500 × 500 m grid cell. A 250 m buffer area either side of each transect line was added, which was considered to be the average distance from the vessel that dolphins could reliably be observed under a variety of sea conditions (Zanardo et al., 2017; Hunt et al., 2020). Grid cells were then ranked and cells containing no dolphin presence and values of survey effort higher than the mean were thus considered as absence cells (Zanardo et al., 2017; Passadore et al., 2018; Hunt et al., 2020). See Supplementary Material 1 for the overall spatial distribution of survey effort. For modelling we generated the same number of pseudo-absence and presence cells, resulting in equal weighting, a procedure that has been shown to perform well in SDM algorithms (Barbet-Massin et al., 2012).
Exploratory Analyses
Before running the SDM’s, we tested for collinearity between continuous numerical explanatory variables using stepwise procedures within the usdm package in RStudio (Naimi, 2015; R Core Team, 2020). Variance inflation factors (VIF) were calculated for all variables. Variable pairs with a maximum linear correlation greater than the threshold (0.7) were identified using “vifcor” and the variable with the highest variance inflation factor (VIF, threshold = 3) was excluded using “vifstep” (Zuur et al., 2010; R Core Team, 2020). These procedures were repeated until no variable remained with a correlation coefficient greater than 0.7 nor a VIF greater than the threshold (Naimi et al., 2014; Figure 2).
Combining data can strengthen the estimates of SDMs, however, it is important to consider temporal variability, particularly in highly dynamic environments and in a changing climate, as changes in oceanographic processes can affect the spatial distribution of prey and therefore the presence-absence of highly mobile species, such as dolphins (Fernandez et al., 2017; Mannocci et al., 2017). Additionally, benthic habitat type has been shown to influence habitat selection and space use of IP bottlenose dolphins (Koper et al., 2016; Zanardo et al., 2017; Sprogis et al., 2018a), however spatial data on benthic habitat type is only available for a subset of our study area (the NMP portion, see Figure 1 for boundaries). Therefore, a series of preliminary SDMs were run to investigate aggregating all temporal data (i.e., years) and to determine the importance of benthic habitat type as a predictor of IP bottlenose dolphin distribution within the NMP portion of our study area (see Supplementary Material 4 for results). The results of yearly SDMs indicated that the spatial distribution and areas of high probability of IP bottlenose dolphin occurrence in the NWC remained similar across years. SDMs within the NMP portion of our study area indicated that benthic habitat type was not an important variable influencing IP bottlenose dolphin distribution. Thus, SDMs presented in this paper combined all 5 years of survey data to examine seasonal and overall habitat preferences and space use patterns of IP bottlenose dolphins within the entire study area.
Selection of Model Algorithms and Ensemble Modelling Approach
To model NWC IP bottlenose dolphin distribution in relation to our chosen predictor variables, we used an ensemble modelling approach, using the BioMod2 package in RStudio (Thuiller et al., 2009). This method combined results from seven different presence-absence modelling algorithms; artificial neural network (ANN) (Ripley, 1996), flexible discriminant analysis (FDA) (Hastie et al., 1994), generalised additive model (GAM) (Hastie and Tibshirani, 1990), generalised boosted model (GBM) (Friedman et al., 2000), generalised linear model (GLM) (McCullagh and Nelder, 1989), multivariate adaptive regression splines (MARS) (Friedman, 1991) and random forest (RF) (Breiman, 2001) (summarised in Figure 2). These SDM algorithms were selected because they are known to perform well (Elith et al., 2006; Elith and Graham, 2009; Franklin, 2010) and allow a comparison between regression (GAM, GLM, GBM, MARS) classification (FDA) and machine learning (ANN, RF) modelling approaches.
Model Building
The parameters used with each model algorithm in the Biomod2 package are listed in Supplementary Material 5. SDMs were built using a binomial error distribution with logit as the link function. We implemented a 10-fold cross-validation method for each SDM and a random data splitting procedure of 75/25% for model calibration and testing (Thuiller et al., 2009) (summarised in Figure 3).
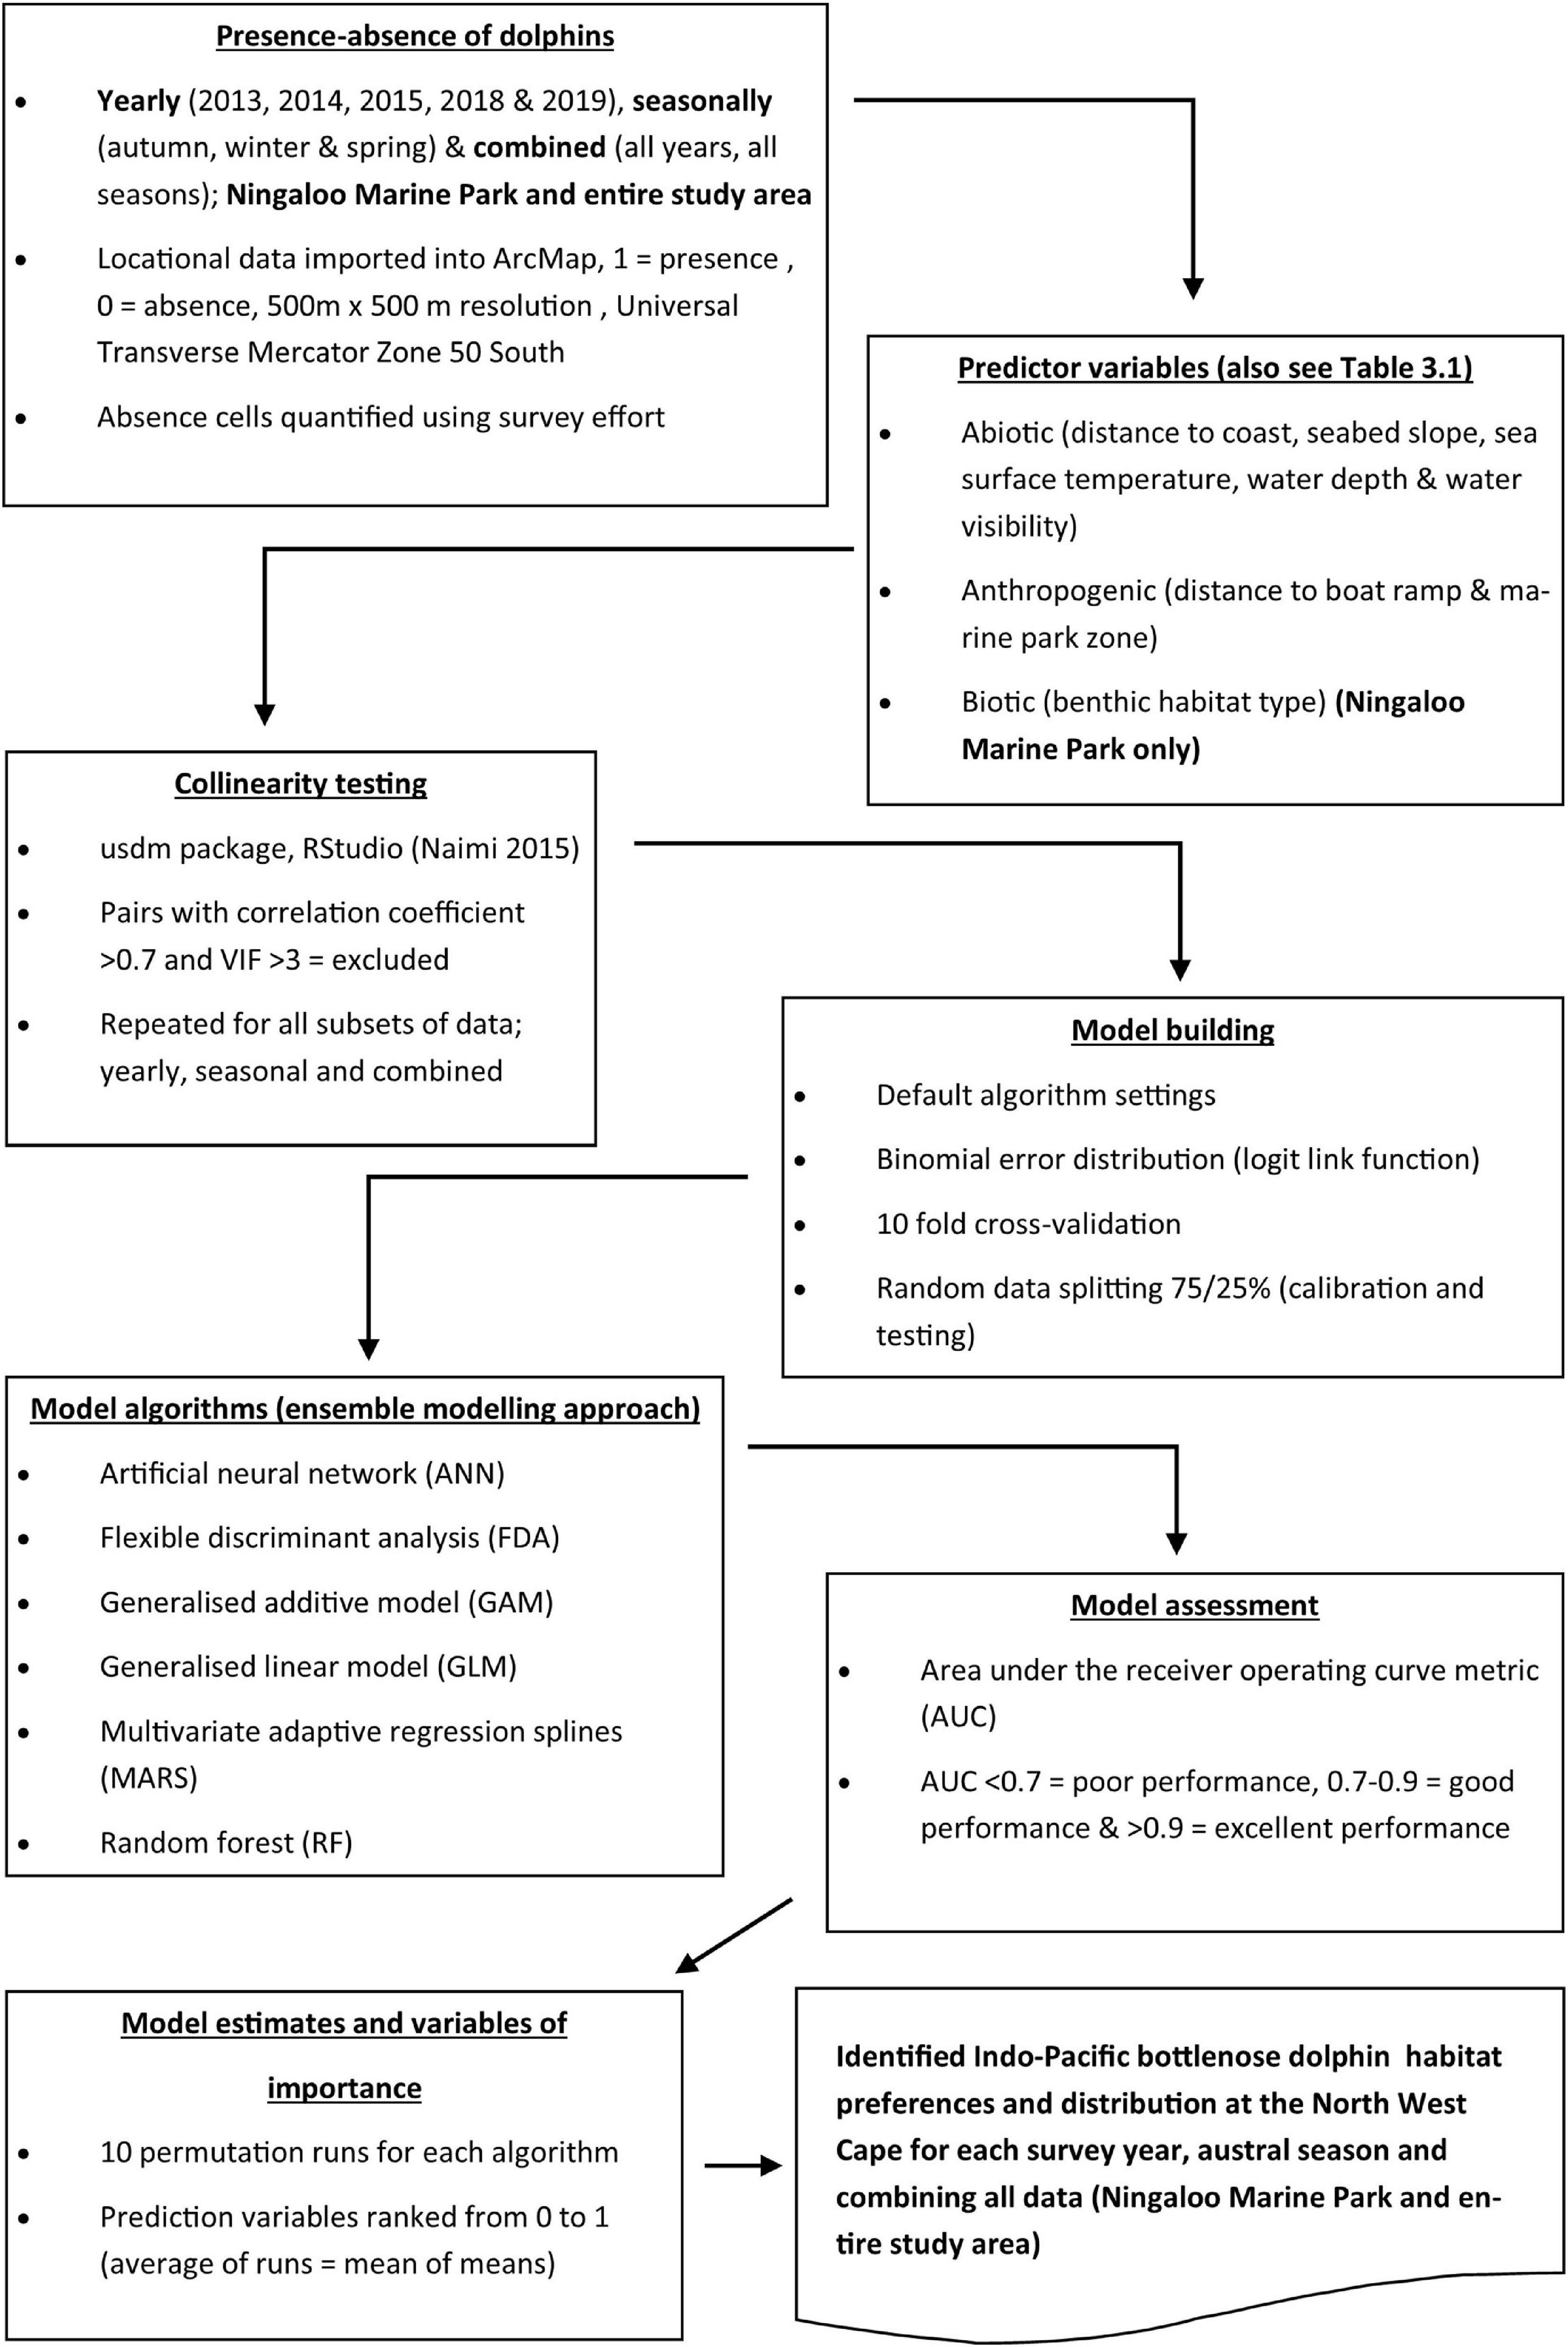
Figure 3. Flowchart summarising the data analysis process used for ensemble modelling of Indo-Pacific bottlenose dolphin (Tursiops aduncus) habitat preferences and distribution at the North West Cape, Western Australia.
Model Assessment
SDMs have the potential to produce false positives (i.e., predict species occurrence in areas where the species does not occur) and false negatives (i.e., fail to predict species occurrence in areas where the species does occur) (Guisan and Thuiller, 2005). The area under the receiver operating characteristic curve (AUC) metric was used to evaluate SDM predictive performance (Fielding and Bell, 1997). Values of AUC range from 0 to 1; with values >0.5 indicating that the model predictions perform better than random, whereas values <0.5 indicates that the model predictions are no better than what would be expected by chance. In general, AUC values of 0.5–0.7 are considered low and represent poor model performance, values of 0.7–0.9 are considered moderate to good, and values above 0.9 represent excellent model performance (Fielding and Bell, 1997; Peterson et al., 2011) (summarised in Figure 3).
Model Estimates and Variables of Importance
The importance of explanatory variables was calculated using a 10-permutation run randomisation procedure within BioMod2 (Thuiller et al., 2009). This procedure allows for a direct comparison between model algorithms and calculates the Pearson’s correlation between the standard predictions and predictions where one variable has been randomly permutated. High correlation (i.e., little difference between the two predictions of variable importance) indicates that the variable is not important in the model, and a low correlation indicates that the variable is important. Variables are then ranked from 0 to 1 according to the mean correlation coefficient, with the variable with the highest ranking the most influential and the lowest, the least influential (Thuiller et al., 2009) (summarised in Figure 3). For each SDM (i.e., overall and season) a mean of means value was calculated, averaging the importance of each environmental variable across the different model algorithms.
Results
Survey Effort and Dolphin Encounters
Over the 5 years of study, a total of 723 h of survey effort were completed (Table 2). Survey effort varied slightly between years and austral seasons due to variability in weather conditions. Overall, the highest survey effort and number of Indo-Pacific (IP) dolphin sightings occurred during the winter months (June-August). Statistical testing confirmed that there was a significant difference in the probability of encounter per hour of survey effort between seasons (p = 0.0137, 2df, X2 = 8.5792). In total, we encountered 323 groups of IP bottlenose dolphins, with 70 seen in autumn, 184 in winter and 69 in spring. Overall, 227 (70%) of these groups were seen inside the NMP section of the study area and the remaining 96 (30%) outside its boundaries (Figure 1).
Table 2. Summary of boat survey effort, number of dolphin schools encountered and number of 500 × 500 m grid cells with dolphin presences and absences used to model Indo-Pacific bottlenose dolphin distribution per season across the entire North West Cape study area.
Collinearity
Correlation testing revealed collinearity between water visibility and water depth, and high VIFs associated with water depth for the data used in the overall and seasonal models. All seasonal data revealed a high VIF associated with water depth (autumn, VIF = 4.00; winter; VIF = 5.72; and spring, VIF = 3.55) and in winter, a high correlation was identified between water depth and water visibility data (r = 0.82). For the overall dataset, collinearity was also identified between water visibility and water depth (r = 0.77) and a high VIF was associated with water depth (VIF = 5.34).
Due to the ecological importance of water depth reported in other coastal bottlenose dolphin habitat use studies (Heithaus and Dill, 2002, 2006; Zanardo et al., 2017; Passadore et al., 2018; Sprogis et al., 2018a; Vargas-Fonesca et al., 2018), water visibility was dropped from all SDMs as an explanatory variable. Additional correlation testing (after the removal of water visibility), revealed no further collinearity within the seasonal and overall datasets. Thus, the remaining six explanatory variables were included in the overall and seasonal SDMs: distance to boat ramp, distance to coast, marine park zone, seabed slope, SST, and water depth.
Overall Ensemble Model of IP Bottlenose Dolphin Distribution
Due to the observed similarities in the location of modelled areas of high probability of dolphin occurrence and the explanatory variables explaining such distribution across years (see Supplementary Material 4), we pooled data (i.e., all 5 years combined) to examine the overall distribution and habitat preferences for IP bottlenose dolphins. After pooling all yearly data together, most of the single SDM algorithms performed well (AUC range = 0.51–0.89, median = 0.81) (Figure 4). Any poor performing algorithm runs were excluded from the ensemble. The ensemble model outperformed all single SDMs with an AUC value of 0.92 indicating excellent model performance (Figure 4).
Figure 4. Performance of the overall (A) and seasonal (B–D) species distribution models of Indo-Pacific bottlenose dolphins at the North West Cape, Western Australia. Boxplots for the AUC (area under the curve of the receiver-operating characteristic) of the 10-cross validation runs of each modelling algorithm (GAM, generalised additive model; GBM, generalised boosted model; RF, random forest; MARS, multivariate adaptive regression splines; ANN, artificial neural network; FDA, flexible discriminant analysis; GLM, generalised linear model). The red line shows the AUC of the ensemble model Values of AUC 0.7 indicate that the model predictive performance is moderate to excellent.
The ensemble model using all 5 years of study identified distance to coast (0.44) and distance to boat ramp (0.27) as the two most influential variables driving IP bottlenose dolphin distribution (Table 3). All single SDM algorithms except GLM, agreed that distance to coast was the biggest driver of dolphin distribution. GLM alone suggested marine park zone as an important variable explaining dolphin distribution (Table 3). Response curves indicated that the probability of dolphin occurrence was highest in areas 1,000–2,000 m from the coast, up to 7,000 m from the nearest boat ramp and in marine park zone 6 (i.e., outside the NMP) (Supplementary Material 6).
Table 3. Importance of predictor variables used in the overall and seasonal species distribution models (SDMs) of Indo-Pacific bottlenose dolphins (Tursiops aduncus) at the North West Cape (NWC), Western Australia (WA).
The combined ensemble model showed a continuous stretch of moderate to high probability of occurrence for IP bottlenose dolphins from the tip and down the eastern side of the NWC (Figure 5). Also, IP bottlenose dolphins had a moderate probability of occurrence (0.61–0.80) in coastal lagoons on the west side of the NWC. Areas with high probability of dolphin occurrence (>0.81) were approximately 50:50 in and out of the NMP, with 51% of high probability of occurrence cells within the NMP and 49% outside these boundaries (Table 4). A small proportion (10%) of high probability of dolphin occurrence cells overlapped with three designated sanctuary zones: Lighthouse Bay, Point Murat and Bundegi Reef (Figure 5).
Figure 5. Ensemble models of Indo-Pacific bottlenose dolphin probability of occurrence at the North West Cape, Western Australia for the overall (A) ensemble and each season (B: autumn; C: winter; and D: spring). Colors as shown in the legend indicate the probability of occurrence 0.00 − 0.40 = low, 0.41 − 0.80 = moderate and 0.81 − 1.00 = high. The General Use Zone is the area outside the Recreational Zone boundary.
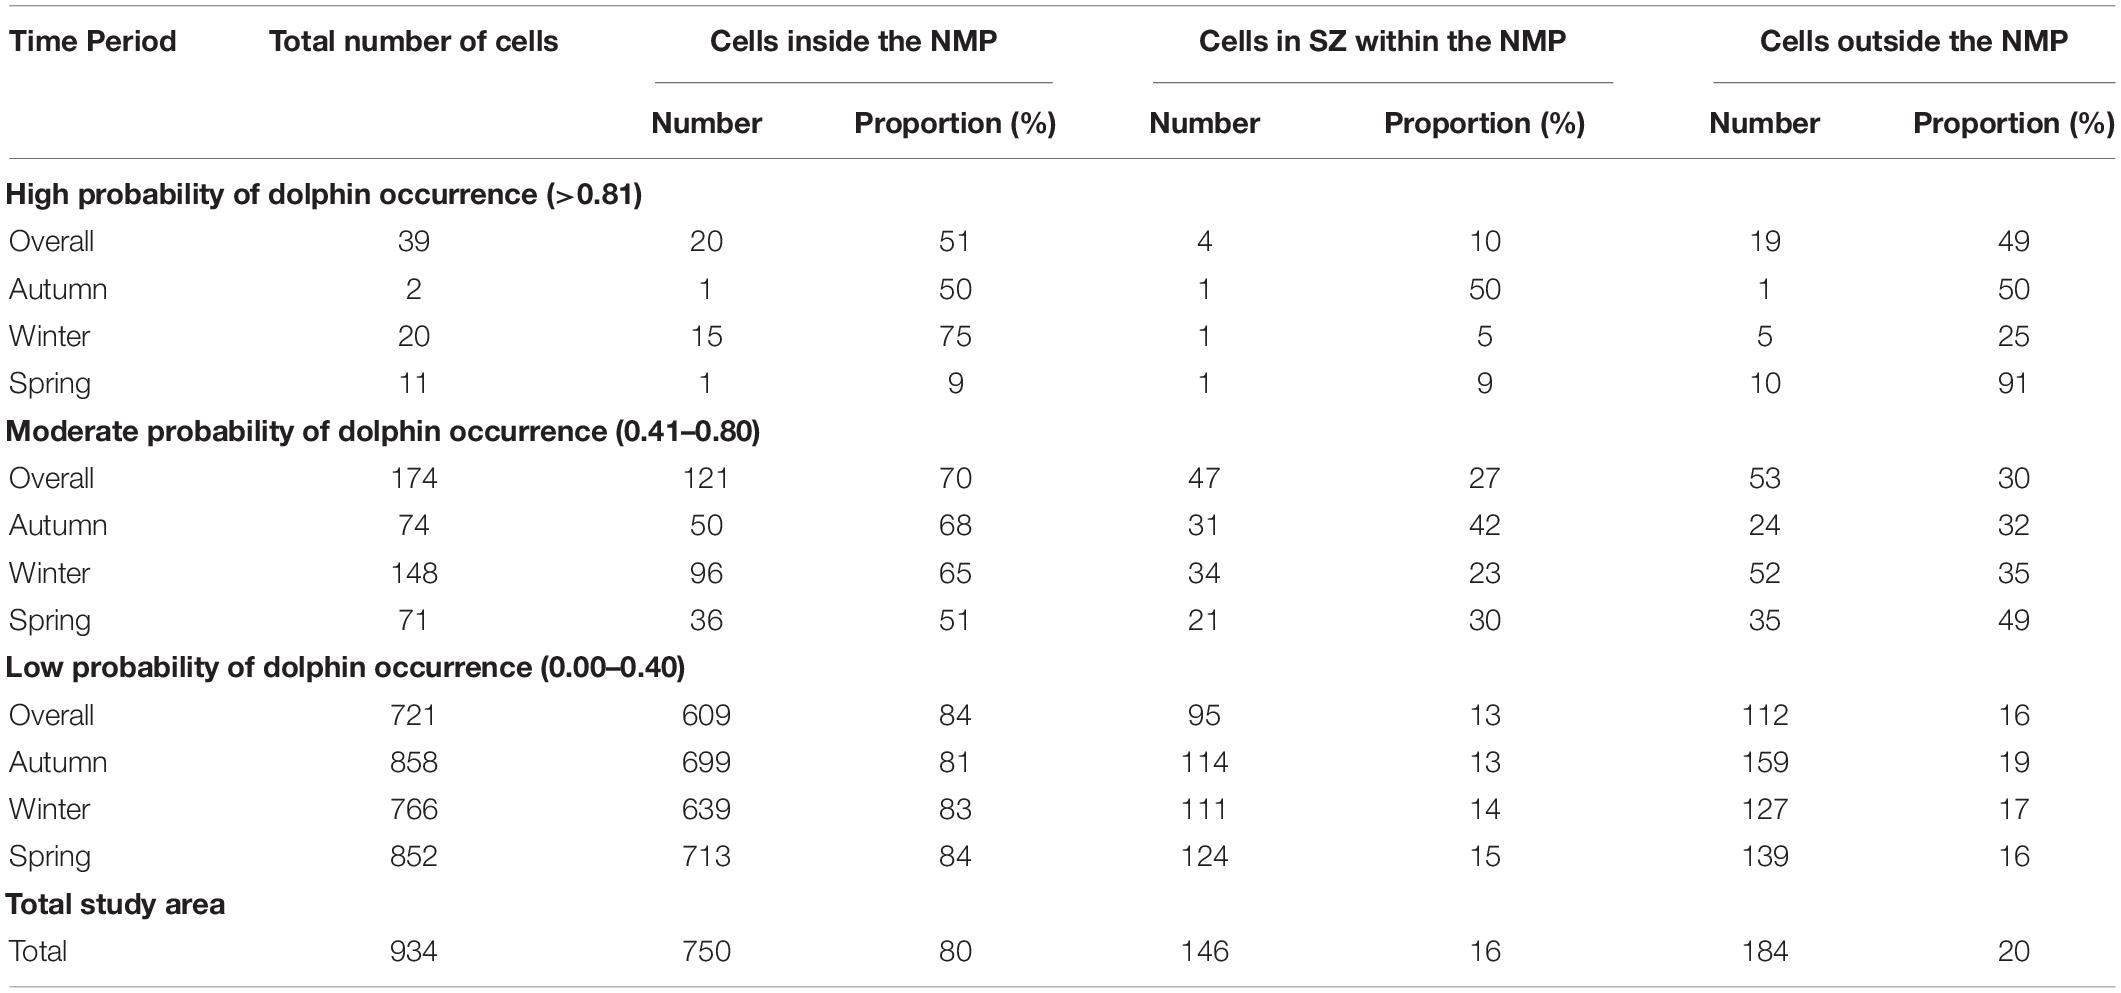
Table 4. Number and proportion (%) of cells with high (>0.81), moderate (0.41–0.80), and low (<0.40) probability of Indo-Pacific bottlenose dolphin occurrence inside and outside the Ningaloo Marine Park (NMP), as well as those cells inside the marine park that fell within designated sanctuary zones (SZ).
Seasonal Ensemble Models of IP Bottlenose Dolphin Distribution
Most of the single seasonal SDMs performed well, with the exception of several runs primarily from the ANN algorithm (autumn, AUC range = 0.50–0.87, median = 0.73; winter, AUC range = 0.40–0.84, median = 0.78 and; spring, AUC range = 0.49–0.80, median = 0.68). These poor performing runs were excluded from the final ensembles. Ensemble models outperformed all single SDMs with AUC values above 0.9 indicating excellent model performance (autumn = 0.95, winter = 0.93, and spring = 0.93) (Figure 4).
The autumn ensemble model identified distance to coast (0.36) and water depth (0.30) as the most important variables influencing IP bottlenose dolphin distribution (Table 3). All single SDM algorithms except GLM, agreed that distance to coast was the biggest driver of dolphin distribution. GLM indicated marine park zone was an important variable explaining dolphin distribution (Table 3). Response curves indicated that the probability of dolphin occurrence was highest in areas 1,000–2,000 m from the coast, in water depths of 7–10 m and outside the NMP, in marine park zone 6 (see Supplementary Material 7). In autumn, only two high probability of occurrence (>0.81) cells were modelled (one inside the NMP, in the Lighthouse Bay Sanctuary Zone and one outside the marine park boundaries) (Table 4). Moderate probability of occurrence (0.61–0.80) was predicted in the Mangrove Bay, Tantabiddi and Jurabi Sanctuary Zones on the west side of the NWC and almost continuously from the Lighthouse Bay Sanctuary Zone at the tip of the NWC to the south-eastern boundary of our study area (Figure 5).
The winter ensemble model identified that the most important variables influencing IP bottlenose dolphin distribution were distance to coast (0.36) and SST (0.24). All individual algorithms, except GLM supported the importance of either of these two variables, with GLM only identifying marine park zone as important (Table 3). Response curves indicated that the probability of dolphin occurrence was higher in areas 1,000–2,000 m from the coast, in water temperatures of 21.5–23.5°C, in marine park zones 3, 5, and 6 (Sanctuary, Naval Waters, and outside the NMP) (Supplementary Material 7). During winter months, high probability of occurrence cells (>0.81) were heavily concentrated around the north-eastern tip of the NWC, with multiple cells extending from Bundegi Reef Sanctuary Zone to outside the NMP (Figure 5). In total 75% of these high probability of occurrence cells fell inside the NMP and 25% outside the boundaries, with 30% within designated Sanctuary Zones (Table 4). Moderate probability of occurrence (0.61–0.80) was predicted in the coastal lagoons on the west side of the NWC and continuously from the Lighthouse Bay Sanctuary Zone to just north of the Exmouth boat ramp (Figure 5).
In spring, the ensemble model predicted the most important variables influencing IP bottlenose dolphin distribution to be marine park zone (0.41) and water depth (0.28) (Table 3). However, the mean of means value indicated that distance to coast was more influential than water depth. All individual algorithms except ANN, agreed with the ensemble, supporting the importance of marine park zone and water depth, with ANN indicating distance to boat ramp (Table 3). Response curves indicated that the probability of dolphin occurrence was higher in water depths of 7–13 m and in marine park zones 3 and 6 (Sanctuary and outside the NMP) (Supplementary Material 7). In spring, majority of the highest probability of occurrence (>0.81) cells were outside the marine park boundary, with 91% outside and 9% inside, in the Jurabi Sanctuary Zone (Table 4). Moderate probability of occurrence (0.61–0.80) fell within the Mangrove Bay, Jurabi, Lighthouse Bay, and Bundegi Reef Sanctuary Zones. During spring, a smaller section of the study area (compared to the other seasonal distribution maps), from Bundegi Reef Sanctuary zone to the south-eastern boundary of the study area had a consistent moderate probability of occurrence (Figure 5).
Discussion
The results of ensemble models revealed that IP bottlenose dolphin distribution at the NWC was primarily influenced by distance to coast (with important habitat occurring within 2,000 m from the coast). Areas of high probability of dolphin occurrence were also influenced by other environmental (i.e., water depth and SST) and anthropogenic variables (i.e., distance to the nearest boat ramp and marine park zone) depending on the year and season, indicating spatially and temporally complex habitat preferences of the IP bottlenose dolphins using the area. Areas of moderate to high probability of occurrence were found to overlap with multiple designated sanctuary zones (subject to the highest level of protection by government), but also occurred in waters outside the boundaries of the NMP (with no formal protection). The seasonal results suggest that there are some slight shifts in the distribution and probability of occurrence of IP bottlenose dolphins at the NWC across seasons, with higher probability of occurrence (>0.81) during winter and spring. Despite these seasonal changes, waters to the north and east of the NWC consistently featured as areas of high probability of dolphin occurrence. This study revealed the importance of coastal waters of the NWC to IP bottlenose dolphins, highlighting the vulnerability of the species to threats associated with human activities occurring in these areas.
The species distribution models presented here have some limitations as they only involved autumn, spring, and winter seasonal data, and thus should not be interpreted in regards to summer distribution, as this is unknown. SDMs lacked individual characteristics (e.g., sex and age) and behavioural data that may influence IP bottlenose dolphin distribution. Also, due to small sample sizes, data pooling of seasonal data across years was required, and thus any annual seasonal variability in species distribution is not represented. Based on the similarities of yearly model outputs (Supplementary Material 3), we expect that these differences would be negligible. Future SDMs would benefit from inclusion of survey data covering all seasons and areas adjacent to the study area, biotic variables such as prey and predator availability, and individual parameters (i.e., age, sex, reproductive status and behaviour).
Potential Drivers of Coastal Dolphin Distribution in Coastal Waters at the North West Cape
Ecological Drivers (i.e., Prey Availability and Predation Risk)
Both prey availability and predation risk are known to influence dolphin distribution and habitat use (Heithaus and Dill, 2002, 2006; Wirsing et al., 2008). Predictor variables used in ensemble models in our study (i.e., water depth, seabed slope, and SST) often represent proxies for prey distribution and predation risk, influencing dolphin distribution elsewhere (Heithaus and Dill, 2002; Ingram and Rogan, 2002; Zanardo et al., 2017; Sprogis et al., 2018a). Occurrence is often a tradeoff between prey availability and predation pressure, and future studies looking further into diet, associated prey availability, and predation pressure are needed to assess the degree of influence these have on dolphin distribution at the NWC, as has been explored in other areas of Western Australia (WA) (Heithaus, 2001; Heithaus and Dill, 2002; McCluskey et al., 2016; Smith et al., 2018; Sprogis et al., 2018b).
Studies have found IP bottlenose dolphins feed on a large variety of prey, mainly comprising teleost fishes and cephalopods (Cockcroft and Ross, 1990; Amir et al., 2005; Yamazaki et al., 2008; Kaiser, 2012; Kiszka et al., 2014). The coastal waters of the NWC contain a rich biodiversity of teleost fish species with 550 species recorded along the Ningaloo Coast and more than 780 species in the Exmouth Gulf (Hutchins et al., 1996; McLean et al., 2016; Fitzpatrick et al., 2019). Many fish species (i.e., mackerel, mullet, trevally, emperor, snapper) and cephalopods recorded at the NWC (Fitzpatrick et al., 2019) have been found to be important in the diets of IP bottlenose dolphins elsewhere (Amir et al., 2005; Kiszka et al., 2014). Many additional fish species present in the NWC coastal waters are also likely prey sources for these dolphins (e.g., bream, flounder, flathead, whiting and herring; Fitzpatrick et al., 2019). The diet of IP bottlenose dolphins at the NWC is not currently known but individuals have been observed preying on trevally and mullet species (Zachary Bald, personal communication and Haughey, Hunt, personal observations). At the NWC, the continental shelf falls within close proximity to the coast, subjecting the area to strong localised currents, with enhanced productivity expected at the mouth of the Exmouth Gulf (e.g., Point Murat) as a result of deeper stratified waters mixing with vertically mixed waters from within the Gulf (Verspecht, 2002). It is plausible that the oceanography in this section of the Cape, likely influences aggregations or distribution of important dietary species of IP bottlenose dolphins. Therefore, it is likely that aggregations of these prey species influence dolphin distribution patterns at the NWC.
Killer whales (Orcinus orca) and tiger sharks (Galeocerdo cuvier) are the most likely predators of IP bottlenose dolphins at the NWC (Pitman et al., 2015; Ferreira et al., 2017; Andrzejacek et al., 2019). Ecotourism charters have reported predation on IP bottlenose dolphins by killer whales within the NMP and several photo-identified individuals bear fresh wounds and scars as a result of shark bites (Haughey et al., 2020). Killer whale families are often observed in waters beyond the fringing Ningaloo Reef on the western side of the NWC during June to November (Pitman et al., 2015), potentially influencing the high probability of IP bottlenose dolphin occurrence less than 2,000 m from the coast at the NWC. However, inshore habitats are likely to contain tiger sharks (Andrzejacek et al., 2019). Information on the likelihood of encountering a predator and how this may influence IP bottlenose dolphin occurrence should be a topic of future research at the NWC and could be obtained through Baited Remote Underwater Video Surveys (BRUVS) in shallow coastal lagoons (e.g., Espinoza et al., 2014), or through acoustic monitoring (e.g., Braccini et al., 2017; Riera et al., 2019).
Boat Traffic
Boat presence in other areas has been linked to behavioural changes in bottlenose dolphin populations including, increased dive times, active avoidance and displacement from preferred habitats (Nowacek et al., 2001; Lusseau, 2003; Bejder et al., 2006; Steckenreuter et al., 2012). Additionally, risk of boat strike increases as boat numbers and traffic overlaps with dolphins core areas of use (Wells and Scott, 1997; Parks et al., 2012; Schoeman et al., 2020). Distance to boat ramp was identified among the top two most influential variable of IP bottlenose distribution in this study, with dolphins more likely to occur in waters within 7,000 m from a boat ramp. One of the key boat launch sites at the NWC and where ecotourism often takes place, the Tantabiddi area and surrounding lagoons, experienced low to moderate probability of IP bottlenose dolphin occurrence year-to-year and seasonally. In contrast, many areas of high probability of occurrence on the eastern side of the Cape were situated in close proximity to Bundegi boat ramp, another key boat launch site. Boat density is highest within coastal lagoons to the west of the NWC, and within waters to the tip and down the east side of the NWC (Smallwood and Beckley, 2012). Thus, the lower probability of occurrence of IP dolphins in the Tantabiddi area may in fact be more indicative of a lack of prey availability in these lagoons, rather than boat presence and should be a topic of future research. Furthermore, given the high degree of overlap between areas of high probability of IP bottlenose dolphin occurrence and high boat density in waters at the tip and east of the NWC (Smallwood and Beckley, 2012; Mitchell et al., 2018), future research should investigate the relationship between density of vessels and IP bottlenose dolphin distribution. The Bundegi Reef/Point Murat area has also been identified as important habitat for Australian humpback dolphins (Sousa sahulensis) (Hunt et al., 2020). With currently high levels of recreational boat use and forecasted increases in human activities in these waters (Bejder et al., 2012; Hanf et al., 2016), it has been previously suggested that this area receive prioritisation to mitigate impacts from increasing human activities faced by dolphins (Hunt et al., 2020). We suggest that managers implement “go slow” zones in areas of high probability of occurrence, particularly those in close proximity to boat ramps and, consider information presented here in future rezoning of the NMP. Such rezoning should include the designation of additional sanctuary zones and extension of the marine park boundary into the Exmouth Gulf to fully encompass key habitats and manage the impacts of anthropogenic influence in this region.
Space and Resource Competition
Given the high density of Australian humpback dolphins (Sousa sahulensis) also occurring in the coastal waters of the NWC, Haughey et al. (2020) suggested that the inter-specific competition with Australian humpback dolphins or intra-specific competition with other IP bottlenose dolphins might be contributing to the low site fidelity of IP bottlenose dolphins at the NWC. Competition for space and resources may also influence habitat use as has been recorded in other studies (Parra, 2006; Kiszka et al., 2012; Ansmann et al., 2015). In the broad scale SDM study by Hanf (2015), a clear distinction in humpback dolphin and bottlenose dolphin distribution was observed, with north-eastern coastal waters of the NWC identified as an area of overlap for high habitat suitability for both species. This study did not model the influence of humpback dolphin occurrence on IP bottlenose dolphin distribution or examine ranging patterns of individual bottlenose dolphins. However, distribution modelling using locational data of Australian humpback dolphin groups within the northern NMP, revealed areas of high probability of occurrence from the boundary of the NMP and around the tip of the Cape to Jurabi Sanctuary Zone (Hunt et al., 2020). Given the degree of overlap in distribution of the two species and potential for dietary overlap as a result of the opportunistic generalist feeding nature of humpback dolphins and unknown dietary preferences in the region (Parra and Jedensjo, 2014), it can be inferred that space and resource competition is likely not influencing the distribution of IP bottlenose dolphins within our study area. Mixed species groups do occur in this area, however, the interaction between these two species and how the distribution of one may affect the other at the NWC is a subject of current, ongoing research outside the scope of this study.
Implications for Conservation and Management
Incorporating the extent of spatial and temporal movement patterns of populations in marine park planning aids managers in identifying particular sites of high management value and thus, determining which sites should be delineated for management in MPAs (Hooker et al., 1999; Hoyt, 2011; Schofield et al., 2013). Without the inclusion of adequate spatial and biological information, habitats can be under-protected and managers should account for species who exhibit seasonal variations to their distribution, movement patterns and habitat use when designating Marine Protected Area (MPA) boundaries and when establishing zoning arrangements (Hooker et al., 2011; Guisan et al., 2013; Hartel et al., 2015; Dwyer et al., 2020).
This study has highlighted the importance of the north-western coastal waters of the Exmouth Gulf to Near Threatened IP bottlenose dolphins and as such, their relevance for conservation and management of this species. Dolphins with nearshore distributions are potentially vulnerable to increasing and cumulative anthropogenic stressors connected with increased use of coastal areas, particularly those experiencing low levels of protection (Cardillo et al., 2005; Davidson et al., 2012; Karczmarski et al., 2017; Cagnazzi et al., 2020). In this study, areas of moderate to high probability of occurrence overlapped moderately with designated Sanctuary Zones within the NMP, but also occurred in waters outside the boundaries of the NMP. Designated sanctuary zones prohibit extractive activities (i.e., fishing), and provide potential aggregations of prey. However, in multiple use zones and outside the NMP, IP bottlenose dolphins are exposed to a variety of anthropogenic threats such as fishing; recreational and commercial (although commercial fishing is not permitted in Recreational zones) and boat traffic.
We have no evidence to reject the idea that the NMP is already providing conservation benefits to the species, considering the NMP is likely contributing to the conservation of other species that interact with individuals of the population (i.e., prey species in no-take zones), and does already encompass a large proportion of key IP bottlenose dolphin habitat. However, the NMP establishment and zoning did not consider the distribution and abundance of marine top predators such as IP bottlenose dolphins. Given the regions recent designation as an IMMA, the data presented here should be taken into account in future zoning reviews and adaptive management efforts of the NMP given the high abundance of IP bottlenose dolphins in the NWC region (Haughey et al., 2020), their apparent reliance on the coastal waters of the NWC (along with sympatric humpback dolphins (Hunt et al., 2020), and their potential important ecological role as one of the main top predators in these coastal waters. Such adaptive management efforts have proven beneficial for the protection of apex and meso-predators in the Great Barrier Reef Marine Park (GBRMP; Fraser et al., 2019), where preceding management and results of research and monitoring were combined, to increase the protection of biodiversity in the GBRMP (Kenchington and Day, 2011).
In addition, our results show that IP bottlenose dolphins use waters outside the NMP, where dolphins are at risk of extractive activities that occur in the Exmouth Gulf. The extent of IP bottlenose dolphin distribution in Exmouth Gulf, associated population structure and impacts of anthropogenic activities on IP bottlenose dolphins are unknown. We suggest that managers implement “go slow” zones in areas of high probability of occurrence, particularly those in close proximity to boat ramps and, consider information presented here in future rezoning of the NMP. Such rezoning should include the designation of additional sanctuary zones and extension of the marine park boundary into the Exmouth Gulf to fully encompass key habitats and manage the impacts of anthropogenic influence in this region. Future research directed at assessing the spatial distribution, abundance, habitat use and population genetic structure of IP bottlenose dolphins in Exmouth Gulf would allow management to determine the importance of Gulf waters to this species. Such studies in conjunction with environmental impact assessments should facilitate the development of management efforts to reduce threats to species, whilst being able to continue economically important anthropogenic activities (i.e., tourism related activities) (Schofield et al., 2013). In future, the key information presented here, can be built on with additional research and monitoring at the NWC to assess any reductions in range which may be indicative of a more vulnerable conservation status (IUCN Standards and Petitions Committee, 2019).
Data Availability Statement
The raw data supporting the conclusions of this article will be made available by the authors, without undue reservation.
Ethics Statement
The animal study was reviewed and approved by the Flinders University Animal Ethics Committee.
Author Contributions
GP conceived the study. GP, TH, and RH designed the study. TH, DH, and RH collected the data. RH analysed the data with advice and contributions to data analysis from GP, TH, DH, RB, and CP. RH wrote the manuscript with contributions to drafting, critical review, and editorial input from all co-authors. All authors contributed to the article and approved the submitted version.
Funding
The Australian Marine Mammal Centre (Project 12/11), the Winifred Violet Scott Charitable Trust, and the Ecological Society of Australia (Holsworth Wildlife Research Endowment) funded this research.
Conflict of Interest
DH was employed by Stenella Marine and Social Science.
The remaining authors declare that the research was conducted in the absence of any commercial or financial relationships that could be construed as a potential conflict of interest.
Acknowledgments
We thank all the research assistants that assisted with the data collection over the 5 years of survey. Data collection was permitted by the WA Department of Biodiversity, Conservation and Attractions (formerly Department of Parks and Wildlife) (Permit numbers SF009240, SF009768, SF010289, 08-001968-1, and FO25000012), WA Department of Agriculture and Food (U38/2013-2015), and the Australian Government Department of Defence (Harold Holt Naval Base Exmouth), with approval from the Flinders University Animal Welfare Committee (E383 and E462/17). We thank the community and businesses of Exmouth, the staff at DPaW Exmouth, the Cape Conservation Group, and MIRG Australia for supporting the North West Cape Dolphin Research Project (NWCDRP). We also thank Simon J. Allen and Lars Bejder for their contributions to the NWCDRP.
Supplementary Material
The Supplementary Material for this article can be found online at: https://www.frontiersin.org/articles/10.3389/fmars.2021.617518/full#supplementary-material
References
Amir, O. A., Berggren, P., Ndaro, S. G. M., and Jiddawi, N. S. (2005). Feeding ecology of the Indo-Pacific bottlenose dolphin (Tursiops aduncus) incidentally caught in the gillnet fisheries off Zanzibar, Tanzania. Estuar. Coast. Shelf Sci. 63, 429–437. doi: 10.1016/j.ecss.2004.12.006
Andrzejacek, S., Gleiss, A. C., Lear, K. O., Pattiaratchi, C. B., and Chapple, T. K. (2019). Biologging Tags Reveal Links Between Fine-Scale Horizontal and Vertical Movement Behaviors in Tiger Sharks (Galeocerdo cuvier). Front. Mar. Sci. 6:229. doi: 10.3389/fmars.2019.00229
Ansmann, I. C., Lanyon, J. M., Seddon, J. M., and Parra, G. J. (2015). Habitat and resource partitioning among Indo-Pacific bottlenose dolphins in Moreton Bay, Australia. Mar. Mamm. Sci. 31, 211–230. doi: 10.1111/mms.12153
Ayukai, T., and Miller, D. (1998). Phytoplankton biomass, production and grazing mortality in Exmouth Gulf, a shallow embayment on the arid, tropical coast of Western Australia. J. Exp. Mar. Biol. Ecol. 225, 239–251. doi: 10.1016/s0022-0981(97)00226-8
Bancroft, K. P., and Sheridan, M. W. (2000). The major marine habitats of Ningaloo Marine Park and the proposed southern extension. Pilbara: Marine Reserve Implementation.
Barbet-Massin, M., Jiguet, F., Albert, C., and Thuiller, W. (2012). Selecting psuedo-absences for species distribution models: how, where and how many? Biol. Conserv. 116, 195–203. doi: 10.5749/j.ctttv5wd.5
Bearzi, G., Azzellino, A., Politi, E., Costa, M., and Bastianini, M. (2008). Influence of seasonal forcing on habitat use by bottlenose dolphins Tursiops truncatus in the Northern Adriatic Sea. Ocean Sci. J. 43, 175–182. doi: 10.1007/bf03029922
Bejder, L., Hodgson, A., Loneragan, N., and Allen, S. J. (2012). Coastal dolphins in North-Western Australia: The need for re-evaluation of species listings and short-comings in the environmental impact assessment process. Pacific Conserv. Biol. 18, 22–25. doi: 10.1071/pc120022
Bejder, L., Samuels, A., Whitehead, H., Gales, N. M., Mann, J., Connor, R. C., et al. (2006). Decline in relative abundance of bottlenose dolphins exposed to long term disturbance. Conservat. Biol. 20, 1791–1798. doi: 10.1111/j.1523-1739.2006.00540.x
Bilgmann, K., Parra, G. J., Holmes, L., Peters, K. J. I, Jonsen, D., and Moller, L. M. (2019). Abundance estimates and habitat preferences of bottlenose dolphins reveal the importance of two gulfs in South Australia. Sci. Rep. 9:8044.
Bossart, G. D. (2011). Marine mammals as sentinel species for oceans and human health. Vet. Pathol. 48, 676–690. doi: 10.1177/0300985810388525
Braccini, M., Rensing, K., Langlois, T. J., and McAuley, R. (2017). Acoustic monitoring reveals the broad-scale movements of commercially important sharks. Mar. Ecol. Prog. Ser. 557, 121–129. doi: 10.3354/meps12251
Braulik, G., Natoli, A., Kiszka, J. J., Parra, G. J., Plön, S., and Smith, B. D. (2019). Tursiops aduncus. The International Union for the Conservation of Nature. Gland: IUCN.
Brown, A., and McLachlan, A. (2002). Sandy shore ecosystems and the threats facing them: some predictions for the year 2025. Environ. Conserv. 29, 62–77. doi: 10.1017/s037689290200005x
Brunskill, G. J., Orpin, A. R., Zagorskis, I., Woolfe, K. J., and Ellison, J. (2001). Geochemistry and particle size of surface sediments of Exmouth Gulf, Northwest Shelf, Australia. Continent. Shelf Res. 21, 157–201. doi: 10.1016/s0278-4343(00)00076-5
Cagnazzi, D., Parra, G. J., Harrison, P. L., Brooks, L., and Rankin, R. W. (2020). Vulnerability of threatened Australian humpback dolphins to flooding and port development within the southern Great Barrier Reef coastal region. Glob. Ecol. Conserv. 24:e01203. doi: 10.1016/j.gecco.2020.e01203
CALM, and MPRA, (2005). Management Plan for the Ningaloo Marine Park and Muiron Islands Marine Management Area, 2005−2015. Perth: Western Australian Government.
Cardillo, M., Mace, G. M., Jones, K. E., Bielby, J., Bininda-Emonds, O. R. P., Sechrest, W., et al. (2005). Multiple causes of high extinction risk in large mammal species. Science 309, 1239–1241. doi: 10.1126/science.1116030
Cassata, L., and Collins, L. B. (2008). Coral reef communities, habitats, and substrates in and near sanctuary zones of Ningaloo Marine Park. J. Coast. Res. 24, 139–151. doi: 10.2112/05-0623.1
Catlin, J., and Jones, R. (2010). Whale shark tourism at Ningaloo Marine Park: A longitudinal study of wildlife tourism. Tourism Manage. 31, 386–394. doi: 10.1016/j.tourman.2009.04.004
Cockcroft, V., and Ross, G. J. B. (1990). Food and feeding of the Indian Ocean bottlenose dolphin off southern Natal, South Africa. San Diego: Academic Press.
Collins, L. B., Zhu, Z. R., Wyrwoll, K., and Eisenhaur, A. (2003). Late Quarterney structure and development of the northern Ningaloo Reef, Australia. Sediment. Geol. 159, 81–94. doi: 10.1016/s0037-0738(03)00096-4
Connor, R. C., Wells, R. S., Mann, J., and Read, A. J. (2000). The bottlenose dolphin. Chicago, IL: University of Chicago Press.
Corkeron, P. J. (2004). Whale watching, iconography and marine conservation. Conserv. Biol. 18, 847–849. doi: 10.1111/j.1523-1739.2004.00255.x
Costanza, R., d’Arge, R., De Groot, R., Farber, S., Grasso, M., Hannon, B., et al. (1997). The value of the world’s ecosystem services and natural capital. Nature 387, 253–260.
Crain, C. M., Halpern, B. S., Beck, M. W., and Kappel, C. V. (2009). Understanding and managing human threats to the coastal marine environment. Ann. N Y. Acad. Sci. 1162, 39–62. doi: 10.1111/j.1749-6632.2009.04496.x
Cui, T., Zhang, J., Wang, K., Wei, J., Mu, B., Ma, Y., et al. (2020). Remote sensing of chlorophyll a concentration in turbid coastal waters based on a global optical water classification system. ISPRS J. Photogrammet. Remote Sens. 163, 187–201. doi: 10.1016/j.isprsjprs.2020.02.017
Davidson, A. D., Boyer, A. G., Kim, H., Pompa-Mansilla, S., Hamilton, M. J., Costa, D. P., et al. (2012). Drivers and hotspots of extinction risk in marine mammals. PNAS 109, 3395–3400. doi: 10.1073/pnas.1121469109
Day, J., Dudley, N., Hockings, M., Holmes, G., Laffoley, D., Stolton, S., et al. (2012). Guidelines for applying the IUCN Protected Area Management Categories to Marine Protected Areas. Gland: International Union for the Conservation of Nature.
Diaz, R. J., and Rosenberg, R. (2008). Spreading dead zones and consequences for marine ecosystems. Science 321, 926–929. doi: 10.1126/science.1156401
Dinnat, E., Le Vine, D., Boutin, J., Meissner, T., and Lagerlof, G. (2019). Remote sensing of sea surface salinity: Comparison of satellite and in situ observations and impact of retrival parameters. Remote Sens. 11:70750.
DPMC (2015). Our North, Our Future: White Paper on Developing Northern Australia. Canberra, ACT: Australian Government.
Dudley, N. (2008). Guidelines for applying protected area management categories. Gland: International Union for the Conservation of Nature.
Dwyer, S. L., Pawley, M. D. M., Clement, D. M., and Stockin, K. A. (2020). Modelling habitat use suggests static spatial exclusion zones are a non-optimal management tool for a highly mobile marine mammal. Mar. Biol. 167:4.
Elith, J., and Graham, C. H. (2009). Do they? How do they? WHY do they differ? On finding reasons for differing performances of species distribution models. Ecography 32, 66–77. doi: 10.1111/j.1600-0587.2008.05505.x
Elith, J., and Leathwick, J. R. (2009). Species distribution models: ecological explanation and prediction across space and time. Annu. Rev. Ecol. Evolut. Systemat. 40, 677–697. doi: 10.1146/annurev.ecolsys.110308.120159
Elith, J., Graham, C. H., Anderson, R. P., Dudík, M., Ferrier, S., Guisan, A., et al. (2006). Novel methods improve prediction of species’ distributions from occurrence data. Ecography 29, 129–151.
Espinoza, M., Cappo, M., Heupel, M. R., Tobin, A. J., and Simpfendorfer, C. A. (2014). Quantifying Shark Distribution Patterns and Species-Habitat Associations: Implications of Marine Park Zoning. PLoS One 9:e106885. doi: 10.1371/journal.pone.0106885
Fernandez, M., Yesson, C., Gannier, A., Miller, P. I., and Azevedo, J. M. N. (2017). The importance of temporal resolution for niche modelling in dynamic marine environments. J. Biogeogr. 44, 2816–2827. doi: 10.1111/jbi.13080
Ferreira, L. C., Thums, M., Heithaus, M. R., Barnett, A., Abrantes, K. G., Holmes, B. J., et al. (2017). The trophic role of a large marine predator, the tiger shark Galeocerdo cuvier. Sci. Rep. 7:2.
Fielding, A. H., and Bell, J. F. (1997). A review of methods for the assessment of prediction errors in conservation presence/absence models. Environ. Conservat. 24, 38–49. doi: 10.1017/s0376892997000088
Fitzpatrick, B., Davenport, A., Penrose, H. M., Hart, C., Gardner, S., Morgan, A., et al. (2019). Exmouth Gulf, north Western Australia: A review of environmental and economic values and baseline scientific survey of the south western region. Western Australia: Report to the Jock Clough Marine Foundation.
Franklin, J. (2010). Mapping species distributions: spatial inference and prediction. Cambridge: Cambridge University Press.
Fraser, K. A., Adams, V. M., Pressey, R. L., and Pandolphi, J. M. (2019). Impact evaluation and conservation outcomes in marine protected areas: A case study of the Great Barrier Reef Marine Park. Biol. Conserv. 238:030.
Friedman, J. H., Hastie, T. J., and Tibshirani, R. J. (2000). Additive logistic regression: a statistical view of boosting. Ann. Statist. 28, 337–407.
Gascoyne Development Commission, Shire of Carnavon, Shire of Exmouth, Shire of Shark Bay, and Shire of Upper Gascoyne (2013). Gascoyne Regional Development Plan 2010–2020.
Garraffo, G., Dans, S., Pedraza, S., Degrati, M., Schiavini, A., Gonzalez, R., et al. (2011). Modelling habitat use for dusky dolphin and Commerson’s dolphin in Patagonia. Mar. Ecol. Prog. Ser. 421, 217–227. doi: 10.3354/meps08912
Gregr, E. J., Baumgartner, J. B., Laidre, K. L., and Palacios, D. M. (2013). Marine mammal habitat models come of age: the emergence of ecological and management relevance. Endanger. Species Res. 22, 205–212. doi: 10.3354/esr00476
Guisan, A., and Thuiller, W. (2005). Predicting species distribution: offering more than simple habitat models. Ecol. Lett. 8, 993–1009. doi: 10.1111/j.1461-0248.2005.00792.x
Guisan, A., and Zimmermann, N. E. (2000). Predictive habitat distribution models in ecology. Ecol. Model. 135, 147–186. doi: 10.1016/s0304-3800(00)00354-9
Guisan, A., Tingley, R., Baumgartner, J. B., Naujokaitis-Lewis, I., Sutcliffe, P. R., Tulloch, A. I. T., et al. (2013). Predicting species distribution for conservation decisions. Ecol. Lett. 16, 1424–1435.
Halpern, B. S., Lester, S. E., and McLeod, K. L. (2010). Placing marine protected areas onto the ecosystem-based management seascape. Proce. Natl. Acad. Sci. 107, 18312–18317. doi: 10.1073/pnas.0908503107
Halpern, B. S., Selkoe, K. A., Micheli, F., and Kappel, C. V. (2007). Evaluating and ranking the vulnerability of global marine ecosystems to anthropogenic threats. Conserv. Biol. 21, 1301–1315. doi: 10.1111/j.1523-1739.2007.00752.x
Hammond, P. S., Bearzi, G., Bjorge, A., Forney, K. A., Karczmarski, L., Kasuya, T., et al. (2012). Tursiops aduncus. Gland: International Union for the Conservation of Nature.
Hanf, D. M. (2015). Species Distribution Modelling of Western Pilbara Inshore Dolphins. Murdoch University.
Hanf, D. M., Hunt, T., and Parra, G. J. (2016). Humpback Dolphins of Western Australia: A Review of Current Knowledge and Recommendations for Future Management. Adv. Mar. Biol. 73, 193–218. doi: 10.1016/bs.amb.2015.07.004
Hartel, E. F., Constantine, R., and Torres, L. G. (2015). Changes in habitat use patterns by bottlenose dolphins over a 10-year period render static management boundaries ineffective. Aquat. Conserv. Mar. Freshw. Ecosyst. 25:2465.
Hastie, T. J., Tibshirani, R. J., and Buja, A. (1994). Flexible Discriminant Analysis by Optimal Scoring. J. Am. Statist. Associat. 89, 1255–1270. doi: 10.1080/01621459.1994.10476866
Haughey, R., Hunt, T. N., Hanf, D. M., Rankin, R. W., and Parra, G. J. (2020). Photographic capture-recapture analysis reveals a large population of Indo-Pacific bottlenose dolphins (Tursiops aduncus) with low site fidelity off the North West Cape, Western Australia. Front. Mar. Sci. 6:781. doi: 10.3389/fmars.2019.00781
Heithaus, M. R. (2001). Shark attacks on bottlenose dolphins (Tursiops aduncus) in Shark Bay, Western Australia: Attack Rate, Bite Scar Frequencies and Attack Seasonality. Mar. Mamm. Sci. 17, 526–539. doi: 10.1111/j.1748-7692.2001.tb01002.x
Heithaus, M. R., and Dill, L. M. (2002). Food availability and tiger shark predation risk influence bottlenose dolphin habitat use. Ecology 83, 480–491. doi: 10.1890/0012-9658(2002)083[0480:faatsp]2.0.co;2
Heithaus, M. R., and Dill, L. M. (2006). Does tiger shark predation risk influence foraging habitat use by bottlenose dolphins at multiple spatial scales? Oikos 114, 257–264. doi: 10.1111/j.2006.0030-1299.14443.x
Hooker, S. K., and Gerber, L. R. (2004). Marine reserves as a tool for ecosystem-based management: The potential importance of megafauna. BioScience 54, 27–39. doi: 10.1641/0006-3568(2004)054[0027:mraatf]2.0.co;2
Hooker, S. K., Canadas, A., Hyrenbach, K. D., Corrigan, C., Polovina, J. J., and Reeves, R. R. (2011). Making protected area networks effective for marine top predators. Endanger. Species Res. 13, 203–218. doi: 10.3354/esr00322
Hooker, S. K., Whitehead, H., and Gowans, S. (1999). Marine protected area design and the spatial and temporal distribution of cetaceans in a submarine canyon. Conserv. Biol. 13, 592–602. doi: 10.1046/j.1523-1739.1999.98099.x
Hoyt, E. (2011). Marine Protected Areas for whales, dolphins and porpoises: a world handbook for cetacean habitat conservation and planning. London: Earthscan.
Hunt, T. N., Allen, S. J., Bejder, L., and Parra, G. J. (2020). Identifying priority habitat for conservation and management of Australian humpback dolphins within a marine protected area. Sci. Rep. 10:6.
Hutchins, J. B., Slack-Smith, S. M., Bryce, C. W., Morrison, S. M., and Hewitt, M. A. (1996). “Marine biological survey of the Muiron Islands and the eastern shore of Exmouth Gulf, Western Australia,” in Prepared for the Ocean Rescue 2000 Program (project number G012/94), (Perth, WA: Western Australian Museum).
Ingram, S. N., and Rogan, E. (2002). Identifying critical areas and habitat preferences of bottlenose dolphins Tursiops truncatus. Mar. Ecol. Prog. Ser. 244, 247–255. doi: 10.3354/meps244247
Inoue, K., Terashima, Y., Shirakihara, M., and Shirakihara, K. (2017). Habitat use by Indo-Pacific Bottlenose Dolphins (Tursiops aduncus) in Amakusa, Japan. Aquat. Mamm. 43, 127–138. doi: 10.1578/am.43.2.2017.127
IUCN-MMPATF (2020). Ningaloo to Montebello Islands IMMA Global Dataset of Important Marine Mammal Areas (IUCN-IMMA).
IUCN Standards, and Petitions Committee, (2019). Guidelines for using the IUCN Red List Categories and Criteria. Gland: IUCN, 14.
James, C. S., Reside, A. E., Vanderwal, J., Pearson, R. G., Burrows, D., Capon, S. J., et al. (2017). Sink or swim? Potential for high faunal turnover in Australian rivers under climate change. J. Biogeogr. 44, 489–501. doi: 10.1111/jbi.12926
Kaiser, S. M. L. (2012). Feeding ecology and dietary patterns of the Indo-Pacific bottlenose dolphin (Tursiops aduncus). Port Elizabeth: Nelson Mandela Metropolitan University.
Karczmarski, L., Huang, S., Wong, W. H., Chang, W. L., Chan, S. C. Y., and Keith, M. (2017). Distribution of a coastal delphinid under the impact of long term habitat loss: Indo-Pacific humpback dolphins off Taiwan’s west coast. Estuar. Coasts 40, 594–603. doi: 10.1007/s12237-016-0146-5
Kenchington, R. A., and Day, J. C. (2011). Zoning, a fundamental cornerstone of effective Marine Spatial Planning: lessons learnt from the Great Barrier Reef, Australia. J. Coast. Conserv. 15, 271–278. doi: 10.1007/s11852-011-0147-2
Kiszka, J. J., Mendez-Fernandez, P., Heithaus, M. R., and Ridoux, V. (2014). The foraging ecology of coastal bottlenose dolphins based on stable isotope mixing models and behavioural sampling. Mar. Biol. 161, 953–961. doi: 10.1007/s00227-014-2395-9
Kiszka, J. J., Simon-Bouhet, B., Gastebois, C., Pusineri, C., and Ridoux, V. (2012). Habitat partitioning and fine scale population structure among insular bottlenose dolphins (Tursiops aduncus) in a tropical lagoon. J. Exp. Mar. Biol. Ecol. 416-417, 176–184. doi: 10.1016/j.jembe.2012.03.001
Koper, R. P., Karczmarski, L., du Preez, D., and Plön, S. (2016). Sixteen years later: occurrence, group size, and habitat use of humpback dolphins (Sousa plumbea) in Algoa Bay, South Africa. Mar. Mamm. Sci. 32, 490–507. doi: 10.1111/mms.12279
La Manna, G., Clo, S., Papale, E., and Sara, G. (2010). Boat traffic in Lampesa waters (Strait of Sicily, Mediterranean Sea) and its relation to the coastal distribution of common bottlenose dolphin (Tursiops truncatus). Ciencias Marinas 36, 71–81. doi: 10.7773/cm.v36i1.1457
Lambert, C., Virgili, A., Pettex, E., Delavenne, J., Toison, V., Blanck, A., et al. (2017). Habitat modelling predictions highlight seasonal relevance of Marine Protected Areas for marine megafauna. Deep Sea Res. Part II 141, 262–274. doi: 10.1016/j.dsr2.2017.03.016
Lester, S. E., Halpern, B. S., Grorud-Colvert, K., Lubchenco, J., Ruttenberg, B. I., Gaines, S. D., et al. (2009). Biological effects within no-take marine reserves: a global synthesis. Mar. Ecol. Prog. Ser. 384, 33–46. doi: 10.3354/meps08029
Lotze, H. K., Lenihan, H. S., Bourque, B. J., Bradbury, R. H., Cooke, R., Kay, M. C., et al. (2006). Depletion, Degradation and Recovery Potential of Estuaries and Coastal Seas. Science 312, 1806–1809. doi: 10.1126/science.1128035
Lucieer, V., Walsh, P., Flukes, E., Butler, C., Proctor, R., and Johnson, C. (2017).Seamap Australia - a national seafloor habitat classification scheme. Tasmania, TAS: University of Tasmania (UTAS).
Lusseau, D. (2003). Effects of Tour Boats on the Behavior of Bottlenose Dolphins: Using Markov Chains to Model Anthropogenic Impacts. Conserv. Biol. 17, 1785–1793. doi: 10.1111/j.1523-1739.2003.00054.x
Lusseau, D., and Higham, J. (2004). Managing the impacts of dolphin-based tourism through the definition of critical habitats: the case of bottlenose dolphins (Tursiops spp) in Doubtful Sound, New Zealand. Touris. Manage. 25, 657–667. doi: 10.1016/j.tourman.2003.08.012
Lyne, V., Fuller, M., Last, P., Butler, A., Martin, M., and Scott, R. (2006). Ecosystem characterisation of Australia’s North West Shelf. Canberra: CSIRO.
MacKenzie, D., and Royle, J. (2005). Designing occupancy studies: general advice and allocating survey effort. J. Appl. Ecol. 42, 1105–1114. doi: 10.1111/j.1365-2664.2005.01098.x
MacLeod, C. D., Mandleberg, L., Schweder, C., Bannon, S. M., and Pierce, G. J. (2008). A comparison of approaches for modelling the occurence of marine animals. Hydrobiologia 612, 21–32. doi: 10.1007/s10750-008-9491-0
Mann, J. (1999). Behavioral sampling methods for cetaceans: A review and critique. Mar. Mamm. Sci. 15, 102–122. doi: 10.1111/j.1748-7692.1999.tb00784.x
Mann, J., Connor, R. C., Barre, L. M., and Heithaus, M. R. (2000). Female reproductive success in bottlenose dolphins (Tursiops sp.): life history, habitat, provisoning and group-size effects. Behaviour. Ecol. 11, 210–219. doi: 10.1093/beheco/11.2.210
Mannocci, L., Boustany, A. M., Roberts, J. J., Palacios, D. M., Dunn, D. C., Halpin, P., et al. (2017). Temporal resolutions in species distribution models of highly mobile marine animals: Recommendations for ecologists and managers. Divers. Distribut. 23, 1098–1109. doi: 10.1111/ddi.12609
Marini, C., Fossa, F., Paoli, C., Bellingeri, M., Gnone, G., and Vassallo, P. (2015). Predicting bottlenose dolphin distribution along Liguria coast (northwestern Mediterranean Sea) through different modelling techniques and indirect predators. J. Environ. Manage. 150, 9–20. doi: 10.1016/j.jenvman.2014.11.008
McCluskey, S. M., Bejder, L., and Loneragan, N. (2016). Dolphin prey availability and calorific value in an estuarine and coastal environment. Front. Mar. Sci. 3:30. doi: 10.3389/fmars.2016.00030
McCullagh, P., and Nelder, J. A. (1989). Generalized Linear Models, 2nd Edn. London: Chapman and Hall.
McLean, D. L., Langlois, T. J., Newman, S. J., Holmes, T. H., Birt, M. J., Bornt, K. R., et al. (2016). Distribution, abundance, diversity and habitat associations of fishes across a bioregion experiencing rapid coastal development. Estuar. Coastal Shelf Sci. 178, 36–47. doi: 10.1016/j.ecss.2016.05.026
Mitchell, J., McLean, D. L., Collin, S. P., Taylor, S. M., Jackson, G., Fisher, R., et al. (2018). Quantifying shark depredation in a recreational fishery in the Ningaloo Marine Park and Exmouth Gulf, Western Australia. Mar. Ecol. Prog. Ser. 587, 141–157. doi: 10.3354/meps12412
Moore, S. E. (2008). Marine mammals as ecosystem sentinels. J. Mammal. 89, 534–540. doi: 10.1644/07-mamm-s-312r1.1
Muloin, S. (1998). Wildlife tourism: the physcological benefits of whale watching. Pacific Touris. Rev. 2, 199–213.
Naimi, B., Hamm, N., Groen, T. A., Skidmore, A. K., and Toxopeus, A. G. (2014). Where is positional uncertainty a problem for species distribution modelling? Ecography 37, 191–203. doi: 10.1111/j.1600-0587.2013.00205.x
Nowacek, D. P., Wells, R. S., and Solow, A. (2001). Short-term effects of boat traffic on bottlenose dolphins, Tursiops truncatus, in Sarasota Bay, Florida. Mar. Mamm. Sci. 17, 673–688. doi: 10.1111/j.1748-7692.2001.tb01292.x
O’Connor, S., Campbell, R., Cortez, H., and Knowles, T. (2009). Whale watching worldwide: Tourism numbers, Expenditures and Expanding Economic Benefits. Melbourne: Economists at Large and Associates.
Paine, R. T. (1969). A note on trophic complexity and community stability. Am. Natural. 103, 91–93. doi: 10.1086/282586
Paine, R. T. (1995). A conversation on refining the concept of key stone species. Conserv. Biol. 9, 962–964. doi: 10.1046/j.1523-1739.1995.09040962.x
Parks, S. E., Warren, J. D., Stamieszkin, K., Mayo, C., and Wiley, D. (2012). Dangerous dining: surface foraging of North Atlantic right whales increases risk of vessel collisions. Biol. Lett. 8, 57–60. doi: 10.1098/rsbl.2011.0578
Parra, G. J. (2006). Resource partitioning in sympatric delphinids: Space use and habitat preferences of Australian snubfin and Indo-Pacific humpback dolphins. J. Anim. Ecol. 75, 862–874. doi: 10.1111/j.1365-2656.2006.01104.x
Parra, G. J., and Jedensjo, M. (2014). Stomach contents of Australian snubfin (Orcaella heinsohni) and Indo-Pacific humpback dolphins (Sousa chinensis). Mar. Mamm. Sci. 30, 1184–1198. doi: 10.1111/mms.12088
Passadore, C., Moller, L. M., Diaz-Aguirre, F., and Parra, G. J. (2018). Modelling dolphin distribution to inform future spatial conservation decisons in a marine protected area. Sci. Rep. 8:2.
Peterson, A. T., Soberón, J., Pearson, R. G., Anderson, R. P., Martínez-Meyer, E., Nakamura, M., et al. (2011). Ecological niches and geographic distributions (MPB-49). Princeton: Princeton University Press.
Phillips, S. J., Dudik, M., Elith, J., Graham, C. H., Lehmann, A., Leathwick, J. R., et al. (2009). Sample selection and bias and presence-only distribution models: implications for background and pseudo-absence data. Ecol. Applicat. 19, 181–197. doi: 10.1890/07-2153.1
Pitman, R. L., Totterdell, J. A., Fearnbach, H., Ballance, L. T., Durban, J. W., and Kemps, H. (2015). Whale killers: Prevalence and ecological implications of killer whale predation on humpback whale calves off Western Australia. Mar. Mamm. Sci. 31, 629–657. doi: 10.1111/mms.12182
R Core Team, (2020). R: A language and Environment for Statistical Computing. Vienna: R Foundation for Statistical Computing.
Rayment, W., Dawson, S., and Webster, T. (2015). Breeding status affects fine-scale habitat selection of southern right whales on their wintering grounds. J. Biogeogr. 42, 463–474. doi: 10.1111/jbi.12443
Rickbeil, G. J. M., Coops, N. C., Drever, M. C., and Nelson, T. A. (2014). Assessing coastal species distribution models through the integration of terrestrial, oceanic and atmospheric data. J. Biogeogr. 41, 1614–1625. doi: 10.1111/jbi.12340
Riera, A., Pilkington, J. F., Ford, J. K. B., Stredulinksy, E. H., and Chapman, N. R. (2019). Passive acoustic monitoring off Vancouver Island reveals extensive use by at-risk Resident killer whale (Orcinus orca) populations. Endanger. Species Res. 39, 221–234. doi: 10.3354/esr00966
Ripley, B. D. (1996). Pattern Recognition and Neural Networks. Cambridge: Cambridge University Press.
Roberge, J. M., and Angelstam, R. (2004). Usefulness of the umbrella species concept as a conservation tool. Conserv. Biol. 18:450.x.
Roman, J., and McCarthy, J. J. (2010). The whale pump: marine mammals enhance primary productivity in a coastal basin. PLoS One 5:13255. doi: 10.1371/journal.pone.0013255
Schoeman, R. P., Patterson-Abrolat, C., and Plön, S. (2020). A global review of vessel collisions with marine animals. Front. Mar. Sci. 7:292. doi: 10.3389/fmars.2020.00292
Schofield, G., Scott, R., Dimadi, A., Fossette, S., Katselidis, K. A., Koutsoubas, D., et al. (2013). Evidence-based marine protected area planning for a highly mobile endangered marine vertebrate. Biol. Conserv. 161, 101–109. doi: 10.1016/j.biocon.2013.03.004
SGS Economics and Planning (2011). Economic Development Opportunities for the Gascoyne Region Associated with Resource Sector Investment and Expansion.
Smallwood, C. B., and Beckley, L. E. (2012). Spatial distribution and zoning compliance of recreational fishing in Ningaloo Marine Park, north-western Australia. Fisher. Res. 125-126, 40–50. doi: 10.1016/j.fishres.2012.01.019
Smallwood, C. B., Beckley, L. E., and Moore, S. A. (2012). Influence of zoning and habitats on the spatial distribution of recreational activities in a multiple-use marine park. Coastal Manage. 40, 381–400. doi: 10.1080/08920753.2012.692312
Smith, F., Allen, S. J., Bejder, L., and Brown, A. (2018). Shark bite injuries on three inshore dolphin species in tropical northwestern Australia. Mar. Mamm. Sci. 34, 87–99. doi: 10.1111/mms.12435
Smith, H., Frere, C., Kobryn, H., and Bejder, L. (2016). Dolphin sociality, distribution and calving as important behavioural patterns informing management. Anim. Conserv. 19, 462–471. doi: 10.1111/acv.12263
Sprogis, K. R., Bejder, L., Hanf, D. M., and Christiansen, F. (2020). Behavioural responses of migrating humpback whales to swim-with-whale activities in the Ningaloo Marine Park, Western Australia. J. Exp. Mar. Biol. Ecol. 522:151254. doi: 10.1016/j.jembe.2019.151254
Sprogis, K. R., Christiansen, F., Raudino, H., Kobryn, H., Wells, R. S., and Bejder, L. (2018a). Sex-specific differences in the seasonal habitat use of a coastal dolphin population. Biodivers. Conserv. 27, 3637–3656. doi: 10.1007/s10531-018-1618-7
Sprogis, K. R., King, C., Bejder, L., and Loneragan, N. (2018b). Frequency and temporal trends of shark predation attempts on bottlenose dolphins (Tursiops aduncus) in temperate Australian waters. J. Exp. Mar. Biol. Ecol. 508, 35–43. doi: 10.1016/j.jembe.2018.08.008
Stamation, K., Croft, D. B., Shaughnessy, P. D., Waples, K. A., and Briggs, S. V. (2007). Educational and conservation value of whale watching. Touris. Mar. Environ. 4, 41–55. doi: 10.3727/154427307784835660
Steckenreuter, A., Möller, L. M., and Harcourt, R. G. (2012). How does Australia’s largest dolphin-watching industry affect the behaviour of a small and resident population of Indo-Pacific bottlenose dolphins? J. Environ. Manage. 97, 14–21. doi: 10.1016/j.jenvman.2011.11.002
Tardin, R. H. I, Maciel, S., Espécie, M. A., Melo-Santos, G., Simão, S. M., and Alves, M. A. S. (2020). Modelling habitat use by the Guiana dolphin, Sotalia guianensis, in south-eastern Brazil: Effects of environmental and anthropogenic variables, and the adequacy of current management measures. Aquat. Conserv. Mar. Freshw. Ecosyst. 30:3290.
Thuiller, W., Lafourcade, B., Engler, R., and Araújo, M. B. (2009). BIOMOD – a platform for ensemble forecasting of species distributions. Ecography 32, 369–373. doi: 10.1111/j.1600-0587.2008.05742.x
Twiggs, E. J., and Collins, L. B. (2010). Development and demise of a fringing coral reef during Holocene environmental change, eastern Ningaloo Reef, Western Australia. Mar. Geol. 275, 20–36. doi: 10.1016/j.margeo.2010.04.004
UNESCO, (2011). Decisions adopted by the World Heritage Committee at its 35th session, Paris, 7 July 2011. Paris: UNESCO.
Vargas-Fonesca, O. A., Kirkman, S. P., Conry, D., Rishworth, G. M., Cockcroft, V., and Pistorius, P. A. (2018). Distribution and habitat use of Indo-Pacific bottlenose dolphins Tursiops aduncus along the south coast of South Africa. Afr. J. Mar. Sci. 40, 439–450. doi: 10.2989/1814232x.2018.1547221
Verspecht, F. (2002). Oceanographic studies around the North West Cape, Western Australia. Western Australia: University of Western Australia.
Wang, J. Y., and Chu Yang, S. (2009). “Indo-Pacific Bottlenose Dolphin,” in Ecyclopedia of Marine Mammals, eds W. F. Perrin, B. Wursig, and J. G. M. Thewissen, (Florida: Academic Press), 602–608. doi: 10.1016/b978-0-12-373553-9.00141-3
Wells, R. S., and Scott, M. D. (1997). Seasonal incidence of boat strikes on bottlenose dolphins near Sarasota, Florida. Mar. Mamm. Sci. 13, 475–480. doi: 10.1111/j.1748-7692.1997.tb00654.x
Wells, R. S., Scott, M. D., and Irvine, A. B. (1987). The social structure of free-ranging bottlenose dolphins. Boston, MA: Springer.
Wilson, B., Reid, R. J., Grellier, K., and Thompson, P. (2004). Considering the temporal when managing the spatial: a population range expansion impacts protected areas-based management for bottlenose dolphins. Anim. Conserv. 7, 331–338. doi: 10.1017/s1367943004001581
Wirsing, A. J., Heithaus, M. R., Frid, A., and Dill, L. M. (2008). Seascapes of fear: evaluating sublethal predator effects experienced and generated by marine mammals. Mar. Mamm. Sci. 24, 1–15. doi: 10.1111/j.1748-7692.2007.00167.x
Yamazaki, T., Oda, S. I., and Shirakihara, M. (2008). Stomach contents of an Indo-Pacific bottlenose dolphin stranded in Amakusa, western Kyushu, Japan. Fisher. Sci. 74, 1195–1197. doi: 10.1111/j.1444-2906.2008.01640.x
Zacarias, D., and Loyola, R. (2018). Distribution modelling and multi-scale landscape connectivity highlight important areas for the conservation of savannah elephants. Biol. Conserv. 224, 1–8. doi: 10.1016/j.biocon.2018.05.014
Zanardo, N., Parra, G. J., Passadore, C., and Moller, L. M. (2017). Ensemble modelling of southern Australian bottlenose dolphin Tursiops sp. distribution reveals important habitats and their potential ecological function. Mar. Ecol. Prog. Ser. 569, 253–266. doi: 10.3354/meps12091
Zurell, D., Franklin, J., König, C., Bouchet, P. J., Dormann, C. F., Elith, J., et al. (2020). A standard protocol for reporting species distribution models. Ecography 43, 1–17.
Keywords: management, conservation, Indo-Pacific bottlenose dolphins, marine protected area, Ningaloo Marine Park, Exmouth Gulf, species distribution modelling
Citation: Haughey R, Hunt TN, Hanf D, Passadore C, Baring R and Parra GJ (2021) Distribution and Habitat Preferences of Indo-Pacific Bottlenose Dolphins (Tursiops aduncus) Inhabiting Coastal Waters With Mixed Levels of Protection. Front. Mar. Sci. 8:617518. doi: 10.3389/fmars.2021.617518
Received: 14 October 2020; Accepted: 20 April 2021;
Published: 29 June 2021.
Edited by:
Rob Harcourt, Macquarie University, AustraliaReviewed by:
James Richard Robbins, University of Portsmouth, United KingdomJoan Gonzalvo, Tethys Research Institute, Italy
Copyright © 2021 Haughey, Hunt, Hanf, Passadore, Baring and Parra. This is an open-access article distributed under the terms of the Creative Commons Attribution License (CC BY). The use, distribution or reproduction in other forums is permitted, provided the original author(s) and the copyright owner(s) are credited and that the original publication in this journal is cited, in accordance with accepted academic practice. No use, distribution or reproduction is permitted which does not comply with these terms.
*Correspondence: Rebecca Haughey, bec.haughey@hotmail.com.au