 Mehmet Akif Sahin
 Leander van den Eijnden
 Cyrine Bhiri
 Ghulam Destgeer
95% of researchers rate our articles as excellent or good
Learn more about the work of our research integrity team to safeguard the quality of each article we publish.
Find out more
ORIGINAL RESEARCH article
Front. Lab Chip Technol. , 19 October 2023
Sec. Imaging and Detection
Volume 2 - 2023 | https://doi.org/10.3389/frlct.2023.1248265
This article is part of the Research Topic The Future of Lab on a Chip Technologies: An Early Career Scientists’ Perspective View all 5 articles
Encoded particles have been used for multiplexed diagnostics, drugs testing, and anti-counterfeiting applications. Recently, shape-coded hydrogel particles with amphiphilic properties have enabled an amplified duplexed bioassay. However, a limitation to read multiple particle shape-codes in an automated manner and within a reasonable time prevents a widespread adaptation of such potent diagnostic platforms. In this work, we applied established deep learning based multi-class segmentation models, such as U-Net, Attention U-Net, and UNet3+, to detect five or more particle shape-codes within a single image in an automated fashion within seconds. We demonstrated that the tested models provided prosaic results, when implemented on an imbalanced and limited raw dataset, with the best intersection over union (IoU) scores of 0.76 and 0.46 for six- and eleven-class segmentation, respectively. We introduced augmentation by translocation (ABT) technique to enhance the performances of the tested models significantly, where the best IoU scores for the six and eleven classes increased to 0.92 and 0.74, respectively. These initial findings to detect multiple shapes of the particles in an automated manner underscore the potential of shape-coded particles to be used in multiplexed bioassays. The code is available at: github.com/destgeerlab/shape-coded-particles.
Advances in image processing have successfully transferred to clinical tissue image analysis with single cell segmentation in digital pathology, whereas numerous other biomedical datasets are being analyzed with emerging image analysis tools every day de Haan et al. (2021); McQuin et al. (2018); Schindelin et al. (2012). Over the years, various open source (ImageJ/NIH Image, CellProfiler, Phyton libraries-Open CV, Scikit-image) and commercial (MATLAB Image Processing Toolbox, ImagePro plus, Metomorph) software packages have been released to ease the biologists’ and experimentalists’ hands to evaluate their data and conclude the system-level results quantitatively in a simpler and shorter workflow Schneider et al. (2012); Pedregosa et al. (2011); Carpenter et al. (2006); Bradski (2000). Image classification and segmentation, object tracking, and reconstruction of 3D representations are major benefits of digital image processing where not only the rule-based algorithms but also deep-learning-based implementations have transformed the analysis of biomedical images, thus enabling the researchers to realize spatial variations embedded in the living systems quantitatively. For instance, from a simple bright field or fluorescent image of a cell, different intracellular organelles, such as the cell’s nuclei, cytoplasm, or walls, can be identified, segmented, and assigned to a separate cell class. Recently, several deep learning models have been developed that can generalize the image segmentation and make it applicable to a diverse dataset of cell images Stringer et al. (2021a); Caicedo et al. (2019); Sommer et al. (2011). Besides cell analysis, artificially intelligent approaches have been used in microfluidic droplet generation and on-demand sorting Lashkaripour et al. (2021); Anagnostidis et al. (2020), image-based cytometry Hu et al. (2020); Gupta et al. (2019), and predicting three-dimensional (3D) structures of proteins from amino acid sequences with atomic-level accuracy Yang et al. (2023). There is an emerging need to apply these deep-learning models for processing images of encoded microparticles viz. increasingly being used in multiplexed bioassays, anti-counterfeiting applications and drugs testing Sahin et al. (2022); Destgeer et al. (2020); Wu et al. (2020); Eun Chung et al. (2014); Pregibon et al. (2007); Lee et al. (2014); Song et al. (2019).
In recent years, U-Net, an architecture specifically designed for biomedical image segmentation, has been extensively used for cell image segmentation and could potentially be used to segment images of encoded microparticles Ronneberger et al. (2015). U-Net’s architecture is based on a fully convolutional network and features a series of upsampling operations that provide precise localization. This model’s efficacy has inspired several improved versions and adaptations, each trying to enhance different aspects of the original model. For example, the Attention U-Net Oktay et al. (2018) introduced attention gates that learn to focus on target structures of varying shapes and sizes in an image, improving the sensitivity and accuracy of its predictions. On the other hand, UNet++ Zhou et al. (2018), a deeply-supervised encoder-decoder network with dense skip pathways, attempted to reduce the semantic gap between the feature maps of the encoder and decoder networks, leading to better segmentation performance. The attention mechanism has also been employed to improve performance in segmenting neural cell instances Yi et al. (2019), focusing the model on valuable features, thereby improving speed and accuracy. Similarly, Multi-scale Attention Net (MA-Net) Fan et al. (2020) integrates local features with global dependencies by introducing a self-attention mechanism. Recent works have introduced novel models like Cellpose Pachitariu and Stringer (2022); Stringer et al. (2021b) and CellT-Net Wan et al. (2023), which offer out-of-the-box results for various image types without the need for model retraining or parameter adjustments. The latest iterations of these models also incorporate human-in-the-loop approaches for model fine-tuning and improved segmentation accuracy. In this work, we will utilize the selected aforementioned neural network architectures to segment shape-coded microparticle images for potential applications in multiplexed bioassays.
The shape-coded microparticles are unique in their ability to compartmentalize nL-pL scale droplet volumes upon simple mixing of reagents (Akhtar et al., 2023). An aqueous droplet is spontaneously retained within the hydrophilic cavity of the amphiphilic microparticle as the continuous oil phase interacts with the outer hydrophobic layer of the particle Destgeer et al. (2020); Wu et al. (2020). Commonly used microfluidic droplet generators and microwell arrays used for compartmentalization require a cleanroom-based fabrication of devices and specialized instruments to operate those devices by an expert user Yelleswarapu et al. (2019); Rissin et al. (2010). In comparison, the amphiphilic microparticles offer a user-friendly, cleanroom-independent, instrument-free, and low-cost solution that relies on the commonly used lab pipettes to mix reagents and form particle-templated droplets (or dropicles) Destgeer et al. (2021). Moreover, the inner layer of these shape-coded microparticles is functionalized to capture biomolecules of interest, whereas the outer layer is used to shape-code them, viz. a feature essential to realize multiplexed bioassays. These shape-coded microparticles, with clearly visible differences in their shapes, are quantitatively differentiated based on geometric parameters such as circularity, cross-sectional area, and perimeter by manually analyzing the particle images acquired by using a standard laboratory microscope or a portable reader for point-of-care applications Shah et al. (2023); Destgeer et al. (2020). However, an automated reading and classification of numerous particle shape codes before recording a colorimetric signal associated with a bioassay require a deep-learning-based image analysis approach suitable for use in the lab or the field.
In a conventional dropicle-based bioassay, we have to scan 10s of wells of a 12- or 24-well plate where each well is seeded with several hundreds of amphiphilic microparticles (Destgeer et al. 2020; Destgeer et al. 2021). A single scan of a well can result in 25–64 images, which can be analyzed by using a semi-manual open-source tool (ImageJ) to extract particle-level information. However, this requires a time-consuming and tedious workflow, which includes steps like format conversion, thresholding to obtain each particle mask, and evaluation of desired physical parameters. Moreover, this semi-manual image analysis approach lacks the ability to segment multiple shape-coded particles within a single image. Therefore, we hypothesize that the potential use of deep-learning-based approaches could offer a highly promising computer-vision-based workflow to automate the traditional image analysis of shape-coded particles. However, the limited availability of particle images in our experimental dataset poses a challenge in developing robust and high-performing deep-learning models. A transfer learning approach can address this limitation by leveraging the knowledge gained from pre-trained models, even if the desired features between two datasets may not perfectly align.
In this study, we performed the first-ever multi-class segmentation of shape-coded particles by using the pre-trained models, such as U-Net, Attention U-Net (A-UNet), and UNet3+ Oktay et al. (2018); Ronneberger et al. (2015); Huang et al. (2020). The performance of these pre-trained models on our raw datasets was prosaic, and on-average marginally altered after conventional augmentation of datasets. Therefore, we developed a new algorithm, i.e., augmentation by translocation (ABT), to augment our datasets in a way that negative effects of class imbalance and limited number of instances can be compensated by evenly distributing shape-coded particles into the empty positions in an image. The ABT-balanced datasets resulted in on-average remarkable performances for all three models in terms of evaluation metrics and convergence speed.
As reported in the earlier work, the shape-coded particles were fabricated using a co-flow lithography technique, where a set of 3D printed and co-axially stacked structured nozzles sculpt the precursor flow streams to cure unique particle shapes upon UV exposure Destgeer et al. (2020). The particle shape codes (SC) were defined based on the sculpting of the outer or/and inner boundaries of the particle, resulting in the following particle shapes used in this work: SC0, SC1, SC2, SC3, SC4, SC13, N, 4H, LL, and TT (Supplementary Table S1). After washing, the cured particles suspended in ethanol were seeded in a well plate for image acquisition using a standard microscope (Nikon, Ti2) equipped with a camera (Figure 1A). High-resolution images of the particles captured in ethanol provided a better contrast with the background than those captured in a continuous oil phase after the dropicle formation. Therefore, we decided to use ethanol-based images in this work for segmentation.
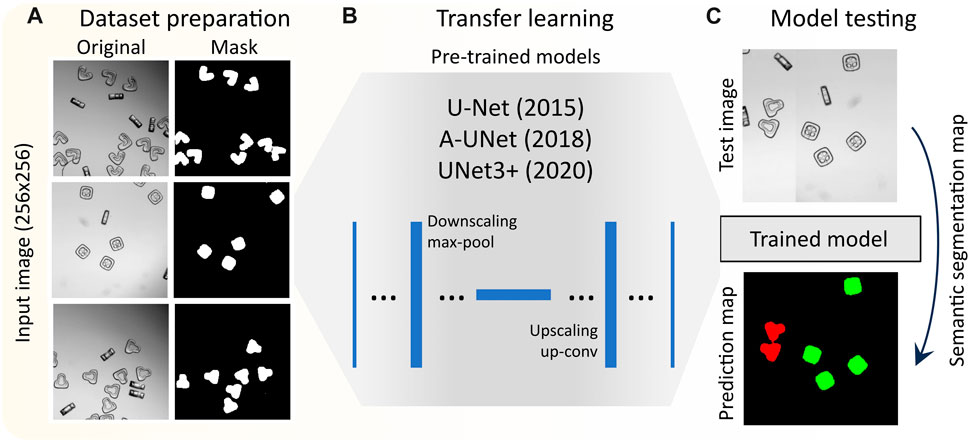
FIGURE 1. Work flow of deep learning based segmentation of shape-coded particles: (A) preparation of dataset composed of bright field particle images, and generation of particle masks based on classes, (B) transfer learning by selected pretrained models, (C) evaluating the performance of different models.
For annotation, we used the Modular Interactive Video Object Segmentation (MiVOS) Cheng et al. (2021) framework to perform pixel-level segmentation by separating the particles in the foreground from the background within a stack of images. With interactive user inputs to create the initial mask and possibilities to propagate and refine the mask from one frame to the next within an image stack, the MiVOS offers a flexible and adaptable solution to rapid annotation. To prepare the data for annotation using MiVOS, the original high-resolution particle images were down-sampled from 2,048 x 2,048 pixels to a resolution of 256 x 256 pixels. This reduction in image resolution was necessary to manage computational resources more effectively and streamline the annotation process. To further aid the annotation process, the captured images for each specific class of shape-coded particles were combined into a single Moving Picture Experts Group (MPEG) format compressed video file, facilitating the sequential viewing and annotation of images by MiVOS.
Annotation commenced with the first frame of the MPEG video analyzed by the MiVOS framework, where a simple click, scribble, or freehand drawing around a target particle was enough to kick-start the process. Once the necessary objects were annotated in the first frame, these annotations were propagated throughout the video. Skimming through the entire frame sequence was crucial to identify any potential inaccuracies in the propagated annotations. Should any misannotations be detected, they were corrected on the spot, and the propagation was then resumed. Despite the MiVOS originally being designed for videos with consecutive frames, and trained on dissimilar data, it has demonstrated remarkable effectiveness in adapting to the unique characteristics of our dataset comprising images of different shape-coded particles. The scribble tool within the MiVOS framework was particularly useful in providing prompt frame-to-frame corrections of the annotation masks. With the MiVOS framework, we built a reasonable database of ground truth masks encompassing a total of 325 processed images, including 1,306 annotated particles’ instances, which were annotated in approximately 5 hours (Figure 1A).
Our Database consisted of ten different particles’ shape-codes, each represented with about 102–165 annotations (Supplementary Table S2). Every particle image in our database had a corresponding segmentation mask. We formulated the first dataset (10S2C, ten particle shapes and only two classes, 325 images), where the mask differentiated only between the image background and the shape-coded particles (Supplementary Table S2). The 10S2C dataset was mainly used to initialize our experiments in the most basic form of binary classification by U-Net based models. To challenge the models’ ability to differentiate between multiple particle shape codes, we built our second (5S6C, five particle shapes with six classes, 170 images) and third (10S11C, ten particle shapes with eleven classes, 325 images) datasets for subsequent experiments. The 5S6C dataset was a subset of the 10S11C dataset. We selected the five visibly most distinct shape-codes in the 5S6C dataset based on the inner (4H), outer (SC0 and SC4), and inner-and-outer (LL and TT) boundary shape-coding of particles.
We split each dataset into subsets for training, validation, and testing where the uneven distribution of shape-coded particles across images posed a challenge. A naive splitting of the dataset into training, testing, and validation sets based on images alone resulted in a significant imbalance concerning the number of annotations per class. To address this issue, we took a more nuanced approach that considered each image’s annotation count per class. By scrutinizing the number of instances per class across our collection of images, we were able to categorize the images into distinct bins. Each bin was designed to contain approximately the same number of annotations. For example, one bin contained images with one to two annotations while another contained five to eight annotations per image. Having divided the images into bins, we then distributed the images from these bins across the training, testing, and validation sets. However, due to a limited total number of particle instances per class per image, it was still challenging to generate a balanced dataset with uniform distribution of particle occurrences across different classes.
We employed two different augmentation approaches to generate an equivalent number of augmented images from the raw datasets. We upscaled our 5S6C and 10S11C datasets with 132 and 251 raw images to 264 and 502 augmented images, respectively, by using the basic augmentation (BA) and augmentation by translocation (ABT) techniques (Figure 2 and Supplementary Figure S1). For the raw dataset, we simply duplicated the raw images to match the dataset volume with the BA and ABT approaches, which included the raw images in addition to the augmented images. The BA approach, based on the Albumentations library, combined rigid and non-rigid transformation options, such as elastic transform, grid distortion, optical distortion, random brightness contrast, CLAHE (contrast limited adaptive histogram equalization), random gamma, vertical flip, and random rotate, for dataset augmentation. Buslaev et al. (2020) Our in-house developed ABT approach was based on augmentation by image mixing; however, it was done very differently here compared to the conventional image mixing methods reported earlier. Hu et al. (2020); Takahashi et al. (2020); Shorten and Khoshgoftaar (2019).
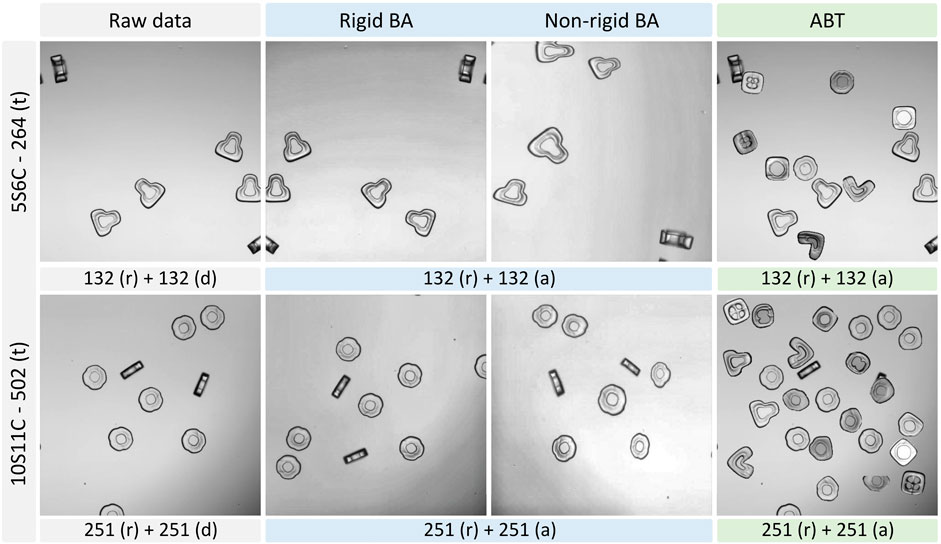
FIGURE 2. Basic augmentation (BA) and augmentation by translocation (ABT) of the example images from the 5S6C and 10S11C datasets. Two sub classes of the BA are depicted: Rigid and non-rigid augmentation. ABT Number of raw (r), duplicated (d) or augmented (a) images are indicated along with the total number of images for the training (t) purpose.
The ABT was particularly tailored to uniformly upscale the random occurrences of shape-coded particles in an image. Specifically, the ABT extracted a shape-coded particle from one image and positioned it at a random, non-overlapping location in another image to increase the particle occurrences per image.
For our experiments, we utilized the Keras-UNet-Collection repository, selecting U-Net (28M parameters), A-UNet (25M parameters), and UNet3+ (24M parameters) for comparative analysis. Detailed model configurations and respective hyperparameters can be accessed in our GitHub repository in the source code. For consistency, the hyperparameters were kept the same for all the three models. We adopted the Visual Geometry Group with 16 convolutional layers (VGG16), which has been pre-trained on the ImageNet dataset, as our encoder backbone primarily due to its compatibility with the A-UNet model. The VGG16 architecture, which merges same-padding convolution and max-pooling kernels, is adept at extracting hierarchical features suitable for attention gates.
For image preprocessing, we employed basic normalization by adjusting the pixel values between 0 and 1, and also used Keras VGG16 batch normalization by replicating a similar process that has been applied to the ImageNet dataset. We investigated the effect of basic and VGG16 normalizations on the convergence rate for our model by conducting experiments on the 5S6C dataset (Supplementary Figure S2). We did not observe a significant difference in the model performance for the two normalizations. Therefore, we decided to stay with the basic normalization method for subsequent experiments.
We selected the Adam optimizer for training purposes. For training evaluation, we adopted the weighted multi-class Dice Loss to address class imbalance during training. Moreover, we utilized standard metrics, including intersection over union (IoU), dice score, average precision (AP), and average recall (AR), to gauge the performance of the tested models. Our training routine consisted of three training steps where, after each training step, the best-performing weights were picked for the subsequent steps as the learning rate was reduced by an order of magnitude. The first training step had 64 epochs with a learning rate of 2.5e-4 and a batch size of 10 (8 for 10S11C) from the raw, BA or ABT datasets. The second and third steps were conducted with only the raw images and consisted of 32 and 16 epochs, respectively.
It is crucial to note that this unique training configuration was not designed to evaluate, nor did this represent, the potential peak performance of the tested models. In our training configuration, instead of employing a grid search for optimal hyperparameters, we opted for the parameters that had demonstrated strong performance in our preliminary tests.
In an effort to foster inclusivity and encourage reproducibility, we intentionally harnessed universally accessible resources for our experiment. As a primary resource, we utilized Google Colab to train our models. Google Colab offers a daily amount of free computational power, thereby providing a readily accessible platform to anyone with a mail account and a browser with internet connectivity. The annotation portion of our work, however, necessitated a more traditional hardware setup due to the graphical interface requirements of the task. Consequently, we conducted this part of the experiment on a personal desktop computer equipped with an Nvidia RTX graphics card.
Prior to the multi-class segmentation experiments, we employed five different U-Net models for the binary classification of particles against a background in order to ensure our datasets’ compatibility with the models, and chose the original U-Net, A-UNet, and UNet3+ for further multi-class analysis (Supplementary Table S3; Supplementary Figure S3). We aimed to evaluate the performance of these three models on our raw 5S6C dataset and its augmented versions (BA and ABT) (Table 1).
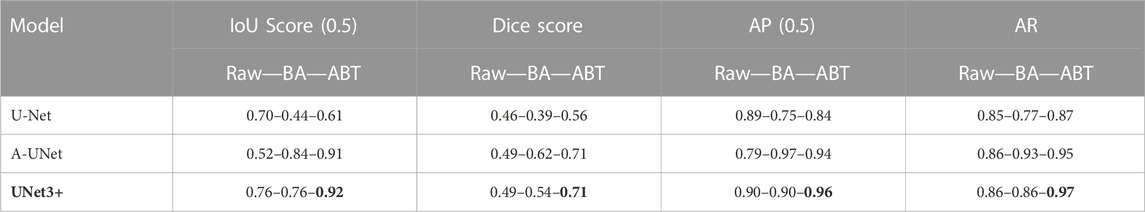
TABLE 1. U-Net, A-UNet, and UNet3+ performance on multi-class 5S6C dataset: The UNet3+ showed best performance when trained on the dataset augmented by translocation (ABT) compared to the basic augmentation (BA) or raw dataset.
When implemented on the raw dataset (test set), the UNet3+ resulted in the best IoU score of 0.76 compared to the worst score of 0.52 for the A-UNet model. The basic augmentation did not improve the IoU score for the UNet3+ but significantly enhanced it to 0.84 for the A-UNet. Counterintuitively, the U-Net performance dropped with the BA dataset as the IoU score slipped from 0.7 to 0.44. When used with the ABT dataset, the UNet3+ performance peaked at an IoU score of 0.92 with a significant boost in the models’ convergence speed (Supplementary Figure S2). The A-UNet-ABT model showed a similar positive trend with an IoU score of 0.91. However, the IoU score of 0.61 for the U-Net-ABT model did not improve from the U-Net-raw model (0.71). Overall, in terms of the IoU scores, the three models performed better with the ABT dataset when compared to the BA dataset. We observed a relatively similar trend in the other evaluation parameters, such as dice score, AP, and AR, without noticeable deviation from the trend in the IoU scores. Cumulatively, the UNet3+-ABT model resulted in the best scores for all the evaluation parameters, whereas the A-UNet-ABT model fell marginally behind.
Based on the best evaluation parameters, we plotted the segmented multi-class images (5S6C) of particles by using the UNet3+-ABT model (Figure 3). The UNet3+ model successfully segmented and classified the five different shape-coded particles, i.e., SC0, SC4, 4H, TT, and LL, within a single image or individual images containing only one shape-code at a time. The UNet3+ model passed the visual test almost flawlessly as the shape-codes categorized in different colors, such as SC0-blue, SC4-yellow, 4H-red, TT-magenta, and LL-green were predicted correctly against the ground truth (see columns 2 and 3 in Figure 3). Object detection by watershed gave separate instances (each colored differently here), which is a useful feature for future analysis on detected particles (see column 4 in Figure 3). Interestingly, object detection by watershed was mostly able to distinguish particles touching each other, which is considered a challenging task. For example, see the center-bottom pair of touching LL shape-coded particles that were detected as separate objects. The UNet3+ model could also navigate particles clustered in a crowded scene, but occasionally some of the particles were impartially detected as background or vice versa. However, the portion of such false detection was minuscule in the tested dataset (please see Supplementary Figure S4 for all tested 5S6C images).
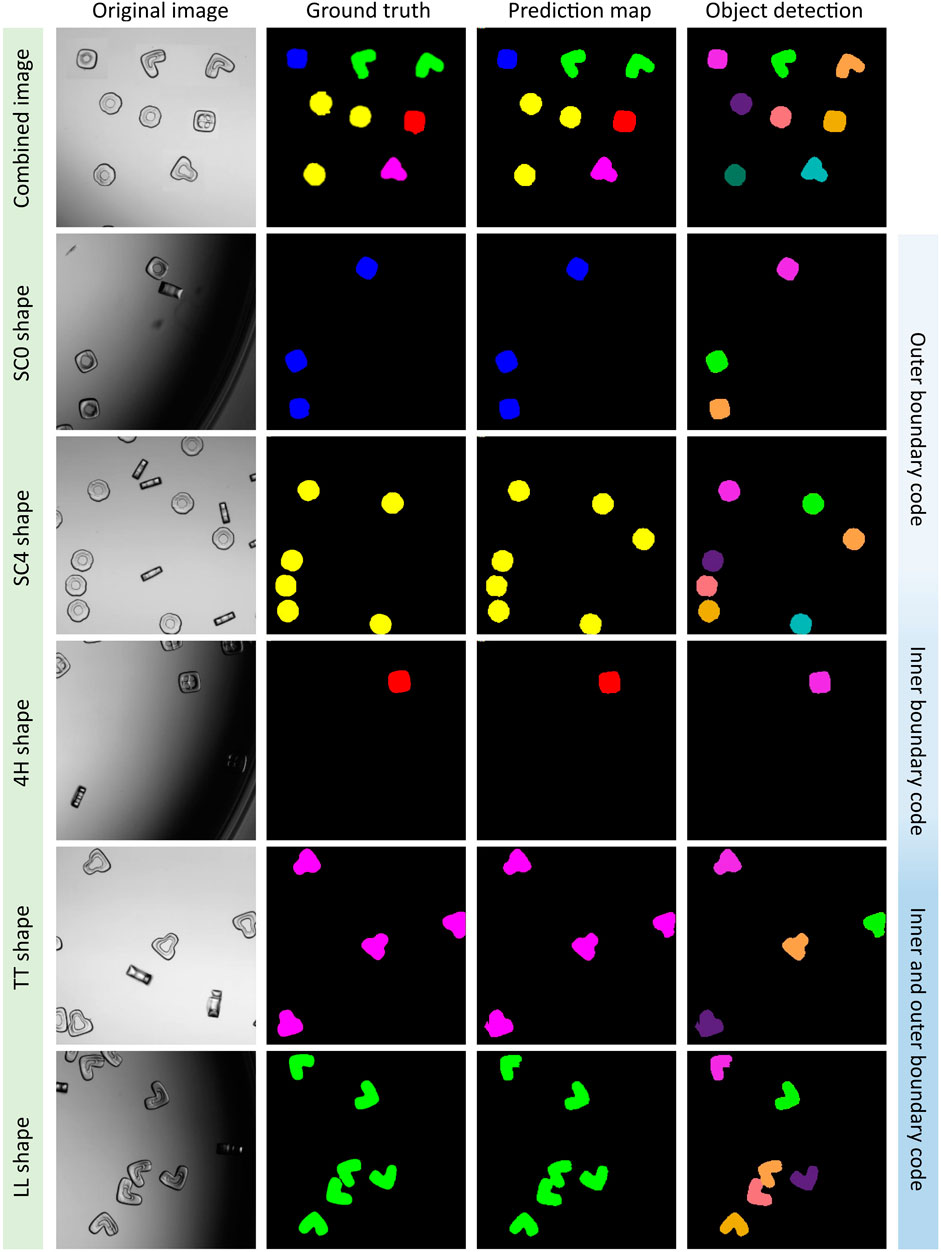
FIGURE 3. UNet3+ model classifying five shape-coded particles in the 5S6C dataset. A virtually generated image consisted of five best performing shapes, i.e., SC0, SC4, 4H, TT, and LL shape-codes, was tested (row1). Rows two to six were examples of the individual shape-codes tested, which indicated a good match between the ground truth and the prediction map, where separate objects were detected successfully.
Building on the promising outcomes from the testing of 5S6C dataset, we embarked on a more rigorous test using the raw 10S11C dataset and its augmented variations. The UNet3+ model achieved a mediocre IoU score of 0.46 when applied to the raw dataset, whereas the A-UNet and U-Net models performed even worse with IoU scores of 0.18 and 0.16, respectively. The A-UNet and U-Net plateaued in their performance on the validation set after several training epochs, showing no further improvements in the training parameters. By training with the BA dataset, IoU score increased from 0.46 to 0.60 for the UNet3+ model. However, the A-UNet and U-Net models did not respond at all upon shifting from raw to BA dataset. Remarkably, with the 10S11C-ABT dataset the training metrics significantly improved for all the three models. The UNet3+-ABT performance incrementally advanced from an IoU score of 0.60–0.72. The A-UNet and U-Net, which previously struggled with the raw and BA datasets, took significant leaps with the ABT dataset from IoU scores of 0.18 and 0.16 to 0.74 and 0.54, respectively. Similar trends were observed in the other training evaluation parameters. This substantial enhancement in the evaluation parameters can be attributed to the dataset structure alteration, i.e., transitioning from a single-class per image to a multi-class representation per image in the ABT dataset, especially given the smaller batch sizes. Overall, in terms of the IoU scores, the three models performed much better with the ABT dataset, compared to the raw and BA datasets. Cumulatively, the A-UNet-ABT model resulted in the best scores for all the evaluation parameters, whereas the UNet3+-ABT model fell marginally behind. However, the best-performing IoU score of 0.74 for the A-UNet-ABT-10S11C model was much lower than the IoU score of 0.92 achieved with the UNet3+-ABT-5S6C model. (Table 2).
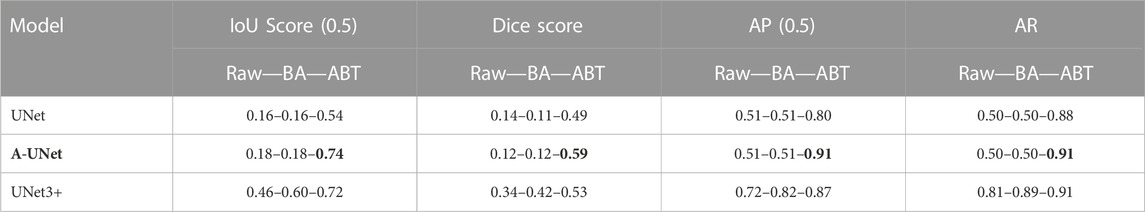
TABLE 2. U-Net, A-UNet, and UNet3+ performance on multi-class 10S11C dataset: The A-UNet showed best performance when trained on the dataset augmentation by translocation (ABT) algorithm compared to the basic augmentation (BA) and raw datasets.
Based on the best evaluation parameters, we plotted the segmented multi-class images of particles by using the A-UNet-ABT-10S11C model. The A-UNet model segmented and classified the ten different shape-coded particles within a single image or individual images containing only one shape-code at a time (see Figure 4; Supplementary Figure S5 for all the tested images). The model performed reasonably well for most of the shape-codes with an IoU score of ≥0.70 (see Supplementary Table S4). The A-UNet-ABT model struggled with the SC13 and N shape-codes, which had the lowest IoU scores of 0.53 and 0.7, respectively. These shape-codes resulted in low-performance parameters with a very clean test image dataset consisting of uniformly distributed particles. This low performance can be attributed to the non-uniformity of these particle shapes, as it is evident from their original BF images (see Supplementary Figure S5). We hope that an advanced post-processing algorithm might help to merge impartially predicted objects as unique singles.
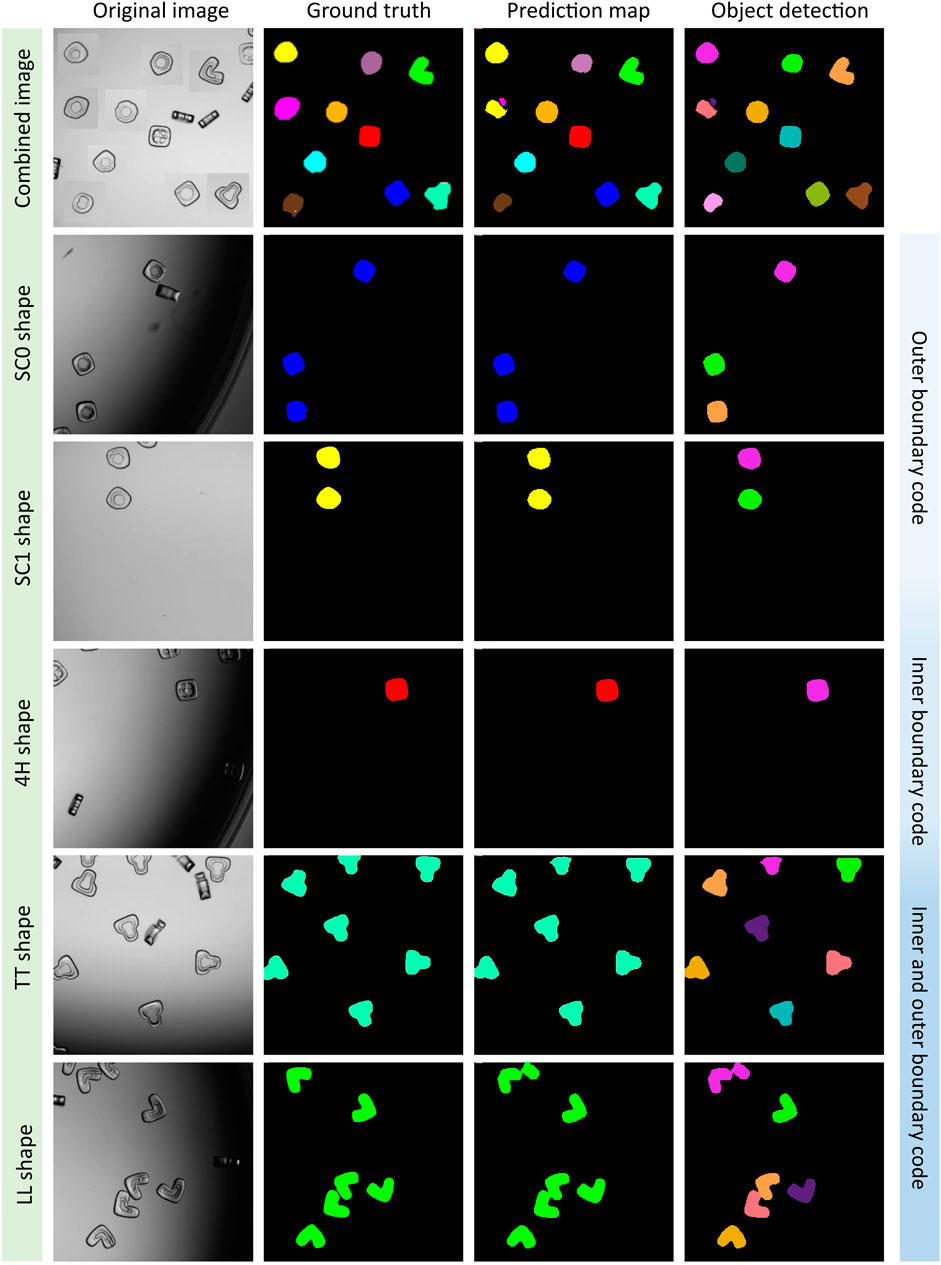
FIGURE 4. A-UNet model classifying five shape-coded particles in the 10S11C dataset. A virtually generated image consisted of ten shapes, i.e., SC0, SC1, SC2, SC3, SC4, SC13, N, 4H, TT, and LL shape-codes, was tested (row1). Rows two to six were examples of the selected individual shape-codes tested, which indicated a good match between the ground truth and the prediction map, where separate objects were detected successfully. See Supplementary Figure S5 for the remaining shapes.
The nature of the ten-shape data, with its disproportionate distribution of annotations per class, creates an unbalanced structure. Limited and unbalanced datasets present several challenges. One of the primary issues is the risk of overfitting, i.e., a modeling error that occurs when a function is too closely fit to a limited set of data points. This might lead to a model which works exceedingly well on the training data but fails to generalize to unseen data. Another issue is the under-representation of some classes, which leads to a bias in the model towards the majority classes, potentially resulting in low predictive accuracy for the minority classes. The absence of sufficiently representative data further complicates the selection of suitable evaluation metrics, as traditional accuracy measures may inadequately reflect the model’s performance when dealing with underrepresented classes. Moreover, the overall complexity in training models increases with limited data availability, as it constrains the ability to effectively learn the necessary features for each class. Nevertheless, a variety of methods can be employed to mitigate these challenges. For instance, re-sampling techniques can be used to balance the dataset. However, oversampling a minority class or undersampling a majority class would be counter productive. Therefore, re-sampling techniques could only by applied with adequate caution. Moreover, cost-sensitive learning can be implemented, which penalizes the misclassification of the minority class more than the majority class during the training phase. Additionally, transfer learning, which leverages the knowledge from pre-trained models, can be quite beneficial when dealing with small datasets. These pre-trained models on larger datasets can provide a good starting point for feature extraction.
Particles that are not fully visible within the boundaries of images can cause inaccurate outcomes, resulting in either false negatives or false positives. This occurs when at least half of a particle is present in an image tile. In the case of relatively smaller particles, the model may fail to recognize them or incorrectly label them as false positives. While this behavior is acceptable in the object detection stage, it is important to note that these particles may still be incorrectly identified. To tackle that problem, a higher overlap ratio can be used for tiling images, and rule-based algorithms can split the images to have less underrepresented particles.
Another significant limitation is that when the model predicts the mask of 2 cells that are closely positioned or touching each other, the watershed algorithm is unable to accurately separate the mask into two distinct instances. Watershed algorithm may help to differentiate them based on the topology; however, the larger dataset with a higher quality of annotation or instance segmentation instead of semantic segmentation can be a possible solution to overcome this problem.
Using a video-based object segmentation tool (MiVOS), the annotation time could be significantly reduced with the mask-propagation utility; however, propagation does not guarantee that each frame/image will be annotated flawlessly. High care is needed to double-check each object and its class, which can sometimes be overwhelming, and the resulting segmentation would not be as good quality as expected. Using MiVOS it took one person to annotate 325 images 5 h. Commercial software such as Apeer (by Zeiss) could be an alternative to annotating the data where several hand tools are represented for neat work. However, the required time will significantly increase (i.e., approximately 15 minutes per image with five instances, calculated with our dataset this could mean 65.3 h for 1,306 instances, or 81.25 h for 325 images). Furthermore, in this work, the annotation is done by only drawing the particles’ outer boundary, where the particle’s inner part is also assigned as a shape class instead of a background. Utilizing the inner boundary of the particle just like the outer boundary during the annotation process may increase the model’s robustness by depicting the transition region between the inner boundary and the inner background.
Basic augmentation enhances the dataset in a way that similar reproduction of raw images results in increased robustness of the model, mitigation of the risk of overfitting, or improved model’s generalization ability. In addition to all of these benefits, ABT naturally addresses class imbalance and, when properly configured, can fully rectify it. For instance, if the initial dataset contains ten instances of class one and five of class two, ABT can prioritize class two during augmentation, thereby balancing the classes without creating additional image load. A key advantage of ABT is its ability to transform datasets that usually contain only single-class images into datasets in which all classes are represented, provided that dataset integrity and reality are maintained.
We noticed during our investigation that specific shapes proved to be more difficult to fit than others. Our shape decision procedure could be extended to virtual tests by digitally creating images of intended shapes to determine the most practical shapes where model performance might be reasonably enhanced. This could help formulate a more effective approach to shape coding, leading to improved segmentation accuracy. More experiments on what particular shape attributes commit to better differentiation will contribute to future work in shape coding. Therefore, including a more robust shape decision procedure, which evaluates and optimizes shape configurations, could provide significant advancements in the accuracy and efficiency of our image segmentation tasks.
Our work did not incorporate the benefits of instance segmentation or the use of cutting-edge frameworks like mask-RCNN (Region-Based Convolutional Neural Network) He et al. (2017). Unlike semantic segmentation, instance segmentation differentiates individual instances of the same class, providing an additional layer of understanding of the images. Deploying more advanced frameworks, like maskRCNN, might have offered additional avenues for model performance improvement. Furthermore, we did not explore the full suite of cell models available or engage in rigorous hyperparameter tuning. A comprehensive exploration of different cell models and meticulous hyperparameter tuning can play a crucial role in optimizing model performance and should be considered in future work.
We have presented a framework for an automated shape-based recognition and analysis of encoded particles. By using three different multi-class segmentation models, up to ten unique shape-coded particles were classified within minutes with reasonable model evaluation scores. The proposed workflow, from the annotation of particles to training the model, constitutes an encouraging path for researchers who would like to train their own datasets. For example, the MiVOS network with a user-friendly interface provided an accelerated (15x faster) annotation process compared to the conventional approaches. Moreover, with the use of dataset augmentation by translocation (ABT), we were able to significantly enhances the models’ performance compared to the basic augmentation (BA) or raw datasets. Overall, our results provided a strong evidence that the shape-coded particles were an excellent fit for the various segmentation models used in this study. The particles’ design allowed for straightforward adaptation by the models, resulting in high-quality segmentation and classification. Furthermore, by selectively tailoring our dataset, we were able to leverage the strengths of these models, illustrating the importance of a carefully curated datasets for the best results. As a future work, we envision that the classified particles can be further analyses to obtain specific information desired for certain bioassays, such as, particles geometric measurements, shape transformation in different mediums, fluorescent intensity readings, etc.
The raw data supporting the conclusions of this article will be made available by the authors, without undue reservation.
MS and GD conceptualized the study. CB and MS built the initial dataset for training and testing purposes. LE and MS optimized the dataset and advanced the workflow by comparing different pretrained models. MS, LE, and GD wrote the manuscript. GD supervised the project. All authors contributed to the article and approved the submitted version.
MS acknowledges TUBITAK and DAAD for the support.
The authors declare that the research was conducted in the absence of any commercial or financial relationships that could be construed as a potential conflict of interest.
All claims expressed in this article are solely those of the authors and do not necessarily represent those of their affiliated organizations, or those of the publisher, the editors and the reviewers. Any product that may be evaluated in this article, or claim that may be made by its manufacturer, is not guaranteed or endorsed by the publisher.
The Supplementary Material for this article can be found online at: https://www.frontiersin.org/articles/10.3389/frlct.2023.1248265/full#supplementary-material
Akhtar, M. U., Sahin, M. A., Werner, H., and Destgeer, G. (2023). “Fabrication of size-coded amphiphilic particles with a configurable 3D-printed microfluidic device for the formation of particle-templated droplets,” in bioRxiv. Cold Spring Harbor Laboratory. Available at: https://www.biorxiv.org/content/early/2023/09/22/2023.09.20.558669. doi:10.1101/2023.09.20.558669
Anagnostidis, V., Sherlock, B., Metz, J., Mair, P., Hollfelder, F., and Gielen, F. (2020). Deep learning guided image-based droplet sorting for on-demand selection and analysis of single cells and 3d cell cultures. Lab. Chip 20, 889–900. doi:10.1039/D0LC00055H
Buslaev, A., Iglovikov, V. I., Khvedchenya, E., Parinov, A., Druzhinin, M., and Kalinin, A. A. (2020). Albumentations: fast and flexible image augmentations. Information 11, 125. doi:10.3390/info11020125
Caicedo, J. C., Goodman, A., Karhohs, K. W., Cimini, B. A., Ackerman, J., Haghighi, M., et al. (2019). Nucleus segmentation across imaging experiments: the 2018 data science bowl. Nat. Methods 16, 1247–1253. doi:10.1038/s41592-019-0612-7
Carpenter, A. E., Jones, T. R., Lamprecht, M. R., Clarke, C., Kang, I. H., Friman, O., et al. (2006). Cellprofiler: image analysis software for identifying and quantifying cell phenotypes. Genome Biol. 7, R100–R111. doi:10.1186/gb-2006-7-10-r100
Cheng, H. K., Tai, Y.-W., and Tang, C.-K. (2021). “Modular interactive video object segmentation: interaction-to-mask, propagation and difference-aware fusion,” in Proceedings of the IEEE/CVF Conference on Computer Vision and Pattern Recognition, Seattle, WA, USA, June 14-19, 2020, 5559–5568.
de Haan, K., Zhang, Y., Zuckerman, J. E., Liu, T., Sisk, A. E., Diaz, M. F. P., et al. (2021). Deep learning-based transformation of h&e stained tissues into special stains. Nat. Commun. 12, 4884. doi:10.1038/s41467-021-25221-2
Destgeer, G., Ouyang, M., and Di Carlo, D. (2021). Engineering design of concentric amphiphilic microparticles for spontaneous formation of picoliter to nanoliter droplet volumes. Anal. Chem. 93, 2317–2326. doi:10.1021/acs.analchem.0c04184
Destgeer, G., Ouyang, M., Wu, C.-Y., and Di Carlo, D. (2020). Fabrication of 3d concentric amphiphilic microparticles to form uniform nanoliter reaction volumes for amplified affinity assays. Lab a Chip 20, 3503–3514. doi:10.1039/d0lc00698j
Eun Chung, S., Kim, J., Yoon Oh, D., Song, Y., Hoon Lee, S., Min, S., et al. (2014). One-step pipetting and assembly of encoded chemical-laden microparticles for high-throughput multiplexed bioassays. Nat. Commun. 5, 3468. doi:10.1038/ncomms4468
Fan, T., Wang, G., Li, Y., and Wang, H. (2020). Ma-net: a multi-scale attention network for liver and tumor segmentation. IEEE Access 8, 179656–179665. doi:10.1109/access.2020.3025372
Gupta, A., Harrison, P. J., Wieslander, H., Pielawski, N., Kartasalo, K., Partel, G., et al. (2019). Deep learning in image cytometry: a review. Cytom. Part A 95, 366–380. doi:10.1002/cyto.a.23701
He, K., Gkioxari, G., Dollár, P., and Girshick, R. (2017). “Mask r-cnn,” in Proceedings of the IEEE international conference on computer vision, Venice, Italy, October 2017, 2961–2969.
Hu, L., Liang, H., Tang, J., Li, X., Huang, L., and Lu, L. (2022). Cutting-splicing data augmentation: a novel technology for medical image segmentation. Available from: https://arxiv.org/abs/2210.09099.
Hu, Z., Tang, A., Singh, J., Bhattacharya, S., and Butte, A. J. (2020). A robust and interpretable end-to-end deep learning model for cytometry data. Proc. Natl. Acad. Sci. 117, 21373–21380. doi:10.1073/pnas.2003026117
Huang, H., Lin, L., Tong, R., Hu, H., Zhang, Q., Iwamoto, Y., et al. (2020). Unet 3+: a full-scale connected unet for medical image segmentation. Available from: https://arxiv.org/abs/2004.08790.
Lashkaripour, A., Rodriguez, C., Mehdipour, N., Mardian, R., McIntyre, D., Ortiz, L., et al. (2021). Machine learning enables design automation of microfluidic flow-focusing droplet generation. Nat. Commun. 12, 25. doi:10.1038/s41467-020-20284-z
Lee, J., Bisso, P. W., Srinivas, R. L., Kim, J. J., Swiston, A. J., and Doyle, P. S. (2014). Universal process-inert encoding architecture for polymer microparticles. Nat. Mater. 13, 524–529. doi:10.1038/nmat3938
McQuin, C., Goodman, A., Chernyshev, V., Kamentsky, L., Cimini, B. A., Karhohs, K. W., et al. (2018). Cellprofiler 3.0: next-generation image processing for biology. PLoS Biol. 16, e2005970. doi:10.1371/journal.pbio.2005970
Oktay, O., Schlemper, J., Folgoc, L. L., Lee, M., Heinrich, M., Misawa, K., et al. (2018). “Attention u-net: learning where to look for the pancreas,”. arXiv preprint arXiv:1804.03999. Available from: https://arxiv.org/abs/1804.03999 (Accessed April 11, 2018).
Pachitariu, M., and Stringer, C. (2022). Cellpose 2.0: how to train your own model. Nat. Methods 19, 1634–1641. doi:10.1038/s41592-022-01663-4
Pedregosa, F., Varoquaux, G., Gramfort, A., Michel, V., Thirion, B., Grisel, O., et al. (2011). Scikit-learn: machine learning in Python. J. Mach. Learn. Res. 12, 2825–2830. doi:10.48550/arXiv.1201.0490
Pregibon, D. C., Toner, M., and Doyle, P. S. (2007). Multifunctional encoded particles for high-throughput biomolecule analysis. Science 315, 1393–1396. doi:10.1126/science.1134929
Rissin, D. M., Kan, C. W., Campbell, T. G., Howes, S. C., Fournier, D. R., Song, L., et al. (2010). Single-molecule enzyme-linked immunosorbent assay detects serum proteins at subfemtomolar concentrations. Nat. Biotechnol. 28, 595–599. doi:10.1038/nbt.1641
Ronneberger, O., Fischer, P., and Brox, T. (2015). “U-net: convolutional networks for biomedical image segmentation,” in Medical Image Computing and Computer-Assisted Intervention–MICCAI 2015: 18th International Conference, Munich, Germany, October 5-9, 2015 (Cham: Springer), 234–241. Proceedings, Part III 18.
Sahin, M. A., Werner, H., Udani, S., Di Carlo, D., and Destgeer, G. (2022). Flow lithography for structured microparticles: fundamentals, methods and applications. Lab. Chip 22, 4007–4042. doi:10.1039/D2LC00421F
Schindelin, J., Arganda-Carreras, I., Frise, E., Kaynig, V., Longair, M., Pietzsch, T., et al. (2012). Fiji: an open-source platform for biological-image analysis. Nat. Methods 9, 676–682. doi:10.1038/nmeth.2019
Schneider, C. A., Rasband, W. S., and Eliceiri, K. W. (2012). Nih image to imagej: 25 years of image analysis. Nat. Methods 9, 671–675. doi:10.1038/nmeth.2089
Shah, V., Yang, X., Arnheim, A., Udani, S., Tseng, D., Luo, Y., et al. (2023). Amphiphilic particle-stabilized nanoliter droplet reactors with a multi-modal portable reader for distributive biomarker quantification. bioRxiv. doi:10.1101/2023.04.24.538181
Shorten, C., and Khoshgoftaar, T. M. (2019). A survey on image data augmentation for deep learning. J. Big Data 6, 60. doi:10.1186/s40537-019-0197-0
Sommer, C., Straehle, C., Köthe, U., and Hamprecht, F. A. (2011). “Ilastik: interactive learning and segmentation toolkit,” in 2011 IEEE International Symposium on Biomedical Imaging: From Nano to Macro, Chicago, Illinois, March - 2 April 2011, 230–233. doi:10.1109/ISBI.2011.5872394
Song, S. W., Kim, S. D., Oh, D. Y., Lee, Y., Lee, A. C., Jeong, Y., et al. (2019). One-step generation of a drug-releasing hydrogel microarray-on-a-chip for large-scale sequential drug combination screening. Adv. Sci. 6, 1801380. doi:10.1002/advs.201801380
Stringer, C., Wang, T., Michaelos, M., and Pachitariu, M. (2021a). Cellpose: a generalist algorithm for cellular segmentation. Nat. Methods 18, 100–106. doi:10.1038/s41592-020-01018-x
Stringer, C., Wang, T., Michaelos, M., and Pachitariu, M. (2021b). Cellpose: a generalist algorithm for cellular segmentation. Nat. methods 18, 100–106. doi:10.1038/s41592-020-01018-x
Takahashi, R., Matsubara, T., and Uehara, K. (2020). Data augmentation using random image cropping and patching for deep CNNs. IEEE Trans. Circuits Syst. Video Technol. 30, 2917–2931. doi:10.1109/tcsvt.2019.2935128
Wan, Z., Li, M., Wang, Z., Tan, H., Li, W., Yu, L., et al. (2023). Cellt-net: a composite transformer method for 2-d cell instance segmentation. IEEE J. Biomed. Health Inf., 1–15. doi:10.1109/jbhi.2023.3265006
Wu, C.-Y., Ouyang, M., Wang, B., de Rutte, J., Joo, A., Jacobs, M., et al. (2020). Monodisperse drops templated by 3d-structured microparticles. Sci. Adv. 6, eabb9023. doi:10.1126/sciadv.abb9023
Yang, Z., Zeng, X., Zhao, Y., and Chen, R. (2023). Alphafold2 and its applications in the fields of biology and medicine. Signal Transduct. Target. Ther. 8, 115. doi:10.1038/s41392-023-01381-z
Yelleswarapu, V., Buser, J. R., Haber, M., Baron, J., Inapuri, E., and Issadore, D. (2019). Mobile platform for rapid sub–picogram-per-milliliter, multiplexed, digital droplet detection of proteins. Proc. Natl. Acad. Sci. 116, 4489–4495. doi:10.1073/pnas.1814110116
Yi, J., Wu, P., Jiang, M., Huang, Q., Hoeppner, D. J., and Metaxas, D. N. (2019). Attentive neural cell instance segmentation. Med. image Anal. 55, 228–240. doi:10.1016/j.media.2019.05.004
Zhou, Z., Rahman Siddiquee, M. M., Tajbakhsh, N., and Liang, J. (2018). “Unet++: a nested u-net architecture for medical image segmentation,” in Deep Learning in Medical Image Analysis and Multimodal Learning for Clinical Decision Support: 4th International Workshop, DLMIA 2018, and 8th International Workshop, ML-CDS 2018, Held in Conjunction with MICCAI 2018, Granada, Spain, September 20, 2018 (Cham: Springer), 3–11. Proceedings 4.
Keywords: lab-on-a-particle, shape-coded particles, amphiphilic compartments, deep neural network, segmentation, augmentation by translocation
Citation: Sahin MA, van den Eijnden L, Bhiri C and Destgeer G (2023) Deep learning based recognition of shape-coded microparticles. Front. Lab. Chip. Technol. 2:1248265. doi: 10.3389/frlct.2023.1248265
Received: 26 June 2023; Accepted: 05 October 2023;
Published: 19 October 2023.
Edited by:
Yiqiang Fan, Beijing University of Chemical Technology, ChinaReviewed by:
Michele D'Orazio, University of Rome Tor Vergata, ItalyCopyright © 2023 Sahin, van den Eijnden, Bhiri and Destgeer. This is an open-access article distributed under the terms of the Creative Commons Attribution License (CC BY). The use, distribution or reproduction in other forums is permitted, provided the original author(s) and the copyright owner(s) are credited and that the original publication in this journal is cited, in accordance with accepted academic practice. No use, distribution or reproduction is permitted which does not comply with these terms.
*Correspondence: Ghulam Destgeer, Z2h1bGFtLmRlc3RnZWVyQHR1bS5kZQ==
†These authors have contributed equally to this work
Disclaimer: All claims expressed in this article are solely those of the authors and do not necessarily represent those of their affiliated organizations, or those of the publisher, the editors and the reviewers. Any product that may be evaluated in this article or claim that may be made by its manufacturer is not guaranteed or endorsed by the publisher.
Research integrity at Frontiers
Learn more about the work of our research integrity team to safeguard the quality of each article we publish.