 Tariq Alkhatatbeh
 Ahmad Alkhatatbeh
 Qin Guo1
 Jiechen Chen
 Jidong Song
 Wang Wei
95% of researchers rate our articles as excellent or good
Learn more about the work of our research integrity team to safeguard the quality of each article we publish.
Find out more
ORIGINAL RESEARCH article
Front. Immunol. , 29 January 2025
Sec. Cancer Immunity and Immunotherapy
Volume 16 - 2025 | https://doi.org/10.3389/fimmu.2025.1532248
This article is part of the Research Topic Harnessing Big Data for Precision Medicine: Revolutionizing Diagnosis and Treatment Strategies View all 36 articles
Purpose: Distinguishing between Osteonecrosis of the femoral head (ONFH) and Osteoarthritis (OA) can be subjective and vary between users with different backgrounds and expertise. This study aimed to construct and evaluate several Radiomics-based machine learning models using MRI to differentiate between those two disorders and compare their efficacies to those of medical experts.
Methods: 140 MRI scans were retrospectively collected from the electronic medical records. They were split into training and testing sets in a 7:3 ratio. Handcrafted radiomics features were harvested following the careful manual segmentation of the regions of interest (ROI). After thoroughly selecting these features, various machine learning models have been constructed. The evaluation was carried out using receiver operating characteristic (ROC) curves. Then NaiveBayes (NB) was selected to establish our final Radiomics-model as it performed the best. Three users with different expertise and backgrounds diagnosed and labeled the dataset into either OA or ONFH. Their results have been compared to our Radiomics-model.
Results: The amount of handcrafted radiomics features was 1197 before processing; after the final selection, only 12 key features were retained and used. User 1 had an AUC of 0.632 (95% CI 0.4801-0.7843), User 2 recorded an AUC of 0.565 (95% CI 0.4102-0.7196); while User 3 was on top with an AUC of 0.880 (95% CI 0.7753-0.9843). On the other hand, the Radiomics model attained an AUC of 0.971 (95% CI 0.9298-1.0000); showing greater efficacy than all other users. It also demonstrated a sensitivity of 0.937 and a specificity of 0.885. DCA (Decision Curve Analysis displayed that the radiomics-model had a greater clinical benefit in differentiating OA and ONFH.
Conclusion: We have successfully constructed and evaluated an interpretable radiomics-based machine learning model that could distinguish between OA and ONFH. This method has the ability to aid both junior and senior medical professionals to precisely diagnose and take prompt treatment measures.
Distinguishing osteonecrosis of the femoral head (ONFH) from osteoarthritis (OA) is essential for optimal clinical management, given the significant differences in their underlying pathophysiology, prognosis, and treatment approaches (1, 2). Magnetic resonance imaging (MRI) is fundamental in diagnosis (3), offering excellent soft tissue contrast and the capability to identify early structural changes. Visual interpretation of MRI findings can be subjective and frequently overlaps between osteonecrosis of the femoral head (ONFH) and osteoarthritis (OA), creating challenges for accurate diagnosis, especially in early or end-stage cases (4). A prior study indicated that the diagnoses of osteonecrosis of the femoral head (ONFH) established by radiologists and orthopedic surgeons exhibited only modest concordance. The authors determined the necessity of establishing a consistent, precise, and successful diagnostic technique (5).
Recent advancements in radiomics and machine learning have revolutionized medical imaging analysis, enabling the extraction of high-dimensional quantitative features from MRI data that surpass traditional radiological techniques. Radiomics allows for the quantification of detailed imaging patterns; such as texture, intensity, and shape. Potentially linked to microstructural changes specific to osteonecrosis of the femoral head (ONFH) or osteoarthritis (OA). Studies on knee osteoarthritis demonstrated that MRI-based radiomics could effectively evaluate cartilage (6) and subchondral bone morphology (7), aiding in the diagnosis (8), and prediction of disease severity and progression, including cartilage degeneration (9).
Similarly, radiomics has identified distinct texture and shape characteristics associated with necrotic areas in the hip, allowing early detection and diagnosis of ONFH (10, 11). This approach has also been employed to distinguish between osteosarcoma and chondrosarcoma (12), as well as to differentiate avascular necrosis from transient osteoporosis (13). Furthermore, radiomics has been applied to predict knee pain improvement (14); and valuable insights were given on the use of radiomics in OA through this comprehensive review (15). These developments highlight the growing potential of radiomics to enhance diagnostic accuracy and treatment strategies in musculoskeletal disorders.
This study presents a novel radiomics framework that incorporates SHAP (SHapley Additive Explanations) to distinguish between osteoarthritis (OA) and osteonecrosis of the femoral head (ONFH). SHAP offers a transparent way to interpret machine learning models by breaking down how individual radiomics features contribute to diagnostic predictions. This research is the first to apply such an approach for differentiating OA and ONFH, tackling a critical diagnostic challenge with impressive accuracy.
Unlike earlier studies that primarily focused on knee-related conditions or relied on single- or multi-sequence imaging only to diagnose ONFH, this study evaluates the performance of a radiomics-based model against three health professionals with varying levels of expertise. The results emphasize the model’s consistency and reliability, addressing the variability often seen in human diagnoses and enhancing its potential for real-world clinical use.
By focusing on two disorders that are clinically distinct yet radiologically similar, this study demonstrates how advanced radiomics can refine diagnostic precision and facilitate timely treatment decisions. It has the ability to outperform human experts in certain scenarios while also aiding less experienced physicians in making more accurate diagnoses. Furthermore, the integration of interpretable machine learning ensures that the approach is accessible and practical for everyday use, ultimately improving patient care in different orthopedic settings.
From February 2016 to April 2024, a senior musculoskeletal radiologist at Xi’an Jiaotong University Second Hospital reviewed radiographs taken by 140 patients; 70 of these patients had osteoarthritis (OA), and 70 had osteoarthritis (ONFH). Thus, the ground truth for our investigation and the development of various machine learning models was based on these. Clinical information and potential risk factors such as a history of steroid usage or alcohol consumption, the presence of a double line sign, and MRI markers of sclerotic and necrotic bone alterations were considered when evaluating MRI results for ONFH patients. The evaluation for OA patients centered on recent indications of inflammation, MRI-confirmed synovitis, elevated subchondral bone signal, bone marrow edema, and joint effusion. Patients were not included in the study if they had any of the following conditions: a history of hip-related problems, collapsing femoral heads, bone cancers, or low-quality MRI pictures. Our hospital’s electronic health record system was the source of the data. See Figure 1 for a visual representation of the research design pipeline. Patients were not required to provide informed consent for this retrospective analysis, which was approved by our hospital’s ethics review board.
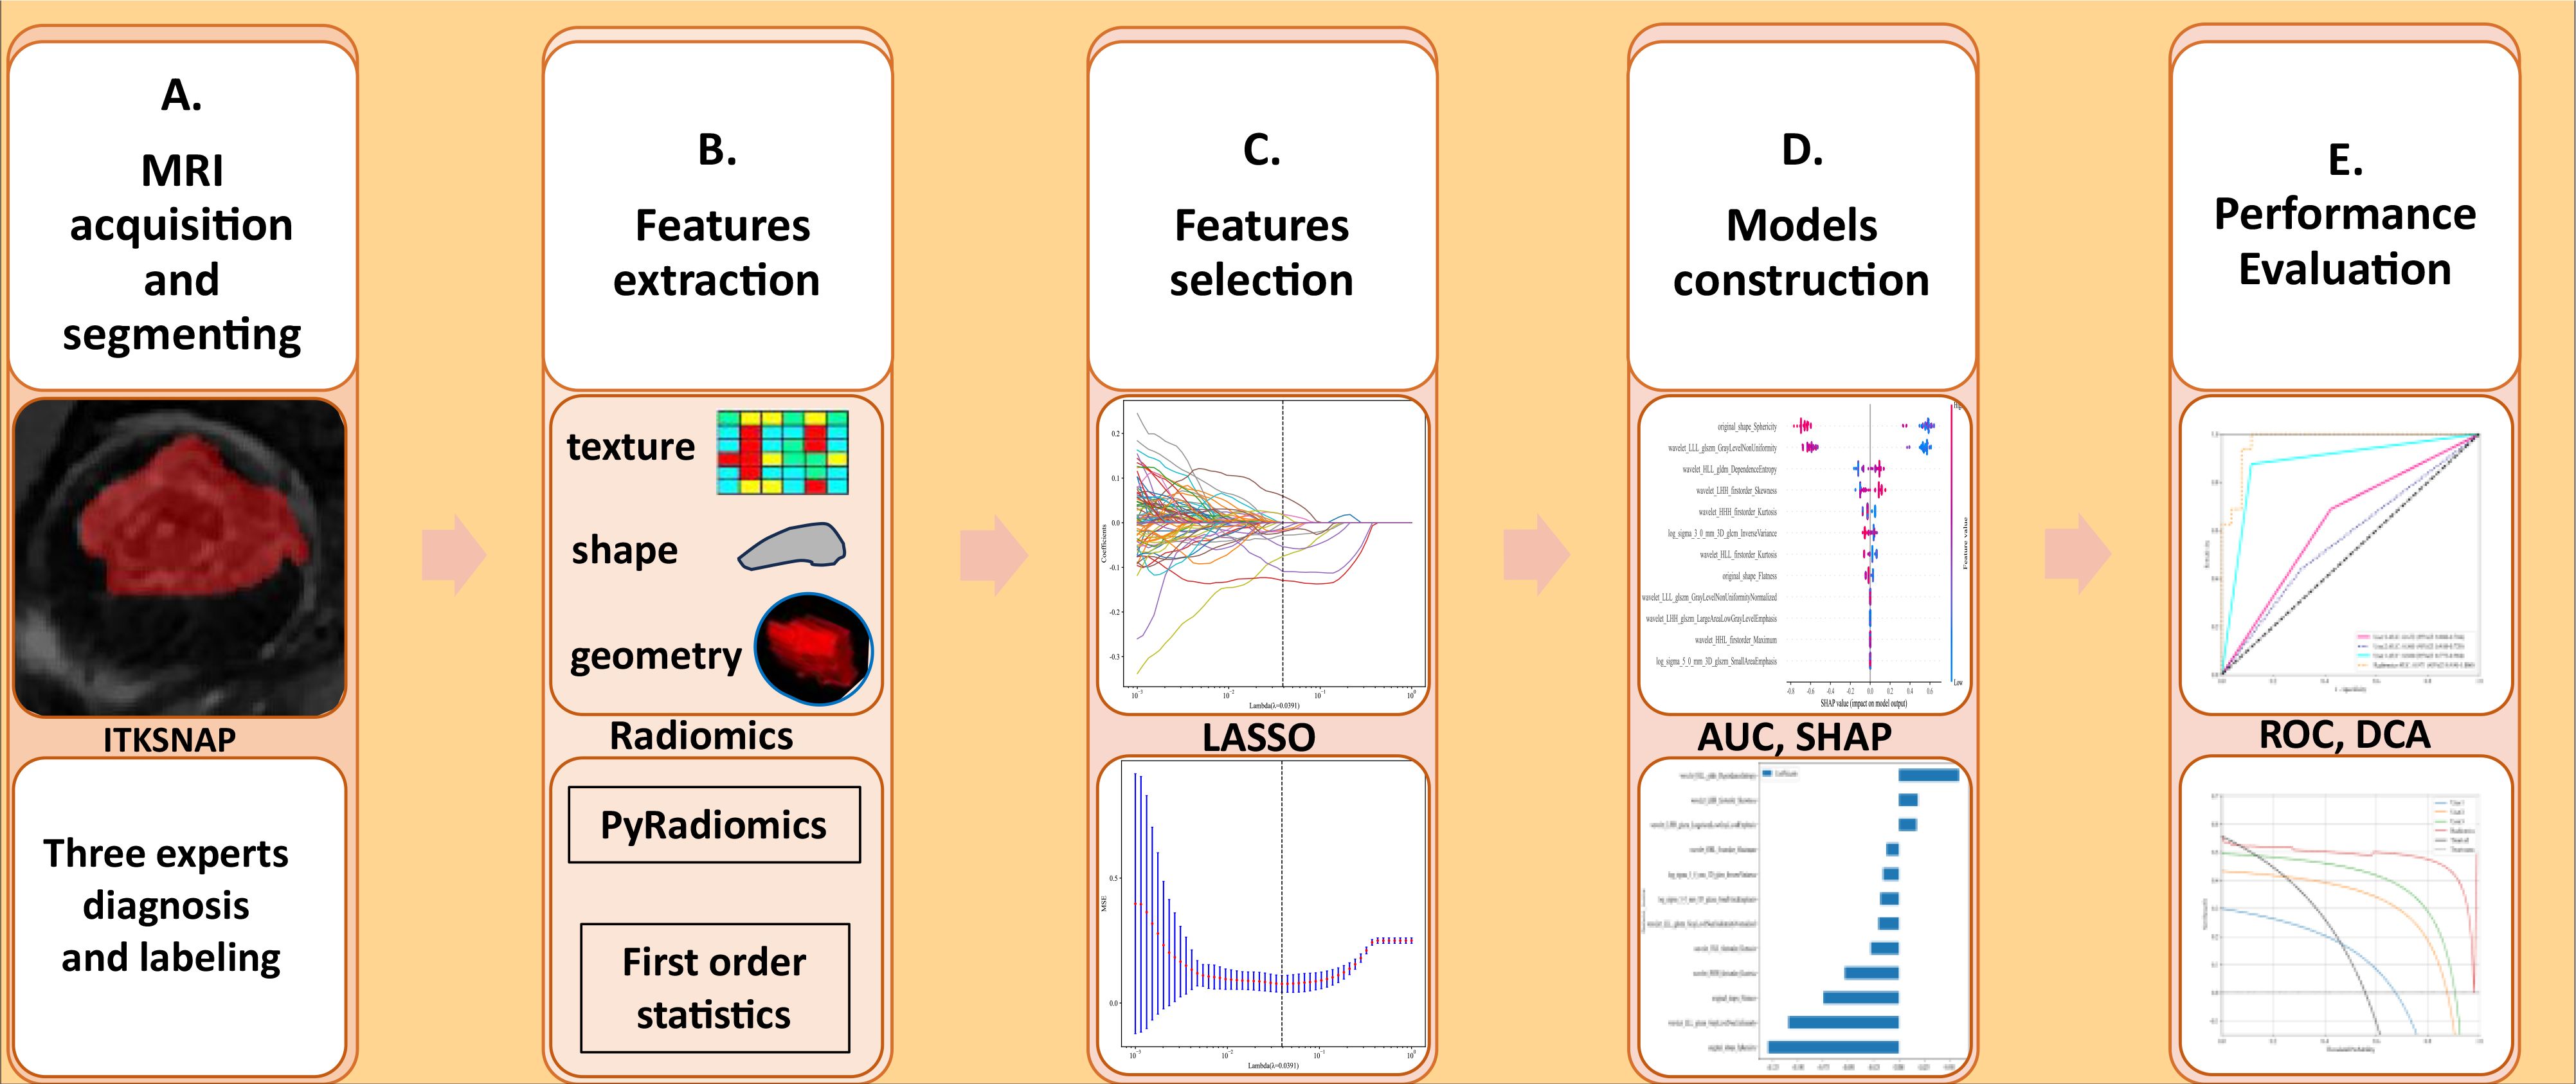
Figure 1. (A–E) The methodology and flow of this study, beginning with MRI data gathering and ending with performance evaluation, includes segmentation, feature extraction, selection, and the development of multiple machine learning models. AUC, Area Under the Curve; SHAP, SHapley Additive exPlanations; ROC, Receiver Operating Characteristic; DCA, Decision Curve Analysis.
The 1.5T tesla scanner (Avanto, Siemens Healthineers; Erlangen, Germany) was used to capture the MRI photographs, and the parameters used were: In the coronal plane, in the (headfirst-spine) posture; sequence type turbo spin echo (TSE), T2-weighted with fat suppressed (FS), slice thickness 4.5mm, field of view 640*640mm, acquisition matrix 0\320\240\, echo duration 67ms, repetition time 3000ms.
The ROI on each MRI scan was manually segmented by an orthopedic surgeon with five years of expertise using ITK-SNAP version 4.2.0 (https://www.itksnap.org/). For individuals with osteoarthritis, the region of interest (ROI) included the femoral head and neck. Nevertheless, the ROI was restricted to the necrotic region for patients with ONFH.
A 7:3 ratio was used for the random case split between the training and testing groups. In order to train the machine learning models, we used the whole training dataset. To evaluate the models’ performance internally, we used instances from the testing dataset. Unaware of the ground truth diagnosis, three users with varying levels of experience were shown the same set of randomly shuffled radiographs. The first user was an orthopedic surgeon working in our orthopedic department, focusing on sports medicine. A general radiologist who works in the radiology department of the same institution was the second user. The third user, was another orthopedic surgeon from an external hospital. He is focused on OA, ONFH, and arthroplasty operations. We handled any differences in voxel spacing in this experiment using the fixed-resolution resampling approach. By resampling each image to a 1*1*1 mm size, the voxel spacing was uniform across all images. The data was finally normalized using z-scores, another name for zero-mean normalization.
This study’s feature extraction used traditional, hand-crafted radiomic features—geometry, intensity, and texture—derived from the initial radiographs. In order to extract radiomic characteristics, PyRadiomics was employed. The geometric, intensity and textural types of manually generated radiomic features are the three main groups. The geometric features relate to the three-dimensional shape of the bone cells. An analysis of the statistical distribution of voxel intensities within the femoral head is performed by the intensity features using first-order statistics. Features that characterize patterns or spatial distributions of intensities beyond the first order are indicated by the texture features. Texture features are retrieved using a variety of methodologies, such as the gray-level run length matrix (GLRLM), neighborhood gray-tone difference matrix (NGTDM), gray-level size zone matrix (GLSZM), and the gray-level co-occurrence matrix (GLCM). The nonlinear intensity of picture voxels is transformed using a number of transformations—including Square, Square Root, Logarithm, Gradient, LBP3D, and Exponential—in order to attain high-throughput features. One, two, and three are the sigma values used by the high Laplace filter. In addition, eight wavelet transform algorithms—HLL, HLH, HHL, LHH, LLL, LLH, and LHL—were used in the process of obtaining first-order statistics and texture features. The web resource at https://pyradiomics.readthedocs.io/en/latest/features.html provides a thorough explanation of all radiography features.
The features were first standardized using the z-score standardization method approach before going through three screening stages before final selection. First, all features were subjected to the Mann-Whitney U test; features with a P-value below 0.05 were kept. Then, to identify highly correlated features, the Pearson test was used. In order to be considered potentially predictive, features needed a P-value lower than 0.05. Finally, the least absolute shrinkage and selection operators (LASSO) were used to evaluate the key features in the end.
After LASSO was used to identify the key features, we passed them into various machine learning classifiers such as XGBoost, NaiveBayes (NB), Random Forests (RF), Logistic Regression (LR), K-Nearest Neighbors (KNN), Support Vector Machines (SVM), and others. We selected the best performer after comparing all of them to construct the final model. We employed 5-fold cross-validation in this particular instance.
We used the Python Statsmodels package (0.13.2 version) to evaluate the data, and we deemed a p-value below 0.05 statistically significant. Using ROC curves and the associated diagnostic accuracy, sensitivity, specificity, positive predictive value (PPV), and negative predictive value (NPV), we assessed the clinical significance of the models in distinguishing between ONFH and OA. Decision curve analysis (DCA) and calibration curves were also used to evaluate the discriminative capacity of the model. To further evaluate the model’s robustness, we employed the Hosmer-Lemeshow test.
The study comprised a total of 140 patients’ MRI scans, consisting of 70 OA individuals and 70 ONFH patients. The patients were categorized into a training group of 98 individuals and a testing group of 42 individuals. Table 1 demonstrates a summary of the patient’s primary attributes.
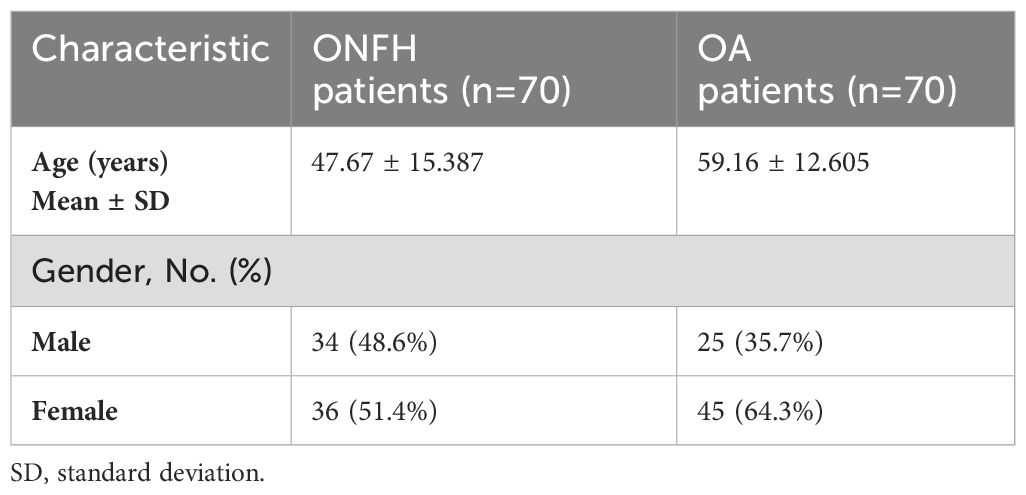
Table 1. These are the fundamental characteristics of a total of 140 patients.
A grand total of 1,119 Radiomics features were extracted using a tool that is specifically designed for feature analysis and is part of Pyradiomics (http://pyradiomics.readthedocs.io). There was a total of 234 First Order features, 182 GLRM features, 208 GLSLSM features, 65 NGTDM features, 286 GLCM features, and 14 shape features.
For each of the selected features, we ran a feature screening and a Mann-Whitney U test. The final count was 1006 features, with features being maintained only if their P-value was less than 0.05.
The second step was to use the Pearson correlation coefficient, a measure of feature correlation, to assess features with good repeatability. When two features had a correlation coefficient greater than 0.9, just single one of them was retained. In the end, 215 features were retained.
Step three involved using the logistic regression model (LASSO) to narrow down the feature set for the model’s construction and decrease the number of features overall. All regression coefficients are shrunk by LASSO until they approach zero, and the coefficients of insignificant features are adjusted to zero according to the regulation weight Lambda (λ). The optimal value of λ was found by performing a 10-fold cross-validation with a minimum criteria method. The final value of λ was chosen based on its ability to produce the lowest cross-validation error. After integrating the features with non-zero coefficients, a Radiomics model was built using the features used to construct a regression model. Following this, we determined a patient’s radiomics score by adding all the retained features multiplied by their corresponding model coefficients.
Twelve radiomics-related features were identified by LASSO regression modeling, which was executed using the scikit-learn package in Python. Below, you can see a plot of the LASSO models’ coefficient profiles and the mean square errors (MSE) that were derived from 10-fold validation. Every independent predictor’s changing trajectory is shown by each curve in the plot. Figure 2 (left) Describes how LASSO logistic regression is used to choose features in the Radiomics model. Figure 2 (right) Displays the mean squared error (MSE) values derived from a 10-fold cross-validation of the Radiomics model. For the purpose of interpreting and visualizing the radiomic features that were utilized in the radiomics models, the SHAP (16) approach was utilized in Figure 3. This technique draws attention to the significance of individual features within the context of a complicated machine learning framework. It provides insights into how each feature contributes to the probability of a particular outcome. Moreover, the SHAP force plot in Figure 4 summarizes how each selected radiomic feature shifts the model’s prediction from the baseline (average) output toward the final predicted value. This means it displays the most influential features in classifying the given MRI case (Case 1 in our dataset) as either OA or ONFH. The length and direction of each red bar indicate how much that particular feature “pushes” the model’s decision. Positive SHAP values suggest that the feature’s measured value for this particular case pushes the model’s prediction toward the chosen positive class (e.g., ONFH), Whereas negative SHAP values indicate that the feature’s value nudges the model’s prediction away from the positive class, potentially supporting the alternative classification (e.g., OA).
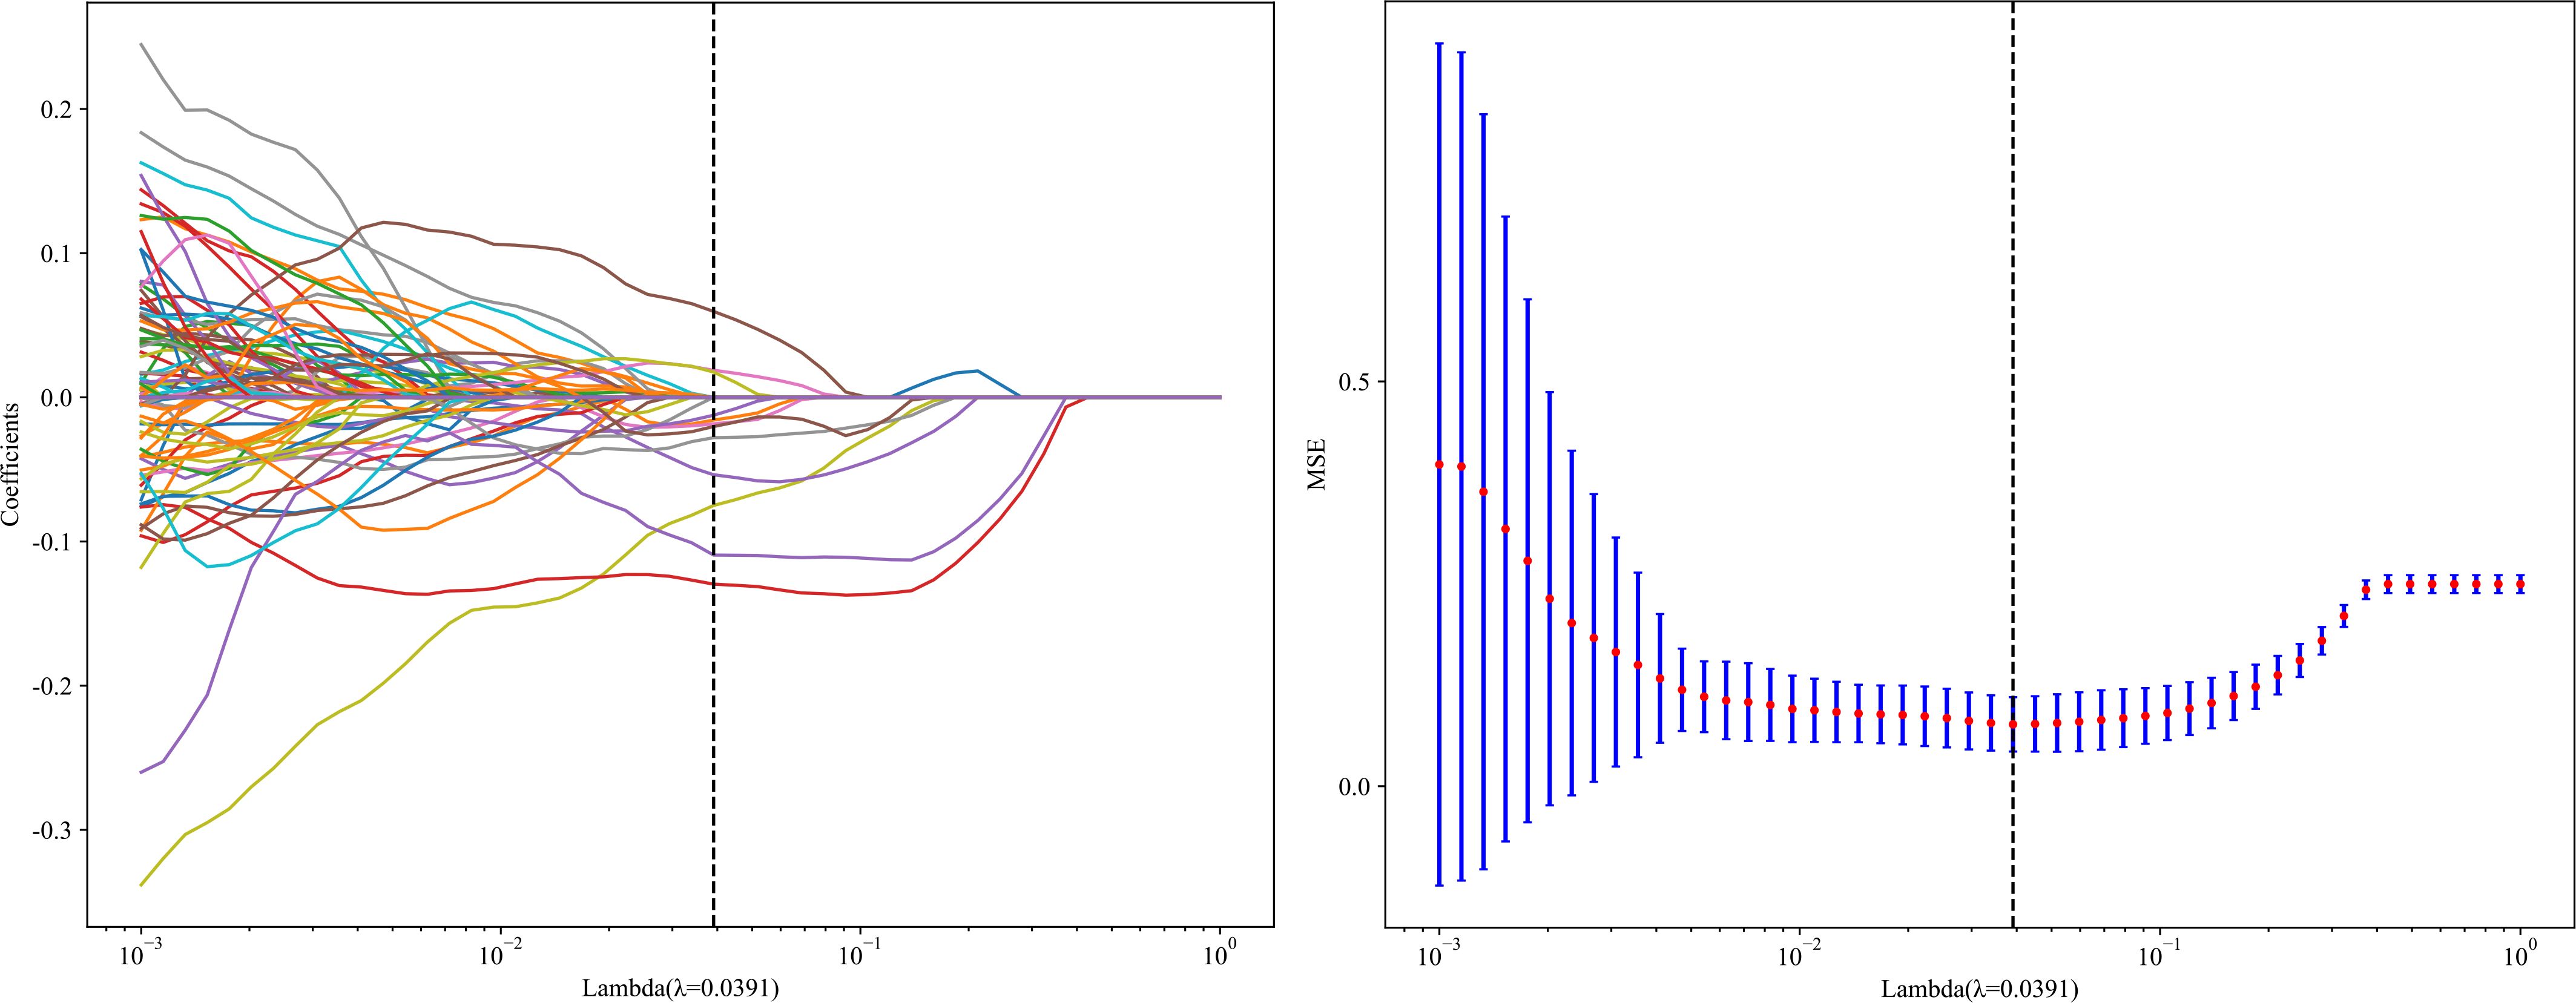
Figure 2. LASSO Coefficients profile plot with various log (λ) is displayed (left); the vertical dashed line represents the selected features with nonzero coefficients chosen to the optimal lambda. (right) MSE of 10-fold cross-validation for the most valuable features screened for the Radiomics-model.
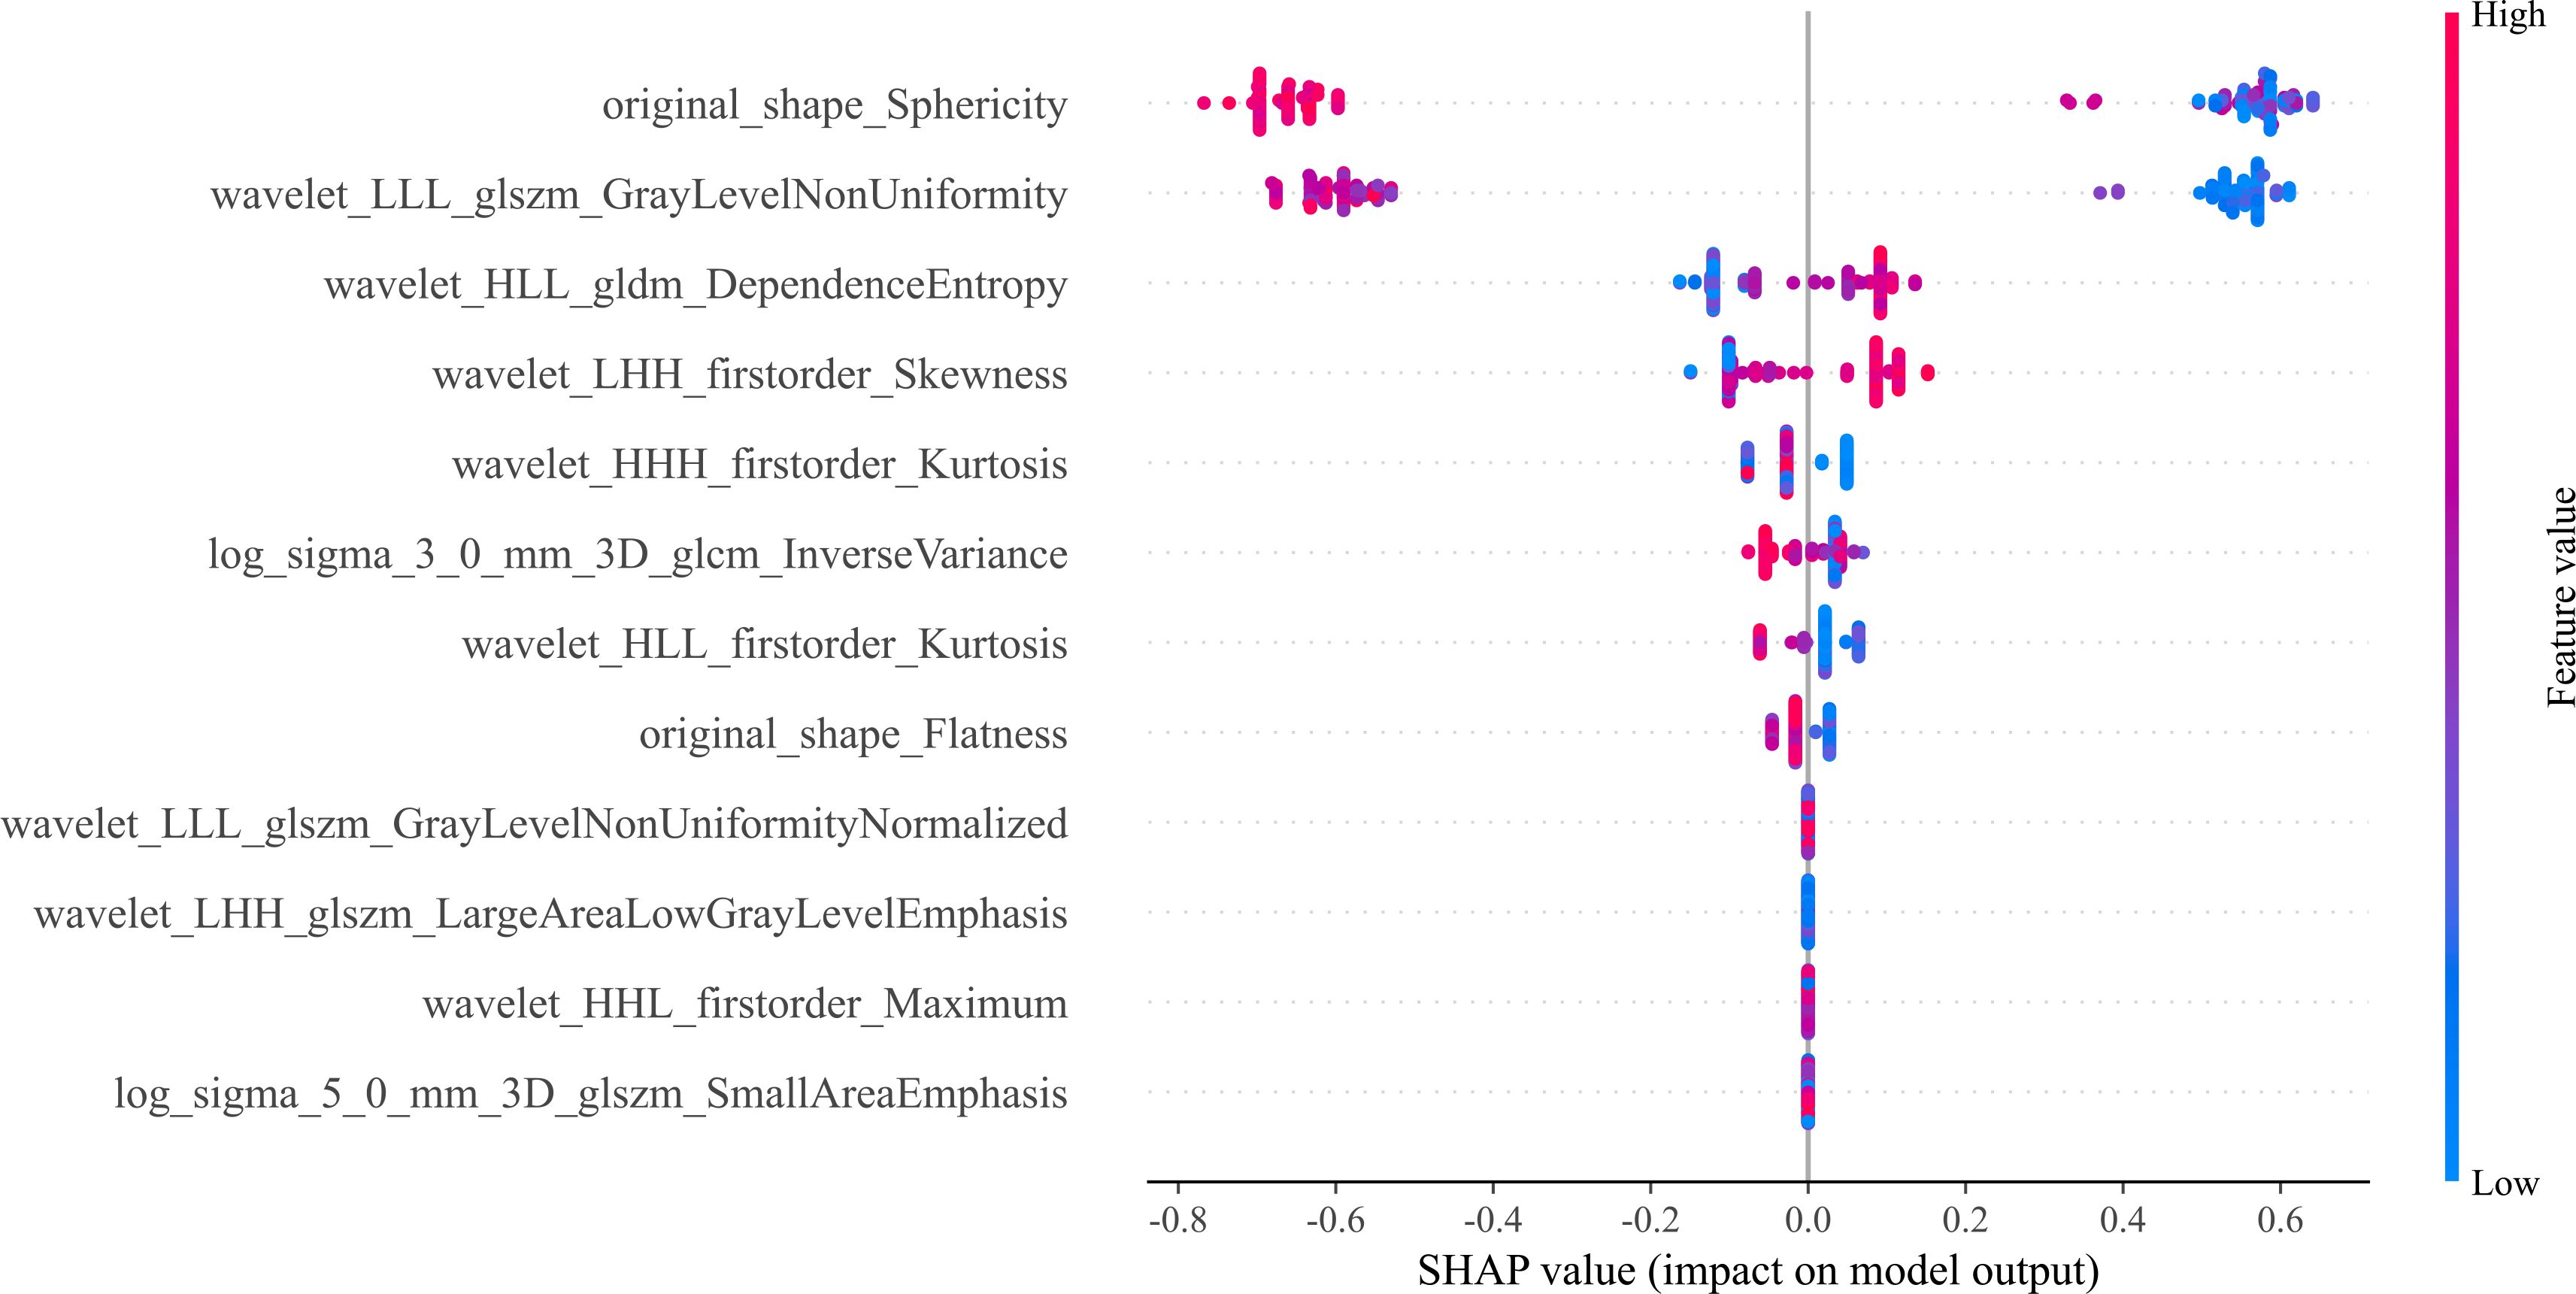
Figure 3. The 12 most important features are displayed in the bee swarm plot of SHAP values, in order of importance. The SHAP values quantify the contribution of each factor to the prediction outcome; higher values indicate greater influence. The horizontal axis displays this information. Each feature’s ranking is based on its relative weight in making the prediction. Here, we can see the distribution of feature values along the vertical axis, which is colored on a gradient from low (blue) to high (red). A feature’s impact at a given level is proportional to the density of points falling within that level’s SHAP value range.
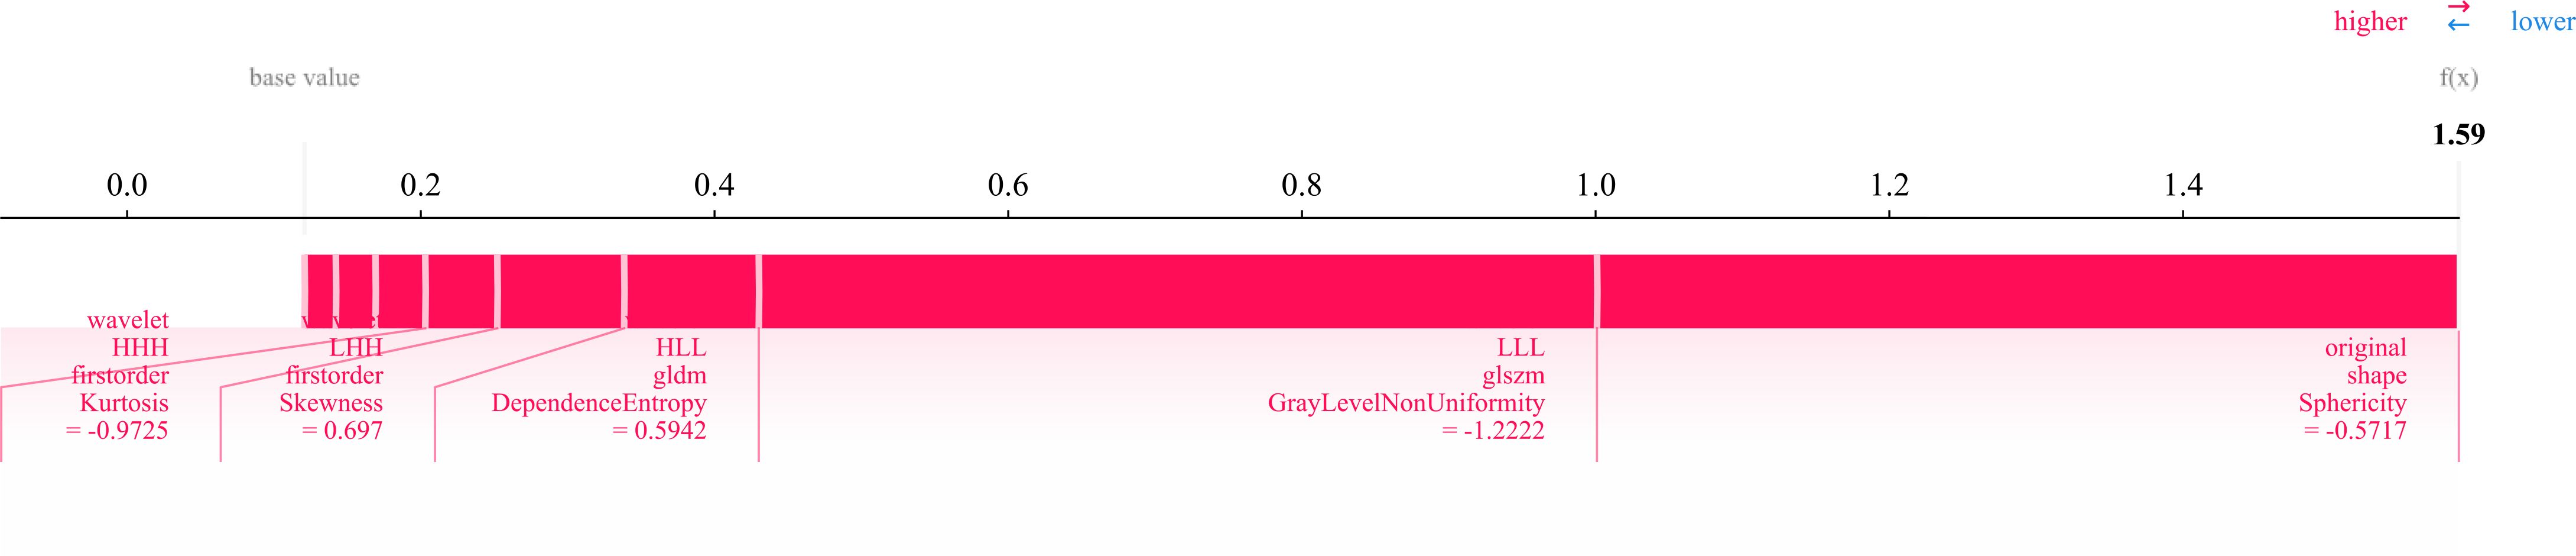
Figure 4. SHAP force plot illustrating the contribution of 12 radiomic features in differentiating osteonecrosis of the femoral head (ONFH) from osteoarthritis (OA) based on MRI. The base value represents the model’s average prediction, with the final prediction (f(x) = 1.59) derived from the cumulative feature contributions. Red bars indicate the direction and magnitude of each feature’s influence, with key metrics capturing intensity distribution, texture complexity, and geometric shape (e.g., sphericity).
XGBoost (17), LR (18), MLP (19), sigmoid_SVM (20), and NB (21) based models were constructed and compared; their AUCs in the testing cohort were (0.950, 0.964, 0.962, 0.962, and 0.971) respectively as shown in Figure 5. As NB performed the best, it was the classifier of choice for in constructing the final Radiomics-model. On the other hand, the performance of User 1(AUC=0.606) and (AUC=0.632); User 2 (AUC=0.819) and (AUC=0.565); User 3 (AUC=0.886) and (AUC=0.880) in the training and testing cohorts respectively.
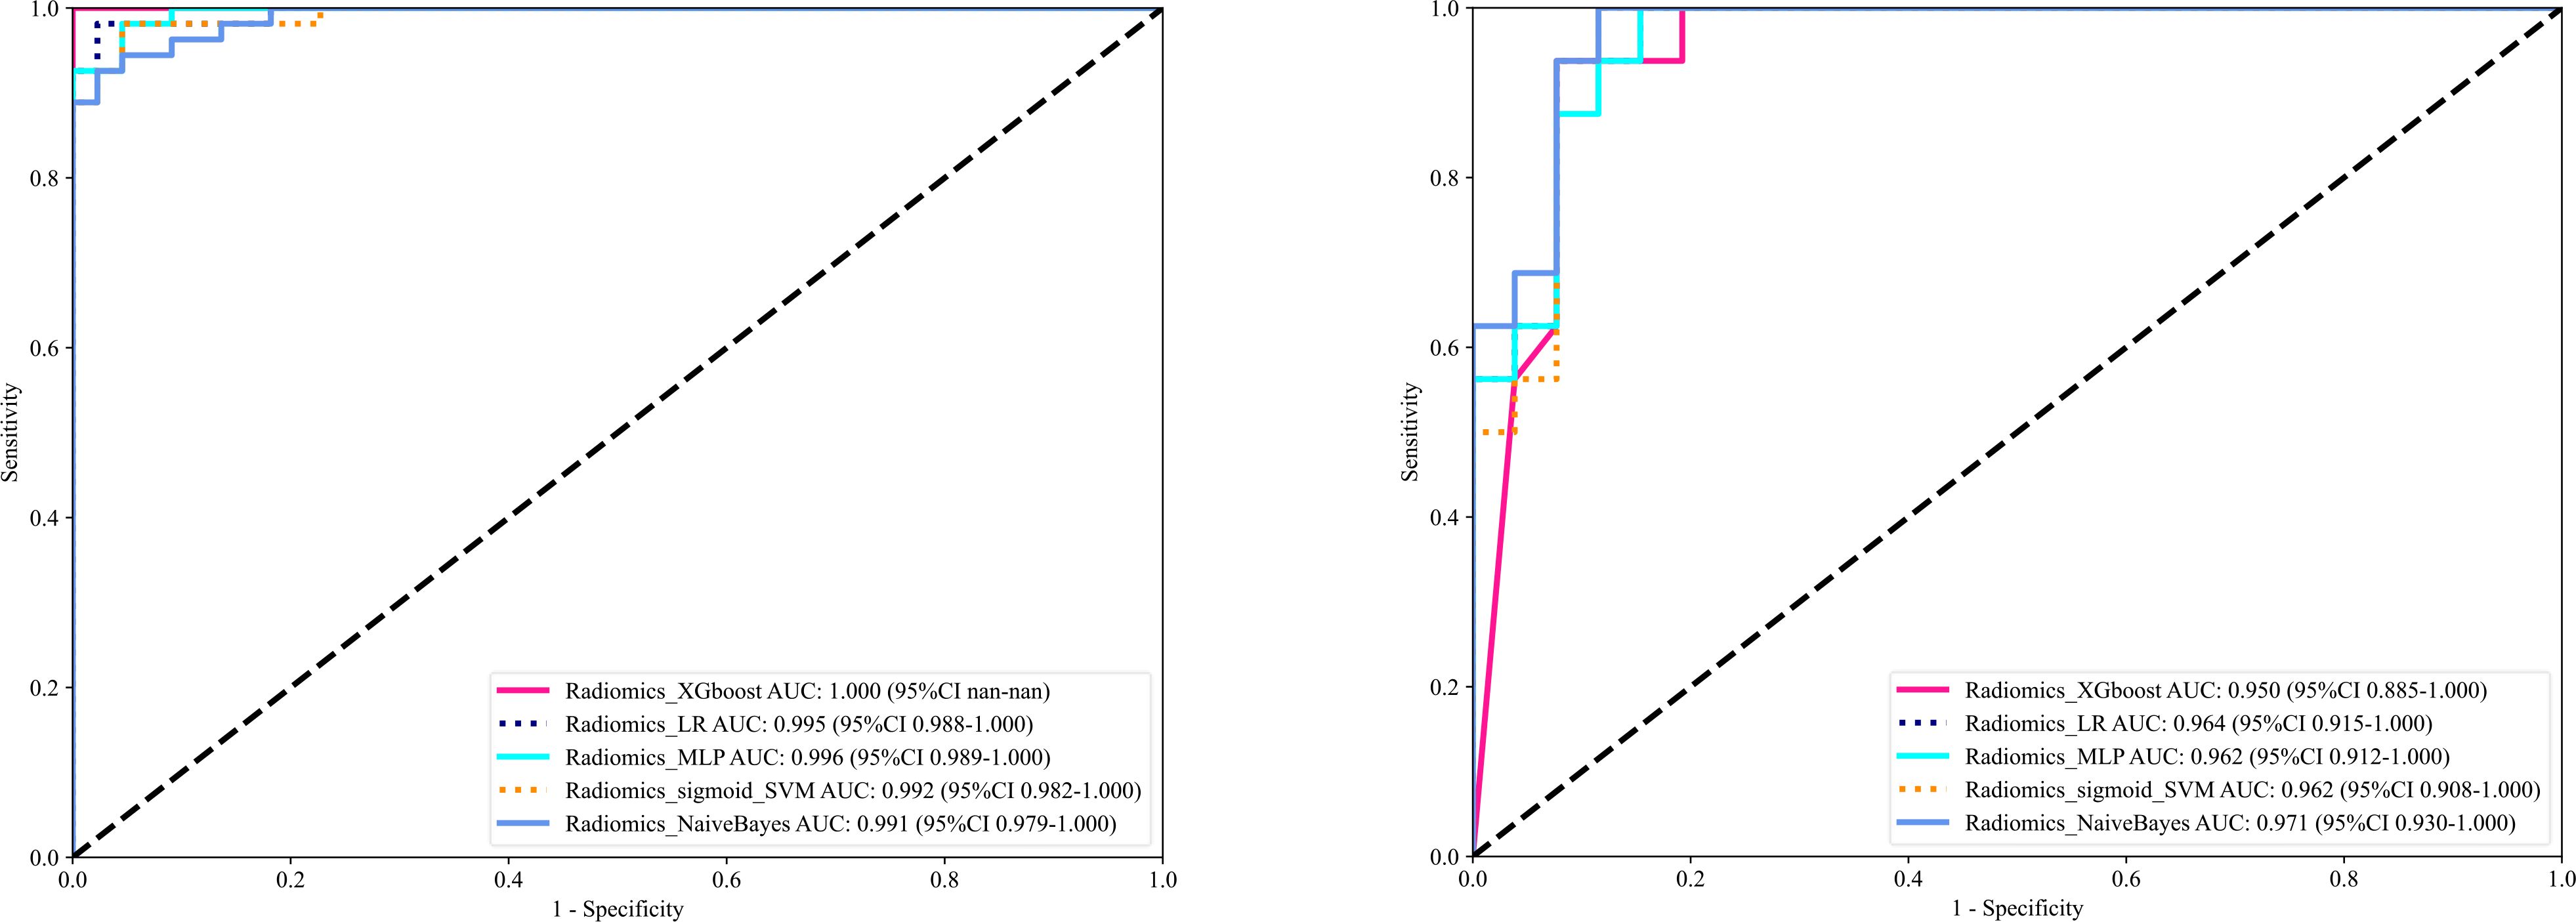
Figure 5. Shows the ROC curves of different machine learning models ROC curves in the training cohort (left), and the testing cohort (right).
The significant features selected for the Radiomics-model are presented in Table 2. The diagnostic AUC, 95%CI, accuracy, sensitivity, specificity, PPV, and NPV of all three users and the Radiomics-model are demonstrated in Table 3. The confusion matrix for the Radiomics model is presented in Figure 6, comprising True Positives (TP), True Negatives (TN), False Positives (FP), and False Negatives (FN). In addition, the calibration curves showed good agreement between the Radiomics based model and the perfectly calibrated line, as shown in Figure 7. The P-values of the Hosmer-LemeShow test in Table 4 were 0.574, and 0.329 for the Radiomics model in the training and testing cohort respectively. This indicates a good-fitting model, as all of the values were greater than 0.05. Both the CLEAR (22) and METRICS (23) checklists of this study were presented in Supplementary Data sheet 1 and Supplementary Data sheet 2. Furthermore, the radiomic signatures extracted from each tested patient have been provided in Supplementary Data sheet 3. Besides, the net benefit was plotted against threshold probability in Figure 8, which displays the Decision curve analysis (DCA); it designates that the Radiomics-model has the highest net benefit in differentiating between OA and ONFH. Supplementary Figures 10 and 11 present heatmaps that display the radiomics features selected in the study.
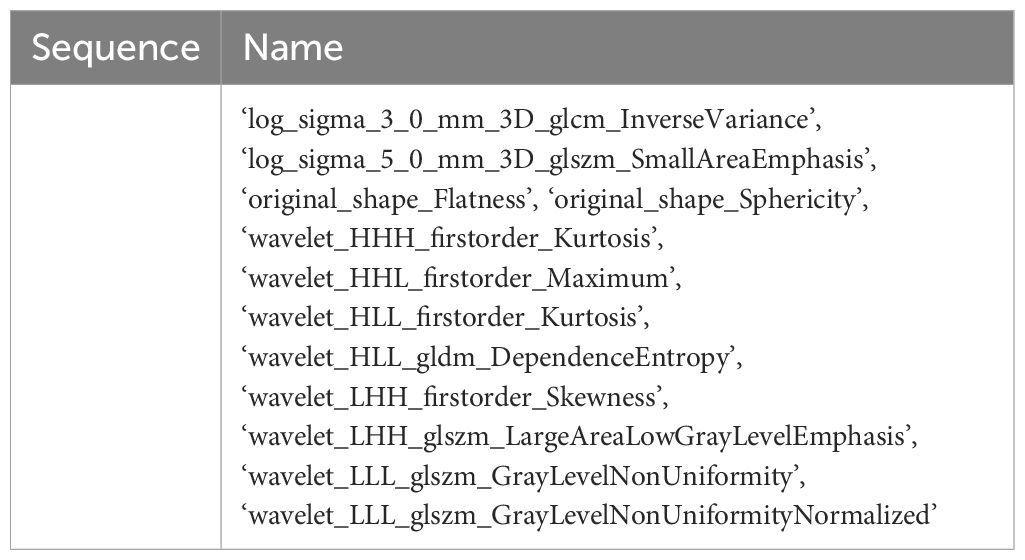
Table 2. Displays the key radiomics characteristics chosen using LASSO analysis.
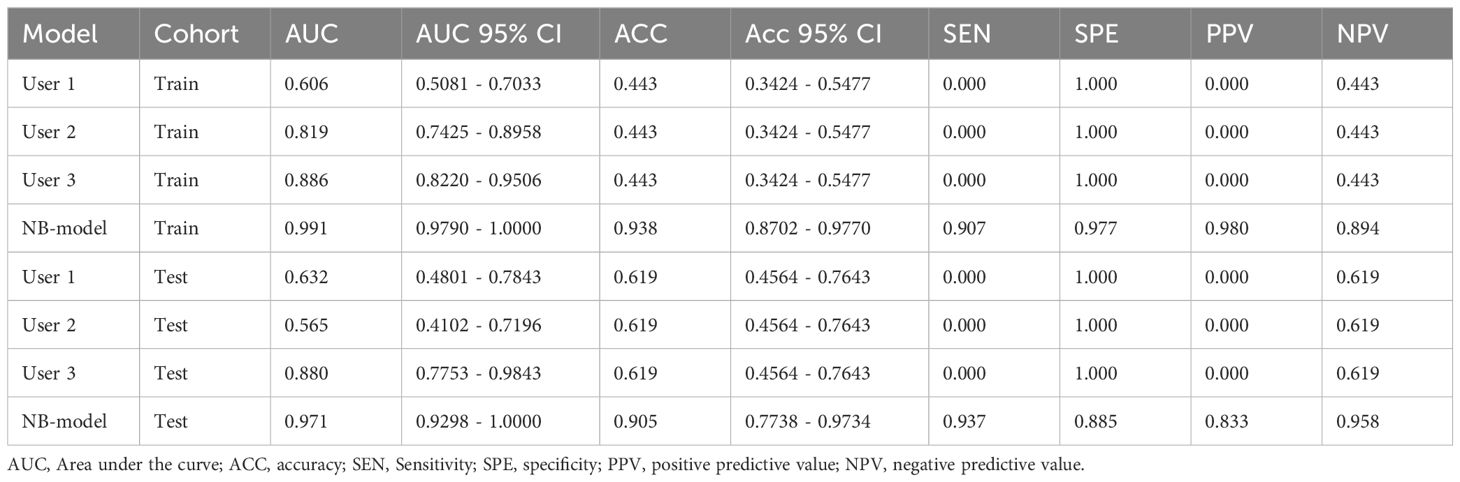
Table 3. All the metrics for User 1, 2, 3, and the NB-model.
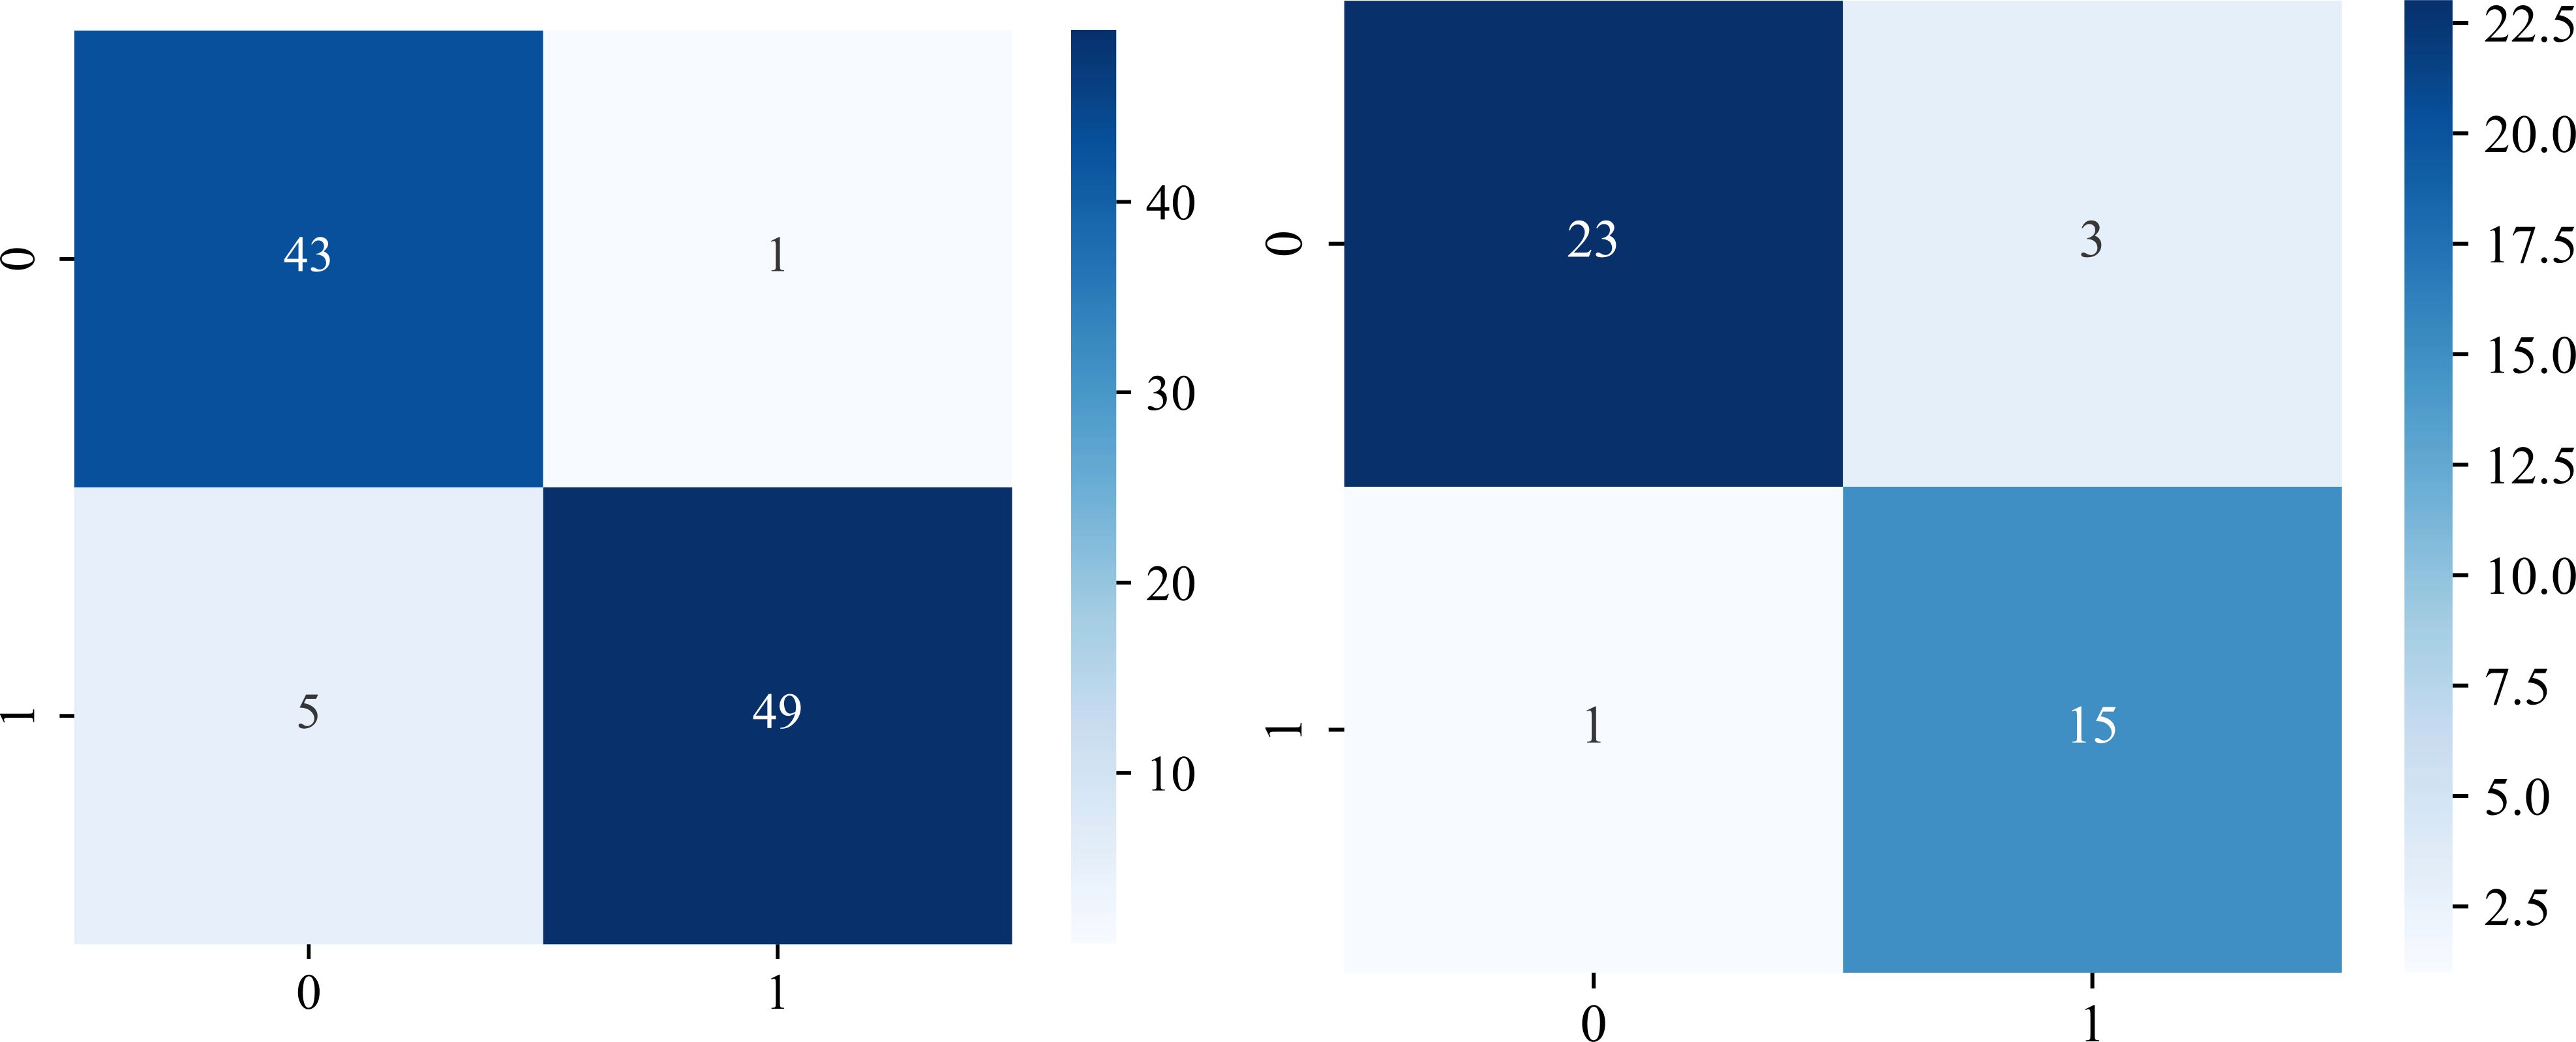
Figure 6. Evaluation of the Radiomics model using confusion matrices. The performance of the model is presented in both the training cohort (left), and the testing cohort (right). Class labels are designated as “OA” (0) and “ONFH” (1). The values are as follows: (TP) = 43 and 23; (TN)= 49 and 15; (FP)= 1 and 3; (FN)= 5 and 1 in the training and testing cohorts respectively.
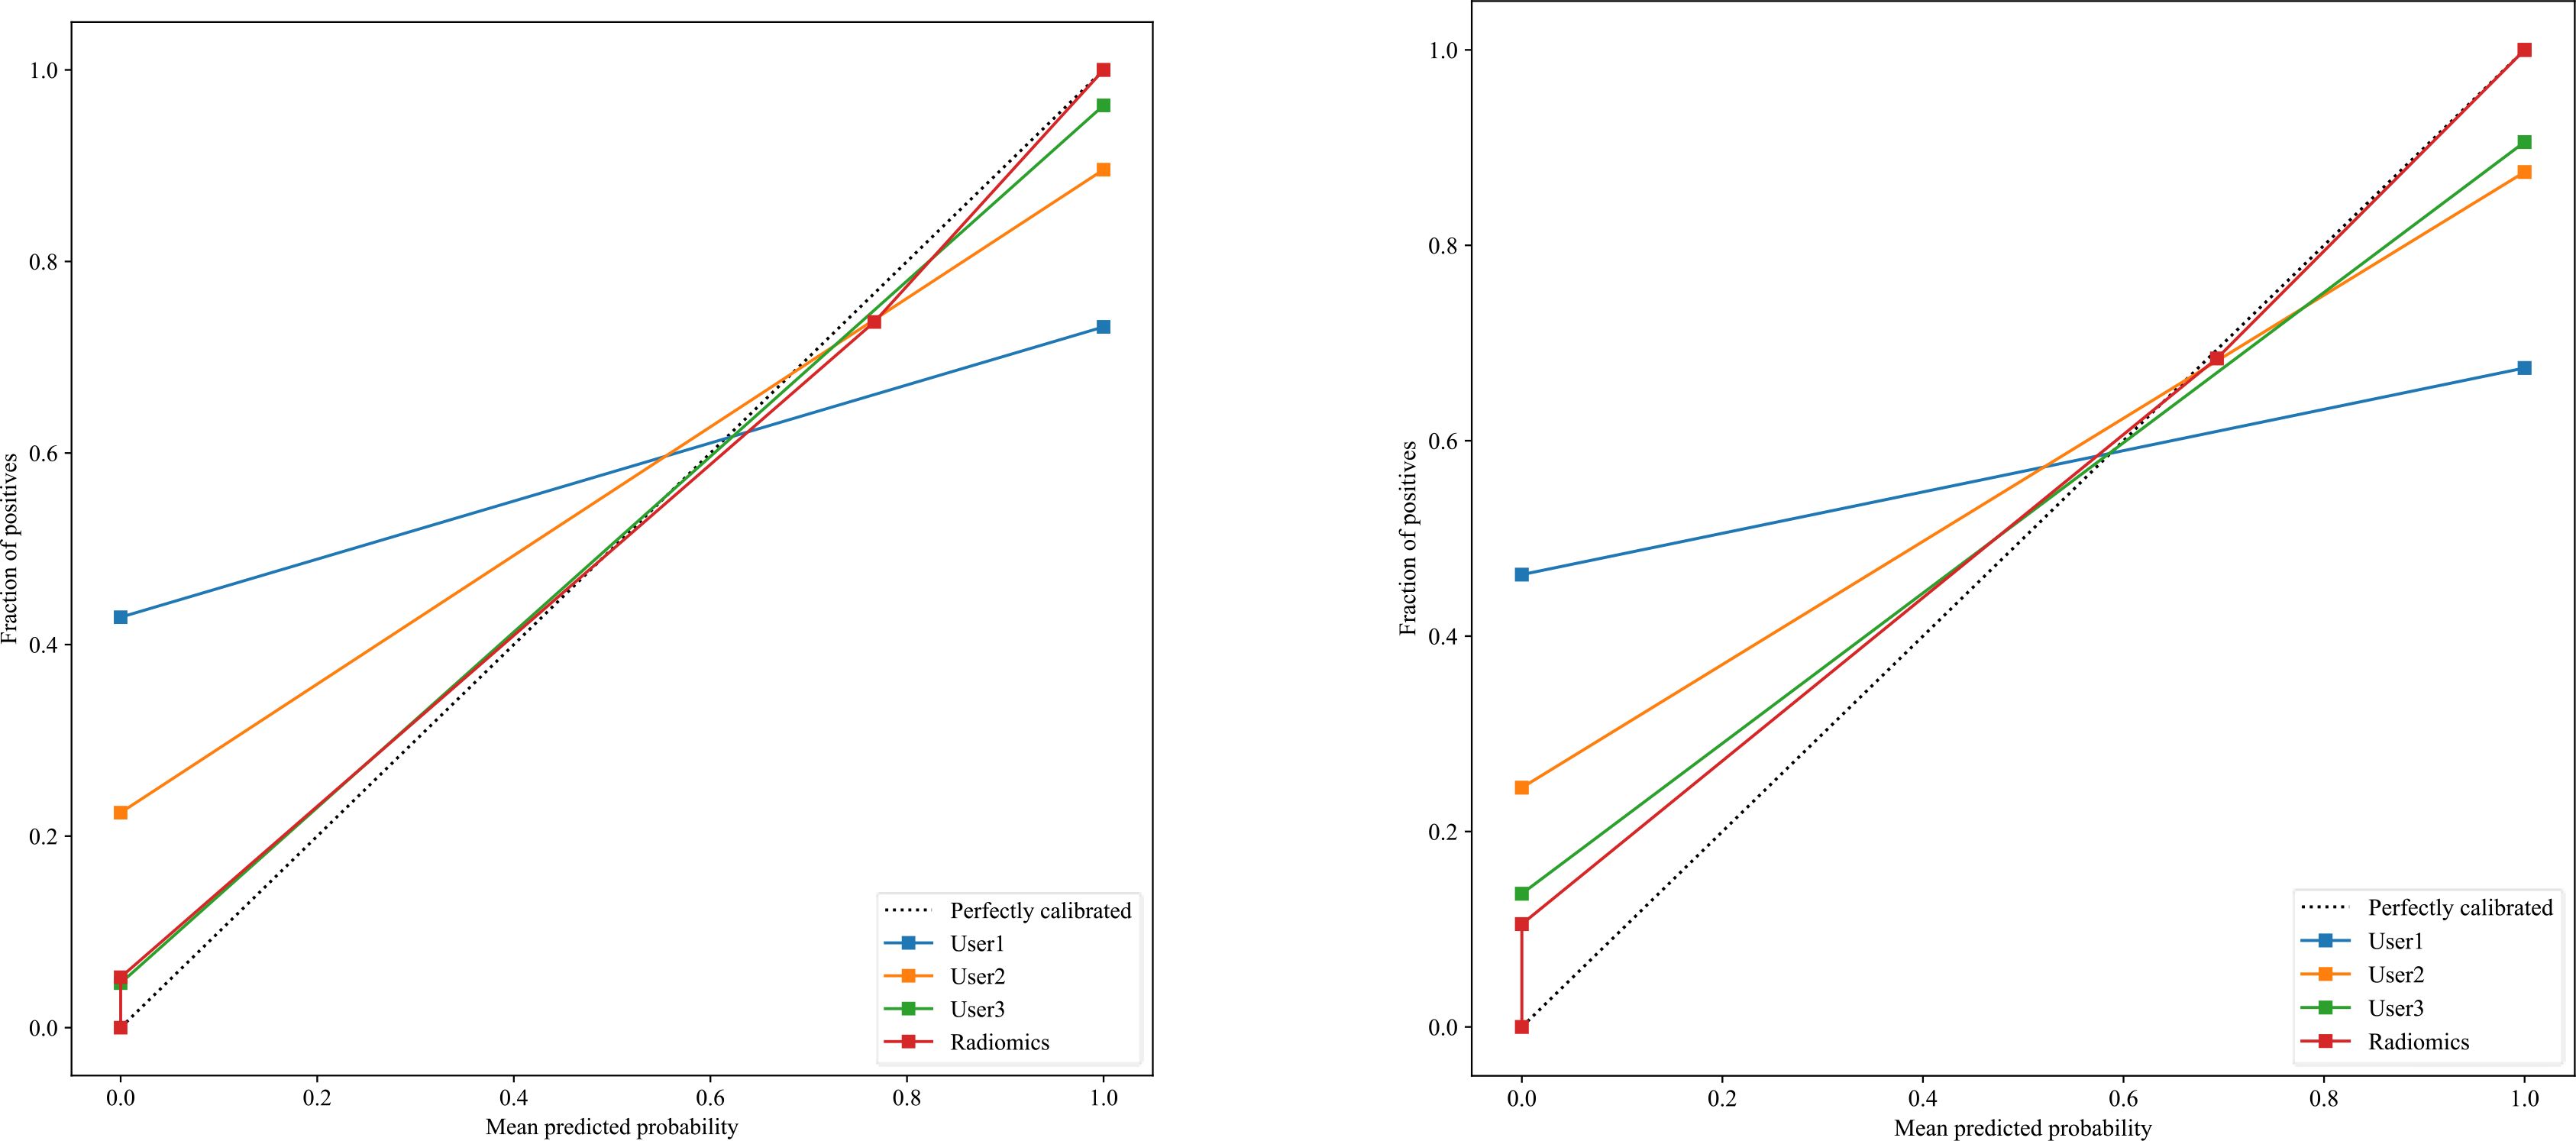
Figure 7. There is a significant association between the average predicted probability (x-axis) and the proportion of positive outcomes (y-axis) in the calibration curves for the Radiomics-model in the testing group (right) and the training group (left), showing that calibration was successful with the perfectly calibrated line.
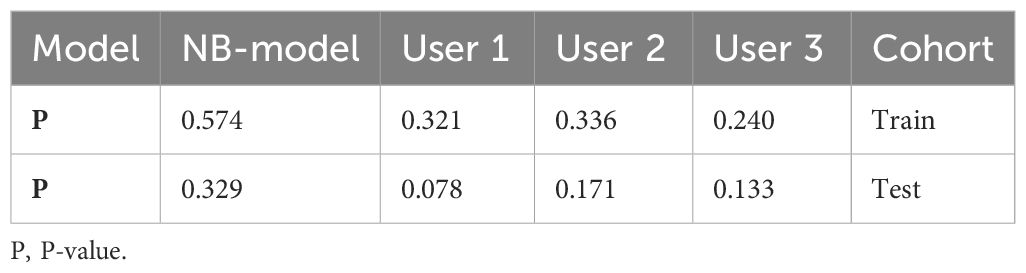
Table 4. Illustrates the significance levels (P values) obtained by the Hosmer-Lemeshow test, which is used to assess the goodness of fit of models.
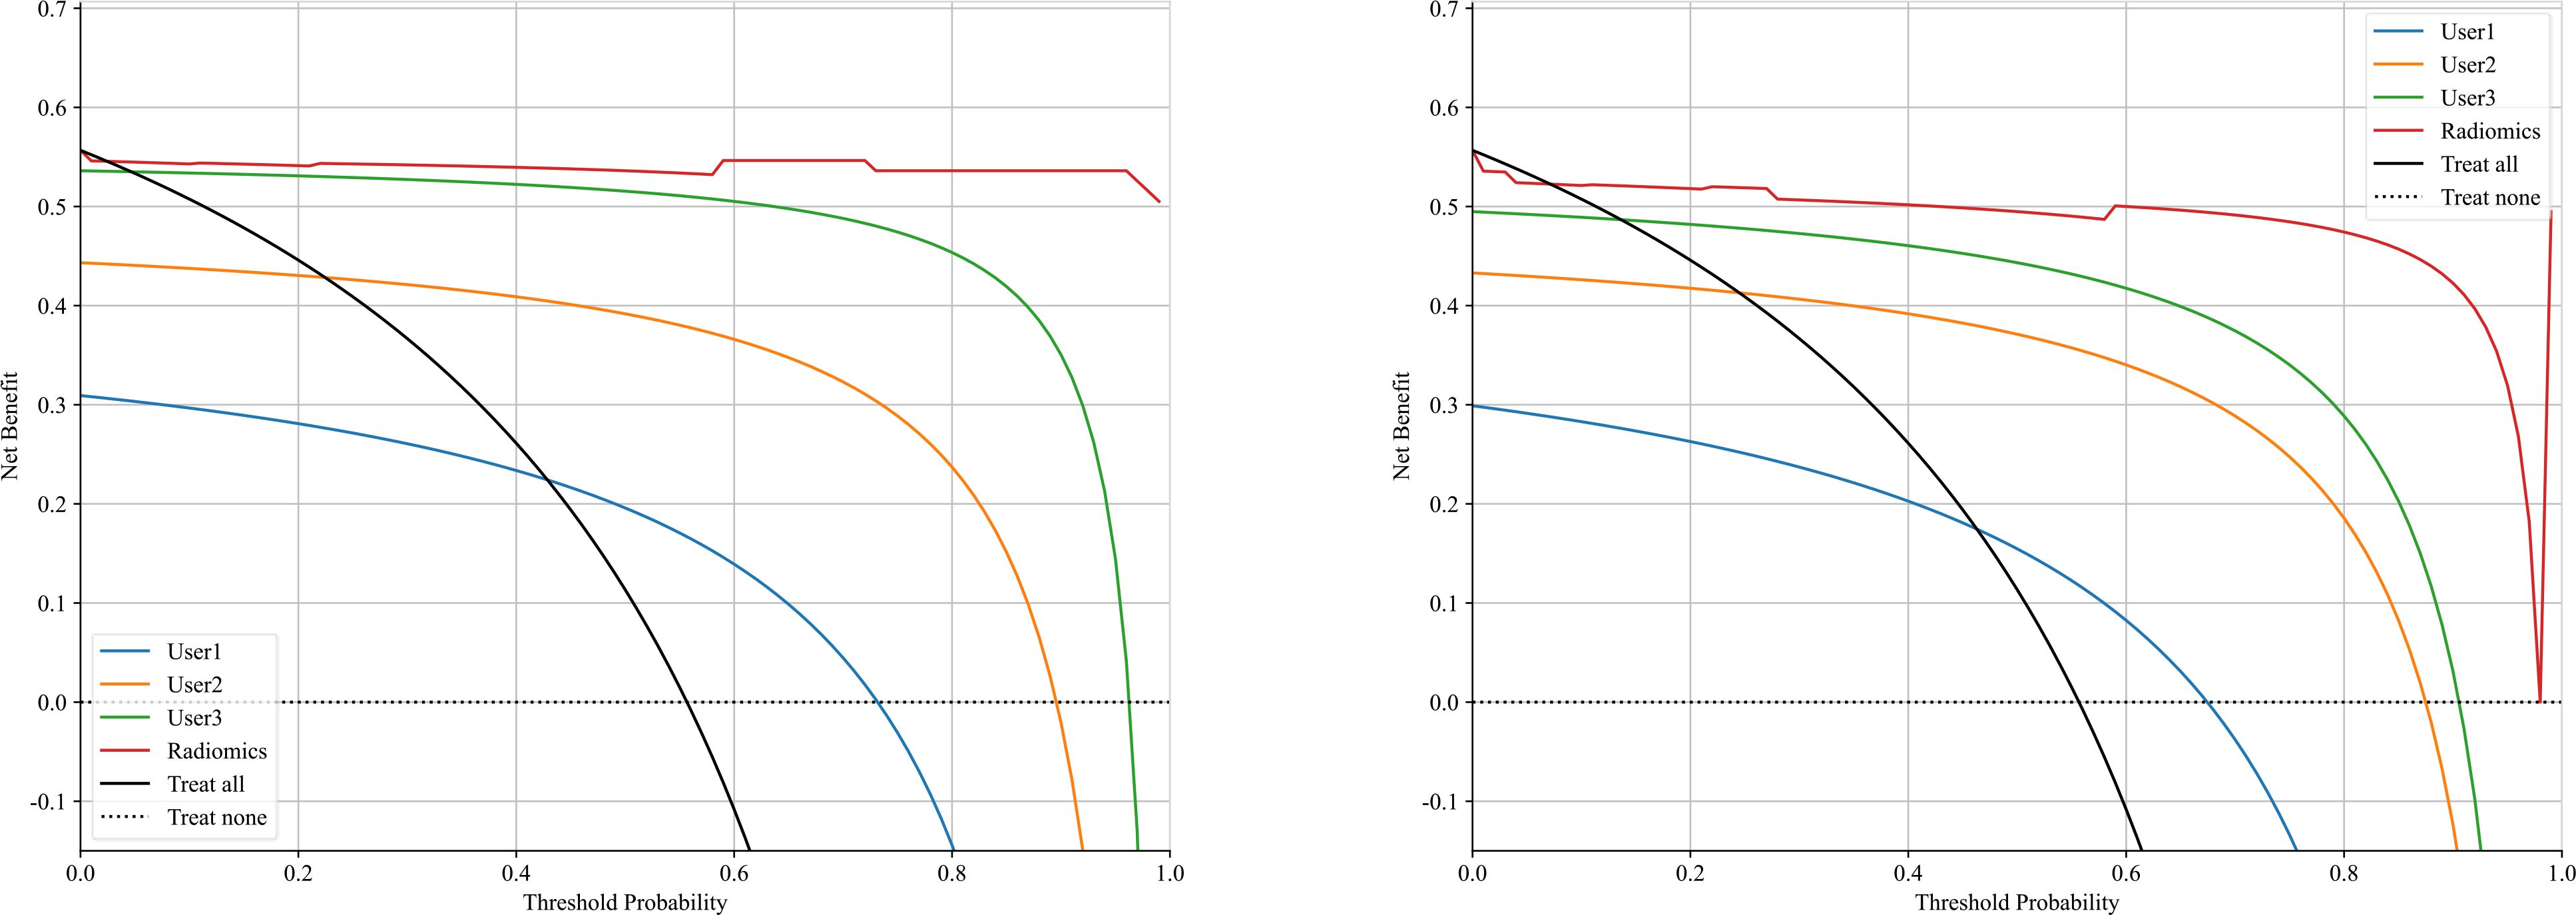
Figure 8. Shows a decision curve analysis was performed on the Radiomics-model across the training group (left) and the testing group (right). The y-axis represents the net benefit, while the x-axis represents the threshold probability.
In this study, we presented how Radiomics can be utilized to make a machine learning-based Radiomics model that can differentiate between OA and ONFH accurately; AUC= 0.968 (95%CI 0.909-1.000). This model has shown superior results to three different users with various expertise levels, User 1 (AUC=0.944 (95%CI 0.862-1.000)) and User 2 (AUC=0.930 (95%CI 0.838-1.000)) and User 3 (AUC=0.880(95%CI 0.7753 - 0.9843)). The ROC for the Radiomics-model with three users is illustrated in Figure 9. Our study was based on a single sequence MRI (T2W1), which gives a great value to our model, as differentiating between early or end-stage OA and ONFH solely depending on a single sequence MRI regardless of the clinical symptoms and a thorough background checking can be challenging even for experienced surgeons. But our model was able to accurately achieve this task effectively.
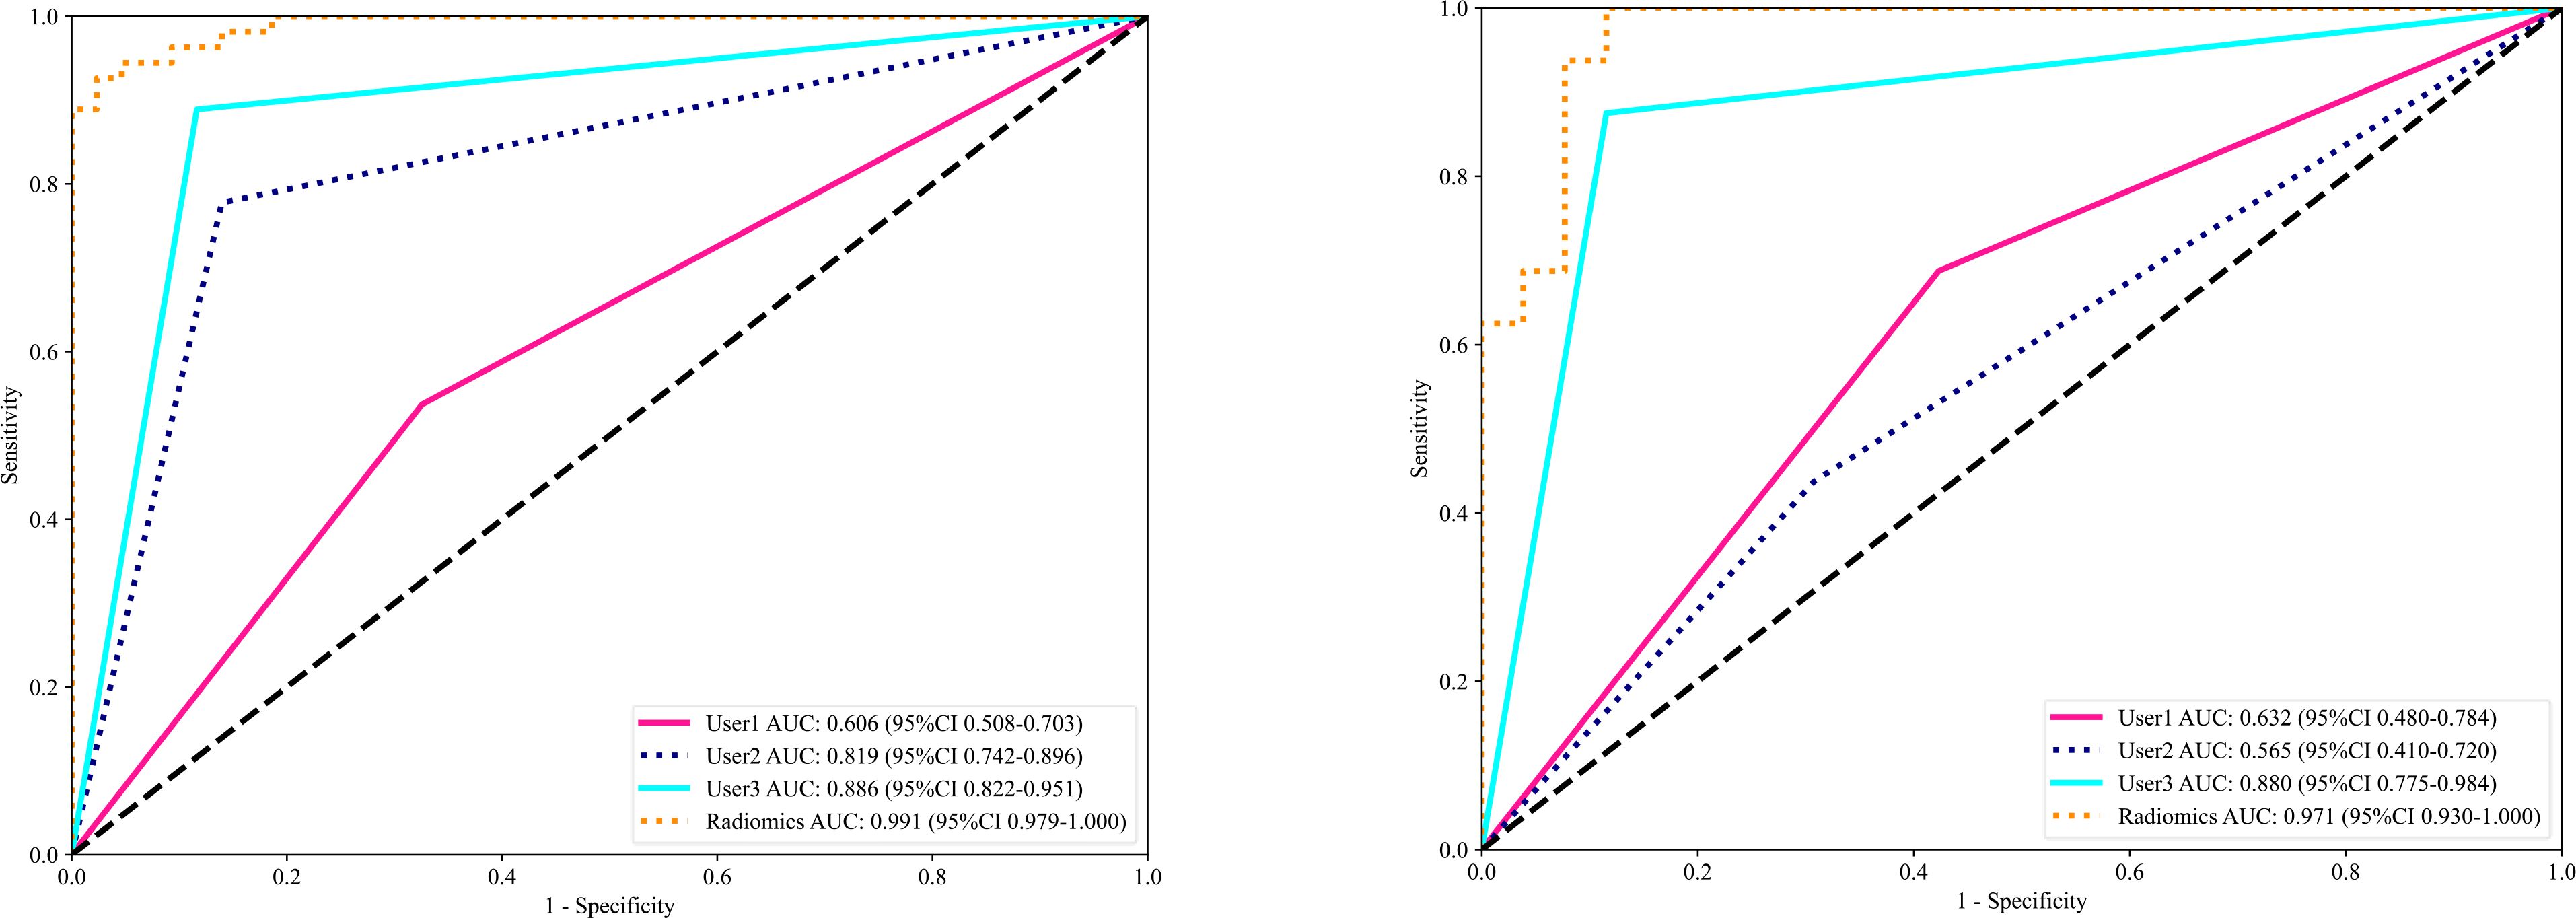
Figure 9. The receiver operating characteristic (ROC) of the Radiomics model and all three users in the training set (left) and the testing set (right) are displayed. The findings for the radiomics model are superior to those of other users, with an area under the curve (AUC) of 0.971.
Wei Li used radiomics based on plain radiographs to grade knee OA severity (24); his study population consisted of 475 patients, and X-ray images were processed using a radiomic feature selection and dimensionality reduction technique. He found that combining information from anteroposterior and lateral images significantly improved the model’s performance for diagnosing knee osteoarthritis. Their model outperformed radiologists in diagnosing knee OA. Francesca, by combining CT and MRI data and employing radiomics, aimed to predict knee cartilage degeneration in OA (9). Her findings indicated the potential of radiomics as a promising tool in clinical practice for early diagnosis and assessment of cartilage degeneration. Li presented a comprehensive study on utilizing radiomics signatures and age as a nomogram model for diagnosing knee osteoarthritis (25). Shengfa presented a method using Radiomics and Neural network for knee OA incidence prediction by integrating meniscus and cartilage features (26). Kaibin investigated the use of radiomics for the analysis of hip CT to screen osteoporosis (27). Other papers provided valuable insights into radiomics applications in orthopedics but differ significantly from the current work in focus (28). developed a radiomics-based decision support tool for cervical disc degeneration grading using combined T1 and T2 MRI modalities, achieving an AUC of 0.95. Their study emphasized the value of multi-modality integration and higher-order texture features but focused on cervical spine pathology rather than conditions involving the femoral head (10). utilized multi-sequence MRI (T1, T2, and Cor STIR) to diagnose early osteonecrosis of the femoral head (ONFH), achieving an AUC of 0.94, and highlighted the benefits of combining multiple sequences to enhance diagnostic performance. Similarly (11), used a single-sequence MRI-based deep learning radiomics model for ONFH diagnosis, achieving an AUC of 0.968 but with limited focus on model interpretability. Table 5 compares the previously published papers relative to this topic.
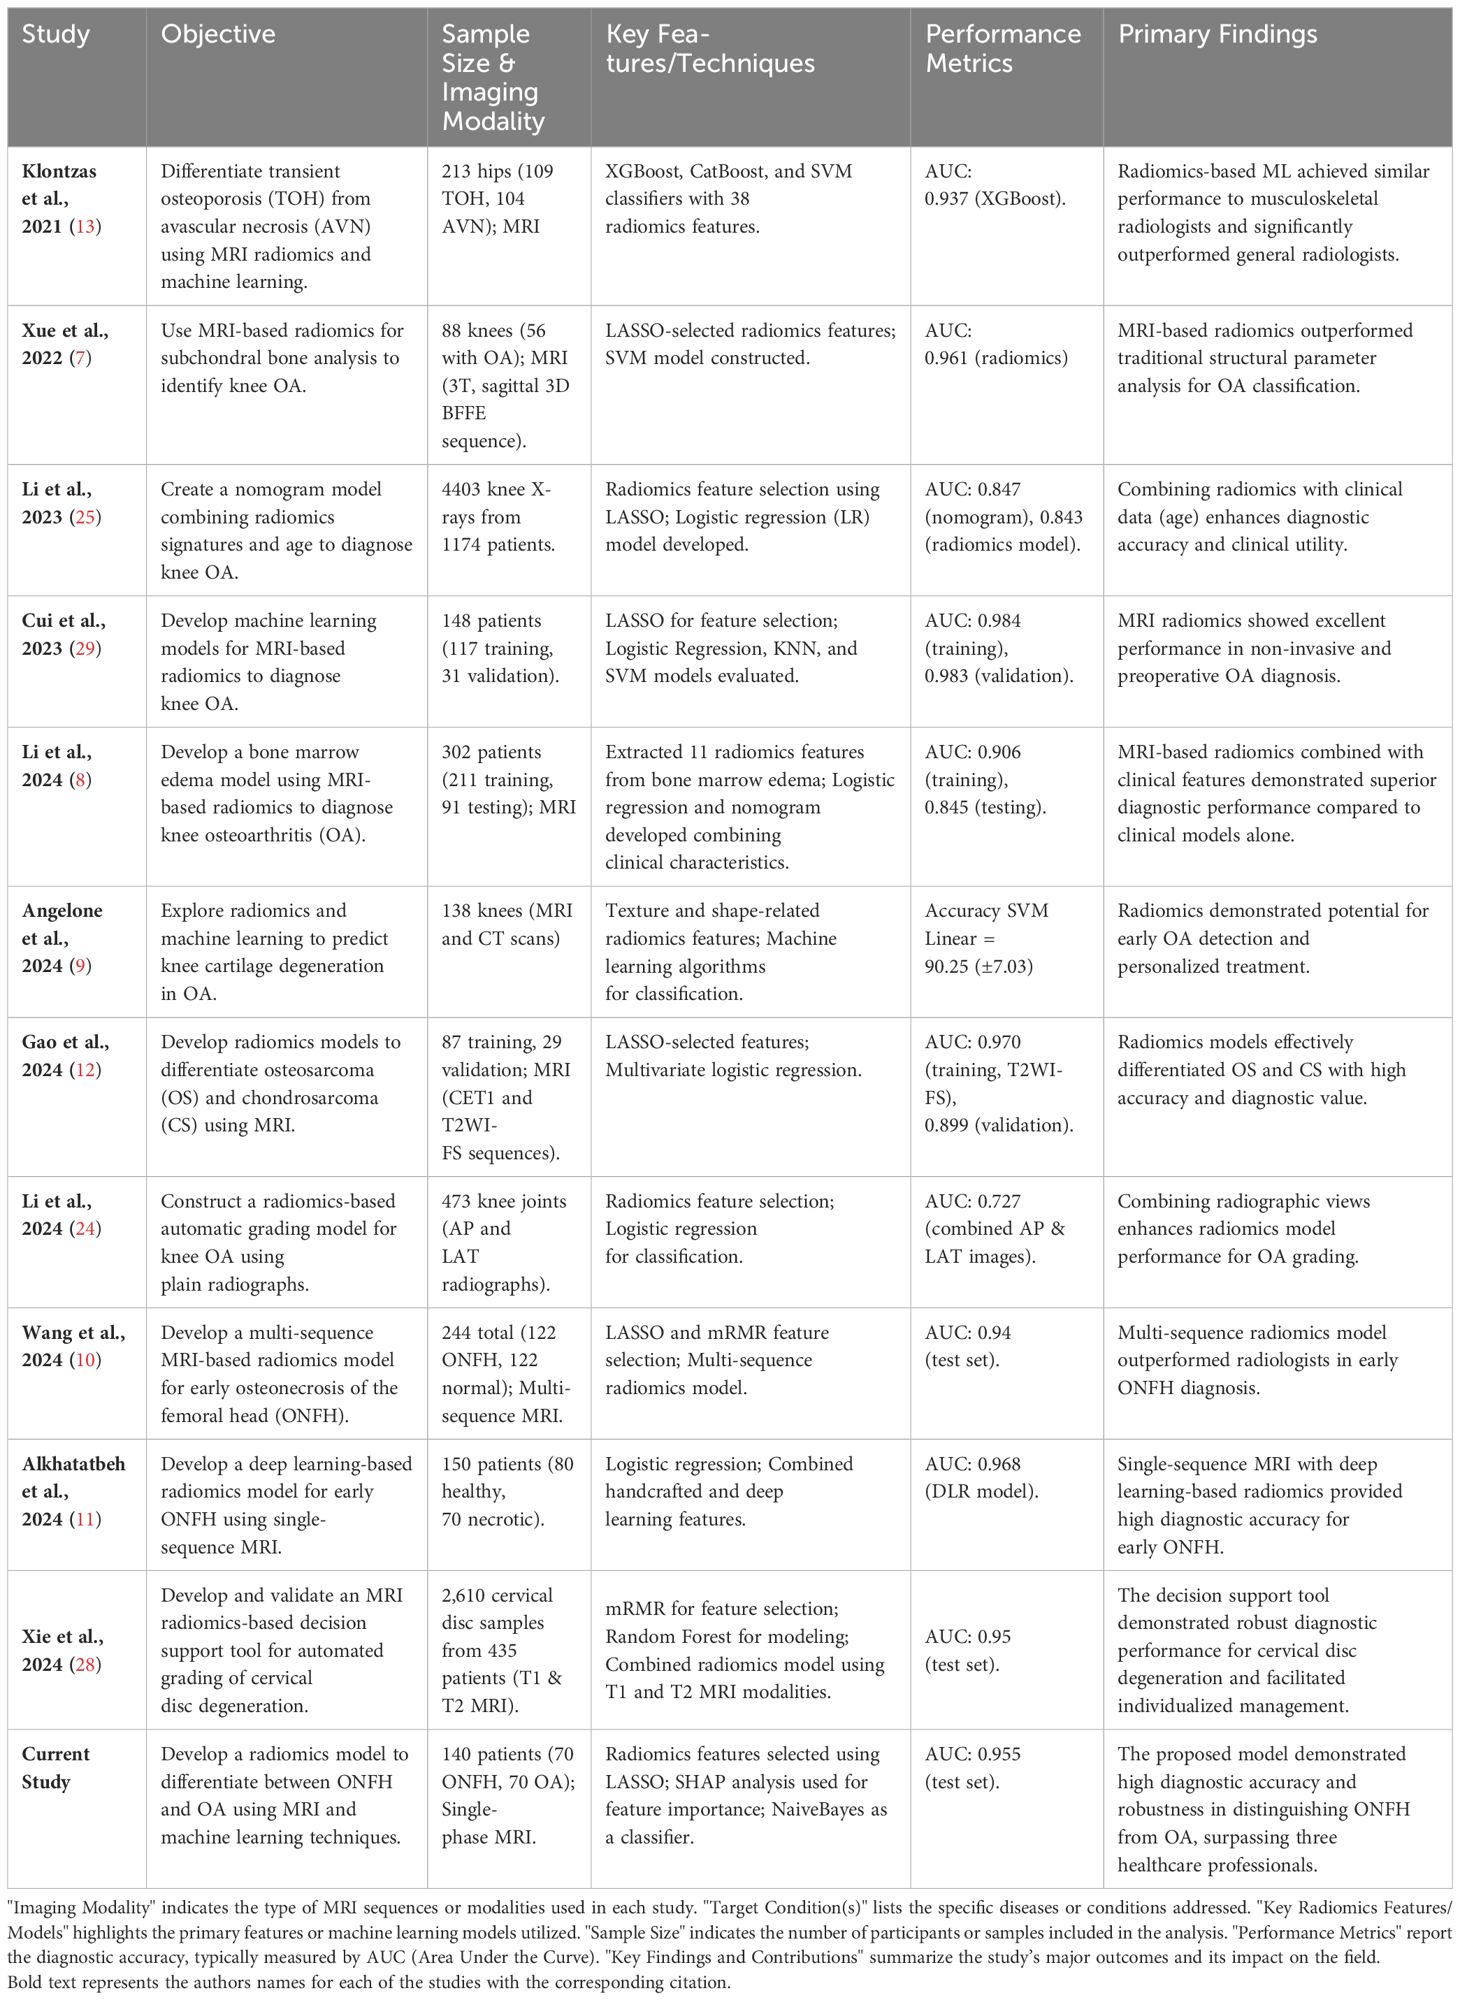
Table 5. The table provides a comparison of key studies on radiomics applications in musculoskeletal imaging.
The present study uniquely addresses the critical clinical challenge of distinguishing between osteoarthritis (OA) and osteonecrosis of the femoral head (ONFH)—two conditions with overlapping imaging characteristics but requiring distinct treatment strategies. By employing a SHAP-interpreted radiomics framework and utilizing a single-phase MRI, this work balances simplicity and accuracy while prioritizing feature interpretability, offering a robust and clinically applicable tool to improve diagnostic precision and support timely intervention. This paper represents the first investigation into the application of radiomics for differentiating between hip OA and ONFH. While most research focuses on the knee as it is the primary site of osteoarthritis, hip osteoarthritis ranks second in prevalence, highlighting the need for further study in this area. The interpretability of the presented model emphasizes the significance of individual radiomic features within a complex machine learning framework and provides insights into their contribution to specific diagnostic outcomes.Our study has certain limitations, including a moderate sample size for both training and testing. In addition,the investigation was conducted at a single center only; a multi-center study in the future could provide a more comprehensive examination of Radiomics in distinguishing between OA and ONFH. Moreover, involving more senior specialists could enhance the usefulness of this study. In conclusion, our research developed a Radiomics Model utilizing radiomics and machine learning to differentiate between OA and OFH. This strategy surpassed three users with varying levels of expertise. This innovative approach can provide critical diagnostic information and improve early treatment planning for patients with either osteoarthritis or osteonecrosis of the femoral head.
A Machine Learning-Based Radiomics model was developed and evaluated, demonstrating effective differentiation between ONFH and OA. This model has the potential to benefit both junior and senior surgeons, as well as radiologists, by facilitating early accurate diagnosis and the development of timely treatment plans.
The raw data supporting the conclusions of this article will be made available by the authors, without undue reservation.
The studies involving humans were approved by the medical ethics committee of the Second Hospital Xi’an Jiaotong University. The studies were conducted in accordance with the local legislation and institutional requirements. The ethics committee/institutional review board waived the requirement of written informed consent for participation from the participants or the participants’ legal guardians/next of kin because it was a retrospective study that doesn’t reveal any info about the patients.
TA: Conceptualization, Data curation, Formal analysis, Investigation, Methodology, Project administration, Validation, Writing – original draft, Writing – review & editing. AA: Conceptualization, Data curation, Resources, Writing – review & editing. QG: Data curation, Methodology, Resources, Writing – review & editing. JC: Data curation, Formal analysis, Methodology, Validation, Writing – review & editing. JS: Data curation, Formal analysis, Methodology, Validation, Writing – review & editing. XQ: Data curation, Formal analysis, Validation, Writing – review & editing. WW: Conceptualization, Funding acquisition, Methodology, Resources, Supervision, Writing – original draft, Writing – review & editing.
The author(s) declare financial support was received for the research, authorship, and/or publication of this article. National Natural Science Foundation of China - General Program: Micro/nano structural biomimetic material implanted via all-range core decompression to promote in-situ bone repair of osteonecrosis of the femoral head Project Number: 82072522. Shaanxi Provincial Universities Joint Medical and Engineering Cross Project: Research and Application of “Digital-Magnetic-Network” Intelligent Diagnosis and Treatment Technology for Osteoarthritis Knee Joint Replacement Surgery. Project Number: 2020GXLH.Y_001 (500,000 yuan). National Administration of Traditional Chinese Medicine Clinical Cooperation and Innovation Project: Research on the Clinical Collaborative Diagnosis and Treatment Plan for Osteoarthritis of the Elderly Using a Step-by-Step Combination of Traditional Chinese and Western Medicine. Project Number: GZY-KJS2021-002. Shaanxi Provincial Administration of Traditional Chinese Medicine Clinical Cooperation and Innovation Project: Research on the Clinical Collaborative Diagnosis and Treatment Plan for Osteoarthritis of the Elderly Using a Step-by-Step Combination of Traditional Chinese and Western Medicine. Project Number: 2020-ZXY-003.
The authors declare that the research was conducted in the absence of any commercial or financial relationships that could be construed as a potential conflict of interest.
The authors declare that no Generative AI was used in the creation of this manuscript.
All claims expressed in this article are solely those of the authors and do not necessarily represent those of their affiliated organizations, or those of the publisher, the editors and the reviewers. Any product that may be evaluated in this article, or claim that may be made by its manufacturer, is not guaranteed or endorsed by the publisher.
The Supplementary Material for this article can be found online at: https://www.frontiersin.org/articles/10.3389/fimmu.2025.1532248/full#supplementary-material
1. Katz JN, Arant KR, Loeser RF. Diagnosis and treatment of hip and knee osteoarthritis: A review. JAMA. (2021) 325:568. doi: 10.1001/jama.2020.22171
2. Lespasio MJ, Sodhi N, Mont MA. Osteonecrosis of the hip: A primer. Perm J. (2019) 23:18–100. doi: 10.7812/TPP/18-100
3. Lieberman JR, Berry DJ, Mont MA, Aaron RK, Callaghan JJ, Rajadhyaksha AD, et al. Osteonecrosis of the hip: management in the 21st century. Instr Course Lect. (2003) 52:337–55. doi: 10.2106/00004623-200205000-00023
4. Pivec R, Johnson AJ, Mont MA. Differentiation, diagnosis, and treatment of osteoarthritis, osteonecrosis, and rapidly progressive osteoarthritis. Harwin SF editor Orthopedics. (2013) 36:118–25. doi: 10.3928/01477447-20130122-04
5. Cardín-Pereda A, García-Sánchez D, Terán-Villagrá N, Alfonso-Fernández A, Fakkas M, Garcés-Zarzalejo C, et al. Osteonecrosis of the femoral head: A multidisciplinary approach in diagnostic accuracy. Diagnostics. (2022) 12:1731. doi: 10.3390/diagnostics12071731
6. Gao S, Peng C, Wang G, Deng C, Zhang Z, Liu X. Cartilage T2 mapping-based radiomics in knee osteoarthritis research: Status, progress and future outlook. Eur J Radiol. (2024) 181:111826. doi: 10.1016/j.ejrad.2024.111826
7. Xue Z, Wang L, Sun Q, Xu J, Liu Y, Ai S, et al. Radiomics analysis using MR imaging of subchondral bone for identification of knee osteoarthritis. J Orthop Surg. (2022) 17:414. doi: 10.1186/s13018-022-03314-y
8. Li X, Chen W, Liu D, Chen P, Li P, Li F, et al. Radiomics analysis using magnetic resonance imaging of bone marrow edema for diagnosing knee osteoarthritis. Front Bioeng Biotechnol. (2024) 12:1368188. doi: 10.3389/fbioe.2024.1368188
9. Angelone F, Ciliberti FK, Tobia GP, Jónsson H, Ponsiglione AM, Gislason MK, et al. Innovative diagnostic approaches for predicting knee cartilage degeneration in osteoarthritis patients: A radiomics-based study. Inf Syst Front. (2024). doi: 10.1007/s10796-024-10527-5
10. Wang Y, Sun D, Zhang J, Kong Y, Morelli JN, Wen D, et al. Multi-sequence MRI-based radiomics: An objective method to diagnose early-stage osteonecrosis of the femoral head. Eur J Radiol. (2024) 177:111563. doi: 10.1016/j.ejrad.2024.111563
11. Alkhatatbeh T, Alkhatatbeh A, Li X, Wang W. A single sequence MRI-based deep learning radiomics model in the diagnosis of early osteonecrosis of femoral head. Front Bioeng Biotechnol. (2024) 12:1471692. doi: 10.3389/fbioe.2024.1471692
12. Gao Z, Dai Z, Ouyang Z, Li D, Tang S, Li P, et al. Radiomics analysis in differentiating osteosarcoma and chondrosarcoma based on T2-weighted imaging and contrast-enhanced T1-weighted imaging. Sci Rep. (2024) 14:26594. doi: 10.1038/s41598-024-78245-1
13. Klontzas ME, Manikis GC, Nikiforaki K, Vassalou EE, Spanakis K, Stathis I, et al. Radiomics and machine learning can differentiate transient osteoporosis from avascular necrosis of the hip. Diagn Basel Switz. (2021) 11:1686. doi: 10.3390/diagnostics11091686
14. Lin T, Peng S, Lu S, Fu S, Zeng D, Li J, et al. Prediction of knee pain improvement over two years for knee osteoarthritis using a dynamic nomogram based on MRI-derived radiomics: a proof-of-concept study. Osteoarthritis Cartilage. (2023) 31:267–78. doi: 10.1016/j.joca.2022.10.014
15. Jiang T, Lau SH, Zhang J, Chan LC, Wang W, Chan PK, et al. Radiomics signature of osteoarthritis: Current status and perspective. J Orthop Transl. (2024) 45:100–6. doi: 10.1016/j.jot.2023.10.003
16. Lundberg SM, Erion G, Chen H, DeGrave A, Prutkin JM, Nair B, et al. From local explanations to global understanding with explainable AI for trees. Nat Mach Intell. (2020) 2:56–67. doi: 10.1038/s42256-019-0138-9
17. Wang R, Zhang J, Shan B, He M, Xu J. XGBoost machine learning algorithm for prediction of outcome in aneurysmal subarachnoid hemorrhage. Neuropsychiatr Dis Treat. (2022) 18:659–67. doi: 10.2147/NDT.S349956
18. Stoltzfus JC. Logistic regression: A brief primer. Acad Emerg Med. (2011) 18:1099–104. doi: 10.1111/j.1553-2712.2011.01185.x
19. Tran DT, Kiranyaz S, Gabbouj M, Iosifidis A. Heterogeneous multilayer generalized operational perceptron. IEEE Trans Neural Netw Learn Syst. (2020) 31:710–24. doi: 10.1109/TNNLS.5962385
20. Winters-Hilt S, Merat S. SVM clustering. BMC Bioinf. (2007) 8:S18. doi: 10.1186/1471-2105-8-S7-S18
21. Zhang Z. Naïve bayes classification in R. Ann Transl Med. (2016) 4:241. doi: 10.21037/atm.2016.03.38
22. Kocak B, Baessler B, Bakas S, Cuocolo R, Fedorov A, Maier-Hein L, et al. CheckList for EvaluAtion of Radiomics research (CLEAR): a step-by-step reporting guideline for authors and reviewers endorsed by ESR and EuSoMII. Insights Imaging. (2023) 14:75. doi: 10.1186/s13244-023-01415-8
23. Kocak B, Akinci D’Antonoli T, Mercaldo N, Alberich-Bayarri A, Baessler B, Ambrosini I, et al. METhodological RadiomICs Score (METRICS): a quality scoring tool for radiomics research endorsed by EuSoMII. Insights Imaging. (2024) 15:8. doi: 10.1186/s13244-023-01572-w
24. Li W, Liu J, Xiao Z, Zhu D, Liao J, Yu W, et al. Automatic grading of knee osteoarthritis with a plain radiograph radiomics model: combining anteroposterior and lateral images. Insights Imaging. (2024) 15:143. doi: 10.1186/s13244-024-01719-3
25. Li W, Feng J, Zhu D, Xiao Z, Liu J, Fang Y, et al. Nomogram model based on radiomics signatures and age to assist in the diagnosis of knee osteoarthritis. Exp Gerontol. (2023) 171:112031. doi: 10.1016/j.exger.2022.112031
26. Li S, Cao P, Li J, Chen T, Luo P, Ruan G, et al. Integrating radiomics and neural networks for knee osteoarthritis incidence prediction. Arthritis Rheumatol. (2024) 76:1377–86. doi: 10.1002/art.42915
27. Fang K, Zheng X, Lin X, Dai Z. Unveiling osteoporosis through radiomics analysis of hip CT imaging. Acad Radiol. (2024) 31:1003–13. doi: 10.1016/j.acra.2023.10.009
28. Xie J, Yang Y, Jiang Z, Zhang K, Zhang X, Lin Y, et al. MRI radiomics-based decision support tool for a personalized classification of cervical disc degeneration: a two-center study. Front Physiol. (2024) 14:1281506. doi: 10.3389/fphys.2023.1281506
Keywords: radiomics, machine learning, osteonecrosis, osteoarthritis, hip
Citation: Alkhatatbeh T, Alkhatatbeh A, Guo Q, Chen J, Song J, Qin X and Wei W (2025) Interpretable machine learning and radiomics in hip MRI diagnostics: comparing ONFH and OA predictions to experts. Front. Immunol. 16:1532248. doi: 10.3389/fimmu.2025.1532248
Received: 21 November 2024; Accepted: 13 January 2025;
Published: 29 January 2025.
Edited by:
Lushan Xiao, Southern Medical University, ChinaReviewed by:
Zekun Jiang, Sichuan University, ChinaCopyright © 2025 Alkhatatbeh, Alkhatatbeh, Guo, Chen, Song, Qin and Wei. This is an open-access article distributed under the terms of the Creative Commons Attribution License (CC BY). The use, distribution or reproduction in other forums is permitted, provided the original author(s) and the copyright owner(s) are credited and that the original publication in this journal is cited, in accordance with accepted academic practice. No use, distribution or reproduction is permitted which does not comply with these terms.
*Correspondence: Wang Wei, ZHIud2FuZ3dlaUB4anR1LmVkdS5jbg==
Disclaimer: All claims expressed in this article are solely those of the authors and do not necessarily represent those of their affiliated organizations, or those of the publisher, the editors and the reviewers. Any product that may be evaluated in this article or claim that may be made by its manufacturer is not guaranteed or endorsed by the publisher.
Research integrity at Frontiers
Learn more about the work of our research integrity team to safeguard the quality of each article we publish.