 Qin Liu1,2†
 Yabing Sun3,4†
 Tao Zhang5
 Wanrun Lin6
 Jing Zhang7Huijuan Zhang1,4
 Wenxin Zheng8Hong Xu3,4*
 Feng Zhou1,4*
- 1Department of Pathology, The International Peace Maternal and Child Health Hospital, School of Medicine, Shanghai Jiao Tong University, Shanghai, China
- 2Department of Pathology, Zhejiang University School of Medicine Women’s Hospital, Hangzhou, Zhejiang, China
- 3Department of Gynecology, The International Peace Maternal and Child Health Hospital, School of Medicine, Shanghai Jiao Tong University, Shanghai, China
- 4Shanghai Key Laboratory of Embryo Original Diseases, Shanghai, China
- 5Department of Gynecology, Zhejiang University School of Medicine Women’s Hospital, Hangzhou, Zhejiang, China
- 6Laboratory of Pathology, National Cancer Institute, National Institutes of Health, Bethesda, MD, United States
- 7Department of Biological Sciences, College of Arts and Sciences, University at Albany, State University of New York (SUNY), Albany, NY, United States
- 8Department of Pathology, Department of Obstetrics and Gynecology, University of Texas Southwestern Medical Center, Dallas, TX, United States
Background: The exploration of genetic signatures within the ovarian cancer (OC) tumor microenvironment (TME) remains limited. M2-like tumor-associated macrophages (M2-like TAMs) are pivotal in OC progression and therapy. This study aims to establish a novel prognostic signature and identify M2-like TAM-related biomarkers in OC using RNAseq-based transcriptome analysis.
Methods: Prognostic M2-like TAM-related genes were identified through univariate Cox regression, consensus clustering, and LASSO regression. Immune landscape analysis was conducted to assess immune cell composition and immune checkpoint genes in high- and low-risk groups. Subsequently, in vitro cell experiments and OC cohorts were performed.
Results: Gene set enrichment analysis revealed that GNA15 is involved in immune responses like leukocyte transendothelial migration and FcγR-mediated phagocytosis. GNA15 was up-regulated in cisplatin-resistant OC cells, and its in vitro down-regulation decreased cell proliferation. An eight-gene prognostic model, including M2-like TAM-related genes, independently predicted poor outcomes in OC. GNA15 emerged as a hub gene positively correlated with M2-like TAMs infiltration, predicting unfavorable outcomes across OC cohorts. Moreover, GNA15 expression correlated positively with CD163 expression, suggesting its role in macrophage polarization.
Conclusion: GNA15 plays an immunosuppressive role in OC progression linked to M2-like TAMs polarization and stands as a potential prognostic marker in OC.
Background
Ovarian cancer (OC) is the leading cause of reproductive cancer-related deaths in women globally (1). Its aggressive nature results in a low early detection rate, with 60%-70% of patients diagnosed at advanced stages (2). Treatment typically involves surgery combined with chemotherapy, and targeted therapies, yet resistance to chemotherapy remains a significant challenge leading to treatment failures. Given the modest gains in survival rates with conventional therapies, there is increasing interest in exploring immunotherapy as a viable treatment strategy. Thus, understanding the tumor-immune interactions and identifying novel therapeutic targets are critical for improving ovarian cancer outcomes.
The tumor microenvironment (TME) comprises a complex network involving tumor cells, immune cells, stromal elements, and various signaling molecules such as cytokines and chemokines. Extensive research has highlighted the TME’s role in tumorigenesis, cancer progression, and treatment resistance (3–5). Tumors can modulate the microenvironment to promote growth, metastasis, or evade therapies (6, 7). Moreover, the TME plays a pivotal role in regulating immune responses in cancer, influencing both tumor suppression and progression (8).
Among the key players in the TME are tumor-associated macrophages (TAMs), which are highly plastic immune cells within the tumor microenvironment, capable of adopting distinct M1 or M2 phenotypes in response to local signals (9, 10). M1-type macrophages exert anti-tumor effects, while M2-type macrophages can promote tumor progression by enhancing proliferation and invasion (11, 12). The interactions between TAMs, tumor cells, stromal cells, and endothelial cells are pivotal in reshaping the TME, thereby facilitating tumor growth, immune evasion, and metastasis (13, 14). Due to the dual polarization of TAMs, with distinct pro-tumor (M2) and anti-tumor (M1) phenotypes, modulating their polarization presents a promising therapeutic strategy for cancer treatment.
Guanine nucleotide-binding protein subunit alpha-15 (GNA15) was characterized as one of the hub genes most associated with M2-like TAMs infiltration in OC. It has been reported that GNA15 mediates a non-classical G protein-coupled receptor (GPCR) signaling pathway that, through CD312, promotes a suppressive TME in the onset and progression of pediatric acute lymphoblastic leukemia (15). In macrophages, genetic deletion of GNA15 almost completely blocked C5a-induced Ca2+ transients, but chemotaxis and cell spreading were preserved (16). These findings offer insights into the expression and function of the GNA15 gene in macrophages, indicating that it may play a crucial role in macrophage signal transduction and cellular behavior. Previous studies have also highlighted the involvement of GNA15 in various tumor types such as liver cancer, pancreatic adenocarcinoma, acute myeloid leukemia, and ovarian cancer (17–21). Moreover, GNA15 has been implicated in the TME in pancreatic cancer and melanoma (22, 23). Despite its involvement in other cancers, GNA15’s role in the OC microenvironment remains poorly understood.
Our study aims to investigate the association between GNA15 and M2-like TAMs in OC. We developed a prognostic model based on M2-like TAMs to predict OC patient survival rates and have conducted comparative analyses of immune landscapes across different risk groups.
Materials and methods
Dataset acquisition and preprocessing
This study included patients from five OC cohorts namely GSE65986, GSE3149, GSE63885, GSE140082 as well as TCGA-OC. Gene expression data, corresponding clinical and survival information of ovarian cancer were download from the Genomic Data Commons (GDC, https://portal.gdc.cancer.gov/) and Gene Expression Omnibus (GEO) dataset (https://www.ncbi.nlm.nih.gov/geo/). The mRNA-seq data were converted to TPM (transcripts per million) values and normalized by log2(x+1) for following analyses.
Obtainment of prognostic M2-like TAM-related genes
To identify genes strongly associated with M2 macrophage infiltration, we employed the R WGCNA package to construct mRNA co-expression networks based on TCGA-OC gene expression data (24). Initially, a similarity matrix was generated by calculating the Pearson correlation coefficient between each pair of genes, following transformed to an adjacency matrix by WGCNA. By selecting a soft thresholding power (β=5) and setting a network merge height of 0.25 to combine similar gene modules, a total of 31 gene modules were obtained. Subsequently, the gene module including 113 hub genes that showed the highest correlation with M2-like TAM infiltration was extracted for further analysis by performing Pearson’s correlation analysis. Finally, we verified 18 M2-like TAM-related genes with prognostic value using univariate Cox regression analysis on the 113 hub genes.
Consensus clustering analysis based on M2-like TAM infiltration
We performed consensus clustering based on the 18 prognostic M2-like TAM-related genes using R Consensus Cluster Plus package (25) for TCGA-OC datasets. According to the cluster consensus value, the optimal K value was set as 2 and the pheatmap tool in R was used to create the cluster map.
Functional enrichment analysis, immune cell infiltration analysis and genomic mutations analysis between two clusters
We screened the differentially expressed genes (DEGs) between C1 and C2 subgroups using the limma package in R software. Kyoto Encyclopedia of Genes and Genomes (KEGG) analyses were conducted to explore the biological pathway of the DEGs. Then, Gene Set Enrichment Analysis (GSEA, https://www.gsea-msigdb.org/) was performed to analyze functional pathways enriched between C1 and C2 subgroups. Pathways with a P value <0.05 and a false discovery rate <0.25 were considered significantly enriched pathways. To identify differences in the immune landscape between C1 and C2 subgroups, we loaded the expression data of TCGA-OC into CIBERSORT (https://cibersort.stanford.edu/). To compare the genomic mutations between two clusters, OC somatic mutation data were obtained from the TCGA Genomic Data Commons Data Portal. The Maftools package in R software was used to visualize the mutations between C1 and C2 subgroups.
Development and verification of the M2-like TAM-related prognostic model
Totally, 18 prognostic M2-like TAM-related genes were identified. Least absolute shrinkage and selection operator (LASSO) regression analyses and tenfold cross-validation was used to determine the penalty regularization parameter lambda to develop an eight M2-like TAM -related genes (ALOX5AP, CCR1, GNA15, IL2RG, ITGAM, LPXN, MSR1, and PDCD1LG2) prognostic model. Based on the best lambda values and the corresponding coefficients, the riskscore of each patient was calculated by using the score formula as follows: Riskscore=(0.1245)*ALOX5AP+(-0.1815)*CCR1+(0.1256)*GNA15+(-0.1901)*IL2RG+(0.0947)*ITGAM+(-0.0654)*LPXN+(0.1384)*MSR1+(-0.1126)*PDCD1LG2. Then, patients were divided into low- and high-risk groups based on the optimal cutoff of the riskscore. To compare the overall survival (OS) time between high and low-risk groups, we conducted Kaplan-Meier analysis and the log-rank test. To further validate the prognostic model, GSE140082 was select as the validation cohort to evaluate the M2-like TAM-related prognostic model constructed based on TCGA database.
Expression of GNA15 in normal and tumor samples
Gene Expression Profiling Interactive Analysis 2 (GEPIA2) is an online tool for analyzing RNA-sequencing expression data between normal and tumor samples (26). Here, we compared GNA15 expression in 33 types of tumor by GEPIA2.
TIMER 2.0 analysis
The association between GNA15 expression and the M2-like TAM infiltration or M2 macrophages gene markers expression was explored by Tumor Immune Estimation Resource 2.0 (TIMER 2.0; http://timer.comp-genomics.org/), which is a valuable tool that can systematically evaluates the infiltration of various immune cells (27).
In vitro cell experiments
IOSE80, SKOV3, TOV112D, MDAH2774, OVCAR5 and OVCAR8 cell lines (ATCC, USA) were used for in vitro experiments. In addition, A2780-cis and SKOV3-cis were cisplatin-resistant cell lines (ATCC, USA) for validation of GNA15 involved in drug resistance. All cells were cultured in RPMI 1640 medium containing 10% FBS at 37°C with 5% CO2. ShRNA-mediated knockout is a transcriptional-level gene suppression, while the gRNA-guided CRISPR/Cas9 system is typically used for permanent gene knockout by introducing mutations or deletions. To ensure the reliability of the experimental data following gene knockout, we used both shRNA and gRNA-guided CRISPR/Cas9 methods to knockout the GNA15 gene. GNA15 was knocked down using both shRNA and CRISPR/Cas9. The sequences for Sh2, Sh3, and gRNA were as follows: CCTCGCATTGTTTGGGACTAT, CCATTGTTTCGAGAACGTGAT, and CGATCACGTTCTCGAAACAA, respectively. The Cell Counting Kit-8 (Boster, China) was used to assess cell proliferation according to the manufacturer’s instructions.
Clinical sample collection
In this study, 60 OC and 30 normal ovarian paraffin embedded samples, 12 OC and 9 normal control samples (fresh tissue) from 2003 to 2017 were collected. The sample collection procedure and further studies were approved by the institutional review board. Patient clinicopathologic information, including age, clinical stage, and follow-up data were extracted from the electronic clinical information system database. Hematoxylin and eosin and immunohistochemistry (IHC) slides were reviewed by the gynecological pathologist (F.Z.) and the pathologic diagnosis was confirmed. The pathological diagnosis for all patients is high-grade serous carcinoma. Subsequently, IHC and Quantitative real-time PCR (qRT-PCR) were performed on these samples. All experiments were conducted following the guidelines and instructions approved by the manufacturer.
IHC
Paraffin sections (4-µm) were stained with the antibodies using the 2-step Envision method according to the manufacturer’s instructions and visualized using 3-diaminobenzidine tetrachloride (Sigma, St Louis, MO). Antibodies against GNA15 (1:350 dilution; NBP2-16557, Novus), CD163 (1:100 dilution, Gene, China) were used in this study. The detection kit was obtained from Dako Corporation (Glostrup, Denmark). The negative control entailed the use of the same non-specific IgG but omitting the primary antibody. Positive cells were indicated by the presence of yellow to brown DAB staining in the nucleus or cytoplasm. GNA15 and CD163 expression were quantified in IHC by evaluating both the staining intensity and the percentage of positively stained cells. Staining intensity was scored as none, weak, moderate, or strong, and the percentage of positive cells was estimated. The score was then calculated by multiplying the staining intensity with the percentage of positive cells, providing a semi-quantitative measure of protein expression.
qRT-PCR
The expression level of GNA15 was evaluated by qRT-PCR. TRIzol reagent (15596018, Invitrogen) was used to extract total RNA. The integrity and fragment size of the extracted RNA were assessed through 1% agarose gel electrophoresis. Additionally, the quality of the extracted RNA was measured using NanoDrop 2000 (Thermo Scientific, USA). qRT-PCR was performed to detect GNA15 mRNA expression in cancer cell lines and fresh cancer tissues. Primers sequences of GNA15 and GAPDH were as follows: GAPDH, TTCACCACCATGGAGAAGGC and GGCATGGACTGTGGTCATGA; and GNA15, CCCTGGTTCAAAAGCACATCCG and AACCTCTTGGCTGCCTCAGCAT, respectively.
Statistical analysis
Kaplan-Meier analysis and log-rank tests were conducted to compare survival differences between different subgroups. Multivariate and univariate cox regression analyses were applied to identify prognostic factors. Correlation analysis between GNA15 and other factors were conducted using Pearson or Spearman correlation analyses. All statistical analyses were conducted using R software. P<0.05 was considered statistically significant.
Results
Identification of prognostic M2-like TAM-related genes by WGCNA in OC
Totally, 22 kinds of immune cell infiltration were calculated by the CIBERSORT algorithm based on TCGA-OC datasets. Kaplan–Meier analyses showed that high M2 macrophage infiltration indicated a poor prognosis (Figure 1A). Based on the results, we performed WGCNA to detect the modules related to M2 macrophage infiltration. A soft threshold power of β = 5 (scale-free R2 = 0.90) was selected to build a scale-free network (Supplementary Figures S1A–E). As a result, 31 modules were generated by WGCNA. Among all the modules, the darkmagenta module was the most significantly related to M2 macrophages according to correlation analysis (correlation = 0.21, P<0.001, Figure 1B). Then, univariate cox regression analyses identified 18 prognostic M2-like TAM-related genes from the darkmagenta module (Figure 1C).
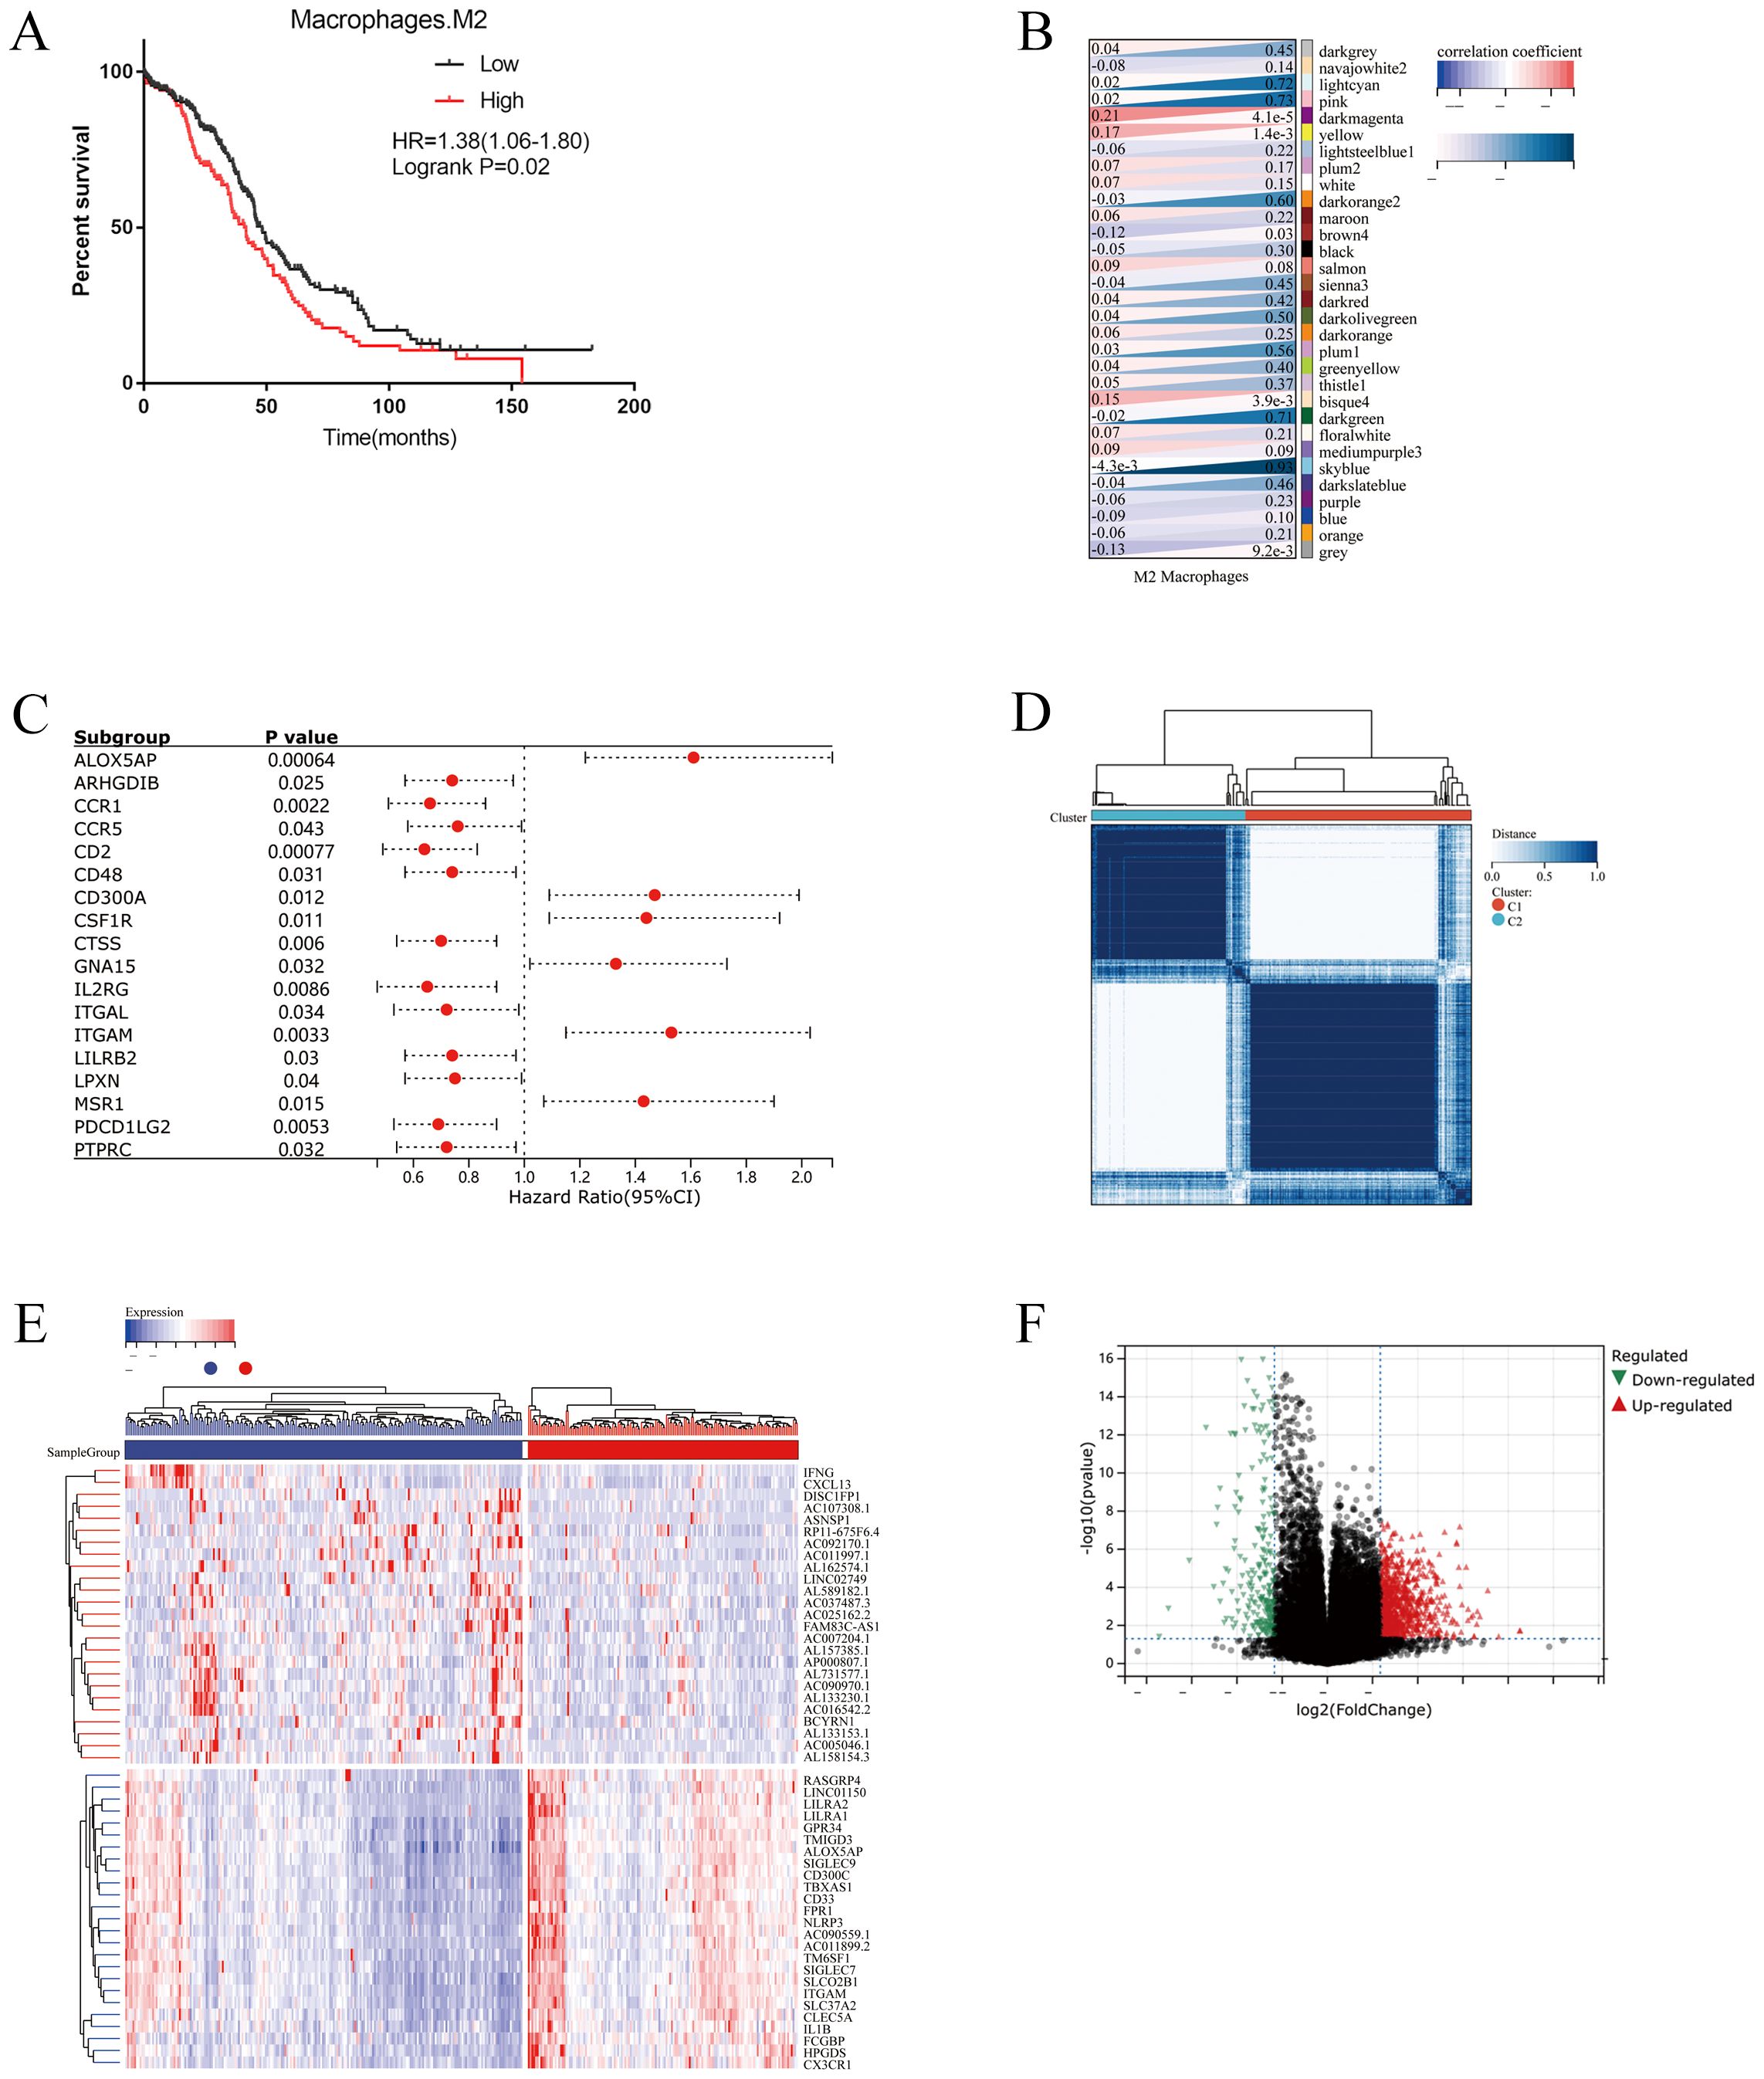
Figure 1. Identification of prognostic M2-like TAMs related genes. (A) Kaplan–Meier analysis showing the correlations between M2-like TAMs infiltration and overall survival (OS) in TCGA OC cohorts. Patients were grouped into “high” or “low” groups based on the median CIBERSORT-based M2 macrophages score. (B) Weighted correlation network analysis (WGCNA) identifies M2-like TAMs infiltration correlated modules. (C) Univariate COX regression analysis for the 18 genes associated with the infiltration of M2 macrophages. (D) Consensus clustering showed that 2 clusters were most stable. (E) Heatmap plot exhibiting the up-regulated and down-regulated genes in OC tissues between Cluster1 and Cluster2. (F) Volcano plot showing differential expressed genes in two clusters.
Consensus clustering based on prognostic M2-like TAM-related genes and following pathway analysis
Two clusters were identified by R Consensus Cluster Plus package for Consensus Clustering in TCGA-OC dataset based on the 18 prognostic M2-like TAM-related genes: Cluster1 (222 cases) and Cluster2 (151 cases) (Figure 1D). A total of 123 DEGs were visualized with the R package “heatmap” and the volcano maps (Figures 1E, F). Compared to Cluster1, Cluster2 showed a significantly worse prognosis (log-rank P<0.0001, Figure 2A). KEGG showed that DEGs between Cluster1 and Cluster2 were mainly enriched in Cytokine-cytokine receptor interaction, Osteoclast differentiation, Phagosome, B cell receptor signaling pathway, Toll-like receptor signaling pathway and Fc epsilon RI signaling pathway (Figure 2B). GSEA results showed that immune related pathways were mainly enriched in Cluster2 (Figure 2C). Accordingly, the infiltration of M2 macrophage is significantly higher while infiltration of B cells naive, plasma cells, T cells CD8, T cells CD4 memory activated and T cells follicular helper is significantly lower in Cluster2 than that in Cluster1 (Figures 2D–F). In addition, somatic mutations analysis showed that mutations frequency in Cluster2 is significantly higher than that in Cluster1 (Figures 3A, B).
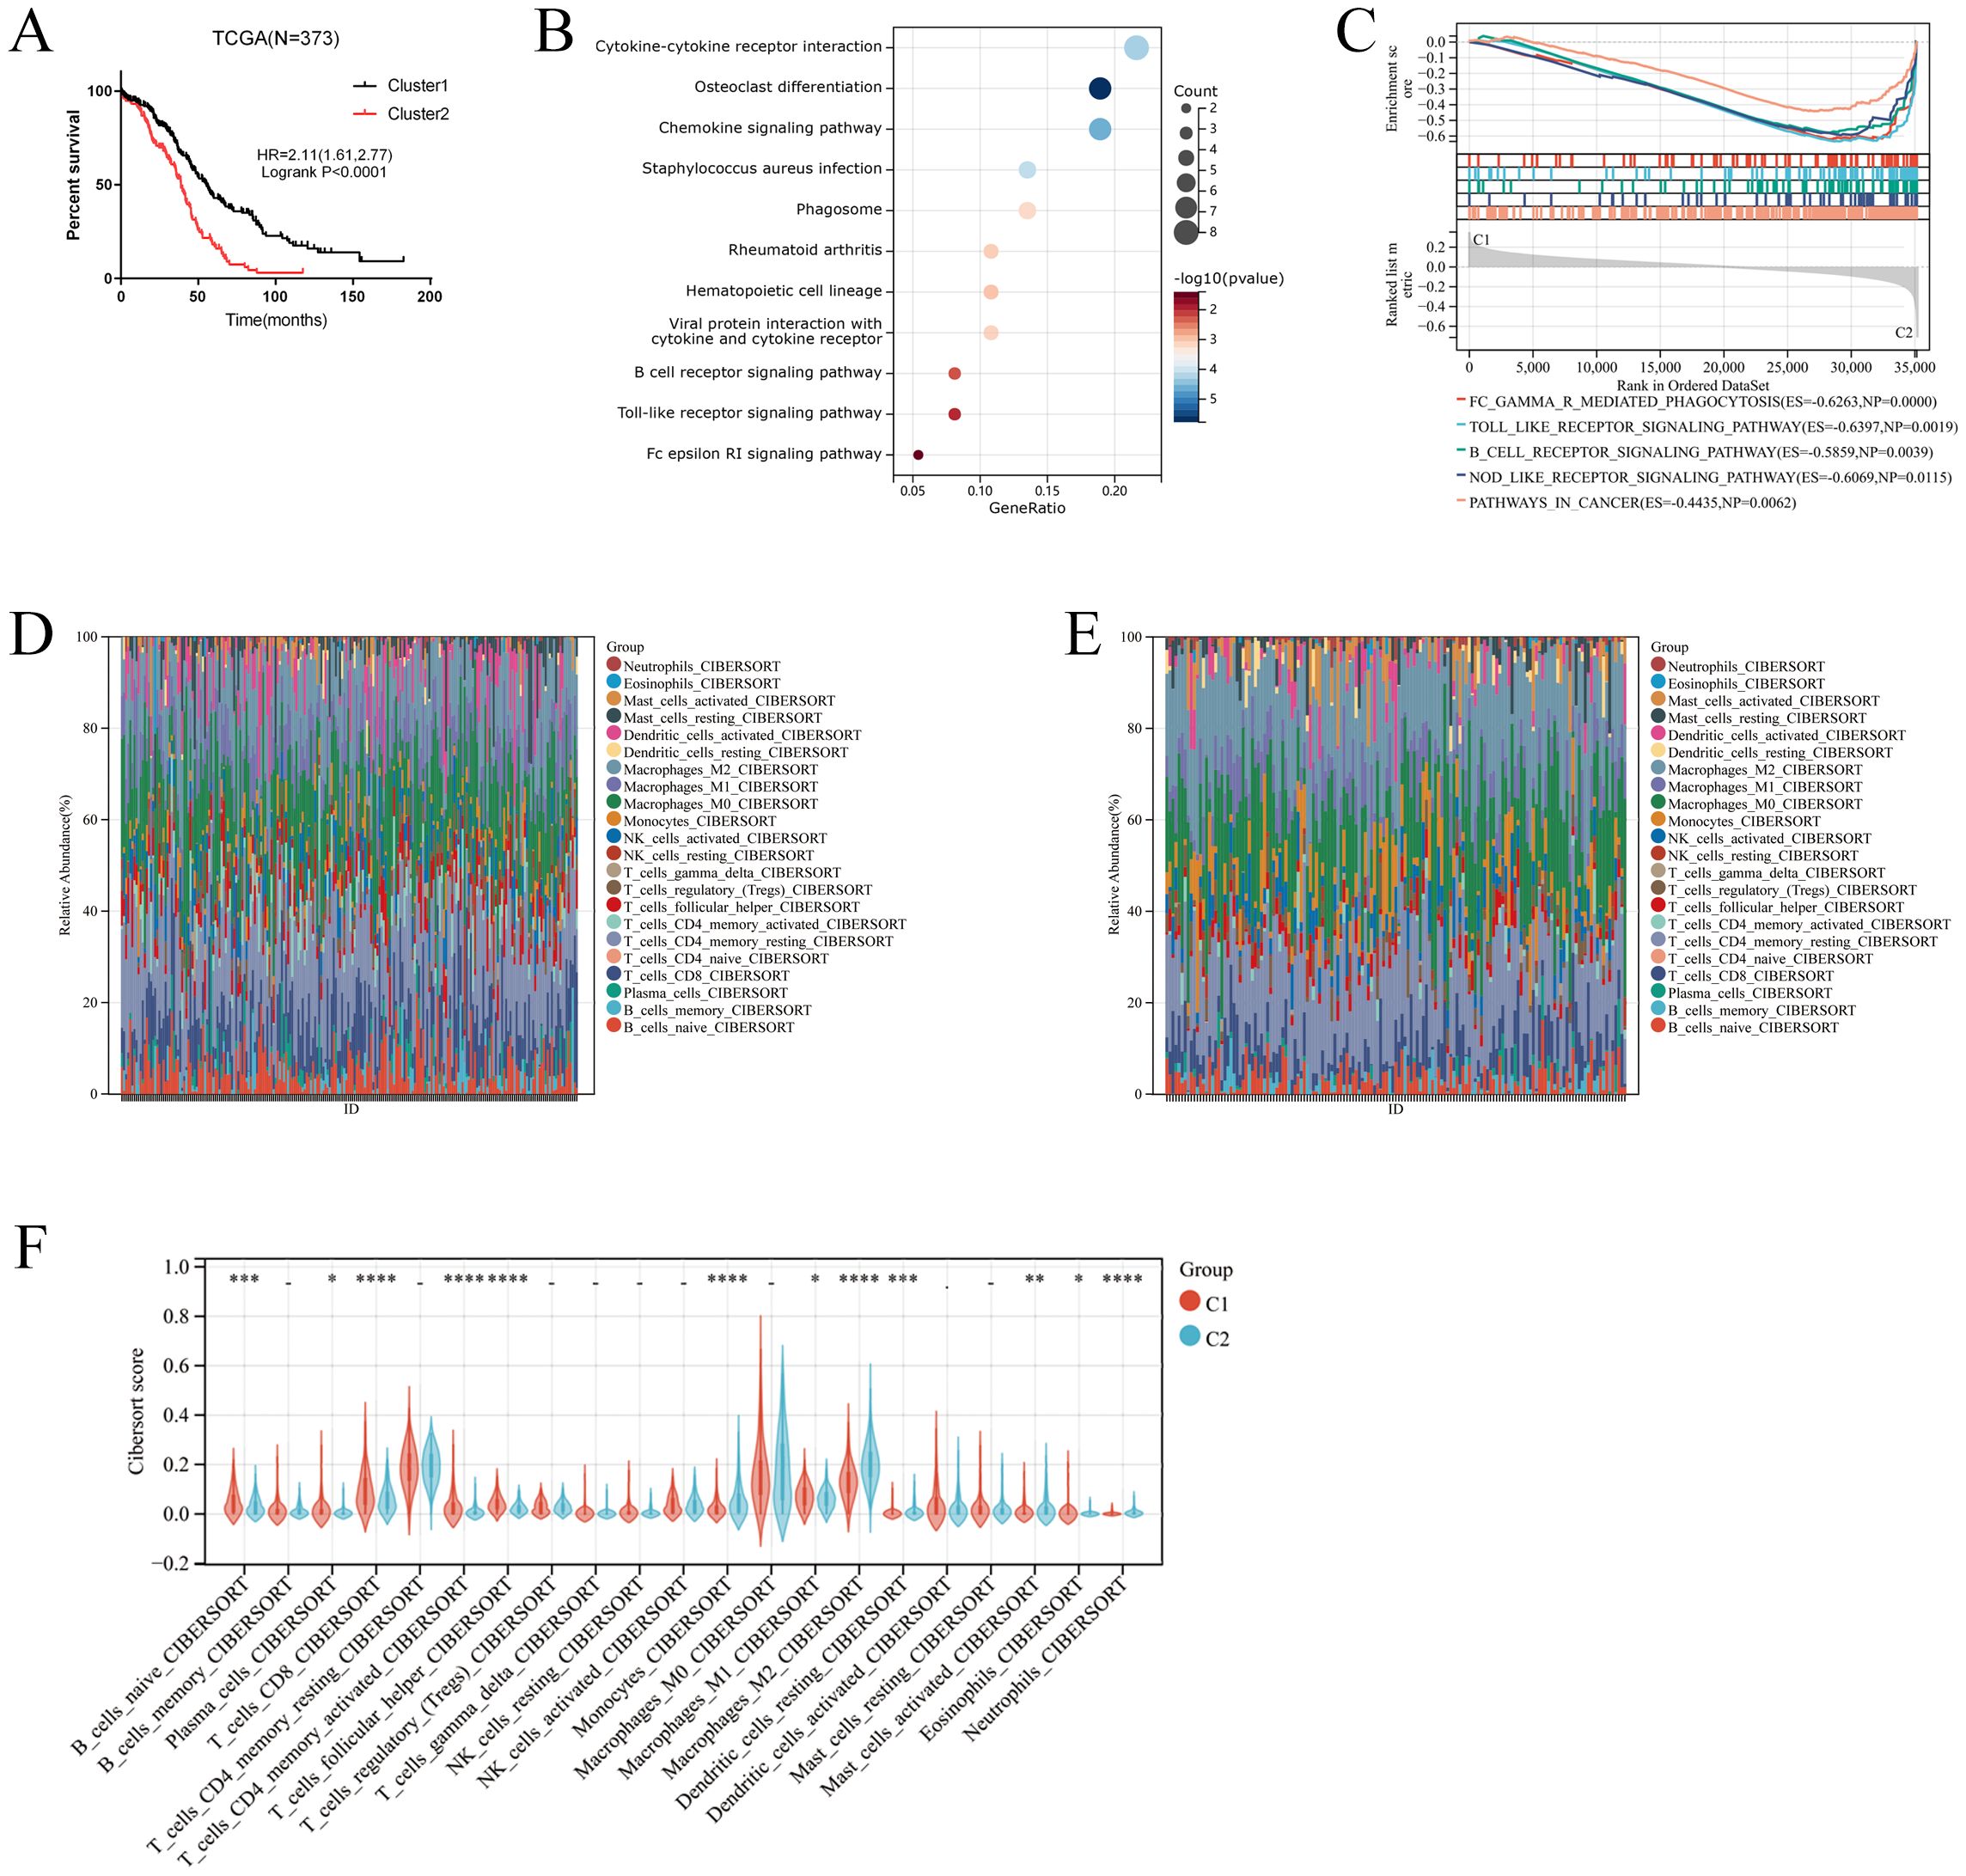
Figure 2. Identification of M2-like TAMs related cluster. (A) Kaplan–Meier analysis showing overall survival (OS) of two clusters. (B) KEGG analysis for the differential expressed genes in two clusters. (C) GSEA analysis for the two clusters. (D-F) The comparison of the immune cells infiltration between the two clusters. *p < 0.05; **: p < 0.01; *** p < 0.001; ****p < 0.0001.
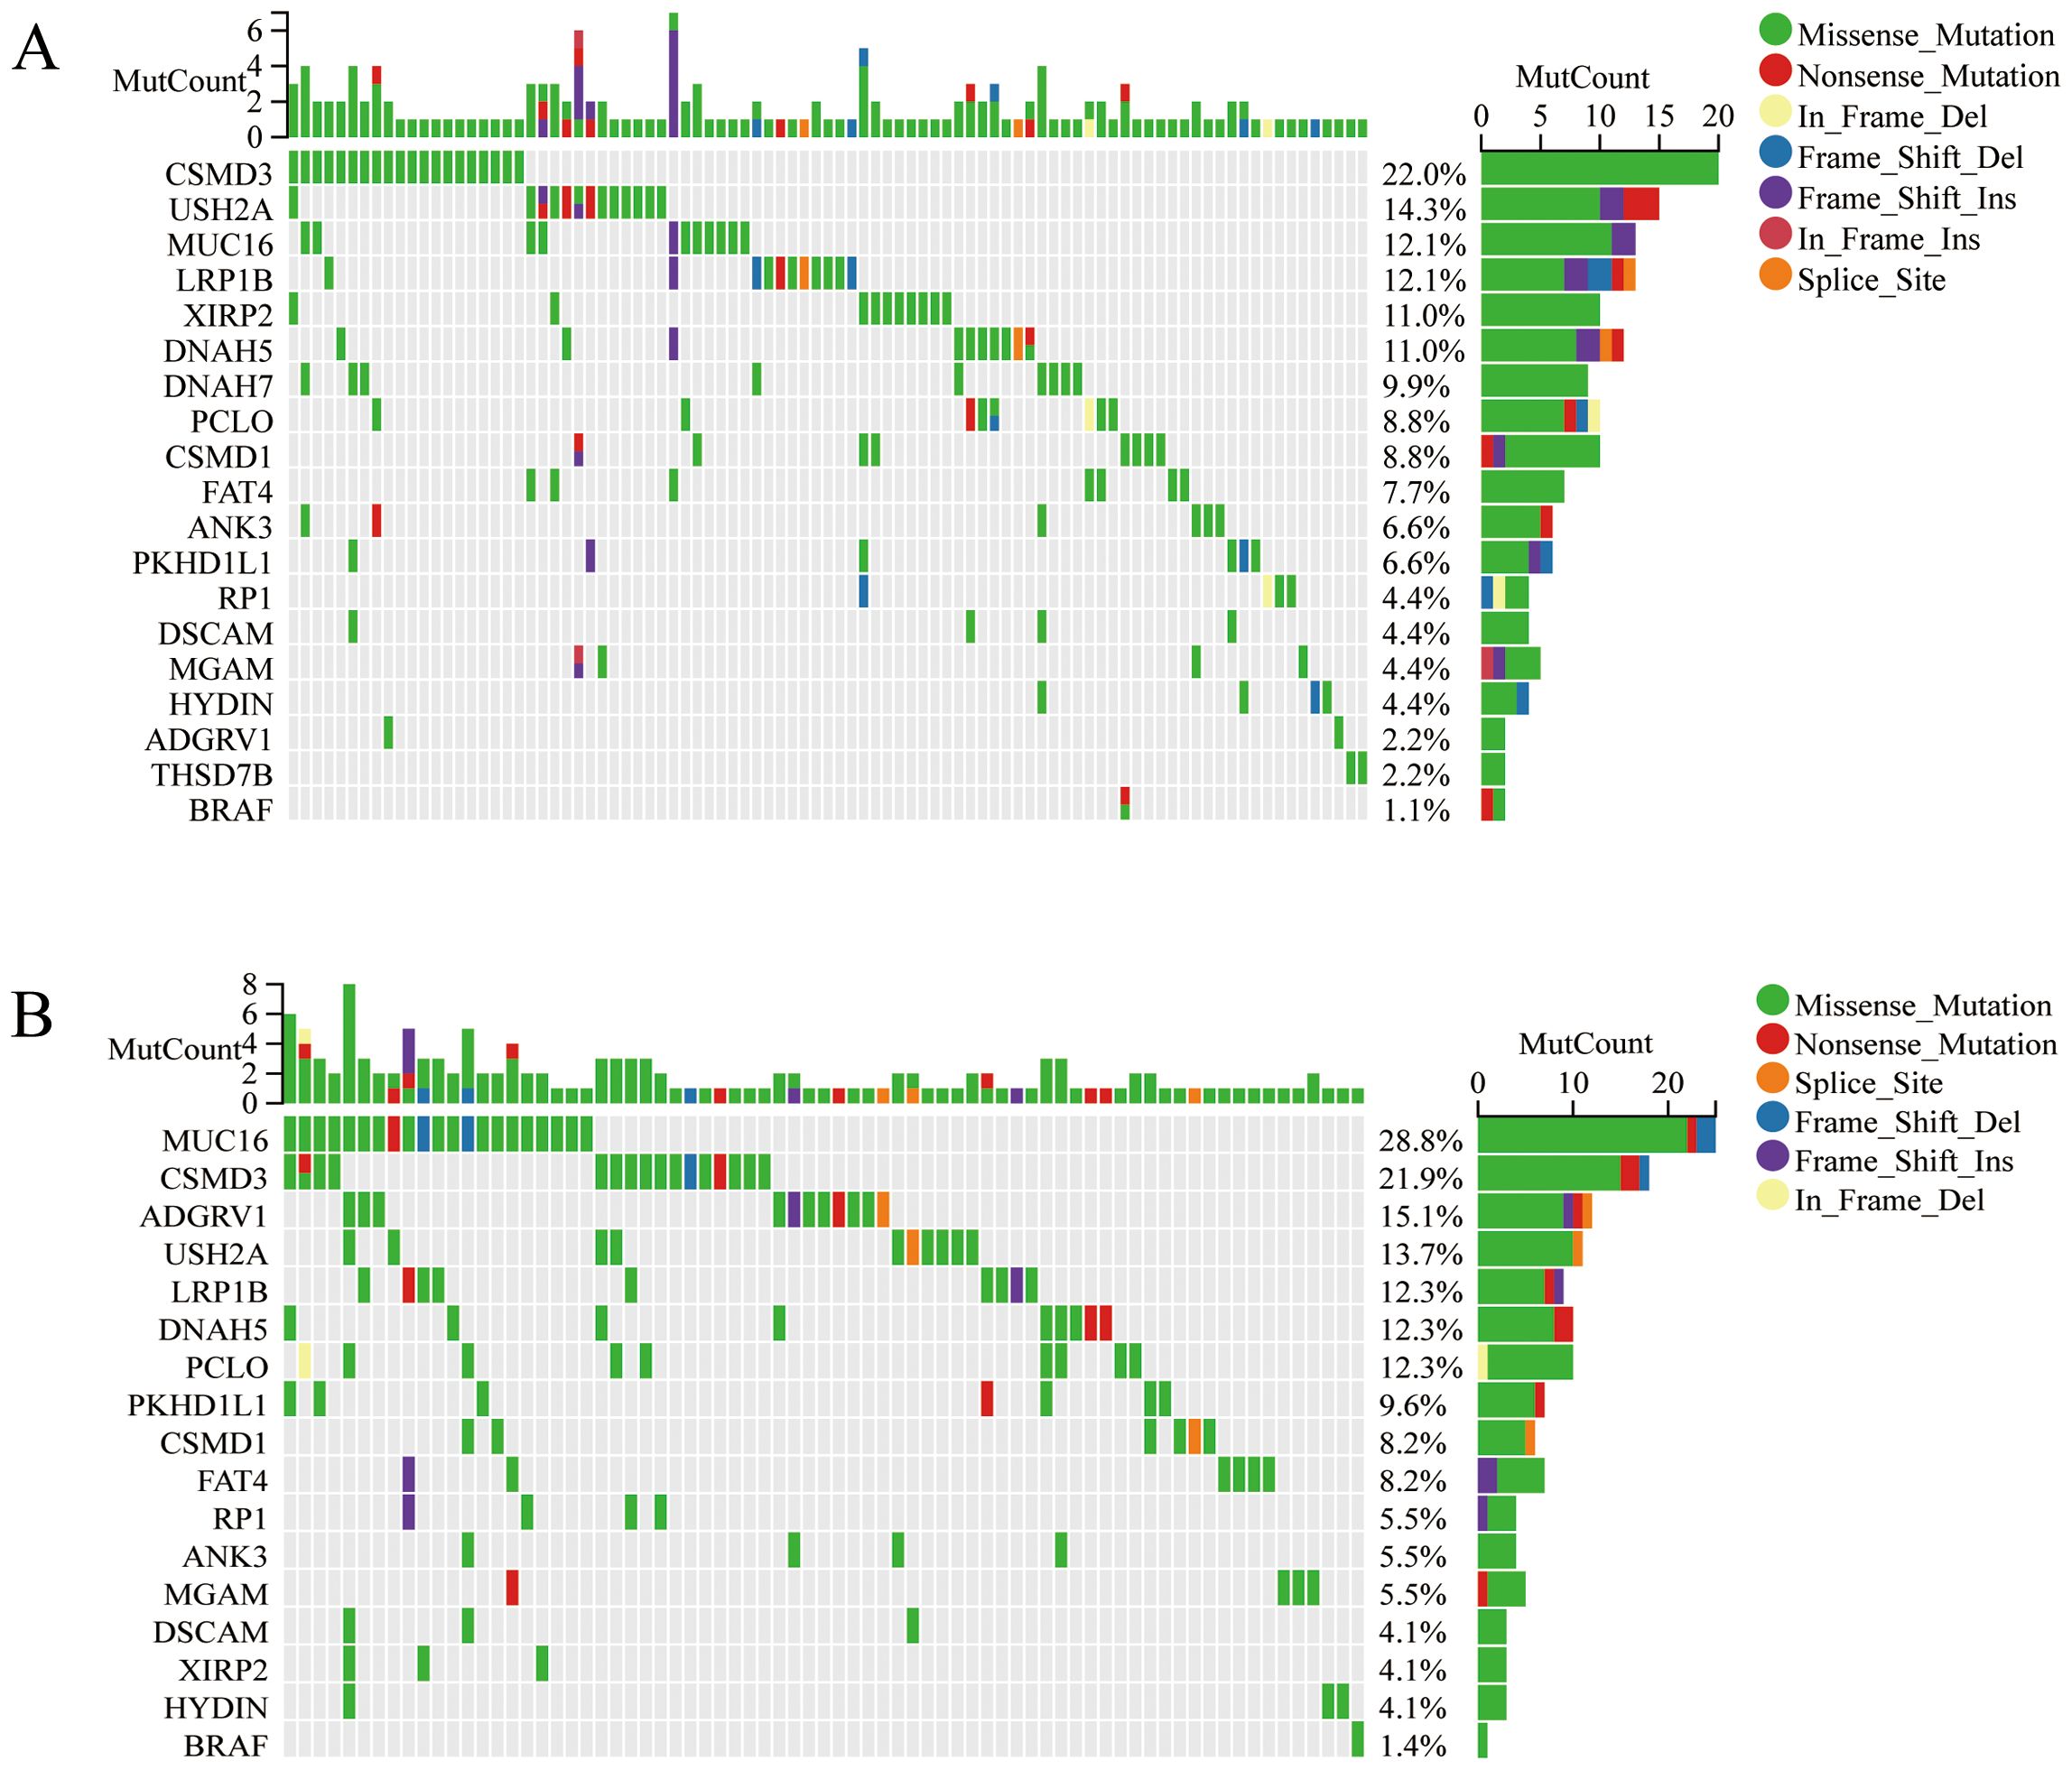
Figure 3. The mutation analysis of two clusters. The waterfall plot shows the top 20 genes with mutation frequency of Cluster1 (A) and Cluster2 (B).
Construction of prognostic model based on prognostic M2-like TAM-related genes
A LASSO analysis was performed to develop a prognostic model, and an 8-M2-like TAM-related gene signature was established (Figures 4A, B). Based on the optimal cut-off of riskscores, the patients were classified into the high and low-risk groups. Kaplan-Meier analysis showed that patients in the high-risk group had a worse prognosis than that in the low-risk group (Figure 4C). Furthermore, GSE140082 was used as the independent cohort and verified the reliability of the prognostic model (Figure 4D). Using the riskscore from our prognostic signature along with other clinicopathological factors, we developed a nomogram to provide a more comprehensive prediction of patient survival (Figure 4E).
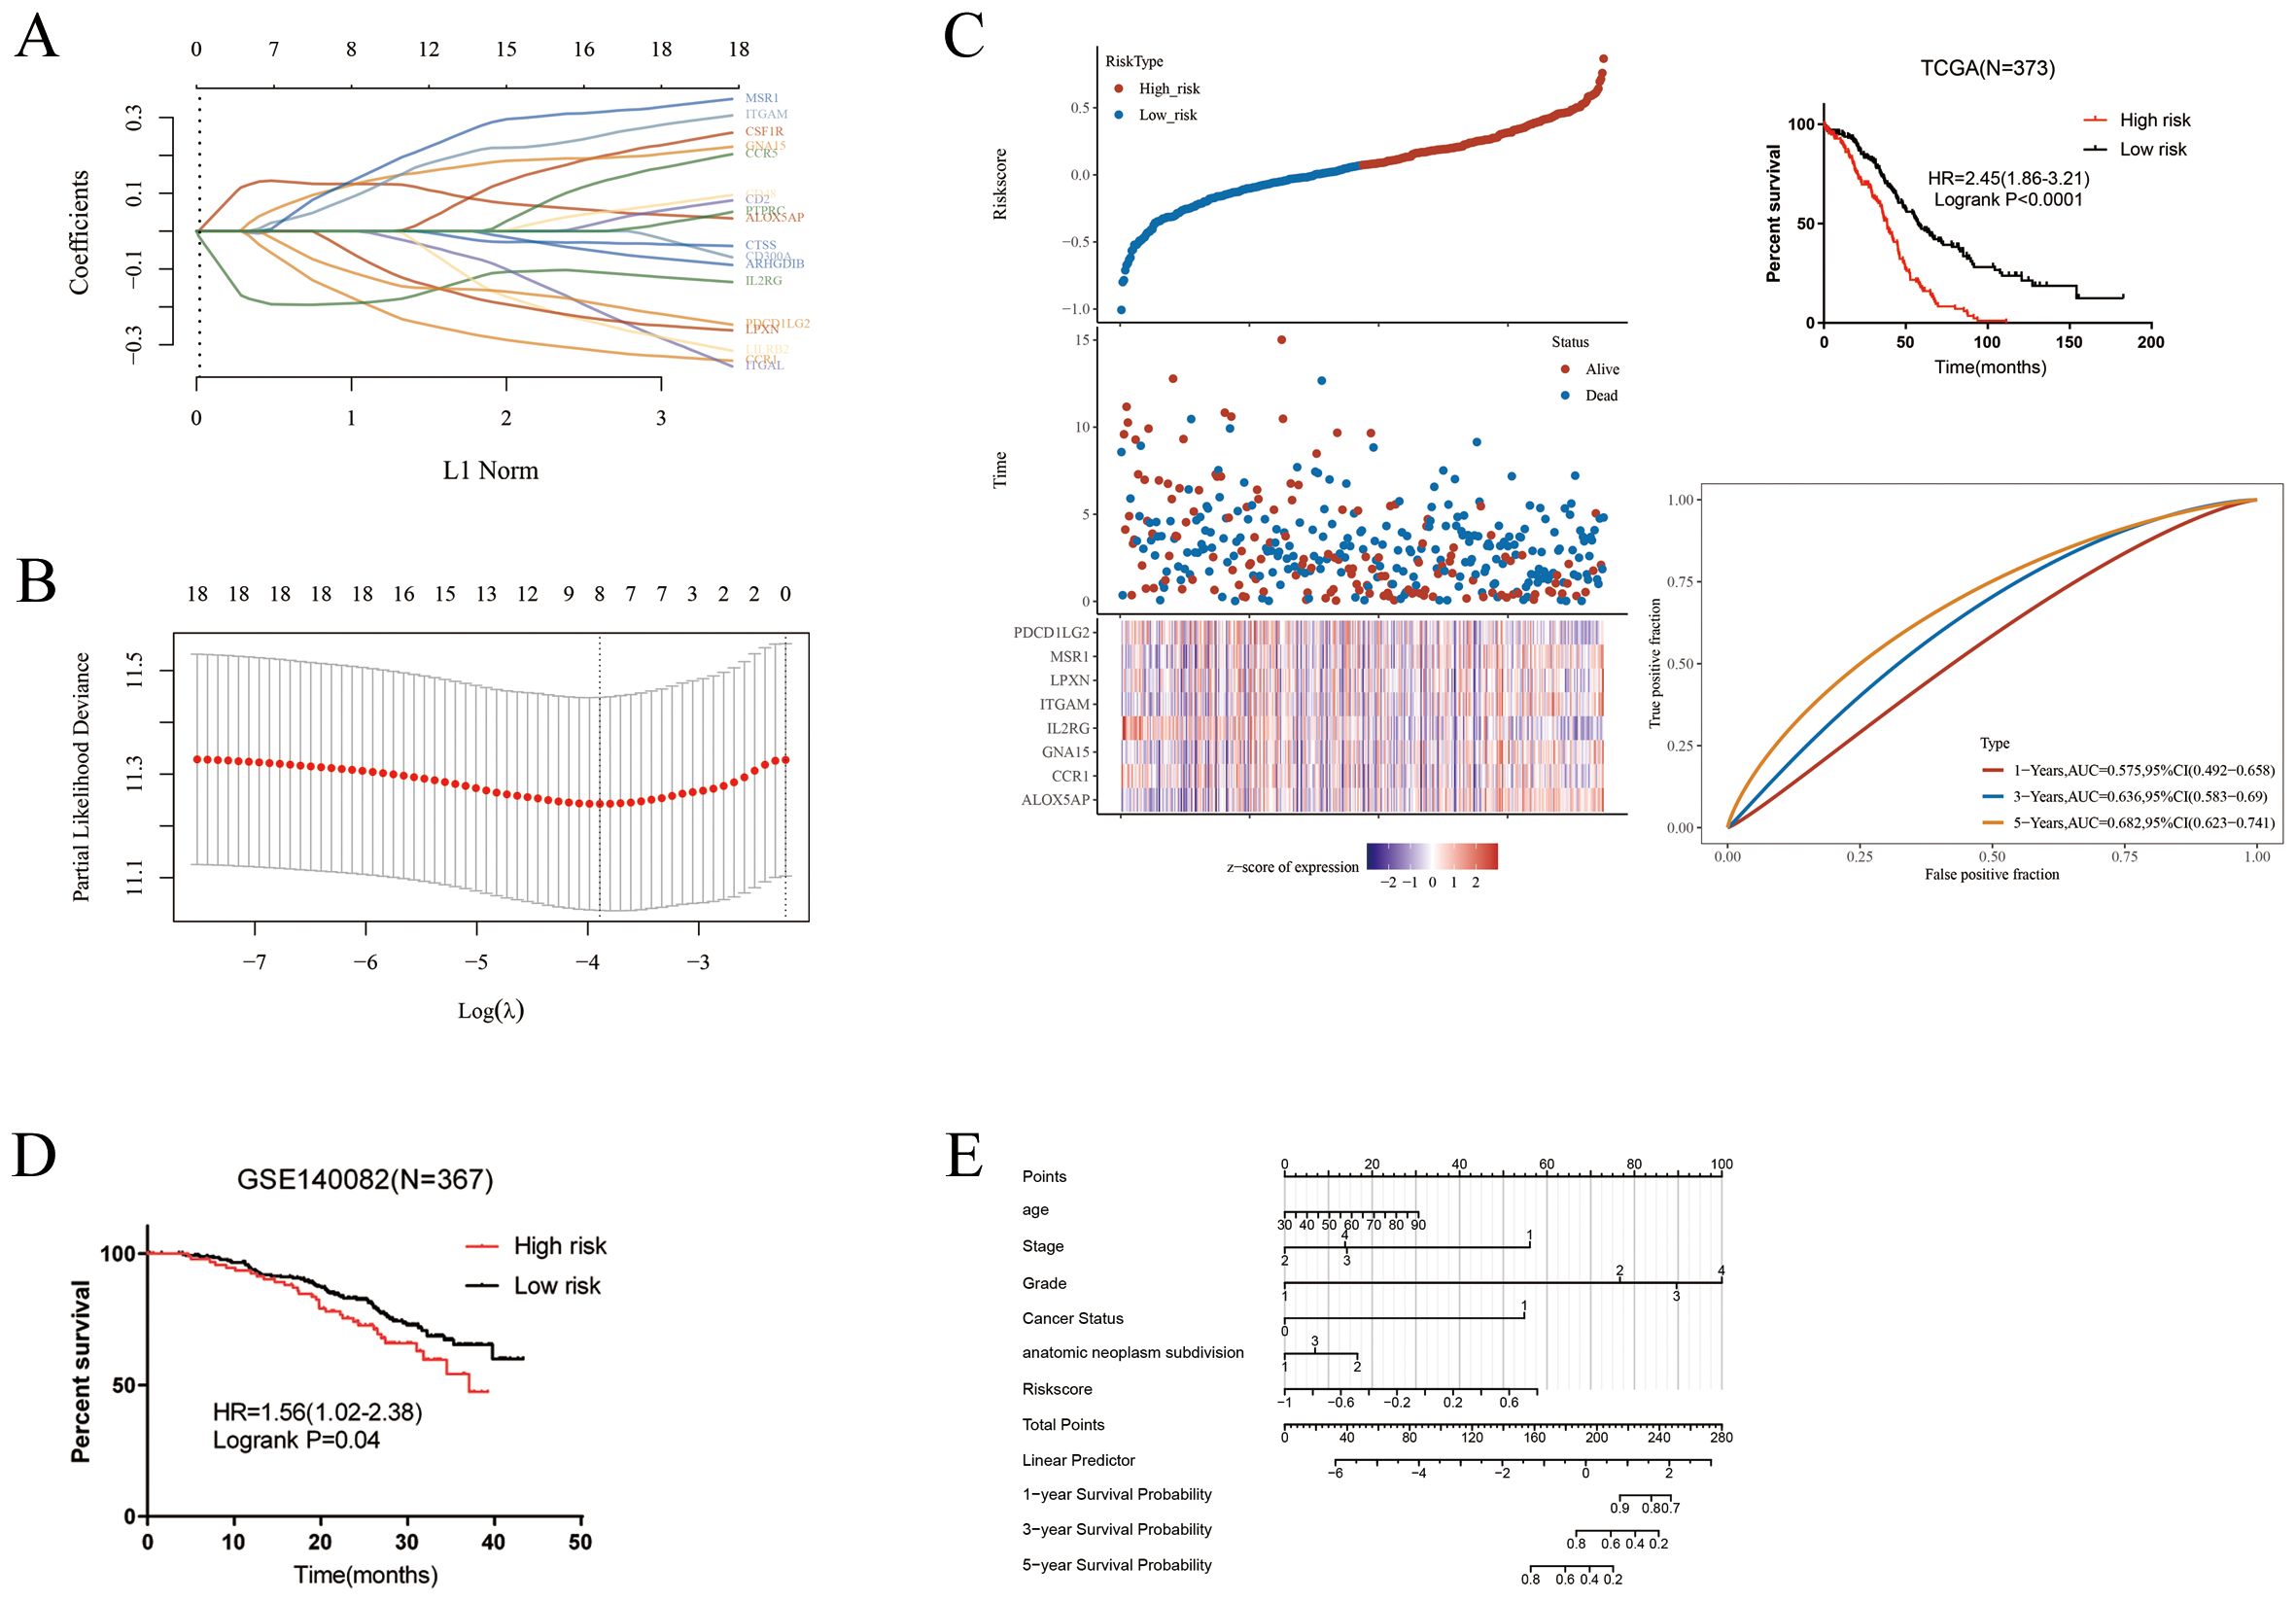
Figure 4. Construction of a risk model. (A–C) LASSO analysis for M2-like TAMs related genes associated with the survival rate of OS. (D) Validation of the prognostic model in GSE140082. (E) Age, Stage, riskscore, grade, cancer status and anatomic neoplasm subdivision were used to construct the nomogram.
High-and low-risk groups exhibit different immune cell infiltration and immune gene expression
To explore the underlying immune-related factors difference between high- and low-risk groups, we compared immune cell infiltration and immune gene expression in the two groups. Compared to the low-risk group, the high-risk group exhibited significantly higher M2-like TAM infiltration (Figure 5A). Accordingly, the low-risk group had marked increased expression of immune checkpoint genes than the high-risk group (Figures 5B, C).
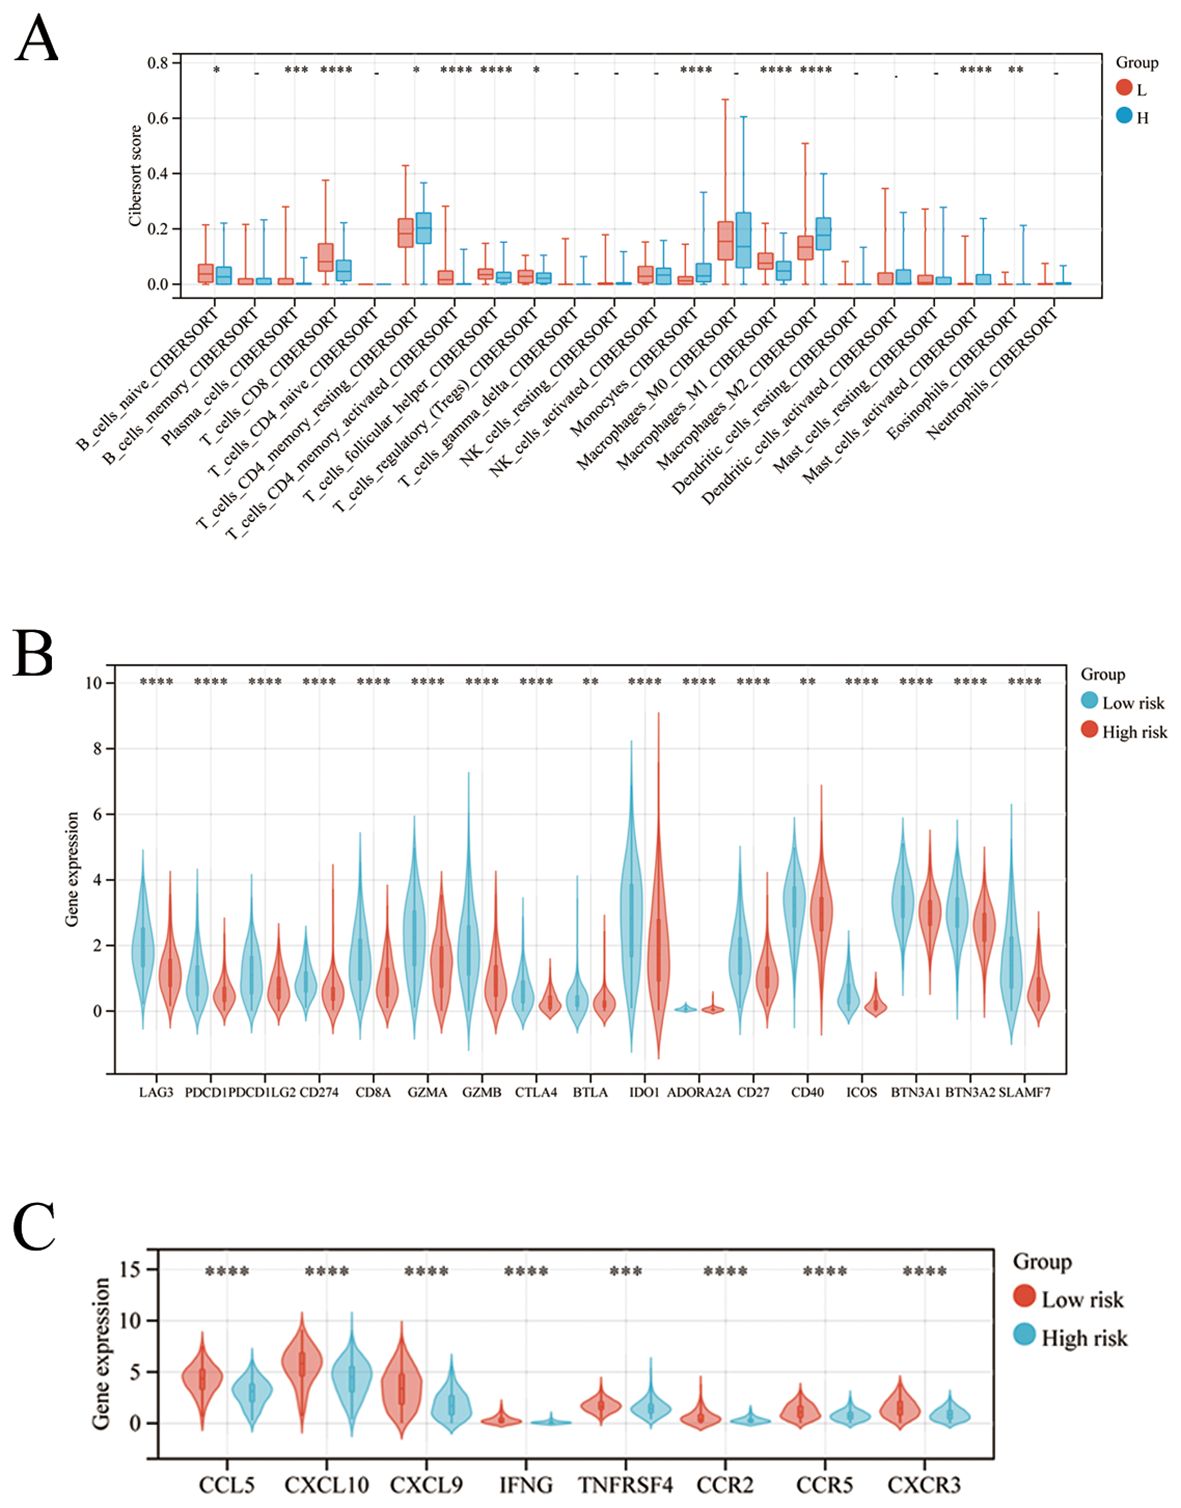
Figure 5. High-and low-risk groups exhibit different immune cell infiltration and immune gene expression. (A–C) The comparison of the immune cells infiltration and expression of immune checkpoint-related genes between the high-and low-risk group. *p < 0.05; **: p < 0.01; *** p < 0.001; ****p < 0.0001.
High GNA15 expression contributes poor OC prognosis
GNA15 was characterized as one of the hub genes most associated with M2-like TAM infiltration in OC, compared to the other genes. In addition, differential gene expression analysis of the GSE33482 database, profiling cisplatin resistance in OC, revealed GNA15 as a differentially expressed gene linked to drug resistance through the intersection of 1598 drug resistance-related DEGs and 18 M2-like TAM-related genes (Figures 6A, B). qRT-PCR confirmed GNA15 upregulation in cisplatin-resistant cells (Figures 6C, D).
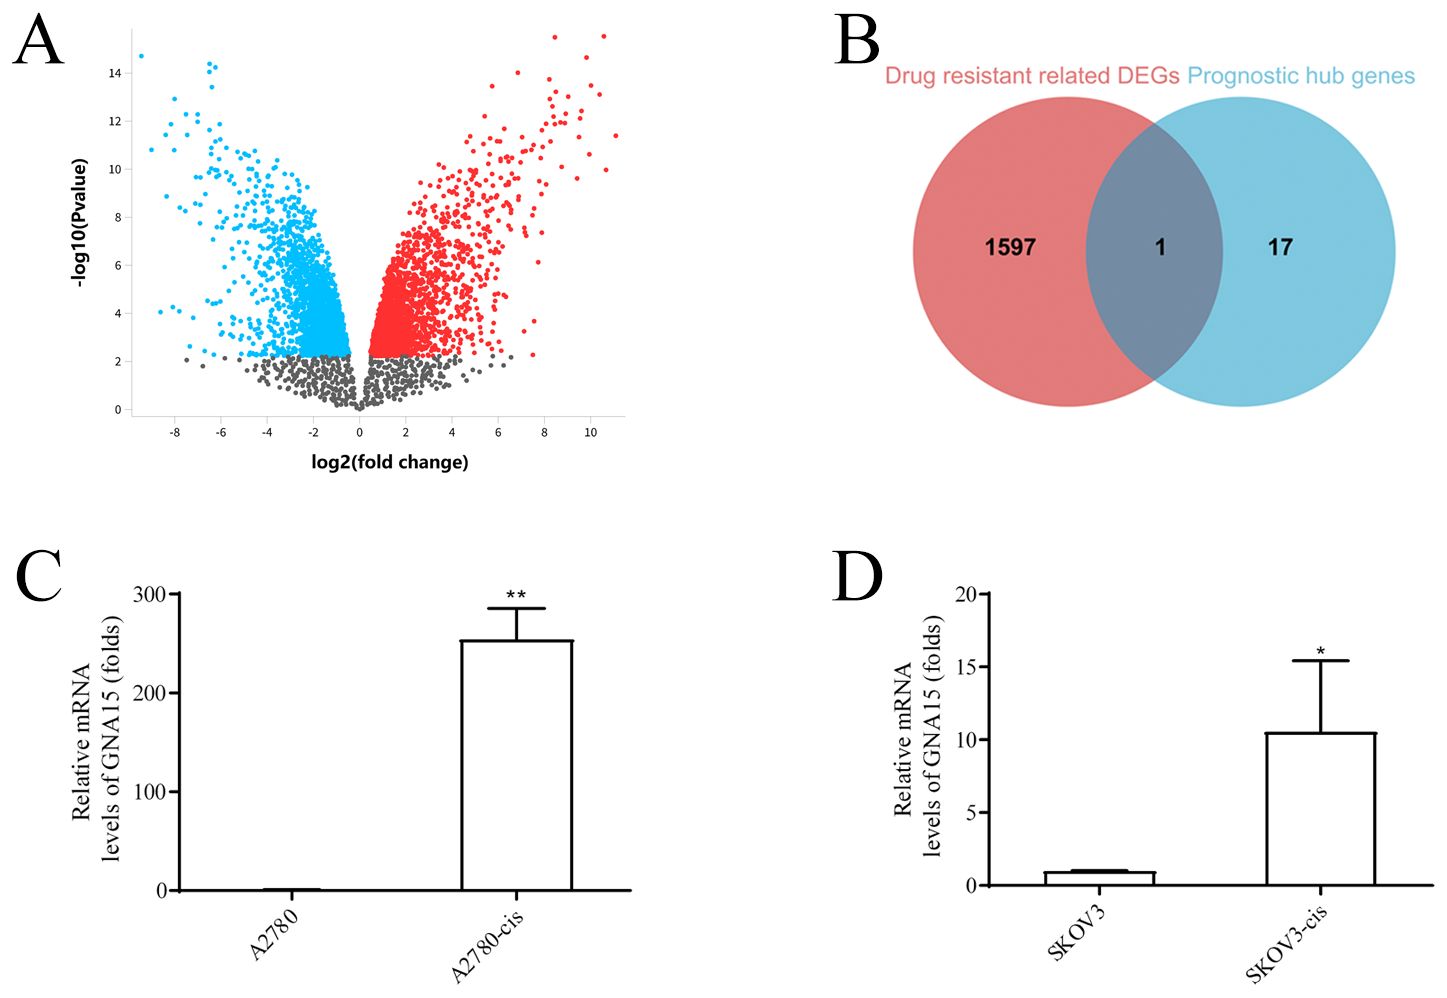
Figure 6. GNA15 is a differentially expressed gene for drug resistance. (A) Differential gene expression analysis on the GSE33482 database, red points represent upregulated genes, and green points represent downregulated genes. (B) The intersection of 1598 drug resistance related DEGs and 18 prognostic M2-like TAM-related genes. (C, D) GNA15 expression between cisplatin-resistant cells of ovarian cancer cell and corresponding OC cells by qRT-PCR analysis. *p < 0.05; **: p < 0.01.
To further investigate the function of GNA15 in OC, we analyzed data from both the TCGA dataset and the GEPIA tool. Our analysis revealed that GNA15 expression was elevated in 10 out of 33 cancer types compared to normal samples (Supplementary Figure S2A). Notably, GNA15 expression was significantly higher in OC than in normal tissues (P<0.0001) (Figure 7A) and exhibited high sensitivity (Figure 7B).
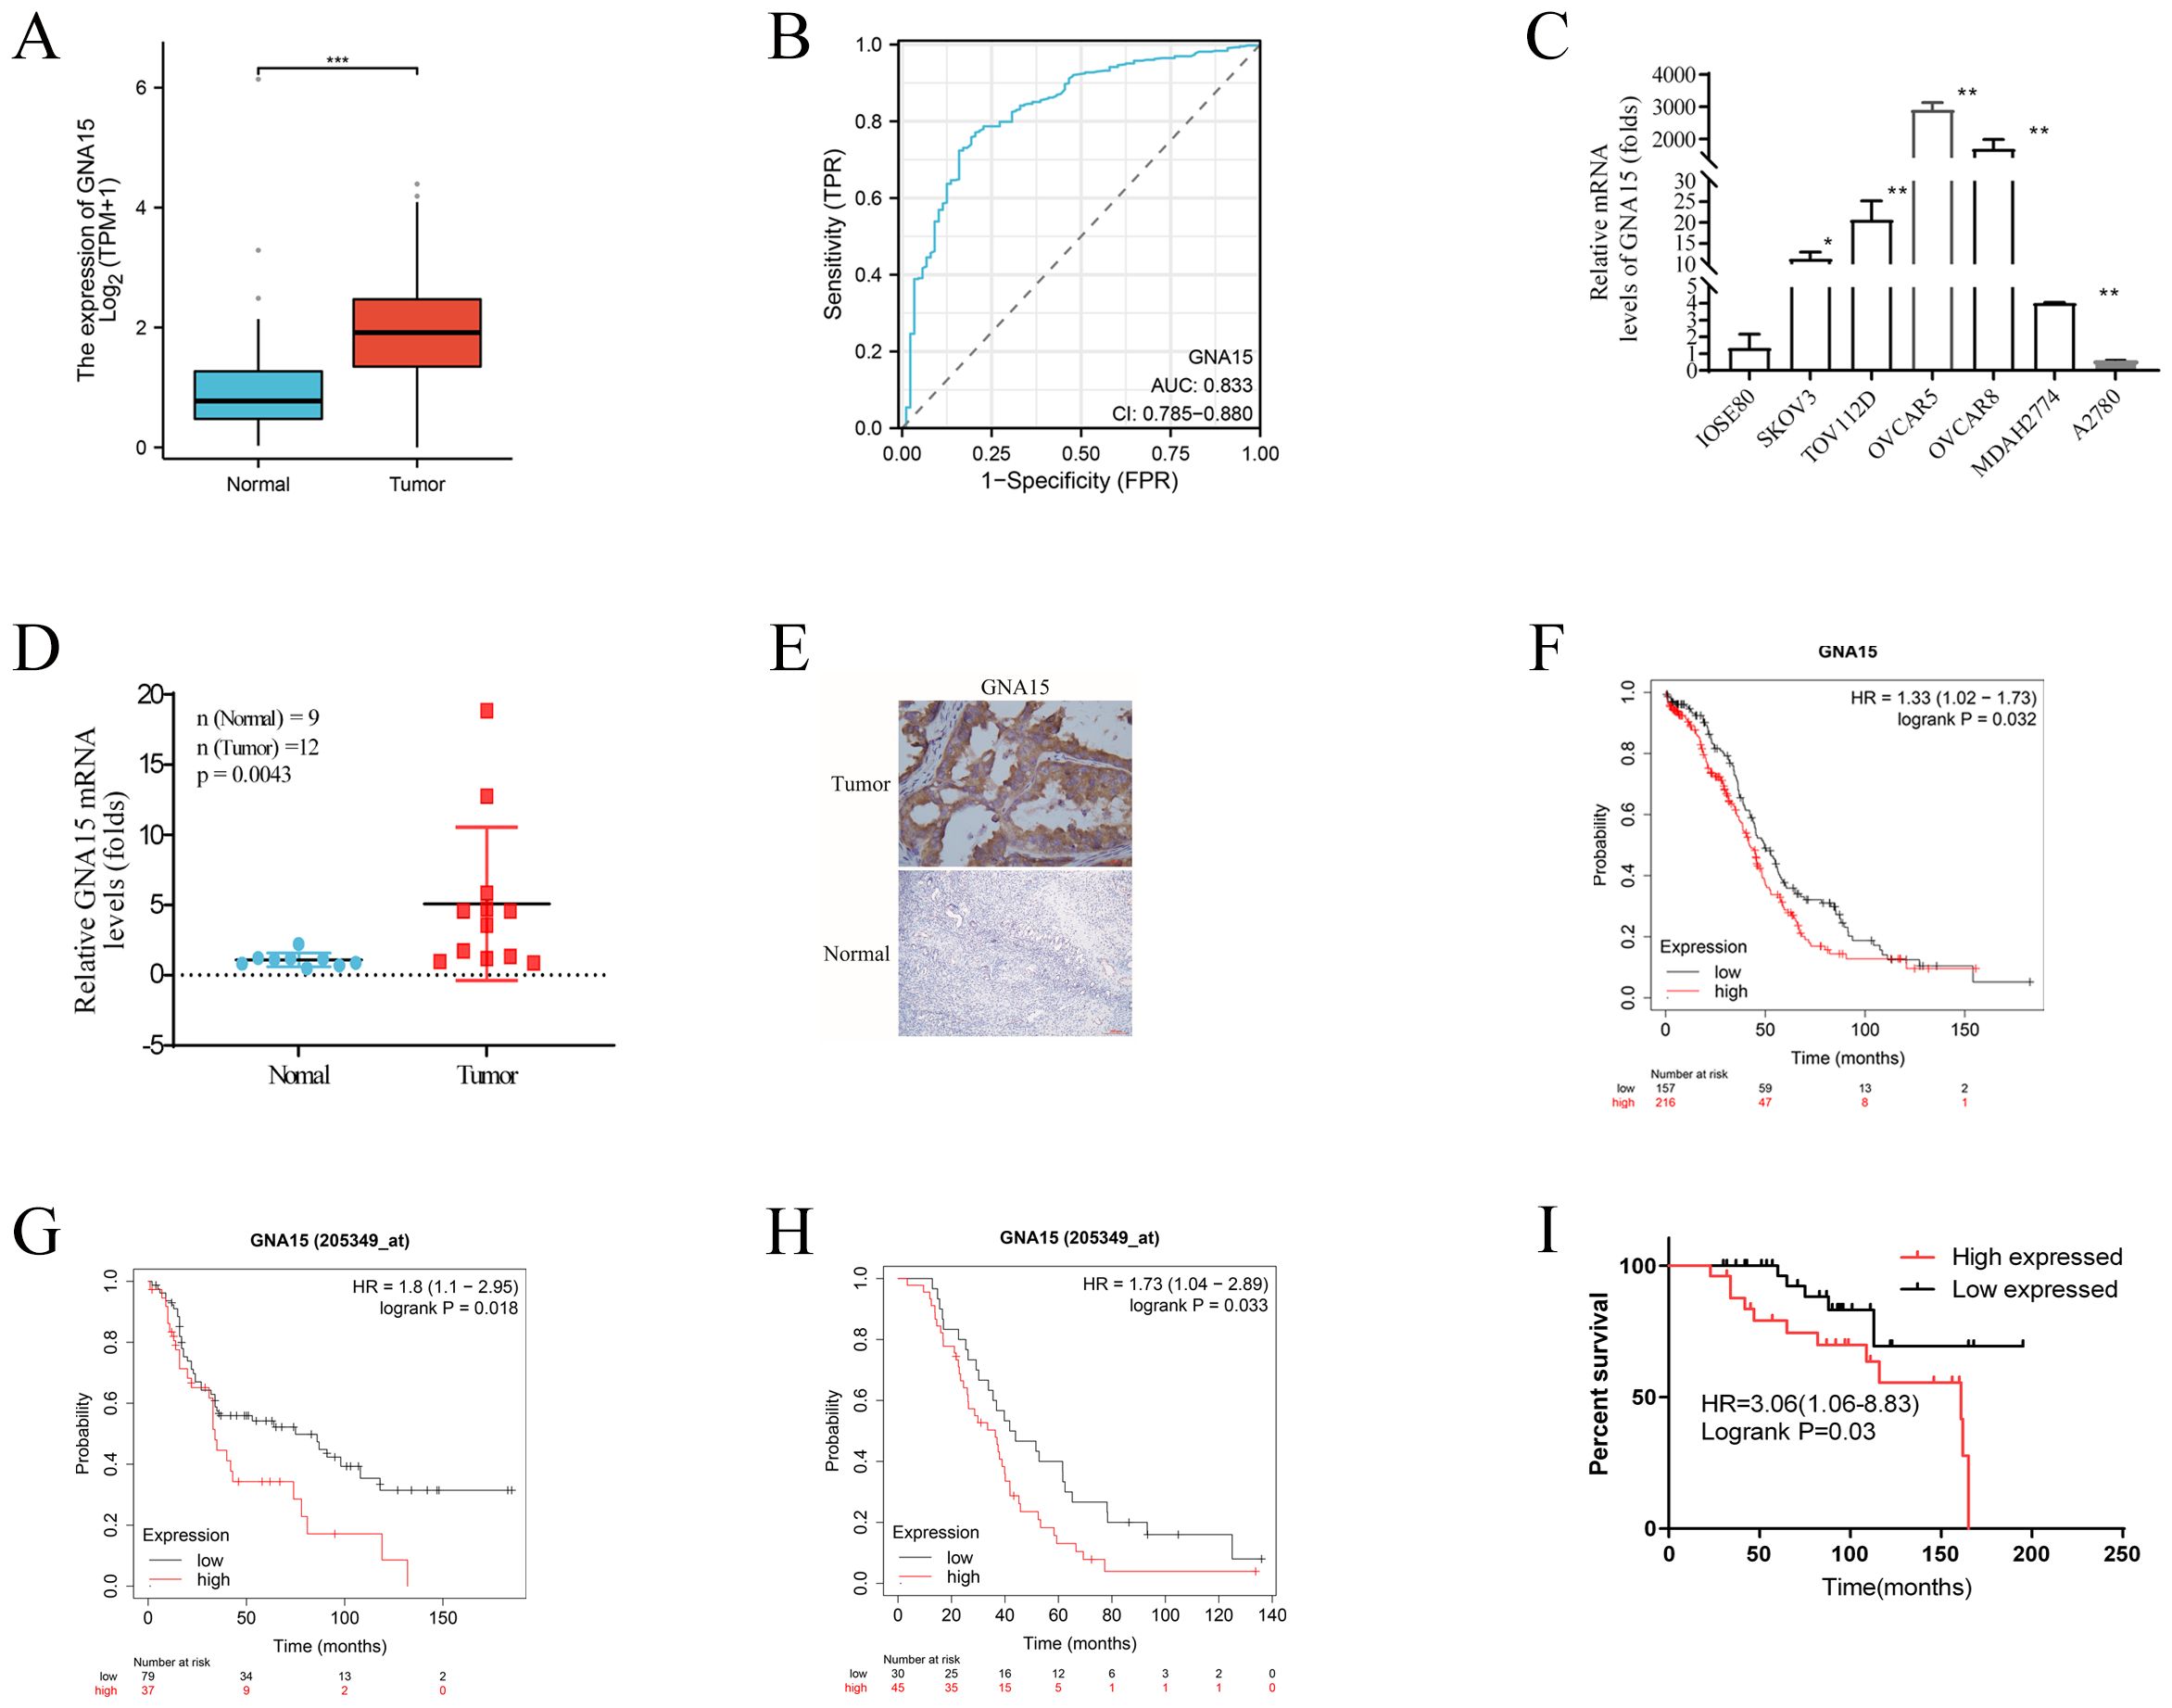
Figure 7. GNA15 expression in normal and cancer tissues. (A) RNA-Seq analysis using TCGA-OV samples and matched normal control samples from the GTEx project. (B) ROC analysis of GNA15 expression for the discrimination between OC and normal controls using TCGA-OC samples and matched normal control samples from the GTEx project. (C) qRT-PCR analysis using OC cells and normal ovarian cells. (D) qRT-PCR analysis using clinical OC and normal control samples. (E) IHC was performed to detect the expression of GNA15 in OC and normal tissues. (F–I) Survival analysis comparing the high and low expression of GNA15 in OC patients based on TCGA-OC database, GSE3149, GSE63885 and our clinical samples. *p < 0.05; **: p < 0.01; *** p < 0.001.
To further verify the results, qRT-PCR and Immunohistochemistry (IHC) assay were used to test GNA15 expression in tumor cell lines and clinical tumor samples including 12 OC and 9 normal control tissues (fresh tissue frozen in liquid nitrogen), and 60 OC samples (the median age of these patients was 52 years and the median follow-up duration for the cohort was 92 months) and 30 normal ovarian samples (paraffin embedded) (Figures 7C–E). Consistent with the result from TCGA dataset and GEPIA tool, our results demonstrated that GNA15 was highly expressed in OC than normal samples (P<0.05), indicating that GNA15 might have potential functions in carcinogenesis.
The prognostic role of GNA15 was explored based on TCGA-OC database and our clinical samples. The results showed that high GNA15 expression was associated with worse OS [HR=1.33 (1.02-1.74), P=0.03] in TCGA-OC database (Figure 7F). In addition, we assessed another two OC datasets from GEO database (GSE3149, and GSE63885) to validate the prognostic role of GNA15. Similarly, the results showed high GNA15 expression was associated with worse OS [HR=1.8(1.1-2.95), P=0.018] and [HR=1.73 (1.04-2.89), P=0.03], respectively (Figures 7G, H). While in our clinical samples, GNA15 showed a consistent effect in prognosis, elevated GNA15 expression was significantly correlated with a poor prognosis in OC [HR=3.06 (1.06-8.83), P=0.03] (Figure 7I).
The relationship between GNA15 and macrophage polarization
In this study, we found a strong correlation between GNA15 and M2 macrophage infiltration abundances using the CIBERSORT algorithm (Spearman r=0.609, P<0.001, Supplementary Figure S3A). In addition, we investigated the relationship between GNA15 and M2 macrophage biomarkers (MS4A4A, CD163, and VSIG4), demonstrating that elevated GNA15 expression was positively associated with M2 macrophage polarization (Supplementary Figures S3B–D). Further, in our clinical samples, we found GNA15 expression was positively related to CD163 expression (Supplementary Figure S3E), which suggest GNA15 may related to macrophage polarization.
Enrichment analysis and tumor heterogeneity analysis of GNA15 expression
Gene set enrichment analysis (GSEA) was performed to explore pathway enrichment between high and low GNA15 expression group. The results showed that immune-associated pathways were more enriched in the high GNA15 expression group, including Chemokine signaling pathway, Leukocyte transendothelial migration, Lysosome, Natural killer, B cell receptor signaling pathway and FcγR mediated phagocytosis (Supplementary Figure S4A). The results demonstrated that GNA15 is associated with immune-regulation in tumor microenvironment of OC.
Next, we explored the association between GNA15 expression and tumor heterogeneity. The results demonstrated that GNA15 expression showed a remarkably positive relation with LOH and TMB, while a negative relation with purity (Supplementary Figures S4B–D).
Down-regulating GNA15 in vitro decreased OC cell proliferation
To determine whether GNA15 plays an important role in cell proliferation, GNA15 was knocked down in OVCAR5 and OVCAR8 using ShRNA and CRISRP-Cas9 (Figure 8A). Our data showed that down-regulating GNA15 significantly decreased ovarian cancer cell proliferation (P < 0.0001) (Figure 8B).
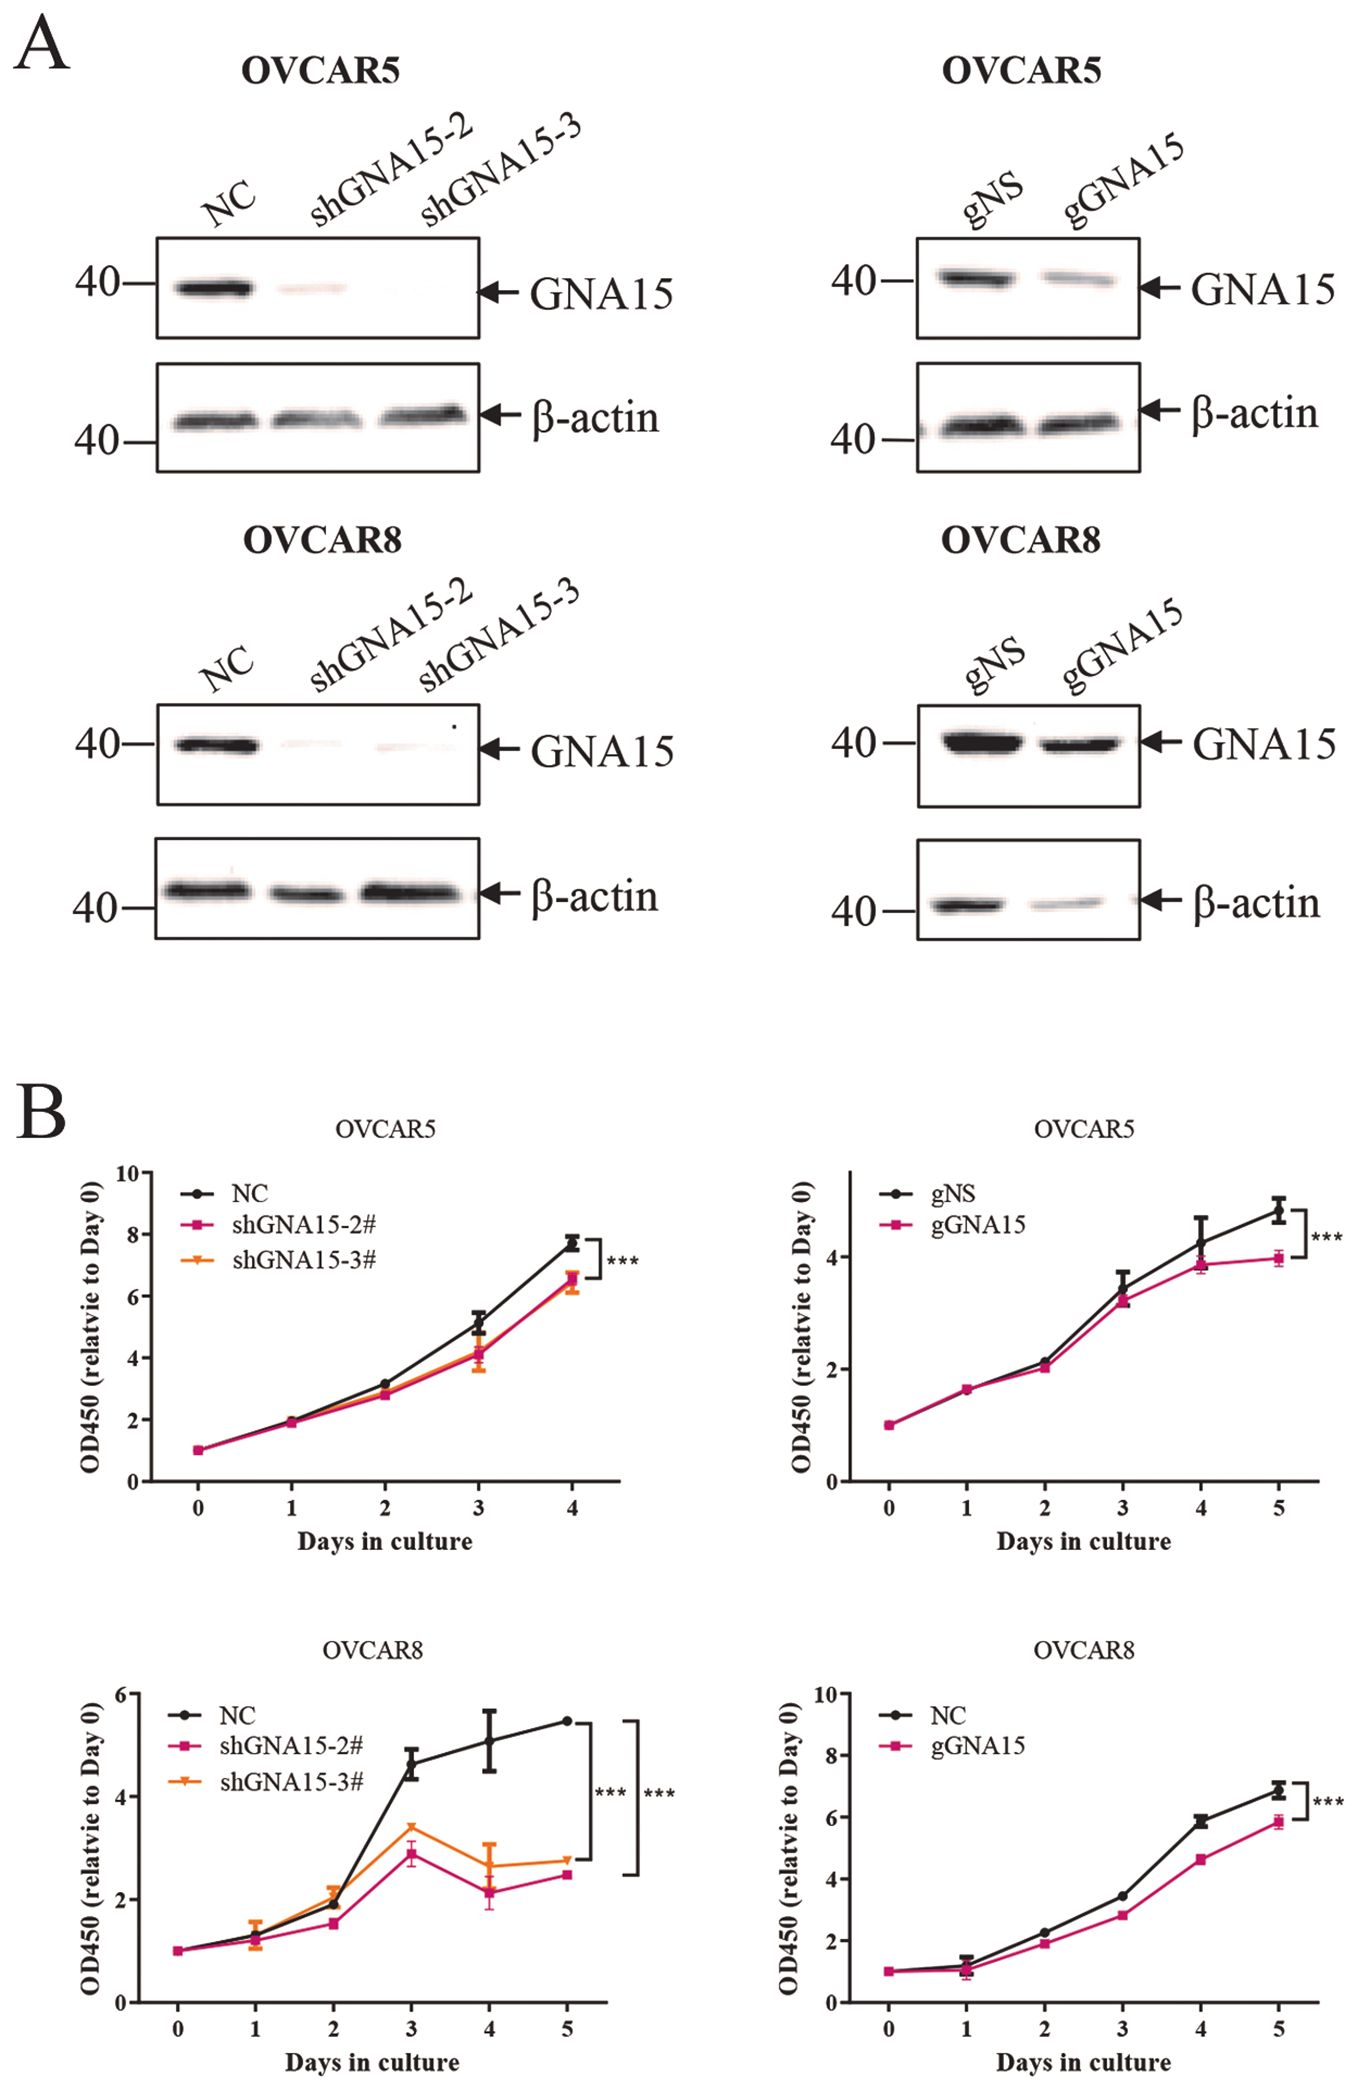
Figure 8. Down-regulating GNA15 in vitro decreased ovarian cancer cell proliferation. (A) knock down of GNA15 in OVCAR5 and OVCAR8 using ShRNA and CRISRP-Cas9. (B) Down-regulating GNA15 significantly decreased ovarian cancer cell proliferation. The protein data were normalized to β-actin. *** p < 0.001.
Discussion
In the OC microenvironment, TAMs typically adopt an M2-like phenotype, promoting tumor progression by suppressing antitumor immunity and facilitating invasion and metastasis through cytokine and chemokine secretion (28–30). Moreover, TAMs are implicated in OC chemoresistance, as evidenced by their ability to polarize M1-like to M2-like phenotypes upon exposure to cisplatin or carboplatin (31). Therefore, identifying biomarkers associated with M2-like TAMs polarization shows potential for OC treatment strategies. In the present study, we constructed a prognostic model for OC based on an M2-like TAMs gene signature and highlights the initial role of GNA15 in M2-like TAMs polarization. We found: 1) a positive correlation between GNA15 expression and M2-like TAMs infiltration; 2) GNA15 as a predictor of poor prognosis in OC across multiple patient cohorts.
Initially, we employed CIBERSORT (32) to quantify M2-like TAMs infiltration in the TCGA-OC dataset, confirming that high M2-TAMs levels correlate with poorer prognosis in OC. Given M2-like TAMs’ critical roles in prognosis, TME immune modulation, and drug resistance in OC, we conducted a comprehensive analysis. Using WGCNA, we identified genes associated with M2-like TAMs in OC and performed consensus clustering based on 18 prognostic genes. Cluster2 exhibited significantly worse outcomes than Cluster1, with enrichment in pathways such as Fcγ-mediated phagocytosis, Toll-like receptor signaling, B cell receptor signaling, Nod-like receptor signaling, and cancer-related pathways. These pathways are typically associated with unfavorable clinical outcomes. For example, Toll-like receptor activation can promote tumor cell proliferation, inhibit apoptosis (33), and enhance invasion and migration (34), while Fcγ receptors can dampen the efficacy of PD-1 antibodies (35). NOD-like receptor thermal protein domain associated protein 3 (NLRP3)-mediated immune checkpoint regulation also contributes to immune escape in cancers like liver hepatocellular carcinoma and OC, correlating with worse overall survival (36). Immune cell infiltration analysis revealed significantly higher M2 macrophage levels in Cluster2 compared to Cluster1.
Next, we developed an 8-gene signature related to M2-like TAMs. To validate our prognostic model, multivariate regression confirmed the riskscore as an independent prognostic factor in OC. Validation using the GSE140082 dataset further supported the reliability of our signature. Notably, the low-risk group exhibited reduced M2-like TAM infiltration but higher expression of immune checkpoint genes compared to the high-risk group, indicating potential implications for immunotherapy response in OC. Immunotherapy in OC faces challenges due to the immunosuppressive tumor microenvironment, which includes regulatory T cells (Tregs), myeloid-derived suppressor cells (MDSCs), and TAMs. To improve immunotherapy outcomes, identifying TAM-related biomarkers using multi-omics approaches is essential for understanding the immune landscape of OC and developing personalized treatment strategies.
To identify the functions of biomarkers associated with OS and M2-like TAMs infiltration in the OC microenvironment, we investigated 18 prognostic genes intersecting with drug resistance data from GSE33482. We found GNA15 is significantly upregulated in platinum-resistant OC cell lines (A2780-Cis, SKVO3-Cis) and was highly expressed in OC, correlating with poor OS in both TCGA-OC and clinical samples. The following findings highlight the diverse roles of GNA15 across different cellular pathways. It is reported that GNA15 was involved in multiple tumor types by promoting cellular proliferation and inhibiting cellular apoptosis, including liver cancer, pancreatic adenocarcinoma, acute myeloid leukemia, and OC (17–21, 37, 38).
Exploring the role of GNA15 in OC, we confirmed its high expression in OC cells and tissues, consistent with bioinformatics analyses linking GNA15 to poor clinical outcomes. In vitro studies demonstrated that knockdown of GNA15 reduced proliferation in OVCAR5 and OVCAR8 cells, suggesting its involvement in OC progression. Existing literature reported that GNA15 is expressed in all myeloid cell lines, suggesting that it may be involved in the regulation of hematopoietic cell differentiation and function (39). Another study reported that GNA demonstrated a high correlation with all identified immune cell subtypes in the ssGSEA algorithm (40). In our study, GSEA analysis revealed enrichment of immune-related pathways, such as the chemokine signaling and FcγR-mediated phagocytosis pathways, in OC samples with high GNA15 expression. Our research has revealed that GNA15 may promote carcinogenesis in OC by modulating TME and enhancing tumor cell proliferation. Specifically, we observed increased infiltration of M2-like TAMs, a key immunosuppressive cell type in the tumor microenvironment, validated by CIBERSORT analysis and confirmed with CD163 immunohistochemical staining (P<0.001). There have also been investigations into the role of GNA15 in regulating cell function. For example, GNA15 downregulation inhibits cell proliferation through the P38 MAPK pathway, a critical regulator of cell survival and growth (21). Moreover, GNA15 has been implicated in the regulation of exosome function, which plays a pivotal role in cell-to-cell communication and shaping the immune microenvironment (22). These findings suggest GNA15 acts as an immunosuppressive factor in OC, potentially influencing M2-like TAM polarization and serving as a prognostic marker.
Conclusions
Our study has established a prognostic model based on M2-like TAMs to predict survival rates in OC patients, offering valuable insights into the molecular underpinnings of disease progression. Furthermore, we have identified and investigated the potential role of GNA15 within OC cells and the TME, suggesting GNA15 may play a crucial role in immune cell infiltration, macrophage polarization, and tumor progression. This understanding could not only reveal new biomarkers for prognosis but also offer innovative therapeutic targets for immune-based treatments in OC. Moving forward, it is imperative to conduct additional animal experiments and mechanistic studies to elucidate how GNA15 influences macrophage transformation within the OC microenvironment. These endeavors will furnish more robust insights that can be translated into clinical applications.
Data availability statement
Publicly available datasets were analyzed in this study. This data can be found here: https://portal.gdc.cancer.gov/ and https://www.ncbi.nlm.nih.gov/geo/.
Ethics statement
Approval of the research protocol by an institutional review board: All procedures performed in studies involving human participants were in accordance with the standards upheld by the Ethics Committee of Women’s Hospital Zhejiang University School of Medicine (No.IRB-20200227-R). The studies were conducted in accordance with the local legislation and institutional requirements. The participants provided their written informed consent to participate in this study.
Author contributions
QL: Writing – original draft. YS: Writing – original draft. TZ: Formal analysis, Writing – original draft. WL: Writing – review & editing. JZ: Writing – review & editing. HZ: Writing – review & editing. WZ: Writing – review & editing, Supervision. HX: Supervision, Writing – review & editing. FZ: Supervision, Writing – review & editing.
Funding
The author(s) declare that no financial support was received for the research, authorship, and/or publication of this article.
Conflict of interest
The authors declare that the research was conducted in the absence of any commercial or financial relationships that could be construed as a potential conflict of interest.
Generative AI statement
The author(s) declare that no Generative AI was used in the creation of this manuscript.
Publisher’s note
All claims expressed in this article are solely those of the authors and do not necessarily represent those of their affiliated organizations, or those of the publisher, the editors and the reviewers. Any product that may be evaluated in this article, or claim that may be made by its manufacturer, is not guaranteed or endorsed by the publisher.
Supplementary material
The Supplementary Material for this article can be found online at: https://www.frontiersin.org/articles/10.3389/fimmu.2025.1512086/full#supplementary-material
Supplementary Figure 1 | Identification of prognostic M2-like TAMs related genes by WGCNA. (A) Samples were clustered and outlier samples were not found. (B, C) According to the instructions of the WGCNA package, 5 was selected as the soft threshold power. (D, E) Correlation analysis of modules with traits yielded 31 non-gray modules.
Supplementary Figure 2 | GNA15 expression in normal and cancer tissues. Comparison of GNA15 mRNA levels across 33 TCGA cancer types and matched normal controls using GEPIA.
Supplementary Figure 3 | Correlation of GNA15 expression and M2 macrophages polarization. (A) Purity‐corrected Spearman’s correlation between GNA15 expression in OC and M2 macrophages infiltration. (B-D) The correlation between GNA15 and molecular biomarkers of M2 macrophages. (E) GNA15 expression was positively related to CD163 expression by IHC.
Supplementary Figure 4 | The gene enrichment analysis of GNA15 in OC. (A) GSEA analysis in GNA15 high and low expressed samples. (B-D) Correlation of GNA15 expression and LOH (B), Purity (C), TMB (D).
References
1. Siegel RL, Miller KD, Fuchs HE, Jemal A. Cancer statistics, 2021. CA: Cancer J Clin. (2021) 71:7–33. doi: 10.3322/caac.21654
2. Lheureux S, Gourley C, Vergote I, Oza AM. Epithelial ovarian cancer. Lancet (London England). (2019) 393:1240–53. doi: 10.1016/S0140-6736(18)32552-2
3. Yang K, Li Z, Chen Y, Yin F, Ji X, Zhou J, et al. Na, K-ATPase α1 cooperates with its endogenous ligand to reprogram immune microenvironment of lung carcinoma and promotes immune escape. Sci Advances. (2023) 9:eade5393. doi: 10.1126/sciadv.ade5393
4. Deng Y, Fu Y, Chua SL, Khoo BL. Biofilm potentiates cancer-promoting effects of tumor-associated macrophages in a 3D multi-faceted tumor model. Small (Weinheim An Der Bergstrasse Germany). (2023) 19:e2205904. doi: 10.1002/smll.202205904
5. Trefny MP, Kirchhammer N, Auf der Maur P, Natoli M, Schmid D, Germann M, et al. Deletion of SNX9 alleviates CD8 T cell exhaustion for effective cellular cancer immunotherapy. Nat Commun. (2023) 14:86. doi: 10.1038/s41467-022-35583-w
6. Zhang A, Miao K, Sun H, Deng CX. Tumor heterogeneity reshapes the tumor microenvironment to influence drug resistance. Int J Biol Sci. (2022) 18:3019–33. doi: 10.7150/ijbs.72534
7. Tsunokake J, Fujishima F, Watanabe H, Sato I, Miura K, Sakamoto K, et al. Tumor microenvironment in mixed neuroendocrine non-neuroendocrine neoplasms: interaction between tumors and immune cells, and potential effects of neuroendocrine differentiation on the tumor microenvironment. Cancers. (2022) 14. doi: 10.3390/cancers14092152
8. Codony-Servat J, Rosell R. Cancer stem cells and immunoresistance: clinical implications and solutions. Transl Lung Cancer Res. (2015) 4:689–703. doi: 10.3978/j.issn.22186751.2015.12.11
9. Li C, Xu X, Wei S, Jiang P, Xue L, Wang J. Tumor-associated macrophages: potential therapeutic strategies and future prospects in cancer. J Immunother Cancer. (2021) 9. doi: 10.1136/jitc-2020-001341
10. Boutilier AJ, Elsawa SF. Macrophage polarization states in the tumor microenvironment. Int J Mol Sci. (2021) 22. doi: 10.3390/ijms22136995
11. Sumitomo R, Hirai T, Fujita M, Murakami H, Otake Y, Huang CL. M2 tumor-associated macrophages promote tumor progression in non-small-cell lung cancer. Exp Ther Med. (2019) 18:4490–8. doi: 10.3892/etm.2019.8068
12. Marchesi F, Cirillo M, Bianchi A, Gately M, Olimpieri OM, Cerchiara E, et al. High density of CD68+/CD163+ tumour-associated macrophages (M2-TAM) at diagnosis is significantly correlated to unfavorable prognostic factors and to poor clinical outcomes in patients with diffuse large B-cell lymphoma. Hematological Oncol. (2015) 33:110–2. doi: 10.1002/hon.v33.2
13. Fu LQ, Du WL, Cai MH, Yao JY, Zhao YY, Mou XZ. The roles of tumor-associated macrophages in tumor angiogenesis and metastasis. Cell Immunol. (2020) 353:104119. doi: 10.1016/j.cellimm.2020.104119
14. Dallavalasa S, Beeraka NM, Basavaraju CG, Tulimilli SV, Sadhu SP, Rajesh K, et al. The role of tumor associated macrophages (TAMs) in cancer progression, chemoresistance, angiogenesis and metastasis - current status. Curr Medicinal Chem. (2021) 28:8203–36. doi: 10.2174/0929867328666210720143721
15. Wang Y, Wang J, Ma X, Li H, Sun X, Kang M, et al. CD312 promotes paediatric acute lymphoblastic leukaemia through GNA15-mediated non-classical GPCR signalling pathway. J Cell Mol Med. (2024) 28:e70283. doi: 10.1111/jcmm.v28.23
16. van den Bos E, Ambrosy B, Horsthemke M, Walbaum S, Bachg AC, Wettschureck N, et al. Knockout mouse models reveal the contributions of G protein subunits to complement C5a receptor-mediated chemotaxis. J Biol Chem. (2020) 295:7726–42. doi: 10.1074/jbc.RA119.011984
17. Nguyen L, Masouminia M, Mendoza A, Samadzadeh S, Tillman B, Morgan T, et al. Alcoholic hepatitis versus non-alcoholic steatohepatitis: Levels of expression of some proteins involved in tumorigenesis. Exp Mol Pathol. (2018) 104:45–9. doi: 10.1016/j.yexmp.2017.12.007
18. Wu J, Qu J, Cao H, Jing C, Wang Z, Xu H, et al. Monoclonal antibody AC10364 inhibits cell proliferation in 5-fluorouracil resistant hepatocellular carcinoma via apoptotic pathways. Onco Targets Ther. (2019) 12:5053–67. doi: 10.2147/OTT.S206517
19. Gu Y, Feng Q, Liu H, Zhou Q, Hu A, Yamaguchi T, et al. Bioinformatic evidences and analysis of putative biomarkers in pancreatic ductal adenocarcinoma. Heliyon. (2019) 5:e02378. doi: 10.1016/j.heliyon.2019.e02378
20. Lu X, Lu J, Liao B, Li X, Qian X, Li K. Driver pattern identification over the gene co-expression of drug response in ovarian cancer by integrating high throughput genomics data. Sci Rep. (2017) 7:16188. doi: 10.1038/s41598-017-16286-5
21. Li M, Liu Y, Liu Y, Yang L, Xu Y, Wang W, et al. Downregulation of GNA15 inhibits cell proliferation via P38 MAPK pathway and correlates with prognosis of adult acute myeloid leukemia with normal karyotype. Front Oncol. (2021) 11:724435. doi: 10.3389/fonc.2021.724435
22. Zeng B, Chen Y, Chen H, Zhao Q, Sun Z, Liu D, et al. Exosomal miR-211-5p regulates glucose metabolism, pyroptosis, and immune microenvironment of melanoma through GNA15. Pharmacol Res. (2023) 188:106660. doi: 10.1016/j.phrs.2023.106660
23. Wang C, Chen Z, Yi Y, Ding Y, Xu F, Kang H, et al. RBM45 reprograms lipid metabolism promoting hepatocellular carcinoma via Rictor and ACSL1/ACSL4. Oncogene. (2023) 43(5):328–40. doi: 10.1038/s41388-023-02902-4
24. Langfelder P, Horvath S. WGCNA: an R package for weighted correlation network analysis. BMC Bioinf. (2008) 9:559. doi: 10.1186/1471-2105-9-559
25. Wilkerson MD, Hayes DN. ConsensusClusterPlus: a class discovery tool with confidence assessments and item tracking. Bioinf (Oxford England). (2010) 26:1572–3. doi: 10.1093/bioinformatics/btq170
26. Tang Z, Kang B, Li C, Chen T, Zhang Z. GEPIA2: an enhanced web server for large-scale expression profiling and interactive analysis. Nucleic Acids Res. (2019) 47:W556–w60. doi: 10.1093/nar/gkz430
27. Li T, Fu J, Zeng Z, Cohen D, Li J, Chen Q, et al. TIMER2.0 for analysis of tumor-infiltrating immune cells. Nucleic Acids Res. (2020) 48:W509–w14. doi: 10.1093/nar/gkaa407
28. Curiel TJ, Coukos G, Zou L, Alvarez X, Cheng P, Mottram P, et al. Specific recruitment of regulatory T cells in ovarian carcinoma fosters immune privilege and predicts reduced survival. Nat Med. (2004) 10:942–9. doi: 10.1038/nm1093
29. Laoui D, Van Overmeire E, Di Conza G, Aldeni C, Keirsse J, Morias Y, et al. Tumor hypoxia does not drive differentiation of tumor-associated macrophages but rather fine-tunes the M2-like macrophage population. Cancer Res. (2014) 74:24–30. doi: 10.1158/0008-5472.CAN-13-1196
30. Lecker LSM, Berlato C, Maniati E, Delaine-Smith R, Pearce OMT, Heath O, et al. TGFBI production by macrophages contributes to an immunosuppressive microenvironment in ovarian cancer. Cancer Res. (2021) 81:5706–19. doi: 10.1158/0008-5472.CAN-21-0536
31. Dijkgraaf EM, Heusinkveld M, Tummers B, Vogelpoel LT, Goedemans R, Jha V, et al. Chemotherapy alters monocyte differentiation to favor generation of cancer-supporting M2 macrophages in the tumor microenvironment. Cancer Res. (2013) 73:2480–92. doi: 10.1158/0008-5472.CAN-12-3542
32. Newman AM, Liu CL, Green MR, Gentles AJ, Feng W, Xu Y, et al. Robust enumeration of cell subsets from tissue expression profiles. Nat Methods. (2015) 12:453–7. doi: 10.1038/nmeth.3337
33. Kelly MG, Alvero AB, Chen R, Silasi DA, Abrahams VM, Chan S, et al. TLR-4 signaling promotes tumor growth and paclitaxel chemoresistance in ovarian cancer. Cancer Res. (2006) 66:3859–68. doi: 10.1158/0008-5472.CAN-05-3948
34. Ilvesaro JM, Merrell MA, Swain TM, Davidson J, Zayzafoon M, Harris KW, et al. Toll like receptor-9 agonists stimulate prostate cancer invasion in vitro. Prostate. (2007) 67:774–81. doi: 10.1002/pros.20562
35. Dahan R, Sega E, Engelhardt J, Selby M, Korman AJ, Ravetch JV. FcγRs modulate the anti-tumor activity of antibodies targeting the PD-1/PD-L1 axis. Cancer Cell. (2015) 28:285–95. doi: 10.1016/j.ccell.2015.08.004
36. Ding Y, Yan Y, Dong Y, Xu J, Su W, Shi W, et al. NLRP3 promotes immune escape by regulating immune checkpoints: A pan-cancer analysis. Int Immunopharmacol. (2022) 104:108512. doi: 10.1016/j.intimp.2021.108512
37. Giannone F, Malpeli G, Lisi V, Grasso S, Shukla P, Ramarli D, et al. The puzzling uniqueness of the heterotrimeric G15 protein and its potential beyond hematopoiesis. J Mol Endocrinol. (2010) 44:259–69. doi: 10.1677/JME-09-0134
38. Sun Y, Han Y. GNA15 facilitates the Malignant development of thyroid carcinoma cells via the BTK-mediated MAPK signaling pathway. Histol Histopathol. (2024) 39:1217–27. doi: 10.14670/HH-18-714
39. Wilkie TM, Scherle PA, Strathmann MP, Slepak VZ, Simon MI. Characterization of G-protein alpha subunits in the Gq class: expression in murine tissues and in stromal and hematopoietic cell lines. Proc Natl Acad Sci United States America. (1991) 88:10049–53. doi: 10.1073/pnas.88.22.10049
Keywords: ovarian carcinoma, cancer microenvironment, tumor-associated macrophages, prognostic model, GNA15
Citation: Liu Q, Sun Y, Zhang T, Lin W, Zhang J, Zhang H, Zheng W, Xu H and Zhou F (2025) GNA15 predicts poor outcomes as a novel biomarker related to M2 macrophage infiltration in ovarian cancer. Front. Immunol. 16:1512086. doi: 10.3389/fimmu.2025.1512086
Received: 16 October 2024; Accepted: 21 January 2025;
Published: 07 February 2025.
Edited by:
Bastian Czogalla, LMU Munich University Hospital, GermanyReviewed by:
Till Kaltofen, University Medical Center Regensburg, GermanyA. N. M. Nazmul Hasan Khan, University at Buffalo, United States
Copyright © 2025 Liu, Sun, Zhang, Lin, Zhang, Zhang, Zheng, Xu and Zhou. This is an open-access article distributed under the terms of the Creative Commons Attribution License (CC BY). The use, distribution or reproduction in other forums is permitted, provided the original author(s) and the copyright owner(s) are credited and that the original publication in this journal is cited, in accordance with accepted academic practice. No use, distribution or reproduction is permitted which does not comply with these terms.
*Correspondence: Feng Zhou, cGF0aG96ZkAxNjMuY29t; Hong Xu, eHVob25nMTU1OEBzanR1LmVkdS5jbg==
†These authors have contributed equally to this work and share first authorship