 Taylor Jefferis
 James Y. Liu1†
 Christie M. Sayes
- 1Department of Environmental Science, Baylor University, Waco, TX, United States
- 2Institute of Biomedical Studies, Baylor University, Waco, TX, United States
Introduction: Humans are regularly exposed to environmental substances through inhaled air. Some chemicals or particles are respiratory sensitizers that can cause adverse respiratory health effects by triggering amplified immune responses. Understanding the process of respiratory sensitization and identifying potential sensitizers have been challenging due to the complexity of the underlying mechanisms.
Methods: This study leverages the transcriptomics from a previous in vitro 3D human lung model to investigate the pathways of chemical respiratory sensitization. Differentially expressed genes between two known and two nonsensitizers are cross-referenced against databases on biological processes and disease pathways.
Results: The GO results revealed 43 upregulated genes, and the KEGG revealed 52. However, only 18 upregulated genes were common between GO and KEGG. The GO results revealed 26 downregulated genes, and the KEGG revealed 40. However, only 9 of those downregulated genes were common.
Discussion: These findings support using multiple databases in perturbed gene analyses. The results from this study and data available in the scientific literature contribute toward building a biomarker profile for identifying respiratory sensitizers.
Introduction
The main objective of this paper is to emphasize the benefits of using multiple databases in pathway analysis to determine the potential of a chemical to act as a respiratory sensitizer. RNAseq generates an overwhelming number of genes that are either upregulated or downregulated. RNAseq data must be processed systematically to ensure reliable and rigorous interpretation. We propose utilizing online, free, publicly available bioinformatics database tools to reduce the millions of genes produced from sequencing to a manageable number that can generate testable hypotheses in an in vivo study or clinical trial. Therefore, we have demonstrated another valid reason for conducting in vitro screening tests to complement the previously established reasons for conducting in vitro and in vivo testing (1, 2).
Through inhalation, people can be exposed to various exogenous materials found in the air, including chemical vapors, particulate matter, and microbes that may cause acute or chronic lung irritation (2–6). In addition, people can be exposed to asthmagens, which can lead to hyperreactivity symptoms without an immunological reaction (7–11), whereas inhalation of respiratory sensitizers may cause long-term adverse immunological outcomes in the lungs due to amplified responses from repeated exposures (12).
In a previous study, researchers investigated the transcriptome of dendritic cells, macrophages, and epithelial cells (2). After examining these transcriptomes of cells exposed to two known respiratory sensitizers and comparing them to cells exposed to two known non-sensitizers, a better idea of the effects of several different lung cells can be achieved. Compared to a less representative mono-culture model, the multi-cell culture system helps to mimic the relative lung compartment’s effects. This data was then used for an in-depth pathway analysis as a low-cost alternative to traditional in vivo models (13).
Pathway analysis combines biomolecular function knowledge with statistical techniques to interpret high-complexity biological data (14–16). However, these analyses are not routinely reported upon in the literature. Measuring multiple genes in a single-cell system enables advanced synthesis into possible perturbed biological processes. To that end, databases such as the Alliance of Genome Resources Gene Ontology (GO) Consortium and the Kyoto Encyclopedia of Genes and Genomes (KEGG) can elucidate pathways associated with the transcriptome of respiratory sensitizers (17, 18). GO provides consistent descriptors for gene products and standardizes classifications for sequences and their features (19–22).
Investigating novel methods for identifying respiratory sensitizers will ultimately improve health and safety outcomes for those exposed to these materials. Our findings will contribute to building a biomarker profile to identify respiratory sensitizers using pathway analysis. However, the main objective of this paper is to emphasize the benefit of using multiple databases in pathway analysis to conclude the ability of a chemical to be a respiratory sensitizer. It is hypothesized that using multiple databases will identify more perturbed genes that may arise from exposure to respiratory sensitizers than previously discovered.
Materials and methods
Experimental overview
Part of the methods for this paper are adapted from the previously mentioned study (2, 23–27). The only difference in methods from the previous paper to this one is the addition of analysis using KEGG and GO together rather than GO by itself. This allows for a more comprehensive analysis of the RNAseq data from the previous study.
The multiple cell culture model system
A multi-cell culture system was developed using epithelial cells (A549), macrophages (differentiated U937), and dendritic cells (differentiated THP-1) in a 12-well plate fitted with polyethylene terephthalate (PET) Transwell® membranes (Corning, Tewksbury, MA, USA). Cells were cultured in complete RPMI (cRPMI) 1640 (Thermo Fisher Scientific Inc. Waltham, MA, USA) with 10% FBS and 1% penicillin-streptomycin. The dendritic cells were also supplemented with 2-mercaptoethanol at a final concentration of 0.05 mM. All cells were maintained at 37°C in a humidified 5% and CO2 atmosphere.
Monocytes (U937) were incubated for 24 hr with 100 ng/mL phorbol 12-myristate-13-acetate (PMA) to differentiate into macrophages (28). The cells were washed twice with sterile 1X PBS before replenishing the media and allowing them to rest in the incubator for 72 hours before trypsinization and resuspension to be counted and plated. Monocytes (THP-1) were centrifuged and resuspended at 2×10⁵ cells/mL, then cultured in a serum-free medium supplemented with rhIL-4 (200 ng/mL), rhGM-CSF (100 ng/mL), rhTNFa (20 ng/mL), and 200 ng/mL ionomycin, all purchased from Thermo Fisher Scientific. To complete differentiation into dendritic cells, they were left to rest for 48 hr in the incubator before plating.
Epithelial cells were plated with a seeding density of 28×104 cells/cm2 and allowed to adhere for 72 hr. The inserts were then inverted and placed into sterile glass Petri dishes so that dendritic cells could be plated at a seeding density of 7×10⁴ cells/cm2 on the basal surface of the membrane and allowed to adhere for 4 hr. Inserts were then reverted and placed back into the well plate to seed the macrophages at a 1:9 ratio of U937:A549. The media was supplemented with 2-mercaptoethanol and added to the basolateral chamber of the wells, and the total volume was replenished to 500 μL. The model was left in the incubator for 24 hr before adding chemical exposures.
Chemical exposures
Isophorone diisocyanate (IPDI, Thermo Fisher Scientific, Inc.) was added at 25 μM, and ethylenediamine (ED, Thermo Fisher Scientific, Inc.) was added at 500 μM as positive controls for respiratory sensitization (29–33). Chlorobenzene (CB, Thermo Fisher Scientific, Inc.) was added at 98 μM, and dimethylformamide (DF, Thermo Fisher Scientific, Inc.) at 500 μM as negative controls/non-sensitizers (29, 34). Each chemical was introduced only to the apical compartment in its respective concentration. A vehicle (dimethyl sulfoxide, DMSO) was used to solubilize IPDI and CB. After 24 hr of chemical exposure, RNA extraction and sequencing were performed at Azenta Life Sciences (South Plainfield, NJ, USA).
RNA extraction
Total RNA was extracted from frozen pellets using RNeasy Plus Universal mini kit (Qiagen, Hilden, Germany). RNA was quantified using a Qubit 2.0 fluorometer (Life Technologies, Carlsbad, CA, USA), and the integrity was checked using Agilent TapeStation 4200 (Agilent Technologies, Palo Alto, CA, USA). Sequencing libraries were then prepared using the NEBNext Ultra II RNA Library Prep for Illumina (NEB, Ipswich, MA, USA). mRNAs were fragmented for 15 min at 94°C and enriched with Oligod(T) beads. First and second-strand cDNA was synthesized, and universal adapters were ligated to cDNA fragments, which were repaired and adenylated at 3’ ends. Then, index addition and library enrichment by PCR before the libraries were validated on the Agilent TapeStation (Agilent Technologies) and quantified by using Qubit 2.0 Fluorometer (Invitrogen) along with quantitative PCR (KAPA Biosystems, Wilmington, MA, USA).
The sequencing libraries were clustered on a lane of a HiSeq flow cell, and samples were sequenced using a 2×150 bp paired-end (PE) configuration. The software then conducted image analysis and base calling. The raw sequence data (.bcl files) generated by the sequencer were converted into fastq files and de-multiplexed using Illumina’s bcl2fastq 2.17 software. One mismatch was allowed for index sequence identification.
Data analysis
Following sequencing, the raw data was processed for further analysis. Raw reads were checked for quality, trimmed to remove adaptor sequences, and mapped to the reference genome (ENSEMBL; STAR aligner v.2.5.2b). Unique gene hit counts were calculated using feature counts of reads in exonic regions (Subread package v.2.5.2b).
Determination of differential expression was done using the R programming language using the packages gplots, ggplot2, viridis, dplyr, tidyverse, GO.db, annotate, org.Hs.eg.db, and circlize. Log-2-fold-change (L2FC) was calculated for all treatments normalized to untreated controls and for all sensitizers normalized to non-sensitizers. Genes with L2FC values > 1 and p-values < 0.05 (Wald test) were considered as differentially expressed (35). Differentially expressed genes were then input into the GO and KEGG databases, and the impacted terms and pathways were extracted, respectively.
The top ten perturbed GO terms and KEGG pathways were reported for each compartment using chord diagrams with a hierarchical distance from the root (biological process) of five. Data for all the differentially expressed genes was then used to analyze the top ten most affected GO terms and KEGG pathways for all samples pooled together.
Differentially expressed genes were extracted from raw hit counts in R and used for pathway analysis. The most common terms for GO biological processes with a hierarchical distance of 5 from the root were collected using the differentially expressed genes grouped by the apical and basal compartments. Chord diagrams were generated in R using the circlize package, mapping relationships between the top ten terms and their associated genes. The process was followed using KEGG pathways, and chord diagrams were generated using the top 10 pathways.
Results
This study utilized data collected from a previous study to expand upon the previous understanding and develop a more comprehensive understanding of the ability to use pathway analysis in distinguishing sensitizers from non-sensitizers. Figure 1 shows an overview of the methods used to obtain this information. First, data was obtained from the previously mentioned study. Then, the differentially expressed genes from the aggregate of each compartment were entered into the GO and KEGG databases to aid in forming chord diagrams to display the results.
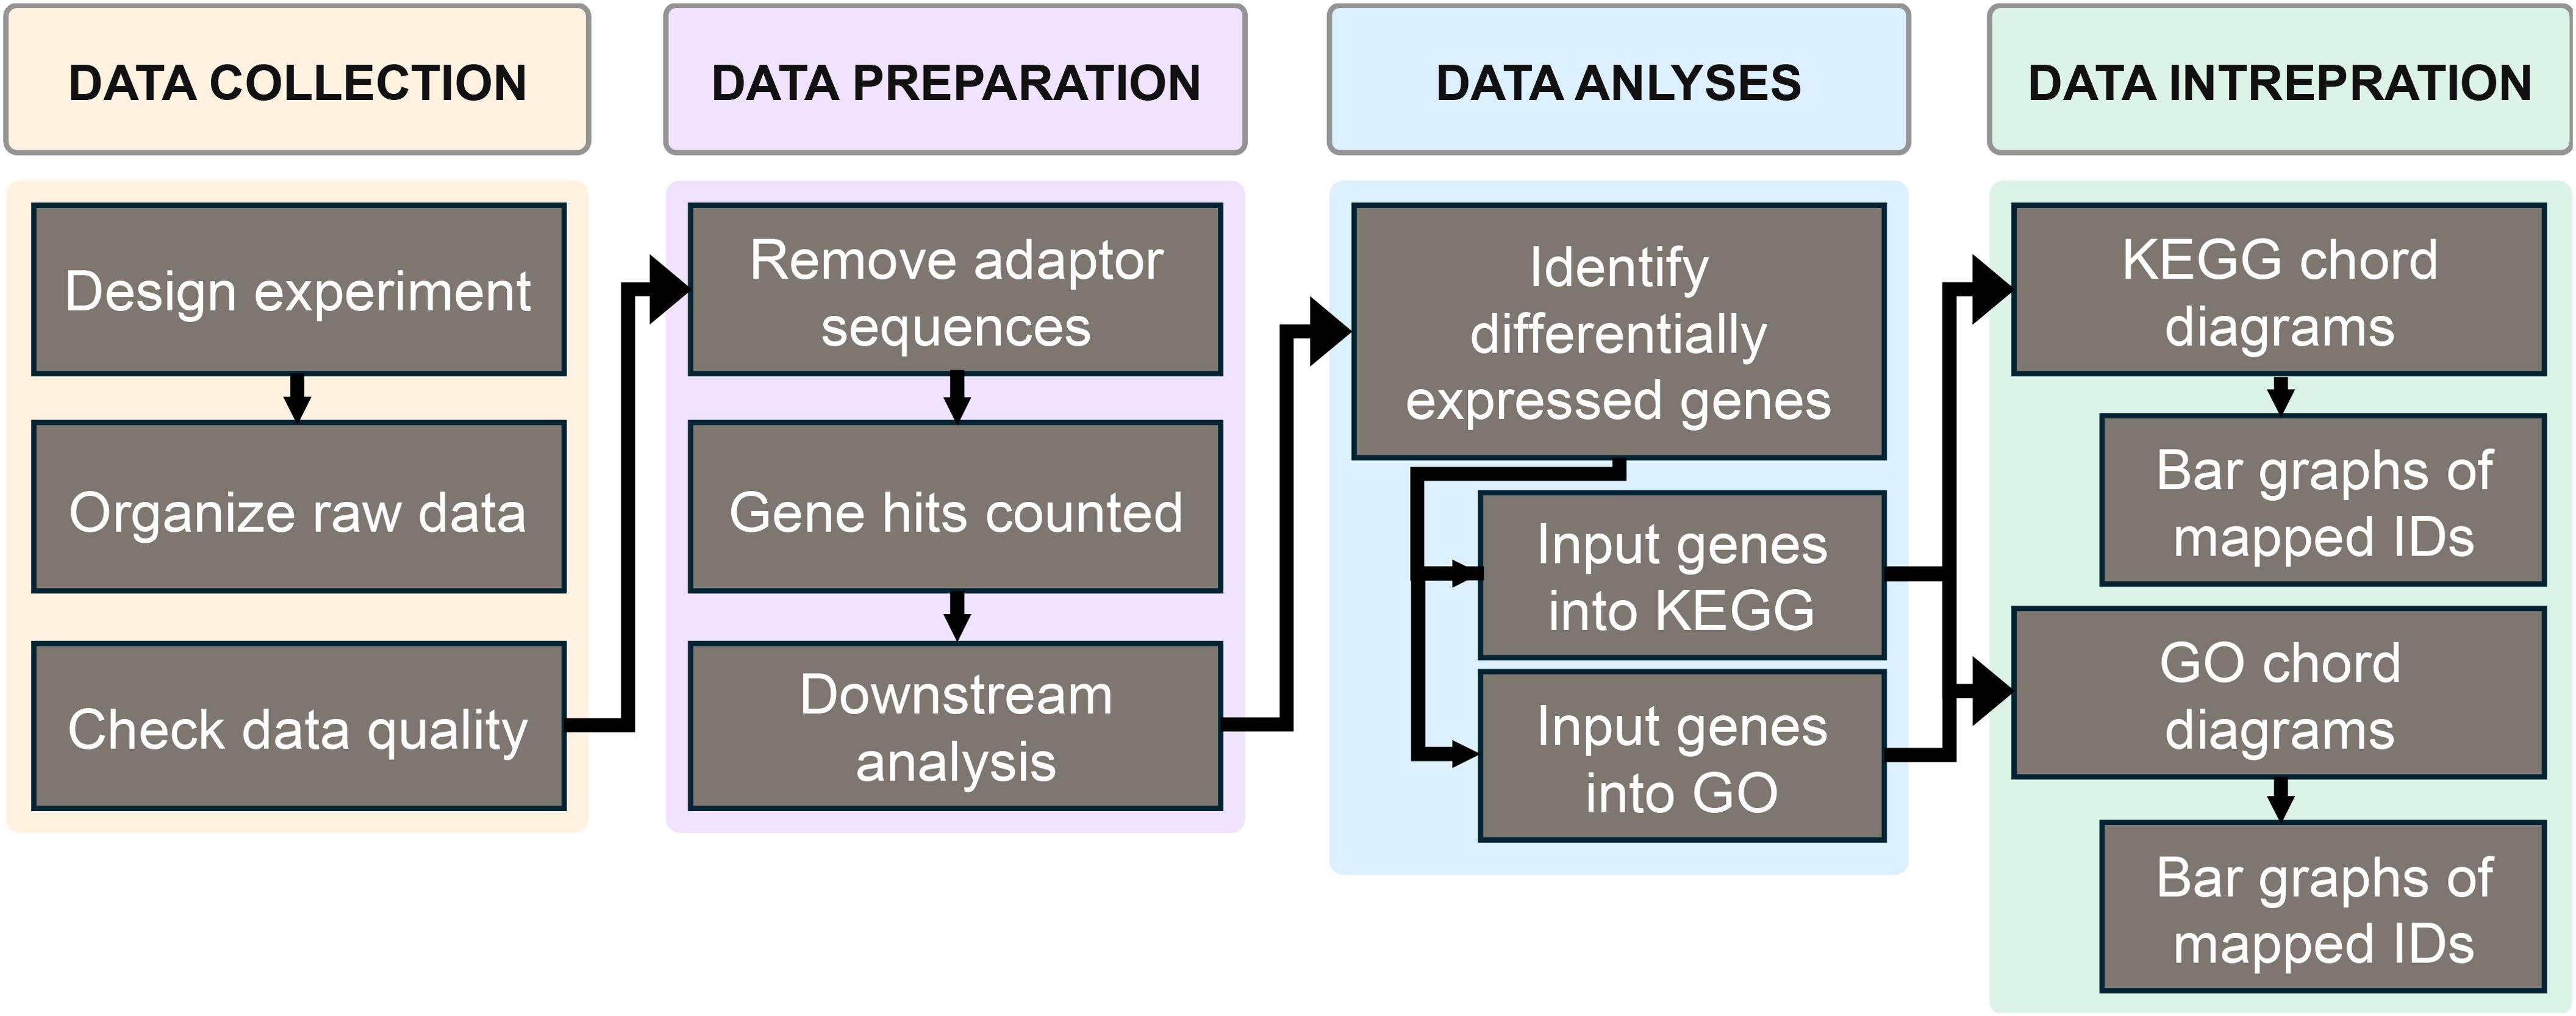
Figure 1. The overall methods used to obtain the data in this study.
GO includes terms that provide unique information to group genes based on their commonalities, which helps conclude which genes are differentially expressed (29). GO is hierarchal, which splits into biological processes, cellular components, and molecular functions (30, 31). KEGG draws information about cells or organisms based on their genome information (36, 37). This is used to further information about pathway analysis and is more specific to disease pathology, similar to the mechanisms involved in the immune response to respiratory sensitization in humans (36).
GO analysis identifies pathways that may lead to potential biomarker signatures, which can help determine potential sensitizers. We prepared chord diagrams representing the data. These depict the associations between differentially expressed genes for apical cells (Figures 2A, B) and basal cells (Figures 2C, D) and GO terms for biological processes (Table 1). Terms with a minimum distance of 5 from the root are used. Upregulated and downregulated genes and descriptions of each GO term are shown.
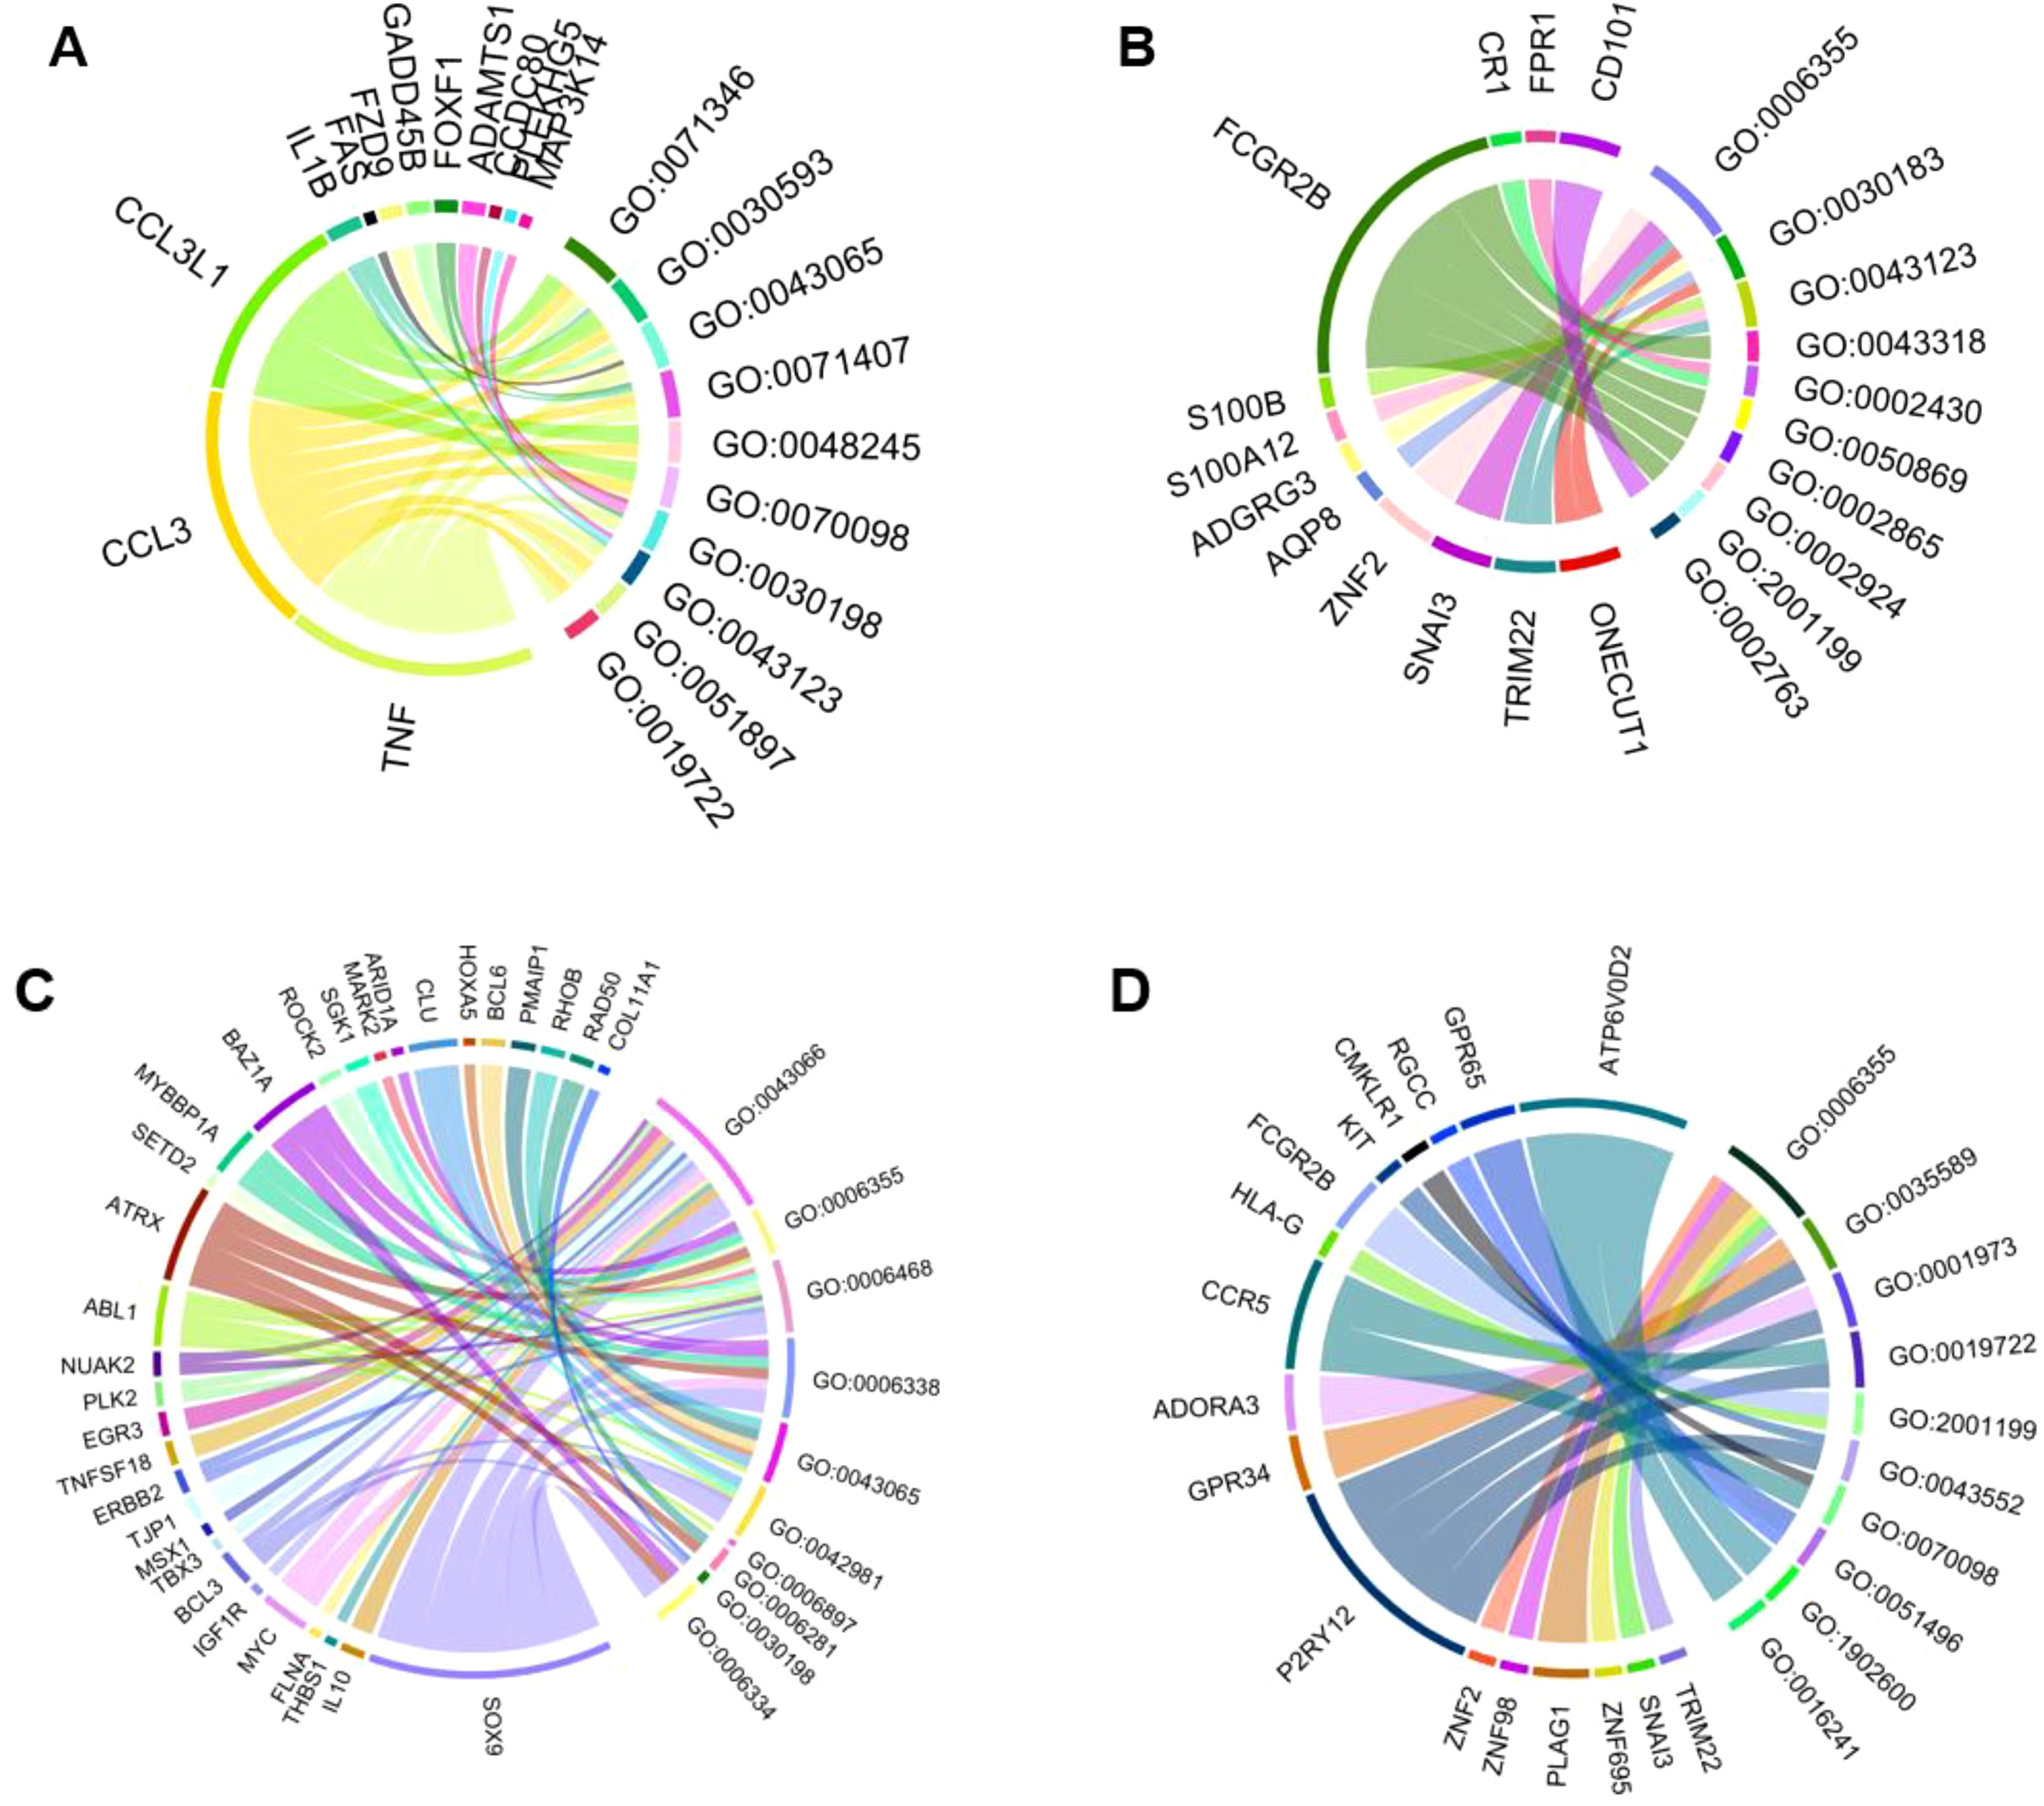
Figure 2. Chord diagrams depicting the associations between differentially expressed genes for cells and GO terms for biological process (minimum distance of 5 from root). (A) The top 10 GO terms for upregulated genes in the apical compartment. (B) The top 10 GO terms for downregulated genes in the apical compartment. (C) The top 10 GO terms for upregulated genes in the basolateral compartment. (D) The top 10 GO terms for downregulated genes in the basolateral compartment.
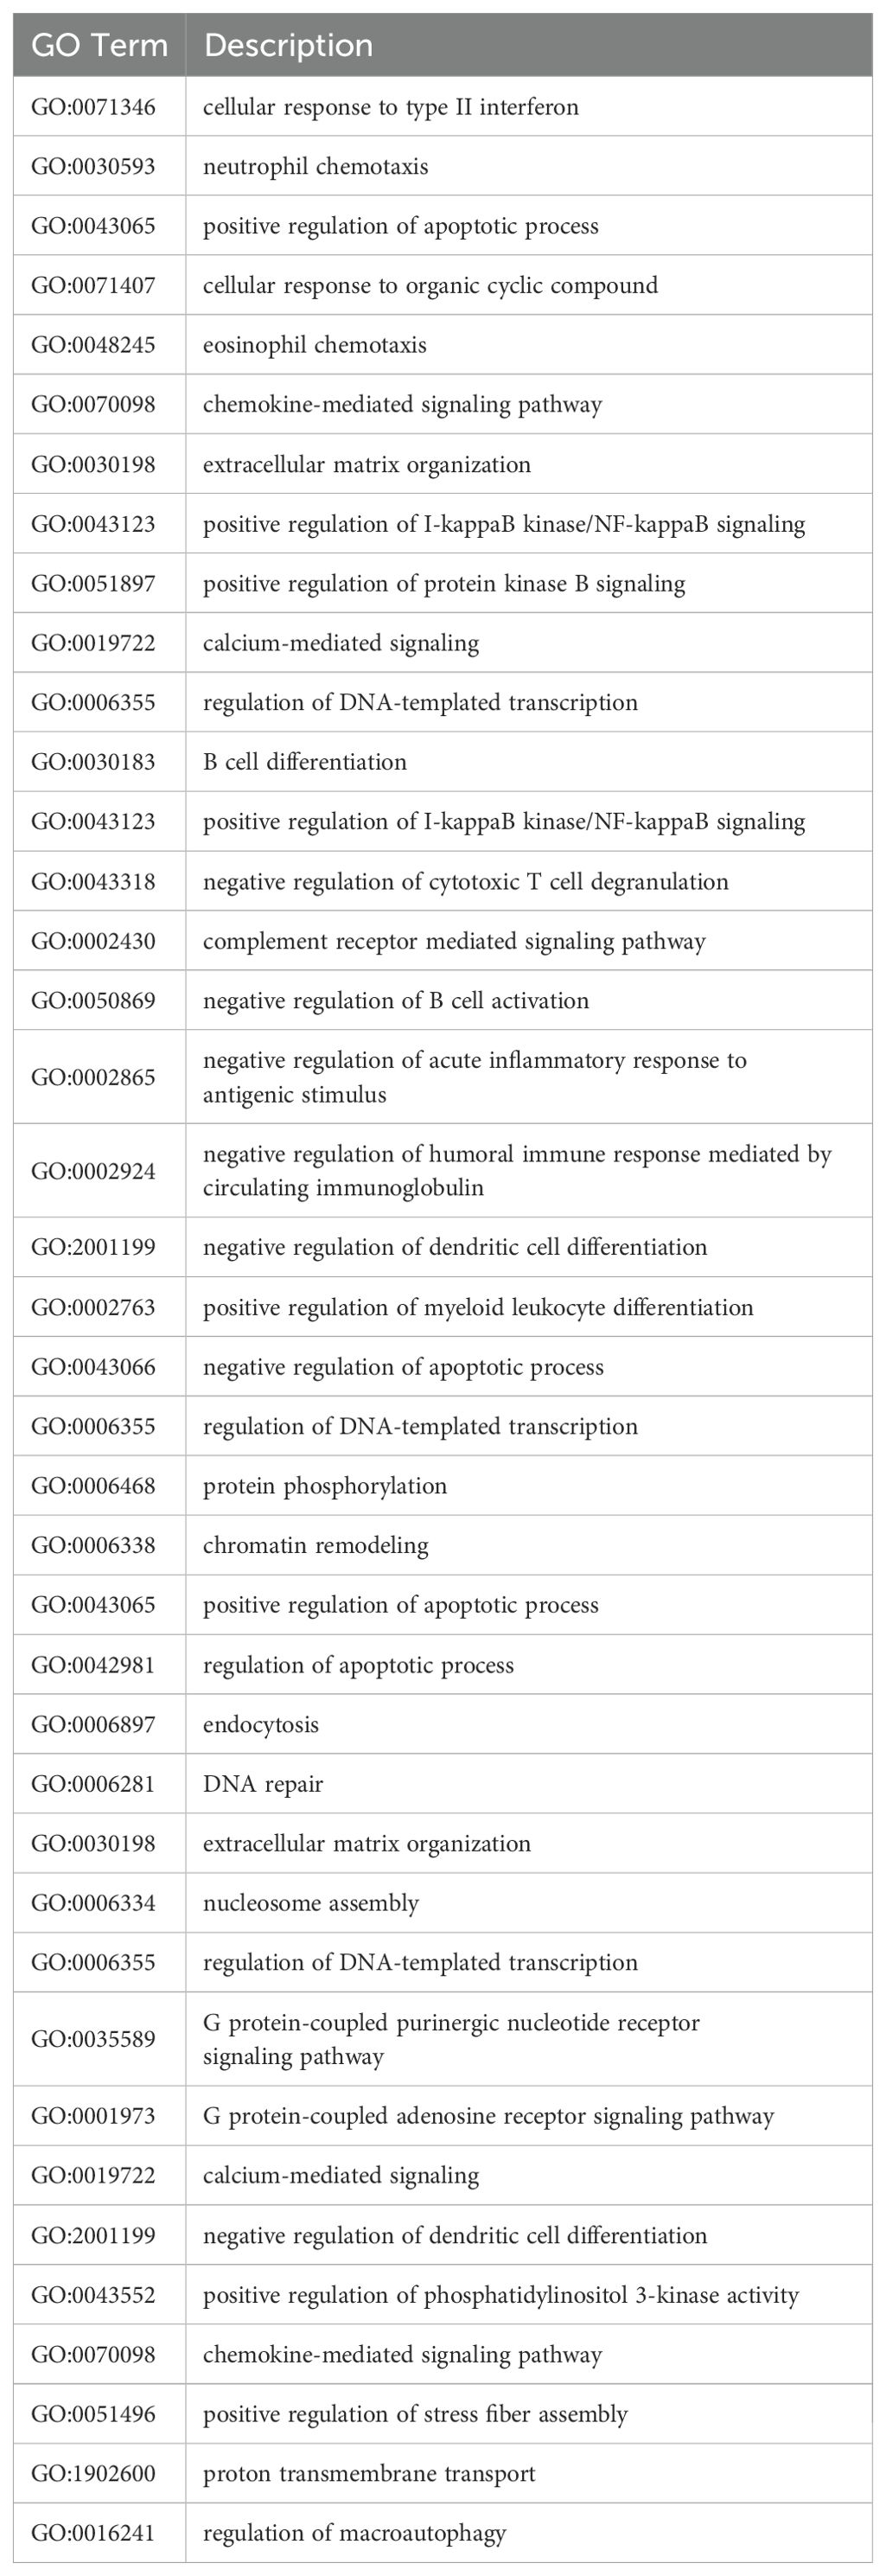
Table 1. Description of GO Terms.
Figure 2 shows TNF, CCL3, CCL3L1, IL1B, FAS, FZD9, GADD458, FOXF1, ADAMTS1, CCDC80, MAP3K14, and PLEKHG5 as upregulated genes in the apical compartment. The downregulated genes of the apical compartment, according to the figure, are CD101, FPR1, CR1, FCGR2B, S100B, S100A12, ADGRG3, AQP8, ZNF2, SNAI3, TRIM22, ONECUT1.
Figure 2 shows COL11A1, RAD50, RHOB, PMAIP1, BCL6, HOXA5, CLU, ARID1A, MARK2, SGK1, ROCK2, BAZ1A, MYBBP1A, SETD2, ATRX, ABL1, NUAK2, PLK2, EGR3, TNFSF18, ERBB2, TJP1, MSX1, TBX3, BCL3, IGF1R, MYC, FLNA, THBS1, IL10, SOX9 as upregulated genes in the basal compartment. The downregulated genes are ATP6V0D2, GPR65, RGCC, CMKLR1, KIT, FCGR2B, HLA-G, CCR5, ADORA3, GPR34, P2RY12, ZNF2, ZNF98, PLAG1, ZNF695, SNAI3, TRIM22.
KEGG pathways map the network of gene products, focusing on disease pathways (38). We prepared chord diagrams representing the data obtained from KEGG pathway analysis, shown in Figure 3. These depict associations between differentially expressed genes for apical cells and basal cells and KEGG pathways. Upregulated and downregulated genes are shown, and each KEGG pathway is described (Table 2).
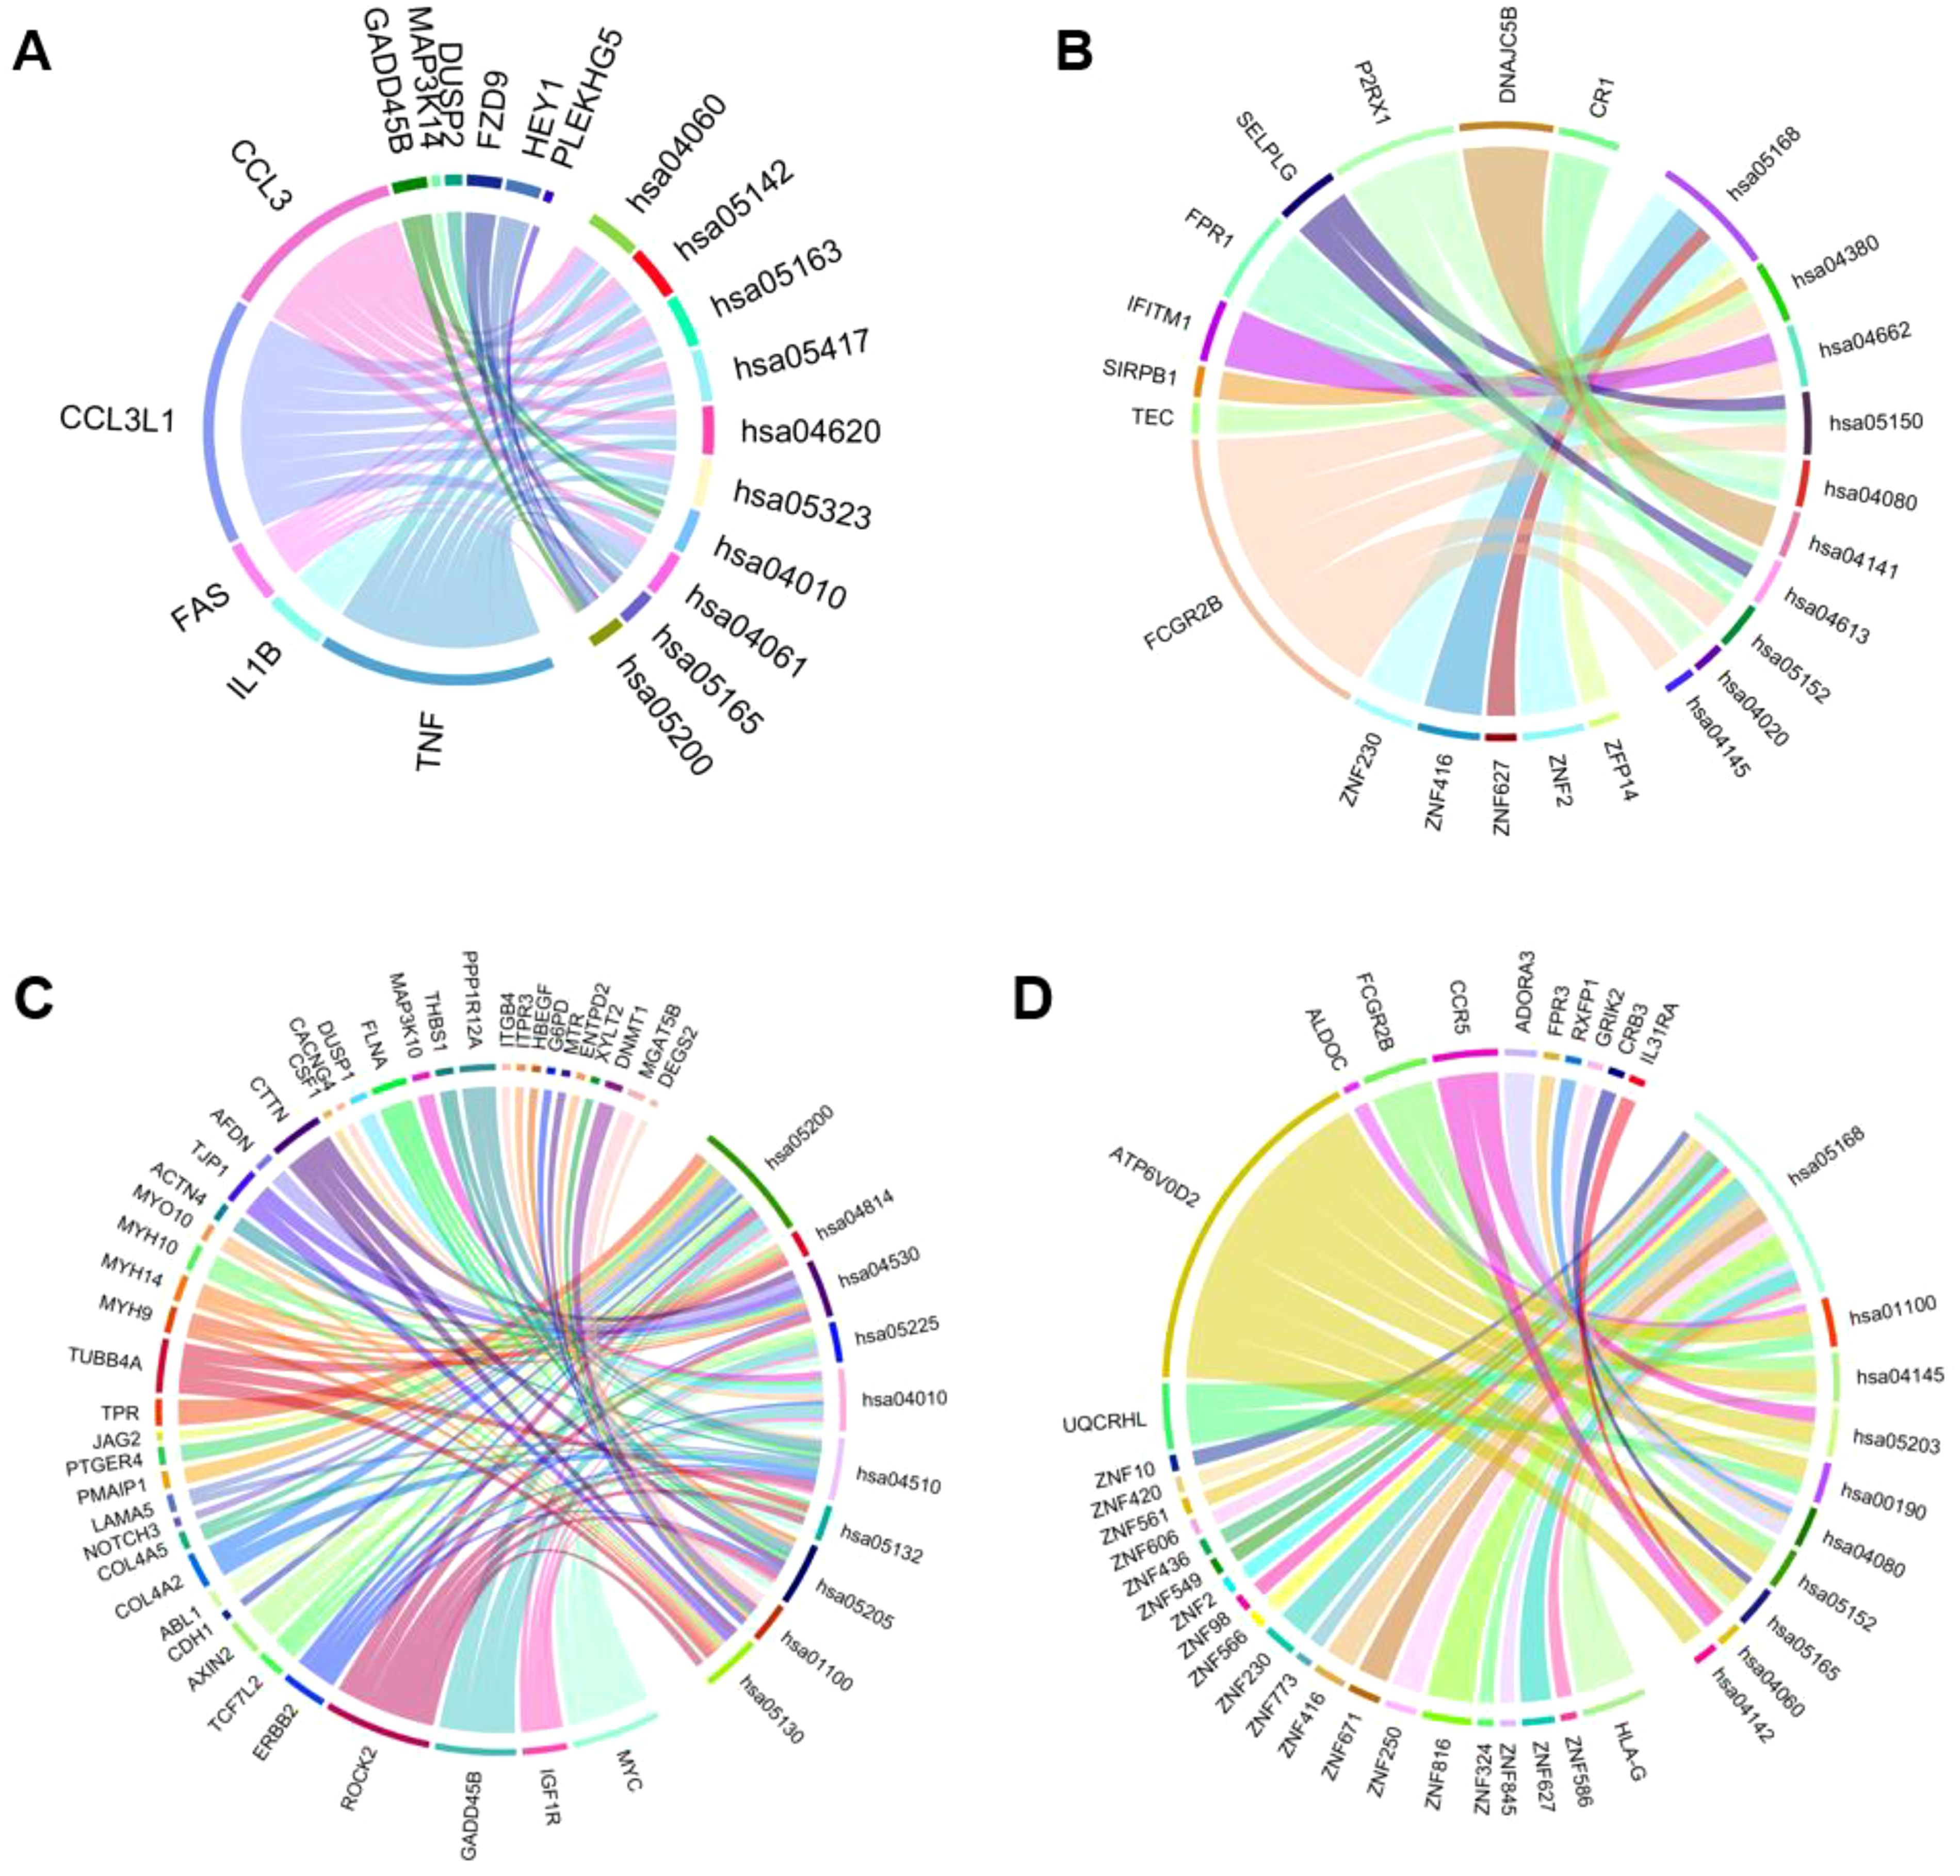
Figure 3. Chord diagrams depicting the associations between differentially expressed genes for cells and KEGG pathways (homo sapiens). (A) The top 10 KEGG pathways for upregulated genes in the apical compartment. (B) The top 10 KEGG pathways for downregulated genes in the apical compartment. (C) The top 10 KEGG pathways for upregulated genes in the basolateral compartment. (D) The top 10 KEGG pathways for downregulated genes in the basolateral compartment.
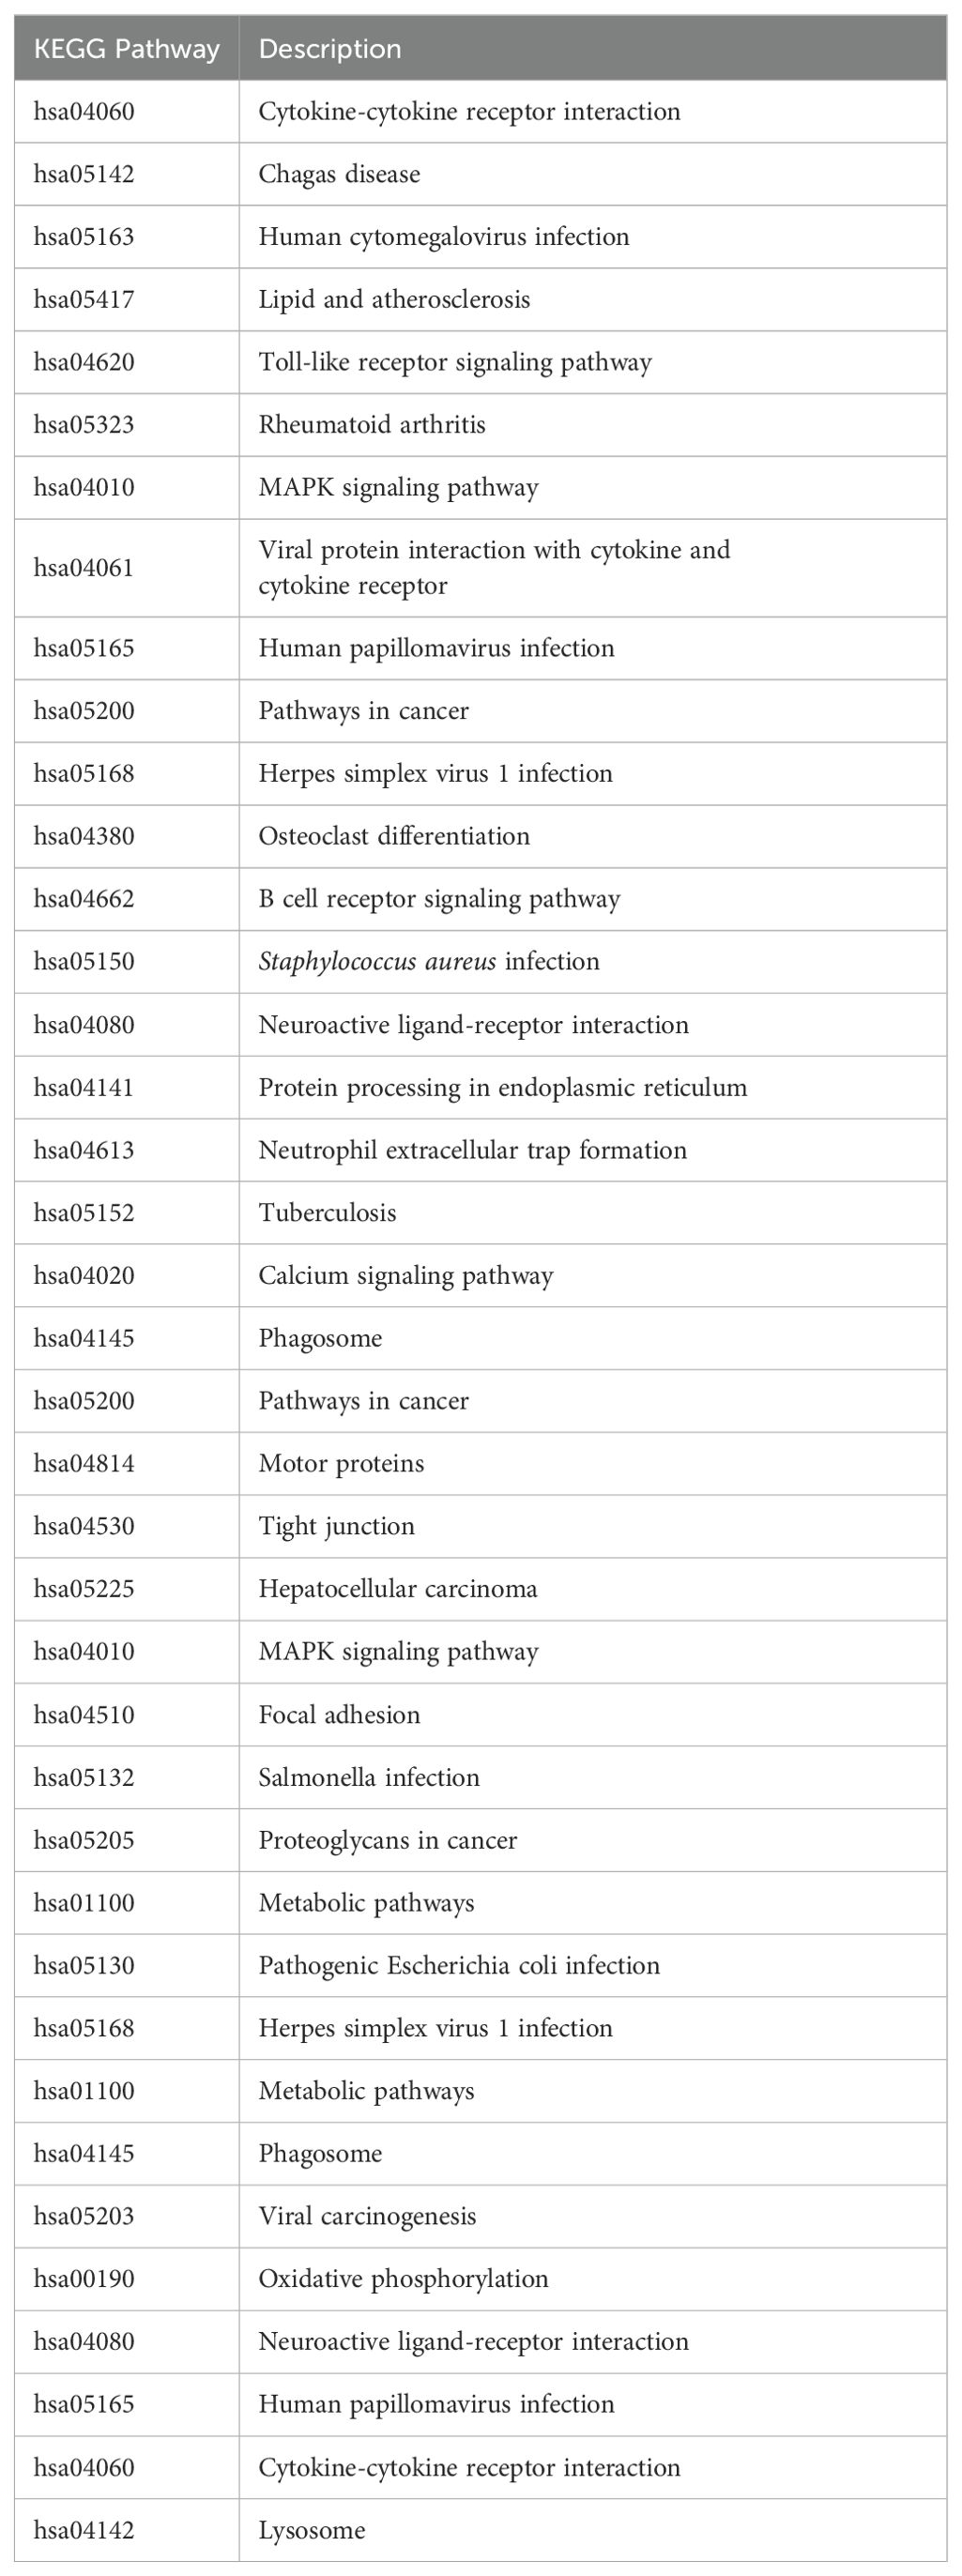
Table 2. Description of KEGG Pathways.
The upregulated genes for the KEGG pathways to be PLEKGH5, HEY1, FZD9, DUSP2, MAP3K14, GADD45B, CCL3, CCL3L1, FAS, IL1B, TNF in the apical compartment, shown in Figure 3. The downregulated genes for the apical compartment are CR1, DNAJC5B, P2RX1, SELPLG, FPR1, IFITM1, SIRPB1, TEC, FCGR2B, ZNF230, ZNF416, ZNF627, ZNF2, ZFP14.
Figure 3 shows the upregulated genes in the basal compartment to be DEGS2, MGAT5B, DNMT1, XYLT2, ENTPD2, MTR, G6PD, HBEGF, ITPR3, ITGB4, PPP1R12A, THBS1, MAP3K10, FLNA, DUSP1, CACNG4, CSF1, CTTN, AFDN, TJP1, ACTN4, MYO10, MYH14, MYH9, TUBB4A, TPR, JAG2, PTGER4, PMAIP1, LAMA5, NOTCH3, COL4A5, COL4A2, ABL1, CDH1, AXIN2, TCF7L2, ERBB2, ROCK2, GADD45B, IGF1R, MYC. The downregulated genes are IL31RA, CRB3, GRIK2, RXFP1, FPR3, ADORA3, CCR5, FCGR2B, ALDOC, ATP6V0D2, UQCRHL, ZNF10, ZNF420, ZNF561, ZNF606, ZNF436, ZNF549, ZNF2, ZNF98, ZNF566, ZNF230, ZNF773, ZNF416, ZNF671, ZNF250, ZNF816, ZNF324, ZNF845, ZNF627, ZNF586, HLA-G.
Figures 4, 5 each show the associated gene counts for each GO and KEGG term, respectively. These demonstrate the number of perturbed genes from the exposures related to each disease process or other perturbation.
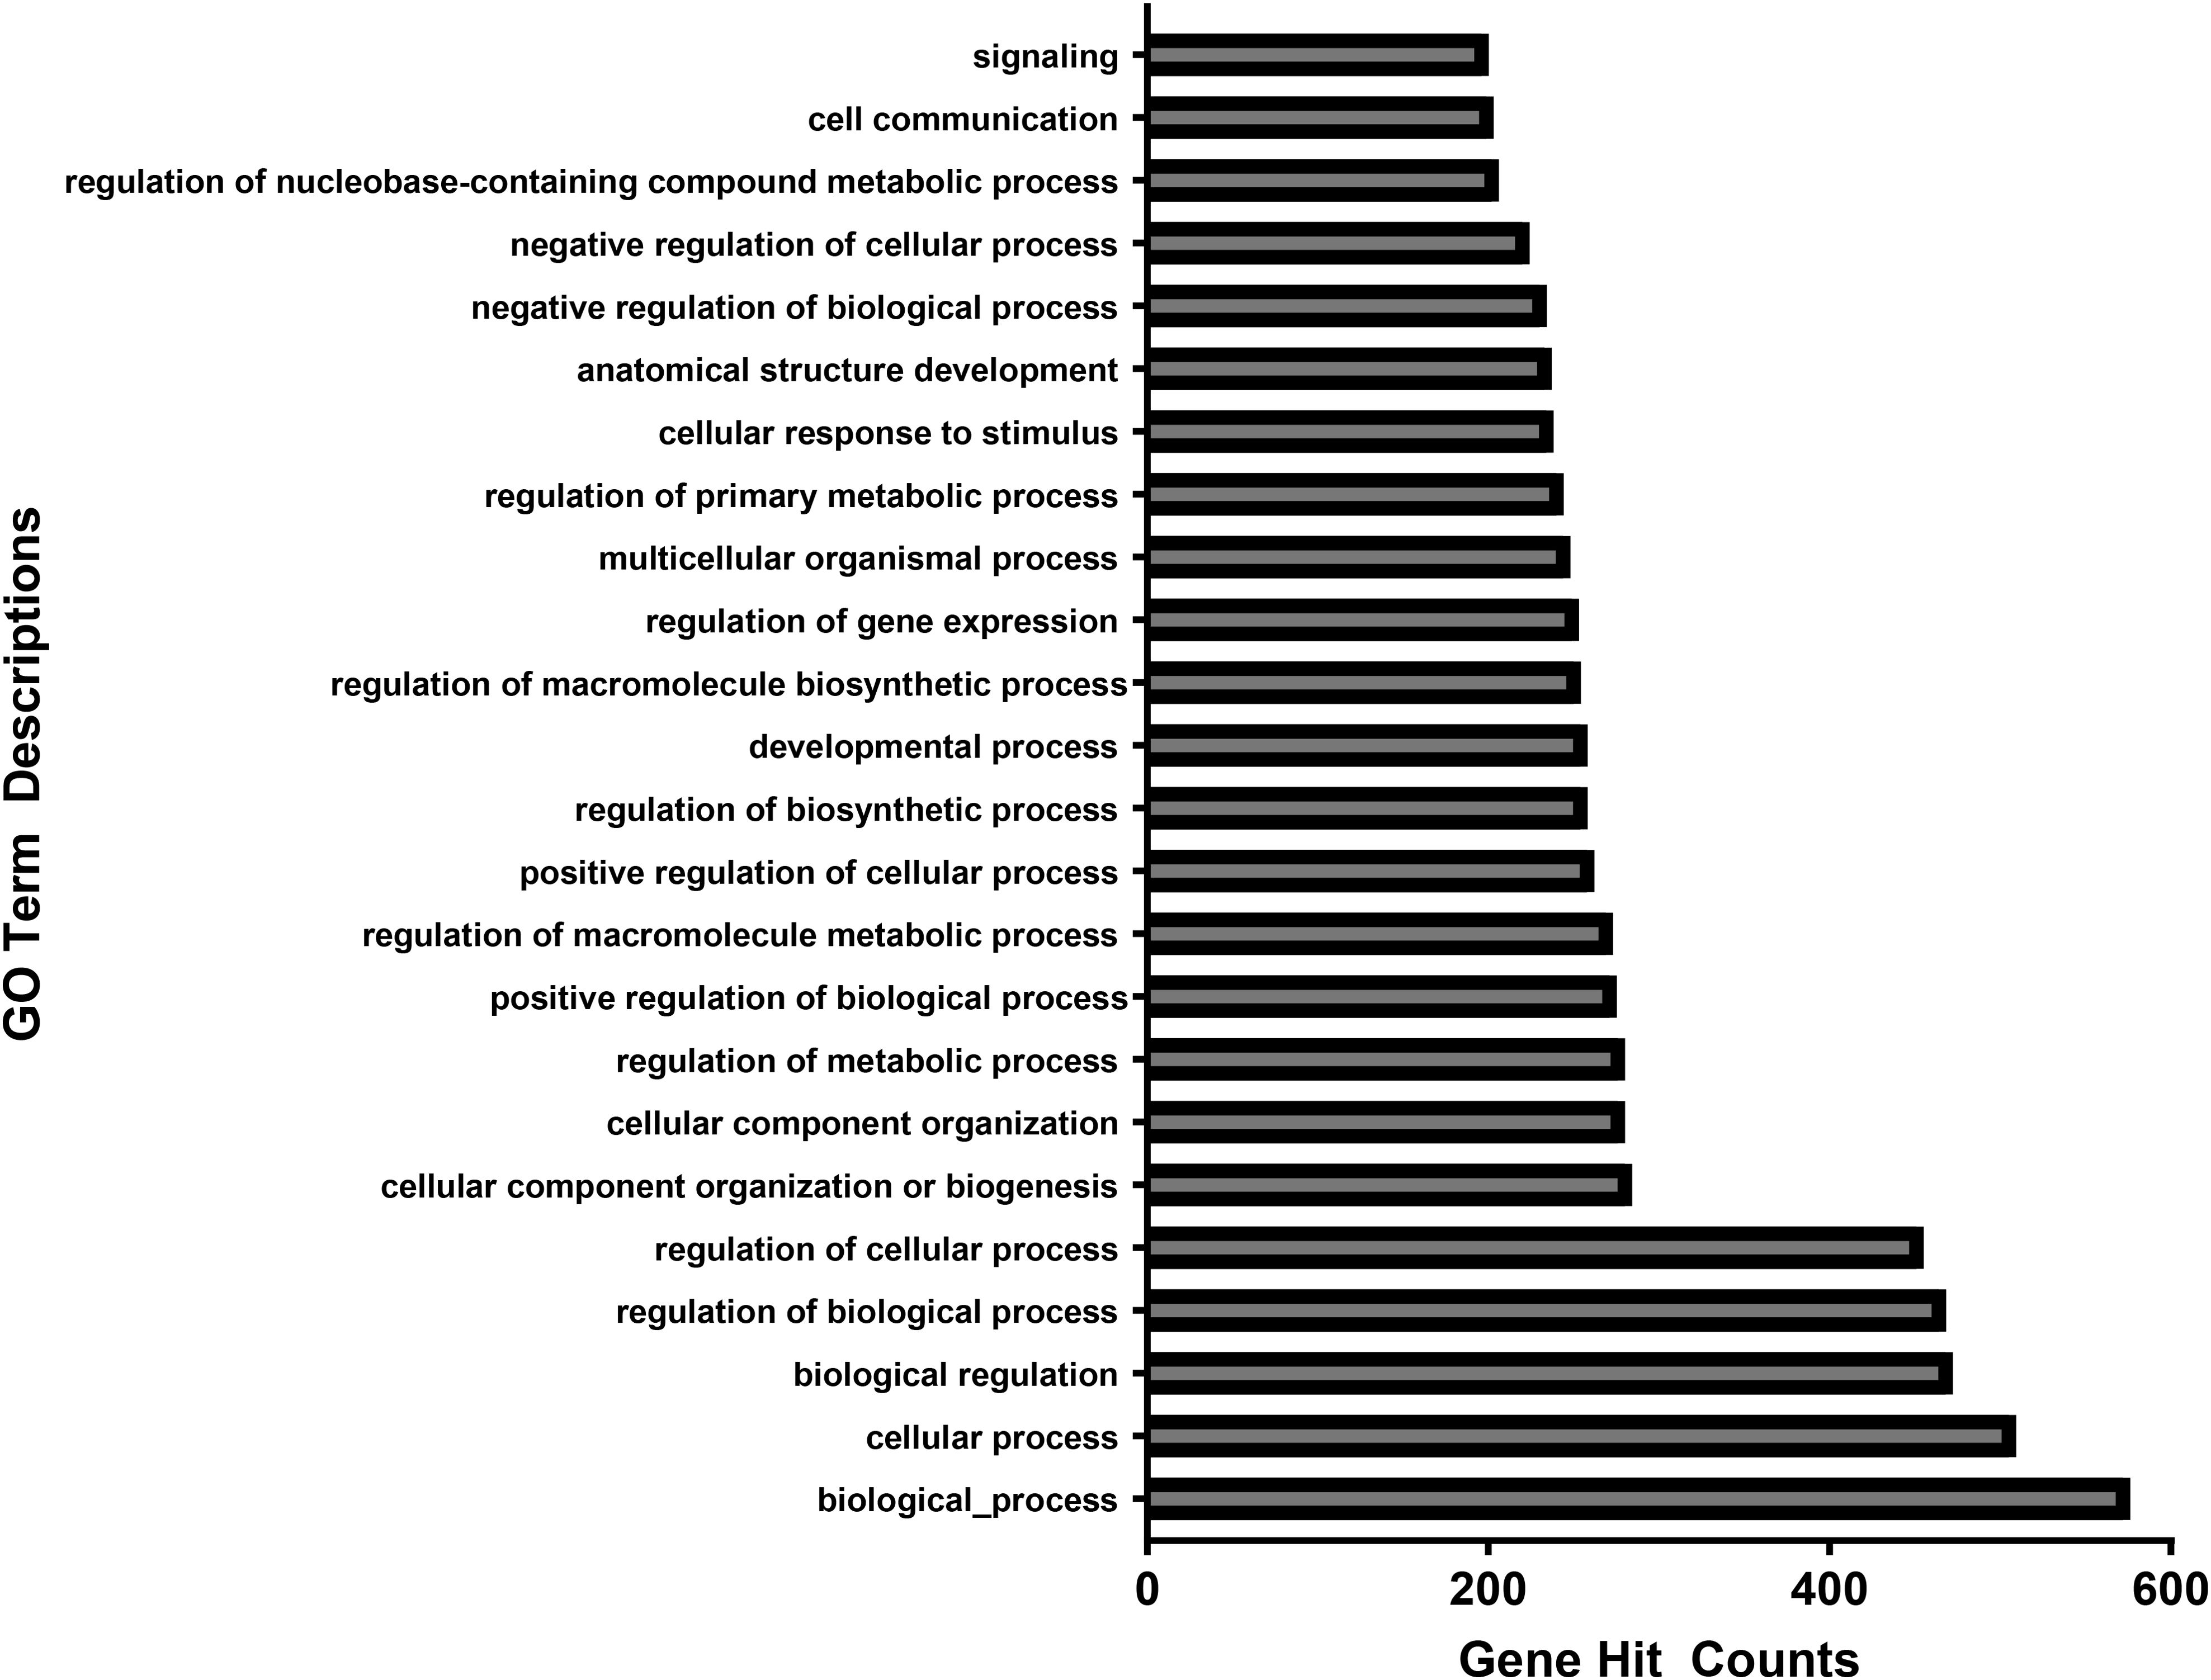
Figure 4. Associated gene counts for each GO term. Terms are arranged in order of total gene hit counts. 926 genes were uploaded into the GO database. From the 622 gene IDs that were accepted and processed, 570 had uniquely mapped IDs. Terms with less than 200 gene counts were omitted from this figure.
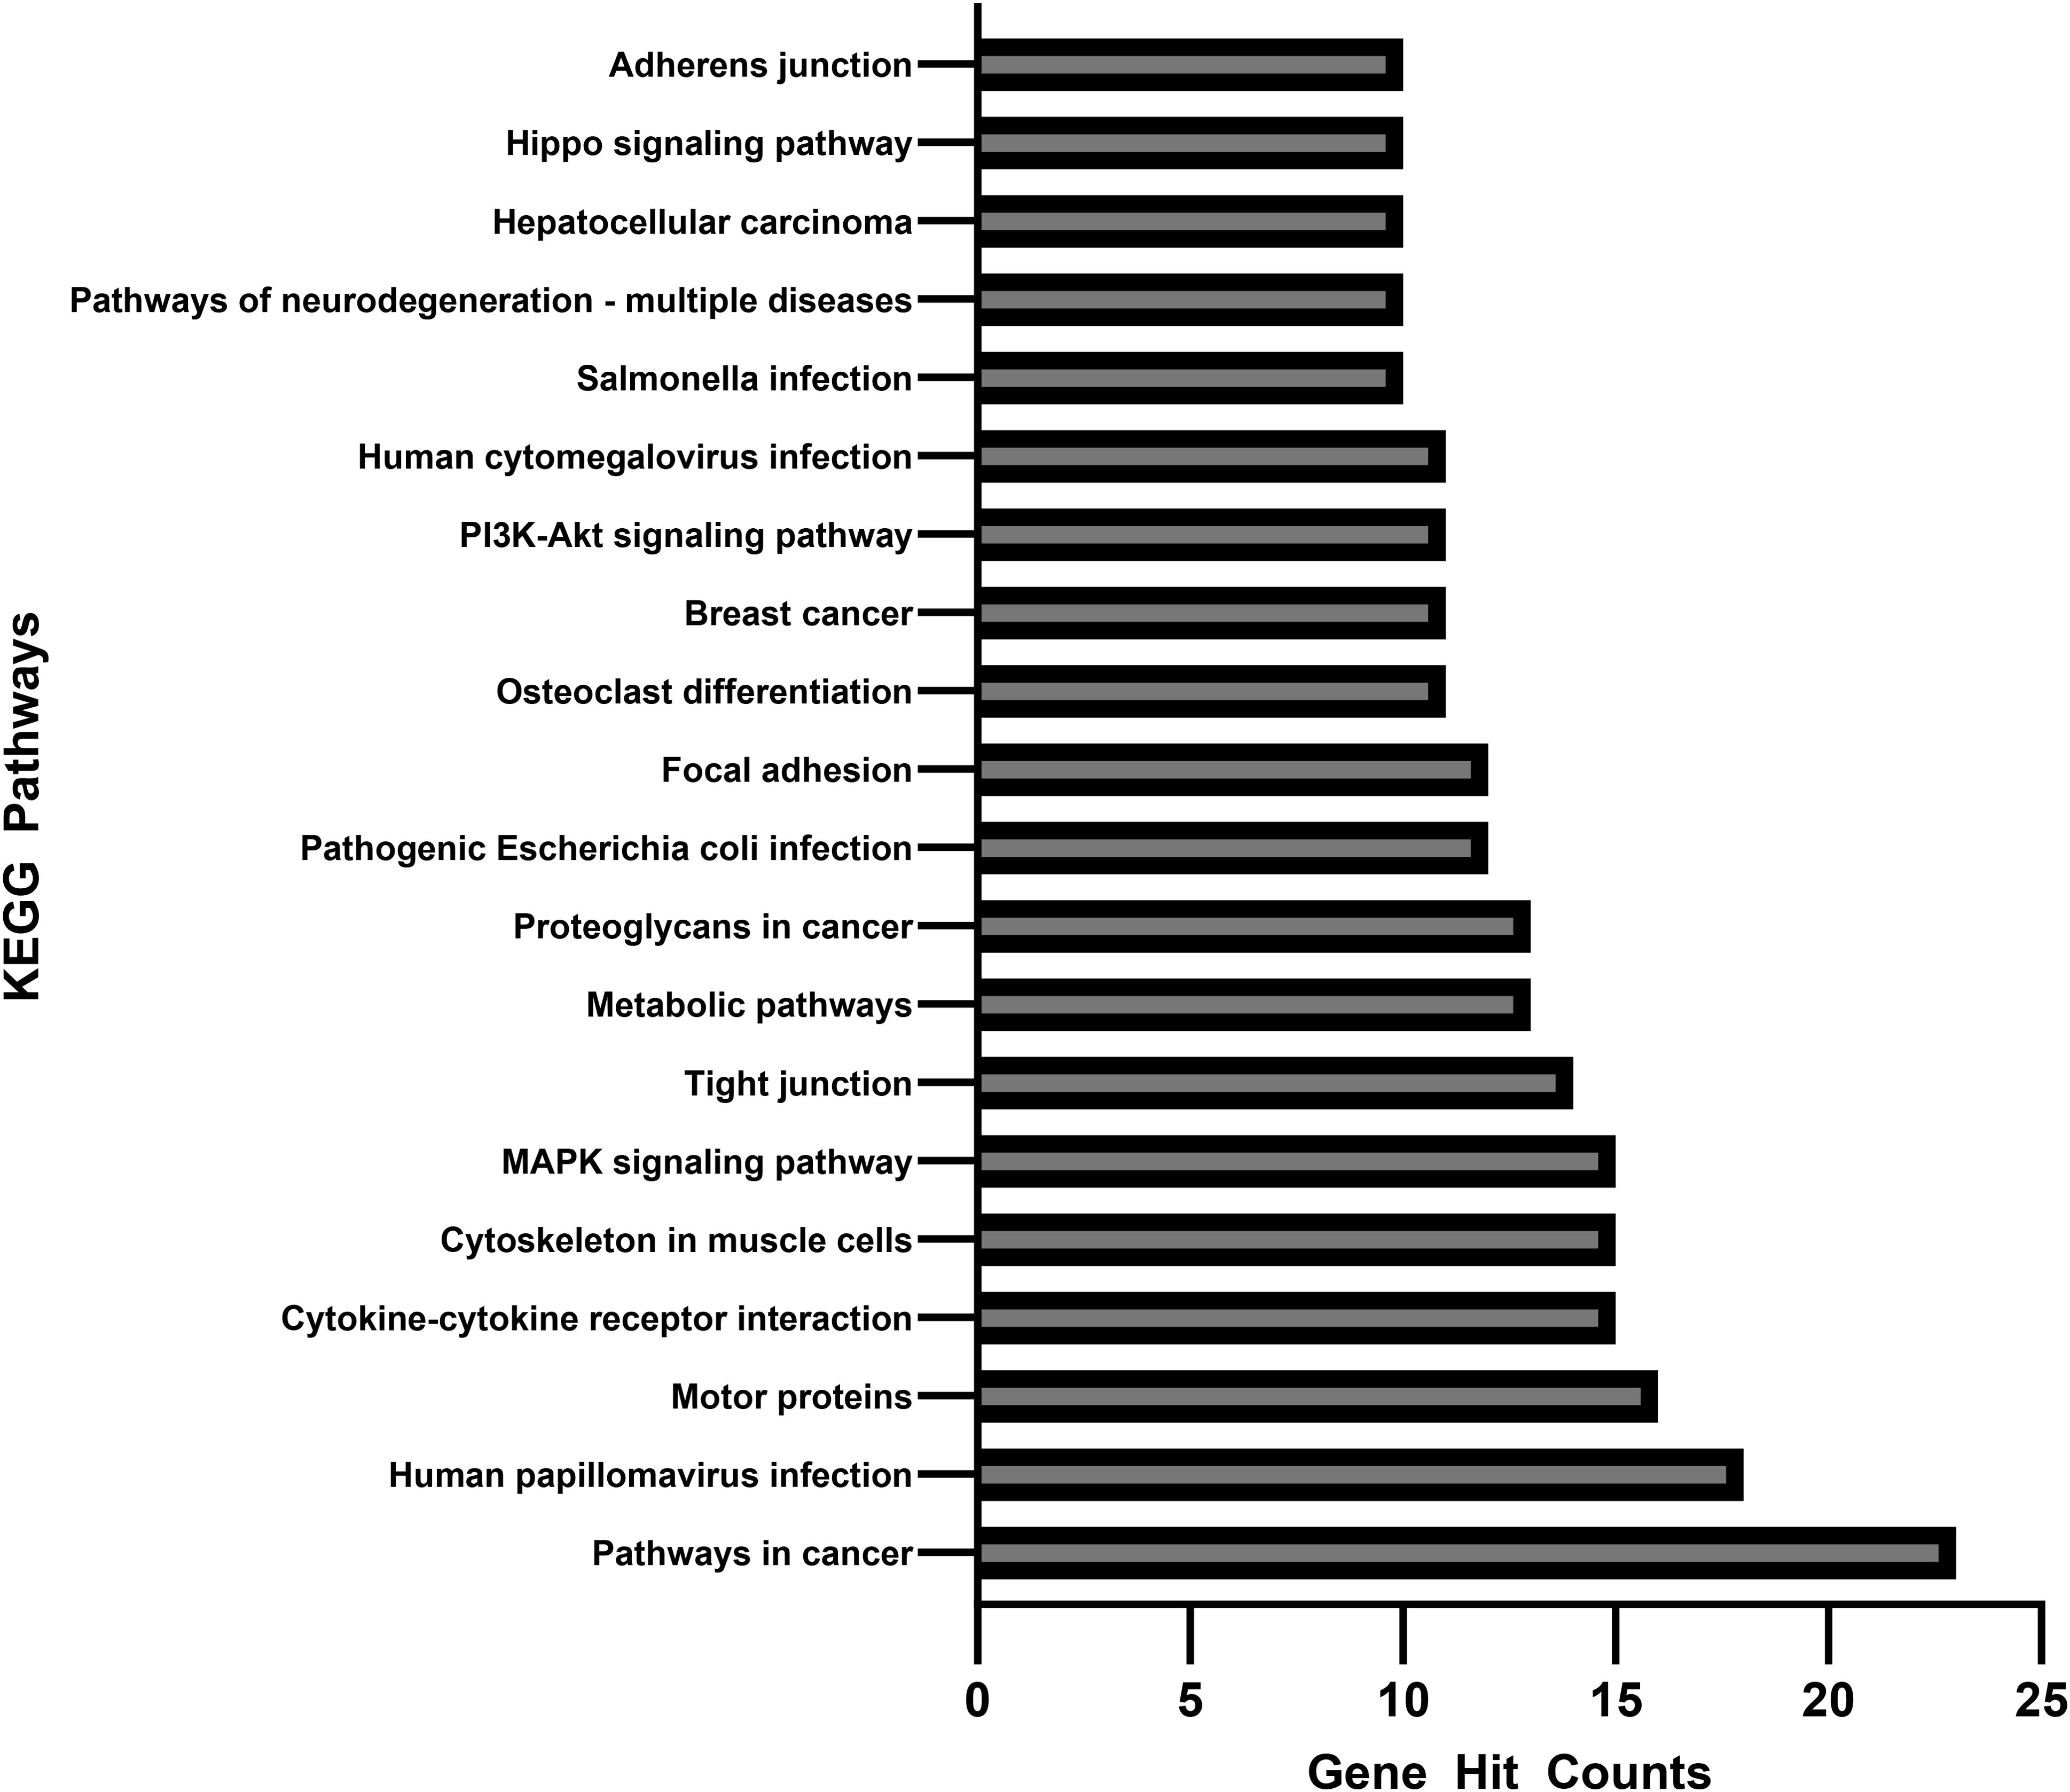
Figure 5. Associated gene counts for each KEGG pathway. Terms are arranged in order of total gene hit counts. 926 genes were uploaded into the KEGG database, and 368 were accepted and processed. Terms with less than 10 gene counts were omitted from this figure.
Figure 4 shows the number of genes associated with each GO term. Of the 926 genes uploaded into the GO database, 622 were accepted and able to be processed. 570 of those 622 genes had uniquely mapping gene IDs. GO terms with less than 200 associated gene counts were omitted from the figures. Each GO term in the final figure represented broad categories of cellular function, hence the high numbers of associated genes.
These differentially expressed genes were then input into the GO database to reveal common processes regulated by the affected genes with a hierarchical distance of 3 from the root biological process (2). For the upregulated genes, the most common GO terms were G protein-coupled receptor signaling pathway, negative regulation of cell population proliferation, cell differentiation, angiogenesis, humoral immune response, regulation of cell cycle, necroptotic signaling pathway, monoatomic ion transmembrane transport, osteoblast differentiation, vascular endothelial growth factor production, positive regulation of cell population proliferation, mitotic cell cycle, regulation of cell population proliferation, spermatogenesis, response to xenobiotic stimulus, microtubule-based movement, and actin cytoskeleton organization.
The downregulated genes had GO terms related to purinergic nucleotide & adenosine cell surface receptor signaling pathway, G protein-coupled receptor signaling pathway, innate immune response, negative regulation of cell population proliferation, response to a virus, positive regulation of phagocytosis, defense response, negative regulation of immune response, adaptive immune response, follicular dendritic cell activation, spermatogenesis, chemotaxis, negative regulation of immune response, the establishment of localization in cell, negative regulation of cytokine production, response to bacterium, and defense response.
The most common GO pathways for the apical compartment cells were chemokine receptor signaling, cell cycling, and humoral responses (upregulated) and G protein-coupled receptor signaling, innate and adaptive immune responses, and phagocytosis (downregulated). The pathways for the basal cells were cell differentiation, actin cytoskeleton organization, microtubule movement, response to xenobiotic stimulus (upregulated) and receptor signaling, chemotaxis, negative regulation of immune response, negative regulation of cytokine production, and defense response (downregulated).
Figure 5 shows the number of genes associated with each KEGG pathway. Of the 926 genes uploaded into the KEGG database, 368 were accepted and able to be processed. Those with less than 10 associated gene counts were omitted from the figures.
The GO database detected a few more upregulated genes in the apical compartment than the KEGG database. However, in the basal compartment, the KEGG database found several more genes to be upregulated than the GO database did. In the same vein, the KEGG database found more genes to be downregulated in both the apical and basal compartments. The common genes found to be upregulated, in both the apical and basal compartment, between the GO and KEGG database include ABL1, CCL3, CCL3L1, ERBB2, FAS, FLNA, FZD9, GADD458, IGF1R, IL1B, MAP3K14, MYC, PLEKHG5, PMAIP1, ROCK2, THBS1, TJP1, and TNF. However, fewer common genes were downregulated in both the apical and basal compartments than upregulated. These include ADORA3, ATP6V0D2, CCR5, CR1, FCGR2B, FPR1, HLA-G, ZNF2, ZNF98.
The top 10 GO terms found to be upregulated in the apical compartment include GO:0071346, cellular response to type II interferon; GO:0030593, neutrophil chemotaxis; GO:0043065, positive regulation of apoptotic process; GO:0071407, cellular response to organic cyclic compound; GO:0048245, eosinophil chemotaxis; GO:0070098, chemokine-mediated signaling pathway; GO:0030198, extracellular matrix organization; GO:0043123, positive regulation of I-kappaB kinase/NF-kappaB signaling; GO:0051897, positive regulation of protein kinase B signaling; GO:0019722, calcium-mediated signaling.
The top 10 GO terms found to be downregulated in the apical compartment include GO:0006355, regulation of DNA-templated transcription; GO:0030183, B cell differentiation; GO:0043123, positive regulation of I-kappaB kinase/NF-kappaB signaling; GO:0043318, negative regulation of cytotoxic T cell degranulation; GO:0002430, complement receptor-mediated signaling pathway; GO:0050869, negative regulation of B cell activation; GO:0002865, negative regulation of acute inflammatory response to antigenic stimulus; GO:0002924, negative regulation of humoral immune response mediated by circulating immunoglobulin; GO:2001199, negative regulation of dendritic cell differentiation; GO:0002763, positive regulation of myeloid leukocyte differentiation.
The top 10 GO terms found to be upregulated in the basal compartment include GO:0043066, negative regulation of apoptotic process; GO:0006355, regulation of DNA-templated transcription; GO:0006468, protein phosphorylation; GO:0006338, chromatin remodeling; GO:0043065, positive regulation of apoptotic process; GO:0042981, regulation of apoptotic process; GO:0006897, endocytosis; GO:0006281, DNA repair; GO:0030198, extracellular matrix organization; GO:0006334, nucleosome assembly.
The top 10 GO terms found to be downregulated in the basal compartment include GO:0006355, regulation of DNA-templated transcription; GO:0035589, G protein-coupled purinergic nucleotide receptor signaling pathway; GO:0001973, G protein-coupled adenosine receptor signaling pathway; GO:0019722, calcium-mediated signaling; GO:2001199, negative regulation of dendritic cell differentiation; GO:0043552, positive regulation of phosphatidylinositol 3-kinase activity; GO:0070098, chemokine-mediated signaling pathway; GO:0051496, positive regulation of stress fiber assembly; GO:1902600, proton transmembrane transport; GO:0016241, regulation of macroautophagy.
The top 10 KEGG pathways for upregulated genes in the apical compartment include hsa04060, cytokine-cytokine receptor interaction; hsa05142, Chagas disease; hsa05163, human cytomegalovirus infection; hsa05417, lipid and atherosclerosis; hsa04620, toll-like receptor signaling pathway; hsa05323, rheumatoid arthritis; hsa04010, MAPK signaling pathway; hsa04061, viral protein interaction with cytokine and cytokine receptor; hsa05165, human papillomavirus infection; hsa05200, pathways in cancer.
The top 10 KEGG pathways for downregulated genes in the apical compartment include hsa05168, Herpes simplex virus 1 infection; hsa04380, osteoclast differentiation; hsa04662, B cell receptor signaling pathway; hsa05150, Staphylococcus aureus infection; hsa04080, neuroactive ligand-receptor interaction; hsa04141, protein processing in endoplasmic reticulum; hsa04613, neutrophil extracellular trap formation; hsa05152, tuberculosis; hsa04020, calcium signaling pathway; hsa04145, phagosome.
The top 10 KEGG pathways for upregulated genes in the basal compartment include hsa05200, pathways in cancer; hsa04814, motor proteins; hsa04530, tight junction; hsa05225, hepatocellular carcinoma; hsa04010, MAPK signaling pathway; hsa04510, focal adhesion; hsa05132, salmonella infection; hsa05205, proteoglycans in cancer; hsa01100, metabolic pathways; hsa05130, pathogenic Escherichia coli infection.
The top 10 KEGG pathways for downregulated genes in the basal compartment include hsa05168, Herpes simplex virus 1 infection; hsa01100, metabolic pathways; hsa04145, phagosome; hsa05203, viral carcinogenesis; hsa00190, oxidative phosphorylation; hsa04080, neuroactive ligand-receptor interaction; hsa05152, tuberculosis; hsa05165, human papillomavirus infection; hsa04060, cytokine-cytokine receptor interaction; hsa04142, lysosome.
By adding KEGG pathway analysis to this data set, this study can provide a more complete depiction of the genes affected by respiratory sensitizers (39–42). The genes that are discovered as upregulated by KEGG, but not by GO terms include ACTN4, AFDN, AXIN2, CACNG4, CDH1, COL4A2, COL4A5, CSF1, CTTN, DEGS2, DNMT1, DUSP1, DUSP2, ENTPD2, G6PD, HBEGF, HEY1, ITGB4, ITPR3, JAG2, LAMA5, MAP3K10, MGAT5BI, MTR, MYH14, MYH9, MYO10, NOTCH3, PPP1R12A, PTGER4, TCF7L2, TPR, TUBB4A, XYLT2 (Figure 6A). The genes that are discovered as downregulated by KEGG but not by GO terms include ALDOC, CRB3, DNAJC5B, FPR3, GRIK2, IFITM1, IL31RA, P2RX1, RXFP1, SELPLG, SIRPB1, TEC, UQCRHL, ZFP14, ZNF10, ZNF230, ZNF250, ZNF324, ZNF416, ZNF420, ZNF436, ZNF549, ZNF561, ZNF566, ZNF586, ZNF606, ZNF627, ZNF671, ZNF773, ZNF816, ZNF845 (Figure 6B). With KEGG pathway analysis, many genes that were perturbed when using the GO database were noticed as insignificant. This demonstrates the need to use multiple databases when performing pathway analysis to understand the effects of respiratory sensitizers or other irritants.
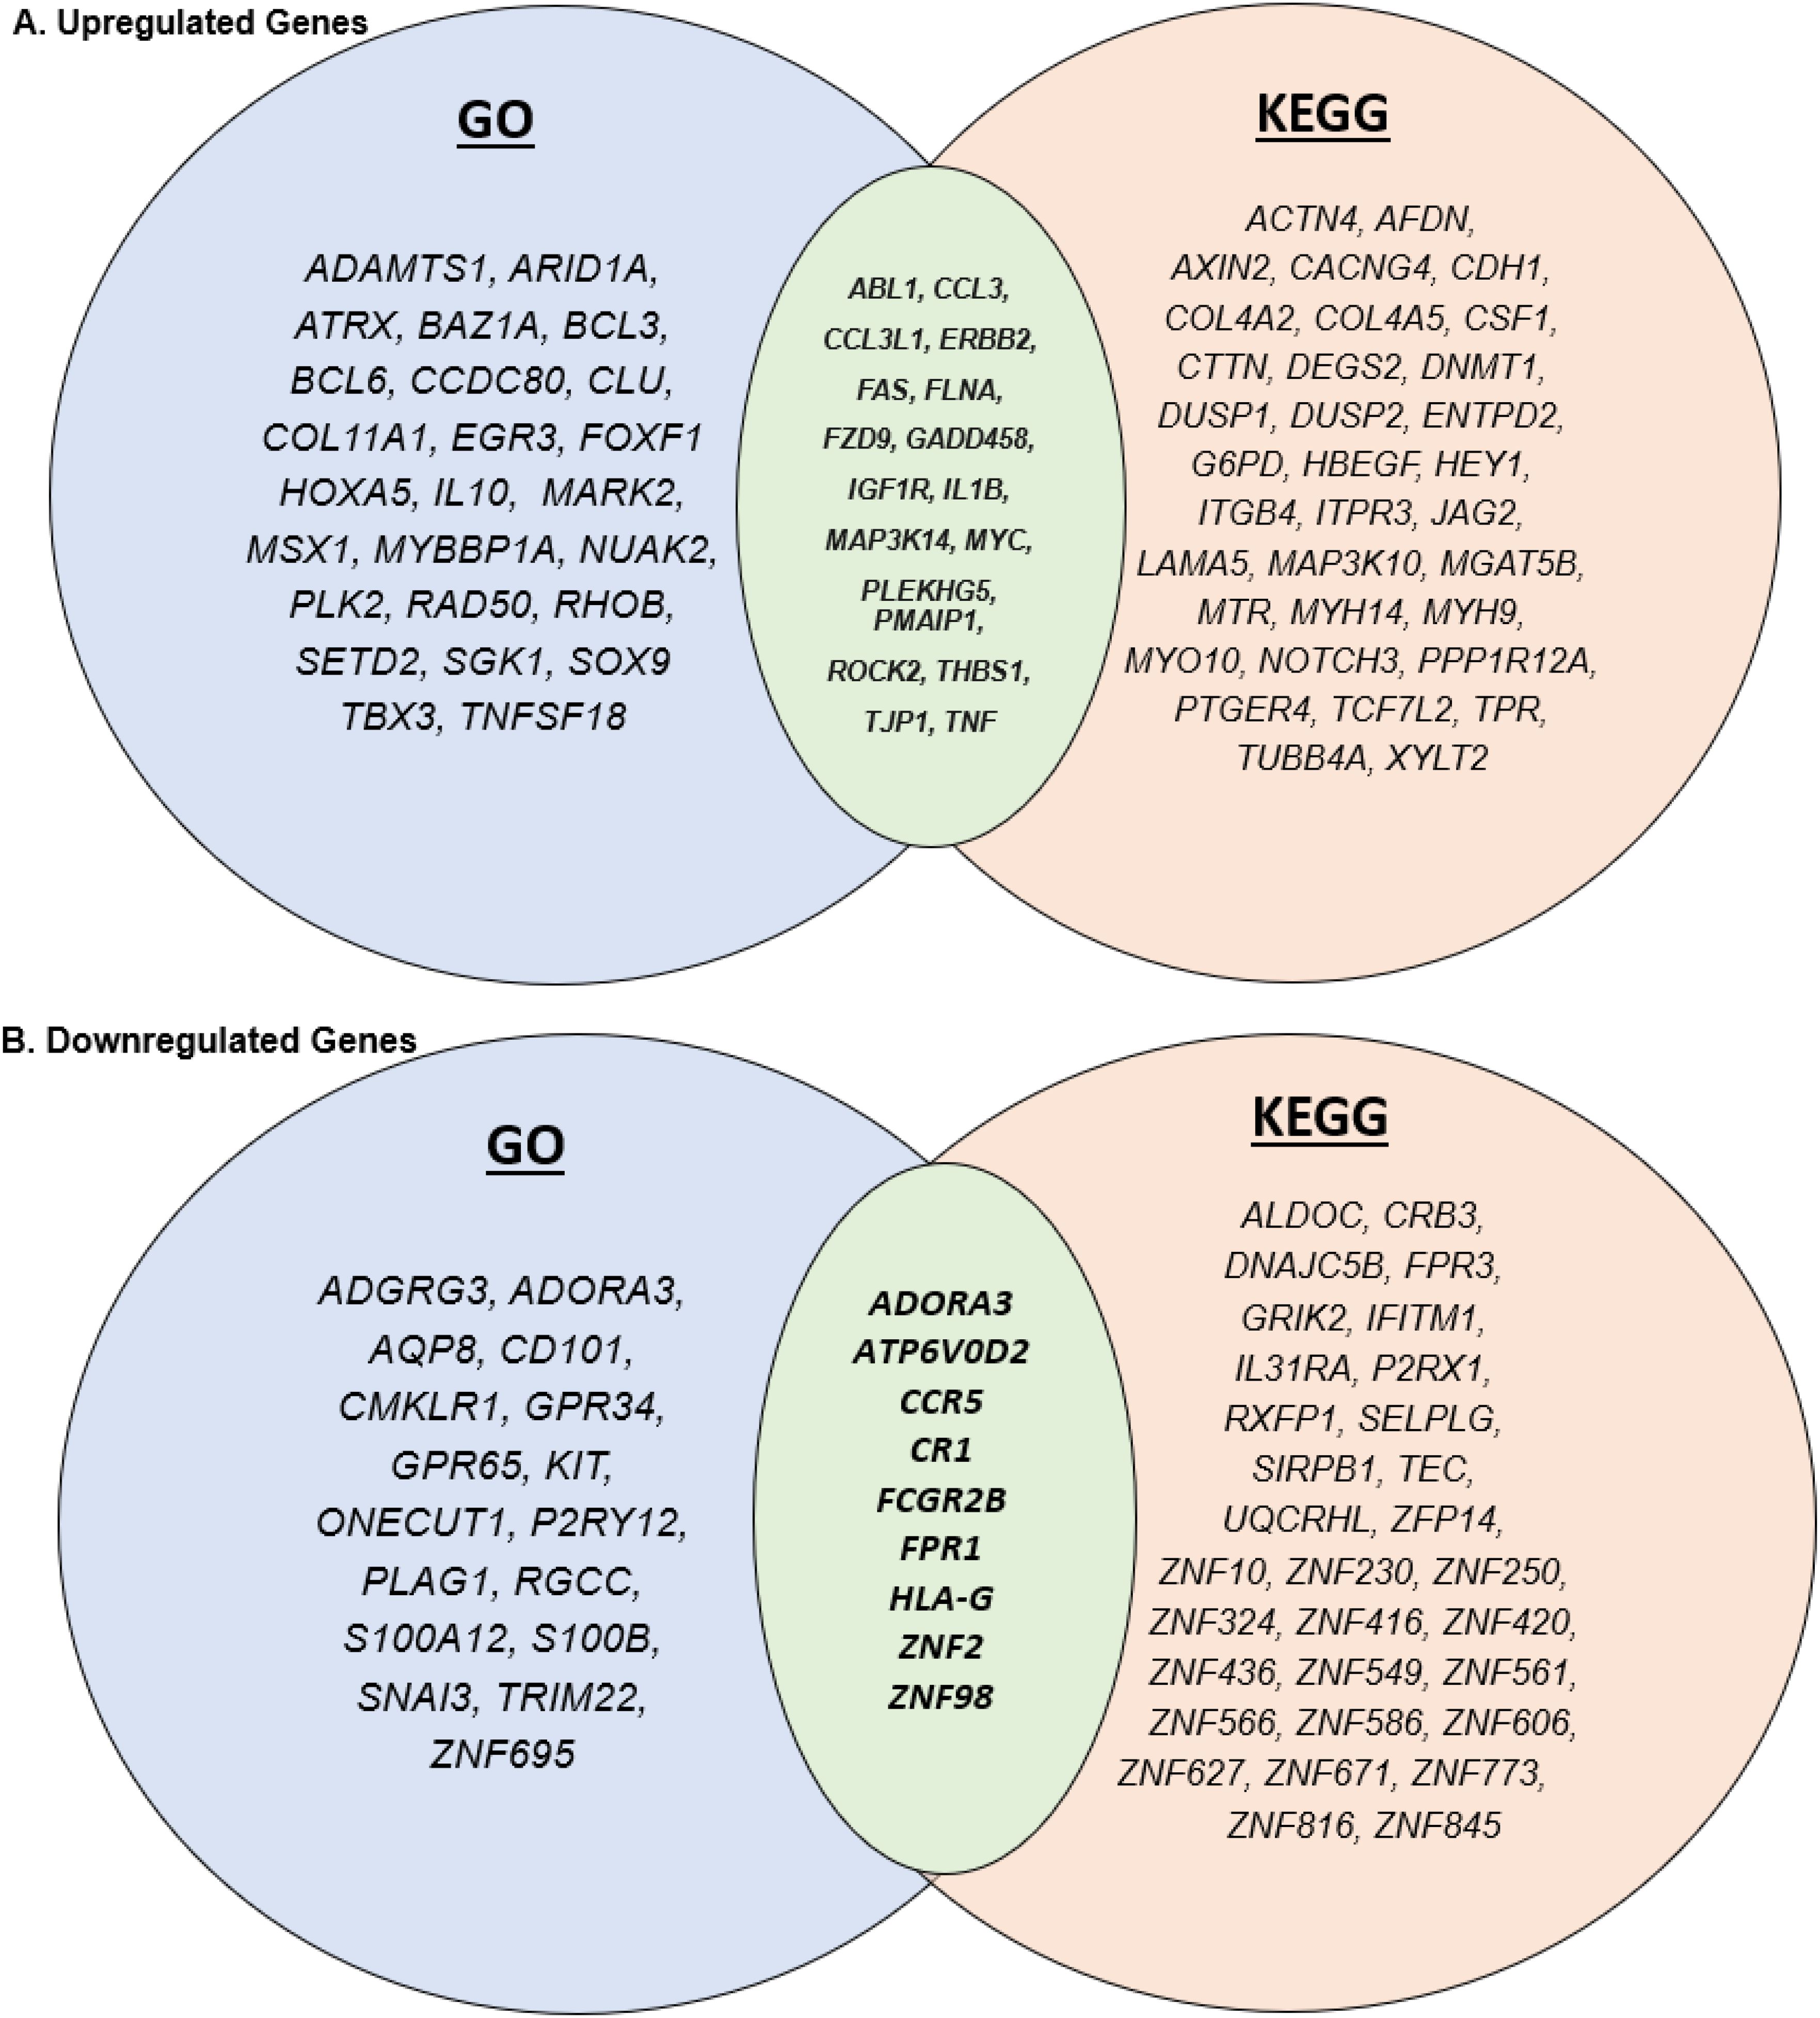
Figure 6. Venn diagrams depicting the similarities and differences between genes associated with GO and KEGG. (A) The common upregulated genes and (B) the common downregulated genes in KEGG and GO analyses.
Discussion
The GO database groups genes based on different subjects and qualities to develop a database that can annotate genes, gene products, and sequences (20). Specifically, GO seeks to integrate consistent gene product descriptors and standardize classifications for sequences and their features (29, 32). KEGG analysis aids in developing a list of related genes and assembling those genes into a proposed biological pathway. The resultant data can be used to probe protein interaction networks (43). These have shown to be beneficial when used together, such as reviewing chemicals to determine the difference between carcinogens and non-carcinogens and other toxic properties of chemicals that may prevent human exposure to harmful substances (38, 43–45).
While both databases are useful for pathway analysis, they are structured differently to be useful in different scenarios. While the KEGG database may be easier to understand due to its list-like structure, the GO database is used for a more complex view of the relationships between gene functions (30, 44). Therefore, choosing which databases to use is up to the researcher based on the study’s goals.
In a previous study, the GO database was used to evaluate the different biological processes affected by exposure to respiratory sensitizers (2). A variety of genes was found to be differentially expressed between cell culture models exposed to sensitizers versus non-sensitizers. The cells contained in the apical compartment of the model, the epithelial (A549) and macrophage (U937) cells, were compared to those cultured in the basal compartment, the dendritic cells (THP-1).
Gene expression is fundamentally related to protein expression; an excess or deficiency of proteins could lead to disease onset. Chen et al. (2015) (52) pre-classified drug-target interactions (DTI) and mapped a benchmark dataset consisting of 2,015 drugs that were assigned to nine biological endpoint categories (G protein-coupled receptors, cytokine receptors, nuclear receptors, ion channels, transporters, enzymes, kinases, antigens, and pathogens) using gene ontology and KEGG pathway enrichment analysis (38). The same research team, in 2016, connected the toxic properties of 171,266 chemicals retrieved from the Accelrys Toxicity Database (40). The categories of toxicity effects used in the analysis included acute toxicity, mutagenicity, tumorigenicity, skin and eye irritation, and reproductive effects.
Many other in vitro assays have previously focused on utilizing transcriptomic signatures to identify respiratory sensitizers. These assess the expression of genes related to the immune system, inflammatory cytokines, and associated cell signaling pathways (29, 44, 45). Other notable upregulated pathways for respiratory sensitizers included oxidative phosphorylation; ubiquinone metabolism; cytoplasmic/mitochondrial transport of proapoptotic proteins Bid, Bmf, and Bim; astrocyte differentiation; cell cycle regulation via Nek; ATP and ITP metabolism; dynein-dynactin motor complex in axonal transport; and insulin regulation of translation (29). Several of these pathways were also confirmed to be upregulated in this analysis. Many of these pathways are consistent when compared to the adverse outcome pathway for sensitization of the respiratory tract by low-molecular-weight chemicals presented by Sullivan et al. (42).
Though past research has investigated leveraging transcriptomics to identify respiratory sensitizers and distinguish sensitization types, most focus on a narrow set of endpoints: immune cell recruitment and inflammatory signaling pathways. Additionally, previous work has only considered upregulated genes, yet downregulated genes, which are considered here, also play a role in which proteins are present in the cellular environment. Finally, most previous studies used a monoculture cell model for data generation. This study expands this view of transcriptomics to a broader range of outcomes and uses data from a triculture model to create a more robust and physiologically relevant dataset. This work combines features from past studies with KEGG and GO data to build a more nuanced understanding of the genes and pathways affected by respiratory sensitization (46–54).
Conclusions
The upregulated and downregulated genes identified through GO and KEGG analyses represent strong candidates for biomarker identification in respiratory sensitization. These pathways require further toxicological analyses. Developing a more comprehensive understanding of how the genes and pathways affect human health outcomes is essential for better understanding respiratory sensitization. Additionally, for future data analyses, utilizing the GO and KEGG analysis results is a powerful tool for identifying potential biomarkers related to adverse health conditions.
Data availability statement
The datasets presented in this study can be found in online repositories. The names of the repository/repositories and accession number(s) can be found below: PRJNA1141533 (BioProject).
Ethics statement
Ethical approval was not required for the studies on animals in accordance with the local legislation and institutional requirements because only commercially available established cell lines were used.
Author contributions
CS: Conceptualization, Data curation, Formal analysis, Funding acquisition, Investigation, Methodology, Project administration, Resources, Software, Supervision, Writing – original draft, Writing – review & editing. TJ: Formal analysis, Investigation, Methodology, Writing – original draft. JL: Conceptualization, Data curation, Investigation, Methodology, Software, Writing – review & editing. KG: Formal analysis, Investigation, Methodology, Writing – original draft. MG: Data curation, Investigation, Writing – review & editing.
Funding
The author(s) declare financial support was received for the research, authorship, and/or publication of this article. We thank the Henry F. Jackson Foundation (Agreement 5055/PO 979338/Award 64695) for financially supporting this research.
Conflict of interest
The authors declare that the research was conducted in the absence of any commercial or financial relationships that could be construed as a potential conflict of interest.
The author(s) declared that they were an editorial board member of Frontiers, at the time of submission. This had no impact on the peer review process and the final decision.
Publisher’s note
All claims expressed in this article are solely those of the authors and do not necessarily represent those of their affiliated organizations, or those of the publisher, the editors and the reviewers. Any product that may be evaluated in this article, or claim that may be made by its manufacturer, is not guaranteed or endorsed by the publisher.
References
1. Gibb M, Sayes C. An in vitro alveolar model allows for the rapid assessment of chemical respiratory sensitization with modifiable biomarker endpoints. Chemico-Biological Interact. (2022) 368:110232. doi: 10.1016/j.cbi.2022.110232
2. Gibb M, Liu JY, Sayes CM. The transcriptomic signature of respiratory sensitizers using an alveolar model. Cell Biol Toxicol. (2024) 40:21. doi: 10.1007/s10565-024-09860-x
3. Cao X, Coyle JP, Xiong R, Wang Y, Heflich RH, Ren B, et al. Invited review: human air-liquid-interface organotypic airway tissue models derived from primary tracheobronchial epithelial cells—overview and perspectives. In Vitro. Cell Dev Biology-Animal. (2021) 57:104–32. doi: 10.1007/s11626-020-00517-7
4. Clausen PA, Frederiksen M, Sejbæk CS, Sørli JB, Hougaard KS, Frydendall KB, et al. Chemicals inhaled from spray cleaning and disinfection products and their respiratory effects. A comprehensive review. Int J hygiene Environ Health. (2020) 229:113592. doi: 10.1016/j.ijheh.2020.113592
5. Mack SM, Madl AK, Pinkerton KE. Respiratory health effects of exposure to ambient particulate matter and bioaerosols. Compr Physiol. (2019) 10:1. doi: 10.1002/cphy.c180040
6. Noda J, Tomizawa S, Takahashi K, Morimoto K, Mitarai S. Air pollution and airborne infection with mycobacterial bioaerosols: a potential attribution of soot. Int J Environ Sci Technol. (2021) p:1–10. doi: 10.1007/s13762-021-03203-7
7. North CM, Ezendam J, Hotchkiss JA, Maier C, Aoyama K, Enoch S, et al. Developing a framework for assessing chemical respiratory sensitization: a workshop report. Regul Toxicol Pharmacol. (2016) 80:295–309. doi: 10.1016/j.yrtph.2016.06.006
8. Meth MJ, Sperber KE. Phenotypic diversity in delayed drug hypersensitivity: an immunologic explanation. Mount Sinai J Med. (2006) 73:769–76.
9. Arts JH, Kuper CF, Spoor SM, Bloksma N. Airway morphology and function of rats following dermal sensitization and respiratory challenge with low molecular weight chemicals. Toxicol Appl Pharmacol. (1998) 152:66–76. doi: 10.1006/taap.1998.8504
10. Leikauf GD. Hazardous air pollutants and asthma. Environ Health Perspect. (2002) 110:505–26. doi: 10.1289/ehp.02110s4505
11. Dharmage SC, Perret JL, Custovic A. Epidemiology of asthma in children and adults. Front Pediatr. (2019) 7:246. doi: 10.3389/fped.2019.00246
12. Pronk A, Preller L, Raulf-Heimsoth M, Jonkers IC, Lammers JW, Wouters IM, et al. Respiratory symptoms, sensitization, and exposure–response relationships in spray painters exposed to isocyanates. Am J Respir Crit Care Med. (2007) 176:1090–7. doi: 10.1164/rccm.200702-215OC
13. Alves VM, Capuzzi SJ, Muratov EN, Braga RC, Thornton TE, Fourches D, et al. QSAR models of human data can enrich or replace LLNA testing for human skin sensitization. Green Chem. (2016) 18:6501–15. doi: 10.1039/C6GC01836J
14. García-Campos MA, Espinal-Enríquez J, Hernández-Lemus E. Pathway analysis: state of the art. Front Physiol. (2015) 6:170515. doi: 10.3389/fphys.2015.00383
15. Khatri P, Sirota M, Butte AJ. Ten years of pathway analysis: current approaches and outstanding challenges. PloS Comput Biol. (2012) 8:e1002375. doi: 10.1371/journal.pcbi.1002375
16. Papin JA, Stelling J, Price ND, Klamt S, Schuster S, Palsson BO, et al. Comparison of network-based pathway analysis methods. Trends Biotechnol. (2004) 22:400–5. doi: 10.1016/j.tibtech.2004.06.010
17. KEGG: Kyoto Encyclopedia of Genes and Genomes. (2024). Available online at: https://www.genome.jp/kegg/ (Accessed July 29, 2024).
18. Gene ontology resource. Gene Ontology. (2024). https://geneontology.org/ (Accessed July 29 2024).
19. Ashburner M, Ball CA, Blake JA, Botstein D, Butler H, Cherry JM, et al. Gene ontology: tool for the unification of biology. Nat Genet. (2000) 25:25–9. doi: 10.1038/75556
20. Consortium GO. The Gene Ontology (GO) database and informatics resource. Nucleic Acids Res. (2004) 32:D258–61. doi: 10.1093/nar/gkh036
21. Consortium GO. The gene ontology resource: 20 years and still GOing strong. Nucleic Acids Res. (2019) 47:D330–8. doi: 10.1093/nar/gky1055
22. Du Plessis L, Škunca N, Dessimoz C. The what, where, how and why of gene ontology—a primer for bioinformaticians. Briefings Bioinf. (2011) 12:723–35. doi: 10.1093/bib/bbr002
23. Baxter EW, Graham AE, Re NA, Carr IM, Robinson JI, Mackie SL, et al. Standardized protocols for differentiation of THP-1 cells to macrophages with distinct M(IFNγ+LPS), M(IL-4) and M(IL-10) phenotypes. J Immunol Methods. (2020) 478:112721. doi: 10.1016/j.jim.2019.112721
24. Pollmächer J, Figge MT. Agent-based model of human alveoli predicts chemotactic signaling by epithelial cells during early Aspergillus fumigatus infection. PloS One. (2014) 9:e111630. doi: 10.1371/journal.pone.0111630
25. Sayes CM, Singal M. The link between delivered aerosol dose and inflammatory responses: Exposing a lung cell co-culture system to selected allergens and irritants. J Aerosol Sci. (2021) 151:105677. doi: 10.1016/j.jaerosci.2020.105677
26. Drasler B, Karakocak BB, Tankus EB, Barosova H, Abe J, Sousa de Almeida M, et al. An inflamed human alveolar model for testing the efficiency of anti-inflammatory drugs in vitro. Front bioengineering Biotechnol. (2020) 8:987. doi: 10.3389/fbioe.2020.00987
27. Lehmann AD, Daum N, Bur M, Lehr CM, Gehr P, Rothen-Rutishauser BM, et al. An in vitro triple cell co-culture model with primary cells mimicking the human alveolar epithelial barrier. Eur J Pharmaceutics Biopharmaceutics. (2011) 77:398–406. doi: 10.1016/j.ejpb.2010.10.014
28. Prasad A, Sedlářová M, Balukova A, Ovsii A, Rác M, Křupka M, et al. Reactive oxygen species imaging in U937 cells. Front Physiol. (2020) 11:552569. doi: 10.3389/fphys.2020.552569
29. Forreryd A, Johansson H, Albrekt AS, Borrebaeck CA, Lindstedt M. Prediction of chemical respiratory sensitizers using GARD, a novel in vitro assay based on a genomic biomarker signature. PloS One. (2015) 10:e0118808. doi: 10.1371/journal.pone.0118808
31. Stadler J, Karol MH. Experimental delayed hypersensitivity following inhalation of dicyclohexylmethane-4, 4′-diisocyanate: a concentration-response relationship. Toxicol Appl Pharmacol. (1984) 74:244–9. doi: 10.1016/0041-008X(84)90149-2
32. Nakazawa T, Matsui S. Ethylenediamine-induced late asthmatic responses. J Asthma. (1990) 27:207–12. doi: 10.3109/02770909009073328
33. Vandenplas O, Cartier A, Lesage J, Cloutier Y, Perreault G, Grammer LC, et al. Prepolymers of hexamethylene diisocyanate as a cause of occupational asthma. J Allergy Clin Immunol. (1993) 91:850–61. doi: 10.1016/0091-6749(93)90342-D
34. Willhite C, Book S. Toxicology update: chlorobenzene. J Appl Toxicol. (1990) 10:307–10. doi: 10.1002/jat.2550100414
35. Yu L, Fernandez S, Brock G. Power analysis for RNA-Seq differential expression studies. BMC Bioinf. (2017) 18:1–9. doi: 10.1186/s12859-017-1648-2
36. Ogata H, Goto S, Fujibuchi W, Kanehisa M. Computation with the KEGG pathway database. Biosystems. (1998) 47:119–28. doi: 10.1016/S0303-2647(98)00017-3
37. Kanehisa M, Furumichi M, Tanabe M, Sato Y, Morishima K. KEGG: new perspectives on genomes, pathways, diseases and drugs. Nucleic Acids Res. (2017) 45:D353–61. doi: 10.1093/nar/gkw1092
38. Chen L, Chu C, Lu J, Kong X, Huang T, Cai YD, et al. Gene ontology and KEGG pathway enrichment analysis of a drug target-based classification system. PloS One. (2015) 10:e0126492. doi: 10.1371/journal.pone.0126492
39. Ding J, Zhang Y. Analysis of key GO terms and KEGG pathways associated with carcinogenic chemicals. Combinatorial Chem High throughput screening. (2017) 20:861–71. doi: 10.2174/1386207321666171218120133
40. Chen L, Zhang YH, Zou Q, Chu C, Ji Z. Analysis of the chemical toxicity effects using the enrichment of Gene Ontology terms and KEGG pathways. Biochim Biophys Acta (BBA)-General Subj. (2016) 1860:2619–26. doi: 10.1016/j.bbagen.2016.05.015
41. Schmid R, Blaxter ML. annot8r: GO, EC and KEGG annotation of EST datasets. BMC Bioinf. (2008) 9:1–6. doi: 10.1186/1471-2105-9-180
42. Sullivan KM, Enoch SJ, Ezendam J, Sewald K, Roggen EL, Cochrane S, et al. An adverse outcome pathway for sensitization of the respiratory tract by low-molecular-weight chemicals: Building evidence to support the utility of in vitro and in silico methods in a regulatory context. Appl In Vitro Toxicol. (2017) 3:213–26. doi: 10.1089/aivt.2017.0010
43. Kanehisa M. (2002). The KEGG database, in: In silico’simulation of biological processes: Novartis Foundation Symposium 247, 247. Wiley Online Library.
44. Huang S, Wiszniewski L, Constant S, Roggen E. Potential of in vitro reconstituted 3D human airway epithelia (MucilAir™) to assess respiratory sensitizers. Toxicol Vitro. (2013) 27:1151–6. doi: 10.1016/j.tiv.2012.10.010
45. Remy S, Verstraelen S, Van Den Heuvel R, Nelissen I, Lambrechts N, Hooyberghs J, et al. Gene expressions changes in bronchial epithelial cells: Markers for respiratory sensitizers and exploration of the NRF2 pathway. Toxicol Vitro. (2014) 28:209–17. doi: 10.1016/j.tiv.2013.10.017
46. Cruse JM, Lewis RE. Types I, II, III, and IV hypersensitivity. Atlas Immunol. (1999) p:225–45. doi: 10.1007/978-3-662-11196-3
47. Czarnobilska E, Obtułowicz K, Wsołek K. Type IV of hypersensitivity and its subtypes. Przeglad lekarski. (2007) 64:506–8.
48. Marwa K, Kondamudi N IV. Type IV hypersensitivity reaction. Treasure Island (FL: StatPearls Publishing (2021).
49. Paur H-R, Cassee FR, Teeguarden J, Fissan H, Diabate S, Aufderheide M, et al. In-vitro cell exposure studies for the assessment of nanoparticle toxicity in the lung—A dialog between aerosol science and biology. J aerosol Sci. (2011) 42:668–92. doi: 10.1016/j.jaerosci.2011.06.005
50. Biaglow J, Greenstock C, Durand R. Effects of sensitizers on cell respiration: 1. Factors influencing the effects of hypoxic cell radiosensitizers on oxygen utilization of tumour and cultured mammalian cells. Br J Cancer. Supplement. (1978) 3:145.
51. Hermanns M, Kasper J, Unger RE, Carpentier G, Roggen EL, Kirkpatrick CJ. Assessment of respiratory sensitizers: Cytokine responses in a 3D alveolo-capillary barrier model in vitro. Advanced Biomaterials Devices Med. (2015) 2:1–9.
52. Verstraelen S, Bloemen K, Nelissen I, Witters H, Schoeters G, Van Den Heuvel R, et al. Cell types involved in allergic asthma and their use in in vitro models to assess respiratory sensitization. Toxicol Vitro. (2008) 22:1419–31. doi: 10.1016/j.tiv.2008.05.008
53. Chary A, Serchi T, Moschini E, Hennen J, Cambier S, Ezendam J, et al. An in vitro coculture system for the detection of sensitization following aerosol exposure. ALTEX-Alternatives to Anim experimentation. (2019) 36:403–18. doi: 10.14573/altex.1901241
Keywords: KEGG, GO, immune, immunoregulation, pathway analysis
Citation: Jefferis T, Liu JY, Griffin KL, Gibb M and Sayes CM (2025) Gene regulation and signaling pathways in immune response to respiratory sensitizers: a database analysis. Front. Immunol. 16:1470602. doi: 10.3389/fimmu.2025.1470602
Received: 29 July 2024; Accepted: 10 February 2025;
Published: 03 March 2025.
Edited by:
Andrzej Lange, Polish Academy of Sciences, PolandReviewed by:
Rob Vandebriel, National Institute for Public Health and the Environment, NetherlandsJosje Arts, Nouryon, Netherlands
Copyright © 2025 Jefferis, Liu, Griffin, Gibb and Sayes. This is an open-access article distributed under the terms of the Creative Commons Attribution License (CC BY). The use, distribution or reproduction in other forums is permitted, provided the original author(s) and the copyright owner(s) are credited and that the original publication in this journal is cited, in accordance with accepted academic practice. No use, distribution or reproduction is permitted which does not comply with these terms.
*Correspondence: Christie M. Sayes, Q2hyaXN0aWVfc2F5ZXNAYmF5bG9yLmVkdQ==
†ORCID: Taylor Jefferis, orcid.org/0009-0004-9040-5884
James Y. Liu, orcid.org/0000-0002-2652-940X
Kiera L. Griffin, orcid.org/0009-0001-2409-7076
Matthew Gibb, orcid.org/0000-0002-6774-9943
Christie M. Sayes, orcid.org/0000-0002-5529-4101