 Xin Lai1†
 Shaoliang Wang1†Xuanping Zhang1
 Xiaoyan Zhu1
 Yuqian Liu1Zhili Chang1,2Xiaonan Wang1,2
 Yang Shao2,3
 Jiayin Wang1*
 Yixuan Wang4*
- 1School of Computer Science and Technology, Faculty of Electronics and Information Engineering, Xi’an Jiaotong University, Xi’an, Shaanxi, China
- 2Geneseeq Research Institute, Nanjing Geneseeq Technology Inc., Nanjing, Jiangsu, China
- 3School of Public Health, Nanjing Medical University, Nanjing, Jiangsu, China
- 4Department of Biomedical Engineering, College of Automation Engineering, Nanjing University of Aeronautics and Astronautics, Nanjing, China
Tumor mutation burden (TMB), defined as the number of somatic mutations of tumor DNA, is a well-recognized immunotherapy biomarker endorsed by regulatory agencies and pivotal in stratifying patients for clinical decision-making. However, measurement errors can compromise the accuracy of TMB assessments and the reliability of clinical outcomes, introducing bias into statistical inferences and adversely affecting TMB thresholds through cumulative and magnified effects. Given the unavoidable errors with current technologies, it is essential to adopt modeling methods to determine the optimal TMB-positive threshold. Therefore, we proposed a universal framework, TMBocelot, which accounts for pairwise measurement errors in clinical data to stabilize the determination of hierarchical thresholds. TMBocelot utilizes a Bayesian approach based on the stationarity principle of Markov chains to implement an enhanced error control mechanism, utilizing moderately informative priors. Simulations and retrospective data from 438 patients reveal that TMBocelot outperforms conventional methods in terms of accuracy, consistency of parameter estimations, and threshold determination. TMBocelot enables precise and reliable delineation of TMB-positive thresholds, facilitating the implementation of immunotherapy. The source code for TMBocelot is publicly available at https://github.com/YixuanWang1120/TMBocelot.
Introduction
Immune checkpoint inhibitors (ICIs), exemplified by Programmed Cell Death-1 (PD-1)/Programmed Death-ligand 1 (PD-L1) inhibitors, have conferred significant clinical benefits across various cancer types (1–7). However, these benefits are not universal; only a subset of patients respond favorably to ICIs. Accurately identifying patients who are most likely to benefit from immunotherapy is crucial for optimizing treatment strategies and improving patient outcomes.
Tumor mutation burden (TMB), quantifies the number of somatic mutations per megabase of tumor DNA and has emerged as a key biomarker for predicting responses to ICIs. A higher TMB suggests a greater likelihood of producing neoantigens—novel proteins recognized as foreign by the immune system—which can enhance immune detection and elimination of cancer cells (11–13). Regulatory agencies worldwide have endorsed TMB as the sole guiding biomarker for pan-cancer immunotherapy applications (8–10). Determining the optimal TMB threshold that defines a “TMB-positive” patient is of paramount therapeutic importance for clinical decision-making (14, 15). An appropriate threshold assists clinicians in effectively screening potentially superior patients, ensuring effective treatment while avoiding unnecessary side effects in patients less likely to benefit. Optimizing this threshold is critical for maximizing therapeutic efficacy and personalizing cancer care.
Nevertheless, standardizing TMB thresholds is complicated by two significant computational challenges. First, the benefits of immunotherapy are multifaceted, encompassing measurable tumor shrinkage and prolonged survival (16). Effective patient selection should consider all relevant clinical outcomes. Integrating multiscale clinical endpoints—such as tumor response rates and survival times—into a single predictive model requires advanced statistical methods capable of handling different data types and relationships. Secondly, accurate measurement of TMB and assessment of clinical outcomes involve inherent uncertainties and potential errors (17–19). For TMB, factors such as tumor heterogeneity, variations in sequencing technologies, computational algorithm differences, and tumor purity can introduce inaccuracies (20–22). As a result, the measured TMB (labeled with ) is an approximation of the true value, expressed as , where represents measurement error may not conventionally adhere to parametric statistical distributions. Correspondingly, clinical endpoints paired with TMB, especially tumor response, also entail a high risk of measurement error. The assessment of objective tumor response is often based on imaging criteria like the Response Evaluation Criteria in Solid Tumors (RECIST 1.1) (21), determined by a single measurement of the maximum tumor diameter in the axial plane (29) and is categorized into different statuses. The precision of response labels can be affected by measurement precision, reader interpretation, image quality, and patient-specific factors (30, 31). These noises may likewise introduce error perturbations to endpoint observations, . Errors are transmitted and amplified to the patient screening stage with downstream estimation derivations, further destroying the consistency of inference and meddling with thresholds. The formula derivations and schematic diagrams in the Supplementary Material illustrate the impact of pairwise error in immunotherapy. These measurement errors can distort the true relationship between TMB and patient outcomes, leading to unreliable thresholds and potentially suboptimal treatment decisions. Ignoring or mischaracterizing these errors compromises the accuracy of statistical inferences and affects clinical decision-making (17, 23–27).
To effectively address the pairwise errors, we present TMBocelot—an Omnibus statistical Control model Optimizing the TMB Thresholds with systematic measurement errors. The presented methodology can adopt targeted methods to meet the requirements of the error specification, demonstrating the ability to effectively design a judicious pairwise error control mechanism for joint models that incorporate multiscale clinical endpoints. TMBocelot leverages a Bayesian statistical approach, utilizing the properties of Markov chains and incorporating moderately informative priors to model and correct measurement errors in both TMB assessments and clinical outcomes.
Our methodology provides tailored solutions adaptable to different cancer types, measurement error characteristics, and clinical scenarios. The simulations provided empirical evidence supporting our proficiency in accurate estimation and reliability in threshold determination. Additionally, we applied TMBocelot to 4 retrospective cohorts of non-small cell lung cancer (NSCLC) to demonstrate the performance. Results suggest that the proposed model can achieve more comprehensive and robust TMB thresholds, offering valuable insights to enhance the treatment of cancer patients. The code for TMBocelot is available at https://github.com/YixuanWang1120/TMBocelot.
Materials and methods
In clinical practice, errors in data can arise in many forms, ranging from almost negligible in high-quality, expensive techniques to partially observable with the addition of further data. Therefore, it is essential to develop a general framework that can handle different types of errors across these various conditions. The methods described below are tailored to specific scenarios in this study.
Modeling without measurement errors
First, we state a method that does not take into account any error. To accurately determine the TMB-positivity thresholds from multifaceted efficacy analyses, previous work (27, 28) has integrated two types of clinical outcomes: binary tumor response (e.g., responder or non-responder) and continuous time-to-event (TTE) endpoints (e.g., survival or progression-free survival). This integration accounts for the within-subject dependency between these two types of endpoints. For simplicity, we refer to this method as the Bayesian Naïve Method (Bayes-NM).
Specifically, for patient , denotes the tumor response status ( for response and non-response, respectively), denotes clinical covariates (e.g., age, gender, stage of cancer), and denotes the error-free biomarker. The tumor response depends on both the covariates and . We model this using a logistic regression model, which relates the probability of response to these factors:
where represents a vector of unknown parameters.; and denotes regression coefficients for the covariates and ; is a random effect for patient i (accounting for unmeasured individual variations).
Next, for time-to-event analysis, the event time represents the observed time until the occurrence of an event (e.g., tumor recurrence, progression, or death), which is taken as the minimum of the actual event time and the censoring time . Define the event indicator as , where is the indicator function that equals 1 if the event occurs and 0 if censored. For the time-to-event (TTE) data, we use the Cox proportional hazards (Cox-PH) model, which focuses on classifying patients by their survival risks:
where describes the instantaneous risk for patient i at time t; is known as the baseline hazard, typically modeled using the Weibull distribution; and is effect coefficients for the covariates and ; the shared term is a random effect term accounting for correlation between event times and responses. The random effect is assumed to follow a normal distribution , which represented the intra-subject correlation between event times and individual response.
The observed dataset for Bayes-NM is denoted as . Multiscale endpoints (response and survival) can be jointly modeled by incorporating random effects and adjusting for the dependencies between the response probabilities and event times. Formally, the joint likelihood for the data is given by:
The joint log-likelihood function is then:
Inference about parameters is typically based on the maximization of this log-likelihood. Since the likelihood involves random effects, we use Markov Chain Monte Carlo (MCMC) sampling to estimate the posterior distribution of the parameters A.
To begin Bayesian inference, we must specify prior distributions for the unknown parameters. For the regression coefficients and variance components, we use non-informative priors as follows:
These priors reflect weak prior knowledge and allow the data to predominantly drive the posterior estimates.
Once the priors are defined, we use MCMC to sample from the posterior distribution of the parameters. The parameters are estimated as the average of the posterior sample:
where is the k-th sample from the posterior distribution and K is the number of MCMC iterations.
Equations 1, 2, and 4 comprise the core of Bayes-NM, assuming the absence of measurement errors, with further elaboration available in the Supplementary Material.
Modeling under TMB error control
In practice, the measured TMB (i.e. ) is an approximation of the true TMB, due to inherent measurement errors, i.e., , where both and are unobserved potential variables and mutually independent. While external or internal validation sets can sometimes provide information on error characteristics, they may not always be available. This complexity in real-world data necessitates different strategies for handling errors. Below, we describe several methods for addressing these errors in the context of TMB measurement.
Corrected-score for normal TMB error
In certain cases, the error in the measurement of TMB follows a normal distribution with known variance . To address this, we use the Corrected-Score Method (CSM), which is an estimation technique that adjusts for the measurement error in TMB (27). The CSM ensures that the first-order derivative of the likelihood (denoted as ) is unbiased for the true score function, given the true TMB. This property can be written as:
This property means that the expected value of the corrected score is equal to the score based on the true TMB values. The method is conditionally unbiased, meaning it provides a reliable estimate of the parameters when the true TMB is known (32).
Despite its advantages, the CSM has limitations. It assumes that the measurement error eie_iei follows a normal distribution with known variance and cannot handle situations where there is misclassification in the clinical endpoints (e.g., incorrect tumor response classification). If such assumptions are not met, this approach may not perform optimally. In these cases, alternative methods like a non-parametric deconvolution approach (33) could be used to estimate the measurement error distribution.
Robust correction for unspecified TMB error
When there is no prior information about the error distribution, the CSM becomes impractical. To address this limitation, we expand upon the original Bayesian model by treating both TMB and the measurement error as random variables. This extension leads to the Bayesian Error Correction Method (Bayes-ECM), which does not rely on a normal distribution assumption for the measurement error. The Bayes-ECM models the measurement error and the true TMB using Dirichlet Process (DP) priors. Specifically:
where DP stands for Dirichlet Process, a distribution that allows for flexible modeling of uncertainty and is used here to model the uncertainty in the error distribution and the true TMB values (34). The parameters and define the base measure and concentration parameter for the error distribution, and similarly, and define those for the true TMB.
While the Dirichlet Process allows for robust modeling of measurement error and TMB, it yields a random, discontinuous distribution, making continuous density estimation challenging. To overcome this limitation, we convolve the Dirichlet Process with a continuous kernel or treat the Dirichlet Process as a mixing measure over parametric forms (35). Take as a typically finite-dimensional parameter space and let be a continuous probability distribution function for each . Then with may be:
This approach leads to a Gaussian Mixture Model (GMM), which can approximate any distribution with sufficient flexibility (35, 36).
The error distribution for TMB measurement can be expressed as a Gaussian Mixture:
where is the number of mixture components, determined by the data; is the mixing weight for each component, and are the mean and variance of each Gaussian component, respectively.
Similarly, the true TMB values are modeled as:
Where the mixture model allows flexibility in modeling both the true TMB and the measurement errors. The number of components K is determined by the data, providing a robust way to estimate the error distribution without needing external validation sets or prior assumptions. The Supplementary Material will discuss the Gaussian distribution-to-stochastic process conversion and parameter adjustments. Equations 1 and 2 describe the basic regression models for response and survival data, incorporating TMB. Equations 5, 6 describe the Gaussian Mixture Models for the measurement error and the true TMB.
In summary, the Bayes-ECM is a more general and robust approach compared to the CSM. It allows for the modeling of TMB measurement errors without relying on specific distributional assumptions and offers flexibility in cases where no external error information is available.
Modeling under response error control
In addition to errors arising from TMB measurements, paired endpoints, such as clinical response, may also suffer from measurement inaccuracies. While errors in continuous TTE endpoints typically do not have a significant effect on the consistency of the analysis, response misclassification in discrete endpoints can substantially affect model accuracy and predictions. To address this, we propose the Bayesian Misclassification Correction Method (Bayes-MCM), which aims to account for misclassification errors in the observed response.
In this case, the observed is no longer an accurate reflection of the true tumor state but may be a misclassified version of the actual response . To address this, we define the following misclassification parameters:
the probability of correctly classifying a true response (tumor shrinkage) as a positive response.
the probability of correctly classifying a true non-response (no tumor shrinkage) as a negative response.
To incorporate these parameters, the standard mixed-effects logistic regression model for the true response endpoint:
The corresponding model for the observed response is:
where is derived from the logistic regression model.
Previous research (37) has demonstrated that without additional constraints or information, the misclassification parameters and are not practically identifiable. To overcome this limitation, we updated the Bayesian framework by incorporating informative priors and imposing constraints on these parameters. Specifically, the priors are modeled as Beta distributions:
where are constants chosen based on prior knowledge or assumptions about misclassification rates. For example, assumes that the probability of correctly identifying a response is high, but not certain, with a mean of 0.9 and a 95% credible interval of [0.664, 0.997]. Conversely, reflects a strong belief in the reliability of non-response classification, with a mean of 0.98 and a 95% credible interval of [0.917, 0.995]. These priors are constructed to reflect existing knowledge or reasonable assumptions about misclassification rates.
Furthermore, misclassification probabilities may vary across subpopulations, depending on factors such as tumor type, disease stage, or patient demographics. To address this, Bayes-MCM will incorporate hierarchical structures for η and δ, enabling the model to estimate separate parameters for different subgroups. This flexibility allows for tailored misclassification rates that reflect variations based on patient characteristics, such as prior treatments or response patterns.
The core of the Bayes-MCM includes Equations 2, 4, 7, and 8. Full mathematical details and derivations are provided in the Supplementary Material.
Modeling under pairwise error control
While misclassification errors can occur in individual components (like TMB and response endpoints), real-world errors often involve both types of measurements simultaneously. The Bayesian Pairwise Error Correction Method (Bayes-PECM) extends the Bayes-MCM by simultaneously modeling both TMB errors and response misclassification.
In this comprehensive model, Equations 2, 4–8 jointly account for both sources of error. The model is flexible enough to adapt to the uncertainties in both TMB measurements and response misclassification, with details in the Supplementary Material.
Framework for localizing TMB-positive thresholds
The Bayesian framework and pairwise error correction in TMBocelot enable a convergent and comprehensive estimate of ICI benefits for individual patients. By utilizing the joint likelihood to characterize a patient’s factual condition post-treatment and employing TMB as a biomarker, we used TMBcat to identify a stratification threshold based on the cut-off value with the minimum p-value (38, 39). Patients could be categorized into two categories for treatment prognosis comparison based on such a threshold.
We developed a robust framework for determining TMB-positive thresholds, ensuring broad applicability across diverse error scenarios. Depending on the specific context, the corresponding methods outlined above can be applied for parameter estimation, followed by the use of joint probabilities to identify precise TMB thresholds. The complete framework is given in pseudocode in Algorithm 1 and Figure 1A. To facilitate adoption and reproducibility, we provide implementation resources. The source code for TMBocelot, including the full implementation of the Bayesian framework, pairwise error correction, and threshold determination methods, is publicly accessible at https://github.com/YixuanWang1120/TMBocelot. This open-access repository serves as a practical guide for researchers and clinicians. By making the codebase available, we aim to bridge the gap between technical complexity and practical usability, ensuring TMBocelot can be readily integrated into clinical decision-making workflows.
Algorithm 1. Framework for localizing TMB-positive thresholds.
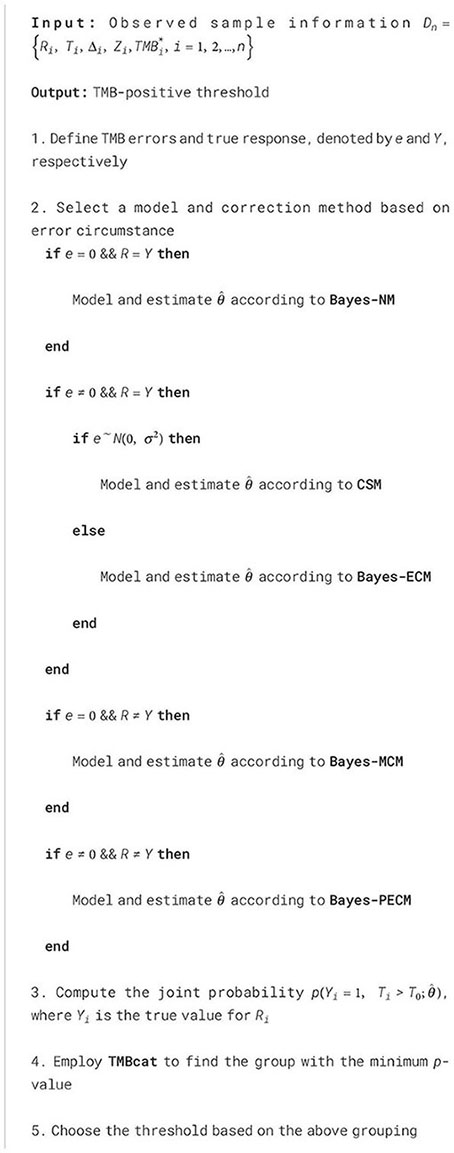
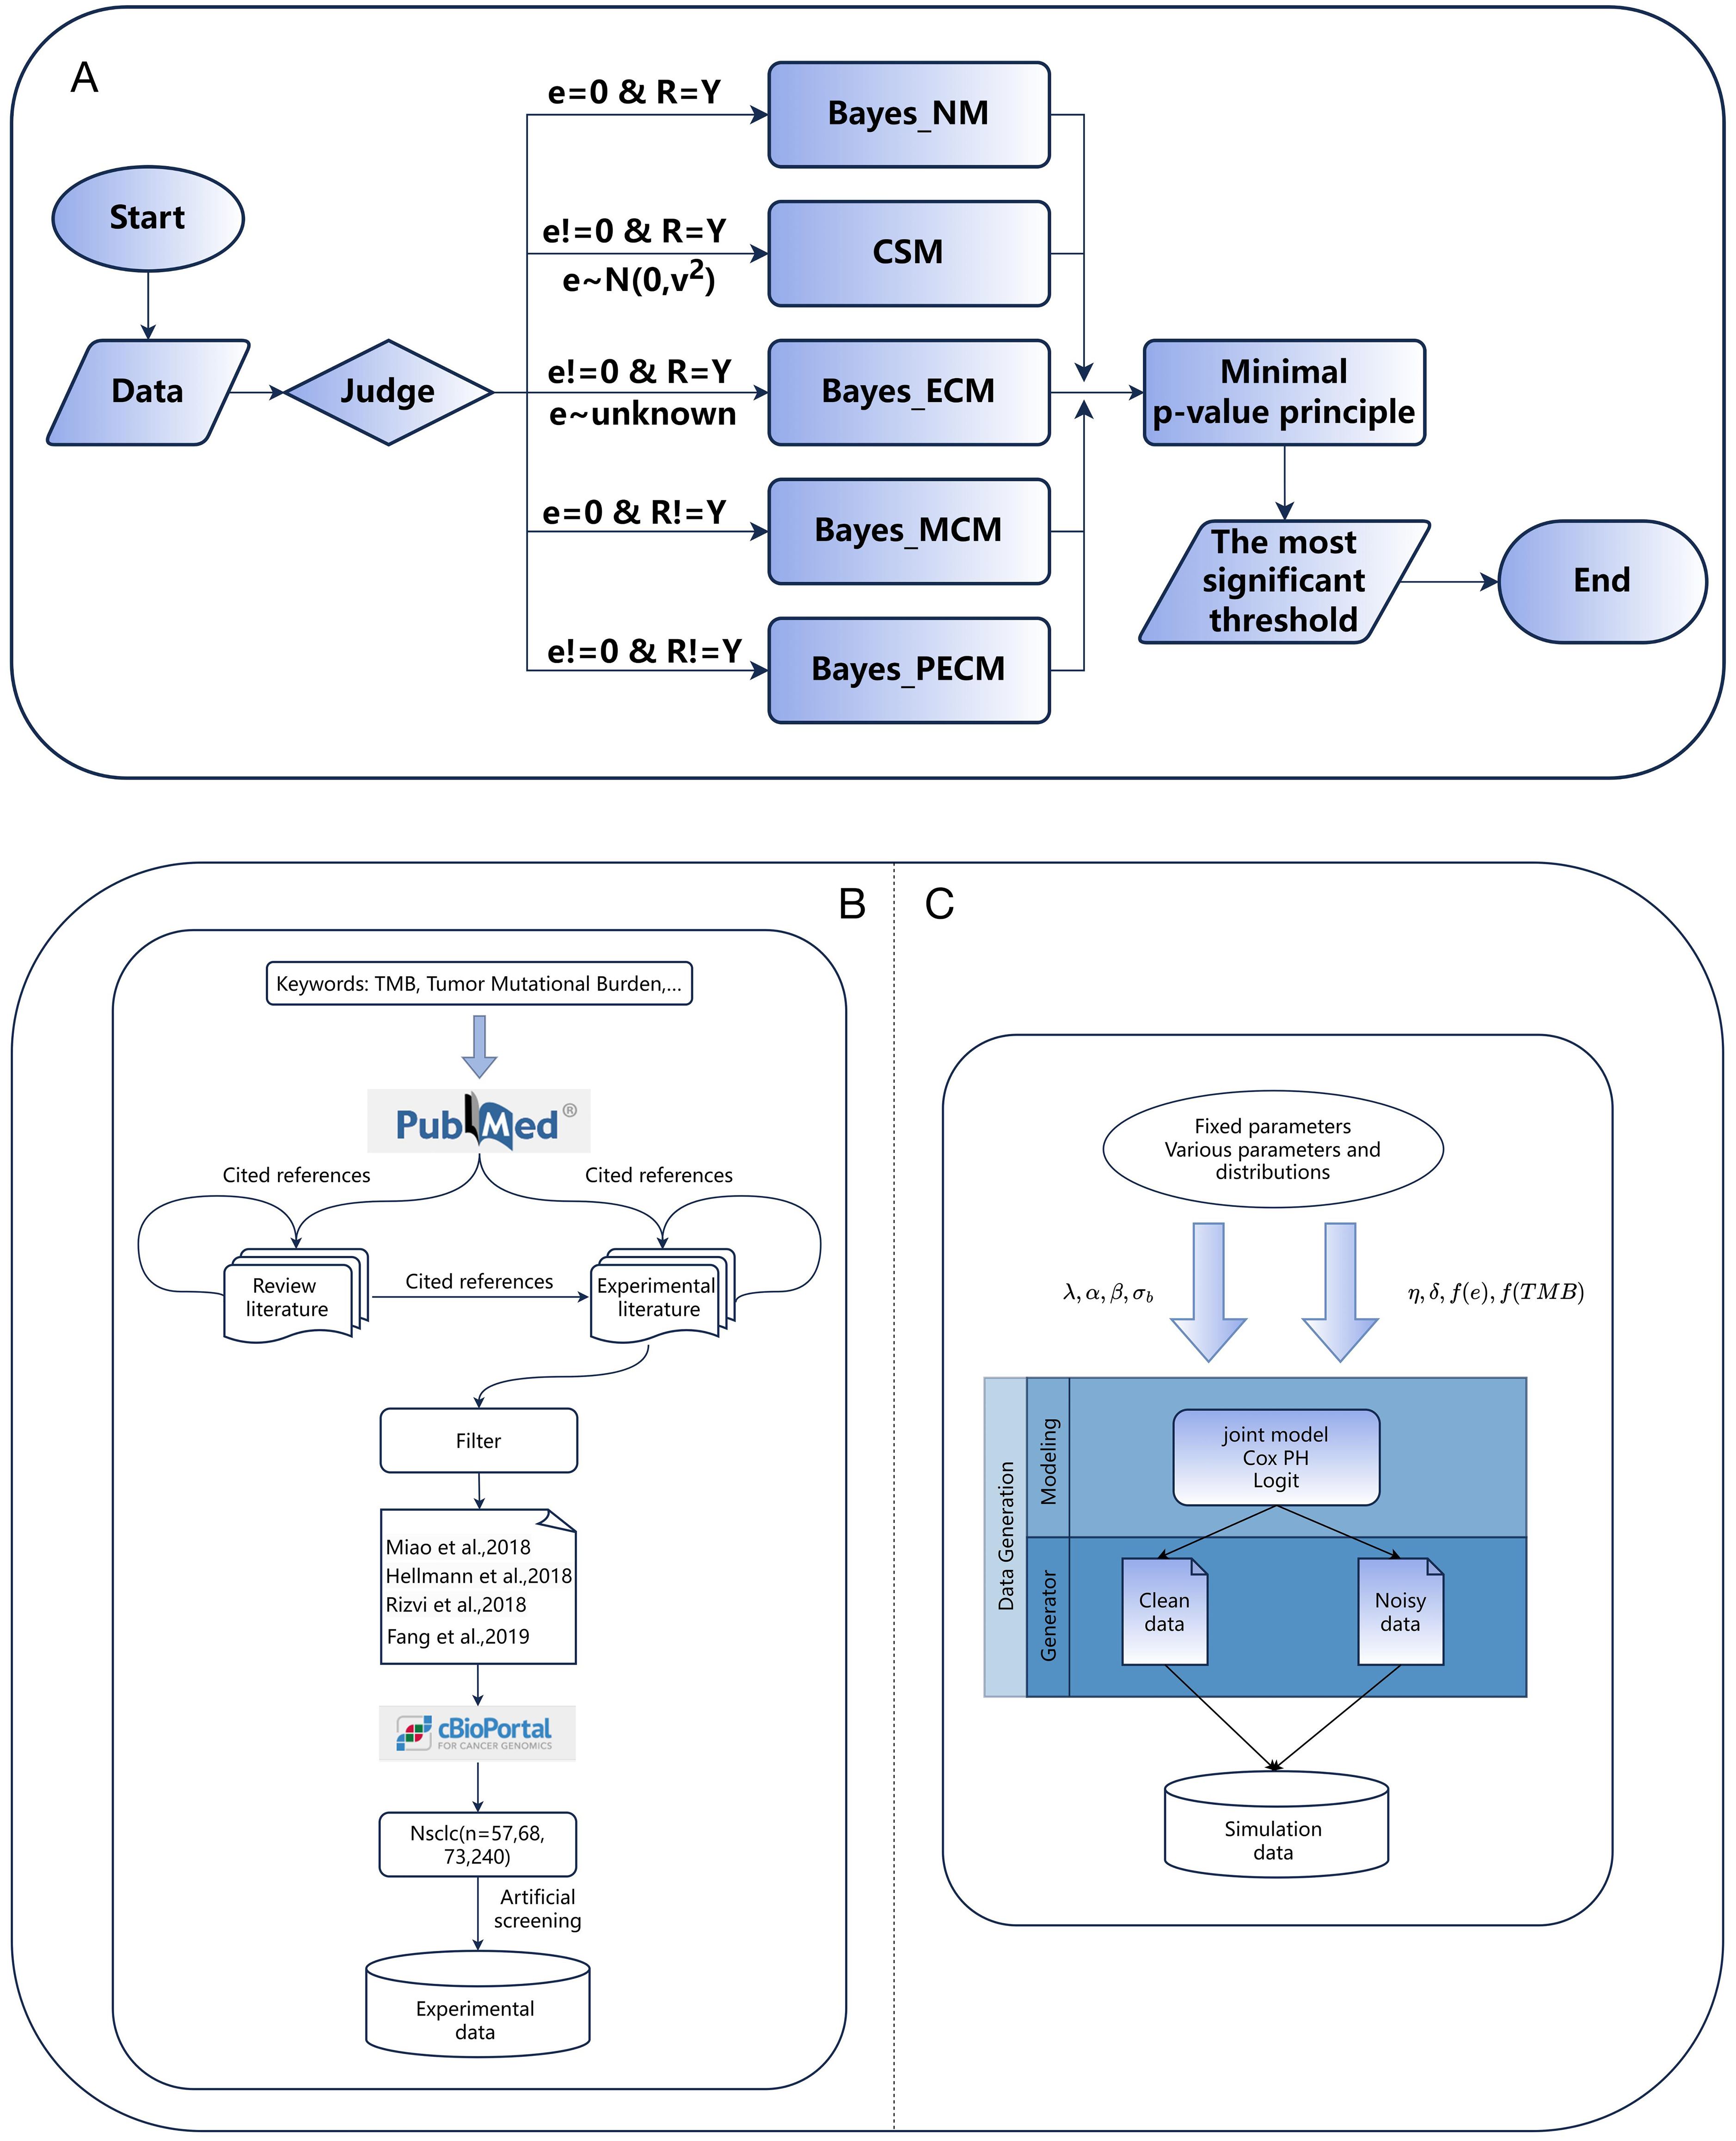
Figure 1. (A) The flow chart for the TMB threshold identification framework. (B, C) The process of generating simulation data and collecting experimental data.
Results
Experimental patient cohorts
To validate the applicability of TMBocelot, we assembled four cohorts of 438 different patients from publicly available studies, encompassing 57, 68, 73, and 240 patients with NSCLC (26, 40–42). Our primary efficacy endpoints were tumor response and progression-free survival (PFS) evaluated according to the RECIST criteria. Figure 1B illustrates the data collection process. The specific patient information is listed in Supplementary Table S1.
The decision to focus exclusively on NSCLC cohorts was driven by the extensive availability of publicly accessible datasets for this cancer type and the well-established clinical relevance of TMB as a biomarker in NSCLC. Additionally, NSCLC represents a heterogeneous disease with varying response patterns to immune checkpoint inhibitors, making it a valuable model for evaluating the performance of TMBocelot.
Furthermore, we assessed the performance of TMBocelot in addressing various errors in oncology trials through a series of simulations. The simulations involved 200 individuals, each characterized by an individual-specific random effect across multiple endpoints. was drawn from a normal distribution with a mean of zero and variance . Tumor response states were categorized as response () and non-response (). when misclassifications did not occur; otherwise, adjustments were made based on misclassification parameters . Actual response states were generated based on logistic probability, and patient event times were derived from a survival density following the Weibull distribution with a shape parameter of 1.0. Censoring time C was randomly generated from a uniform distribution U (0, 10).
We set and . was generated from the uniform distribution U (0, 1). Various error scenarios were designed, including error-free, TMB errors only, endpoints misclassification only, and both. We used the corresponding approaches described above. In experiments focusing on TMB errors, we assigned different distributions to the true TMB and measurement errors to demonstrate the methods’ efficiency. We separately set to (0.70, 0.95) and (0.75, 0.98) for experiments considering response misclassification. Detailed settings can be found in the Supplementary Table S2. Figure 1C roughly depicts the generation of the simulation data.
Pairwise error control enables accurate statistical inference
In the simulations, we report fitted values, average bias, standard deviation (SD), and standard error (SE) for each parameter. SD measures variability in the estimates across 500 simulations, while SE represents their average error.
Table 1 summarizes parameter estimates, with extensive simulations detailed in Supplementary Table S2. These results highlight the robust performance of TMBocelot across various error scenarios. While TMBocelot performs slightly worse than the true-data estimator under measurement errors or misclassification, it significantly outperforms the naive estimator, which ignores such errors. This strongly supports TMBocelot’s effectiveness in handling diverse error types.
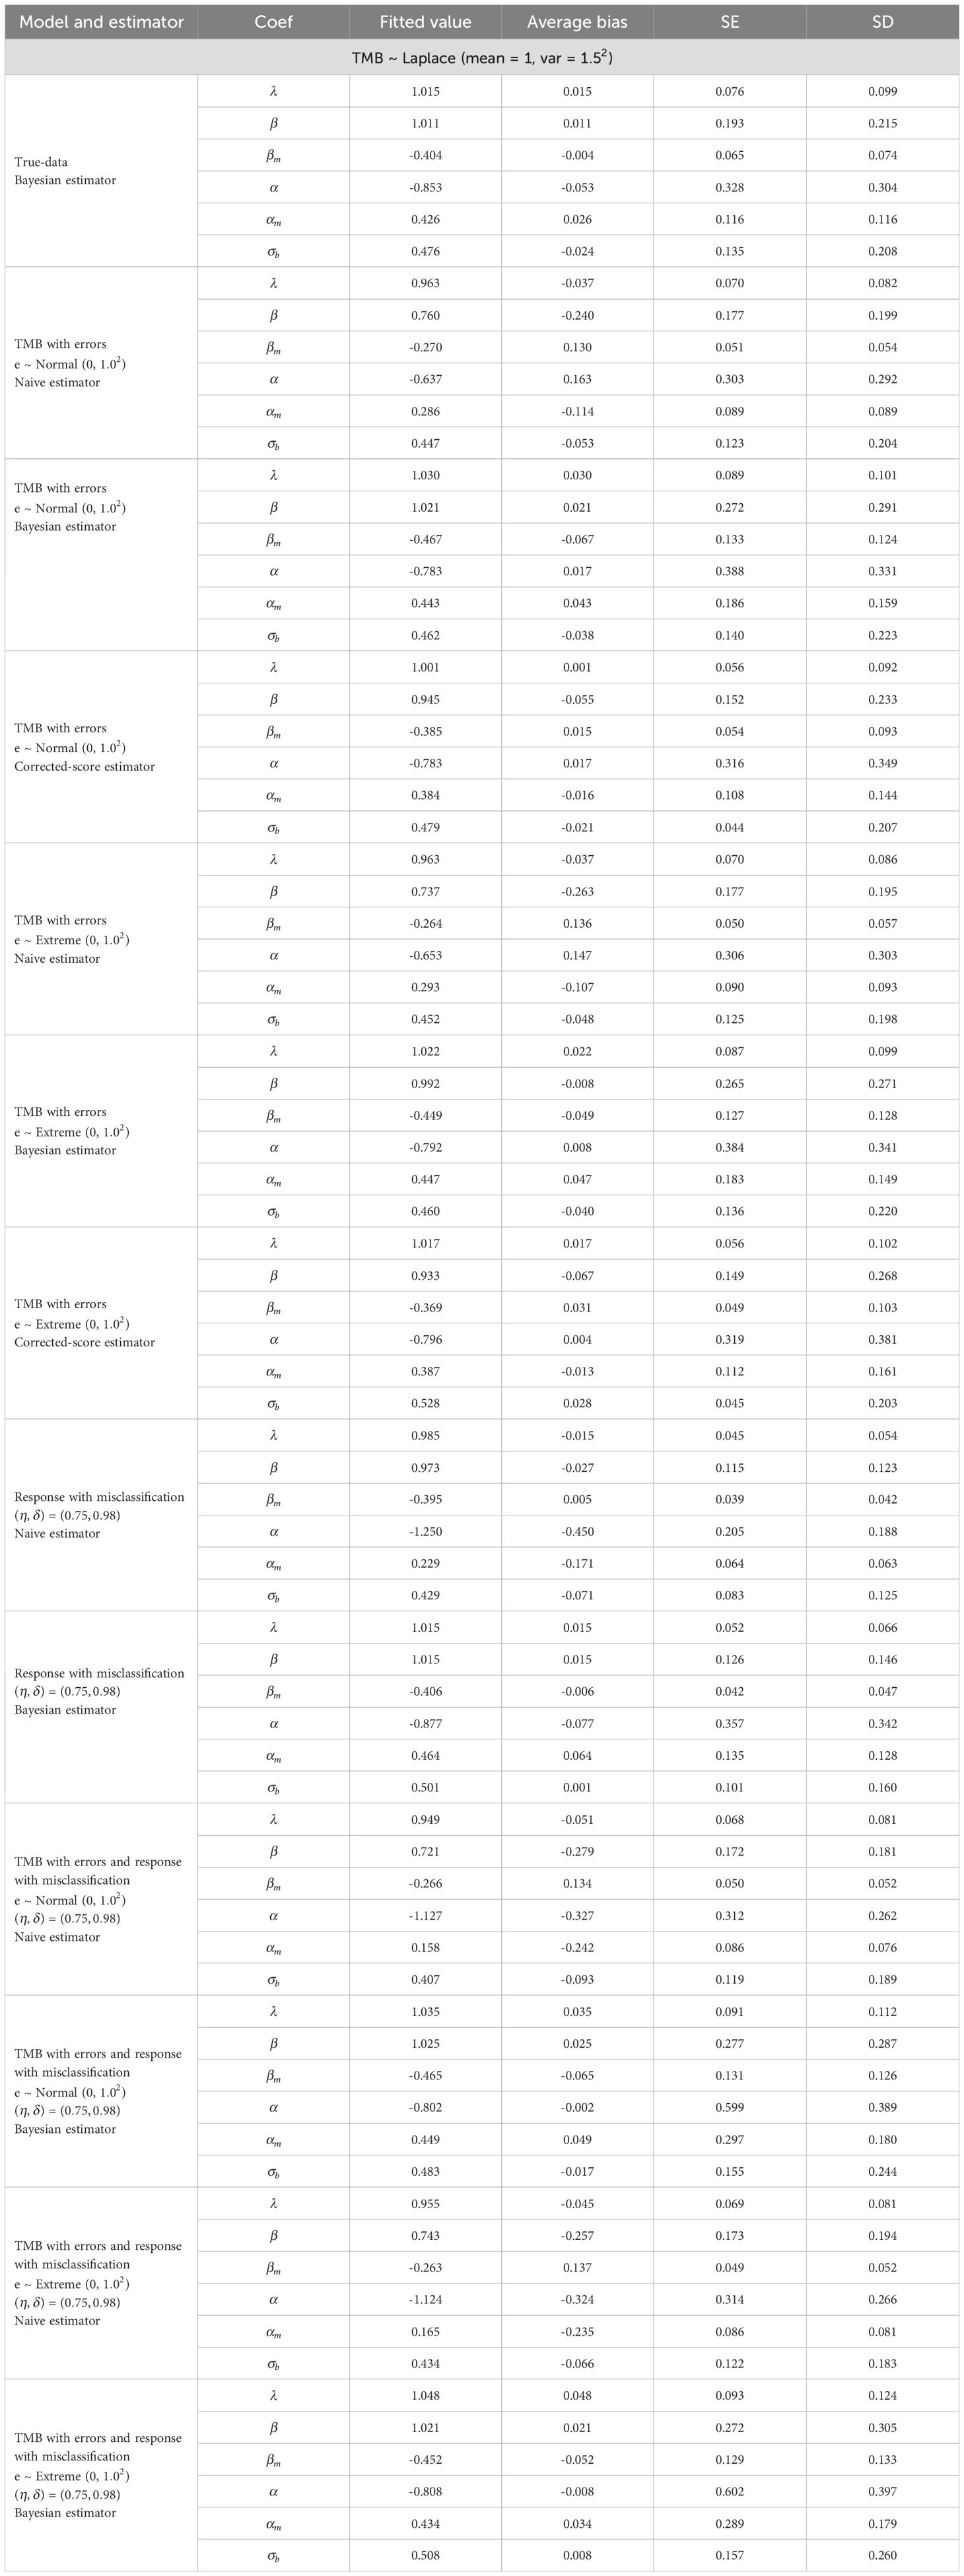
Table 1. Comparisons of bias and standard errors of estimators among various estimators.
Additionally, distinguishing between the corrected-score and Bayesian robust methods is crucial when considering only TMB errors. The results indicate: i) Regardless of the distribution of actual TMB, the corrected-score outperforms the Bayesian method when TMB errors follow a normal distribution with a standard deviation of 1.0. However, the Bayesian method performs better for errors with a larger deviation. The corrected-score may be more effective for minor errors, while the Bayesian robust method is preferable for more significant errors. ii) If TMB errors follow the extreme value distribution, the corrected-score’s performance deteriorates compared to the normal distribution, while the Bayesian method remains stable. This suggests that the corrected scoring method’s normality assumption may mis-specify the error distribution, especially in asymmetric distributions. Conversely, the Bayesian method demonstrates robustness concerning TMB error and truth value distribution. iii) The SE and SD for the Bayesian robust method exceeded those for the corrected-score method, attributed to a lack of a priori information. These limitations become more pronounced when accurately and robustly estimating the distribution of TMB actual values. The corrected-score is recommended for minor errors and a known variance; the Bayesian robust method is preferable for more significant errors or asymmetric distributions.
To evaluate the effect of errors on TMB thresholds and TMBocelot’s stability, we simulated treatment efficacy across different thresholds, considering 500 patients with actual TMBs positively correlated to favorable outcomes. The coefficients were set to and . TMB errors were generated by the normal distribution with a standard deviation of 1.0 and misclassification parameters . We derived different thresholds for classifying patients and comparing the treatment efficacy of TMB-based subgroups.
It is worth noting that the selection of and in the thresholding process and the efficacy comparison. When accounting for TMB errors or tumor response misclassification, we used the corresponding posterior estimates. For scenarios ignoring errors, the observed values were used. The comparison outcomes are depicted in Figure 2.
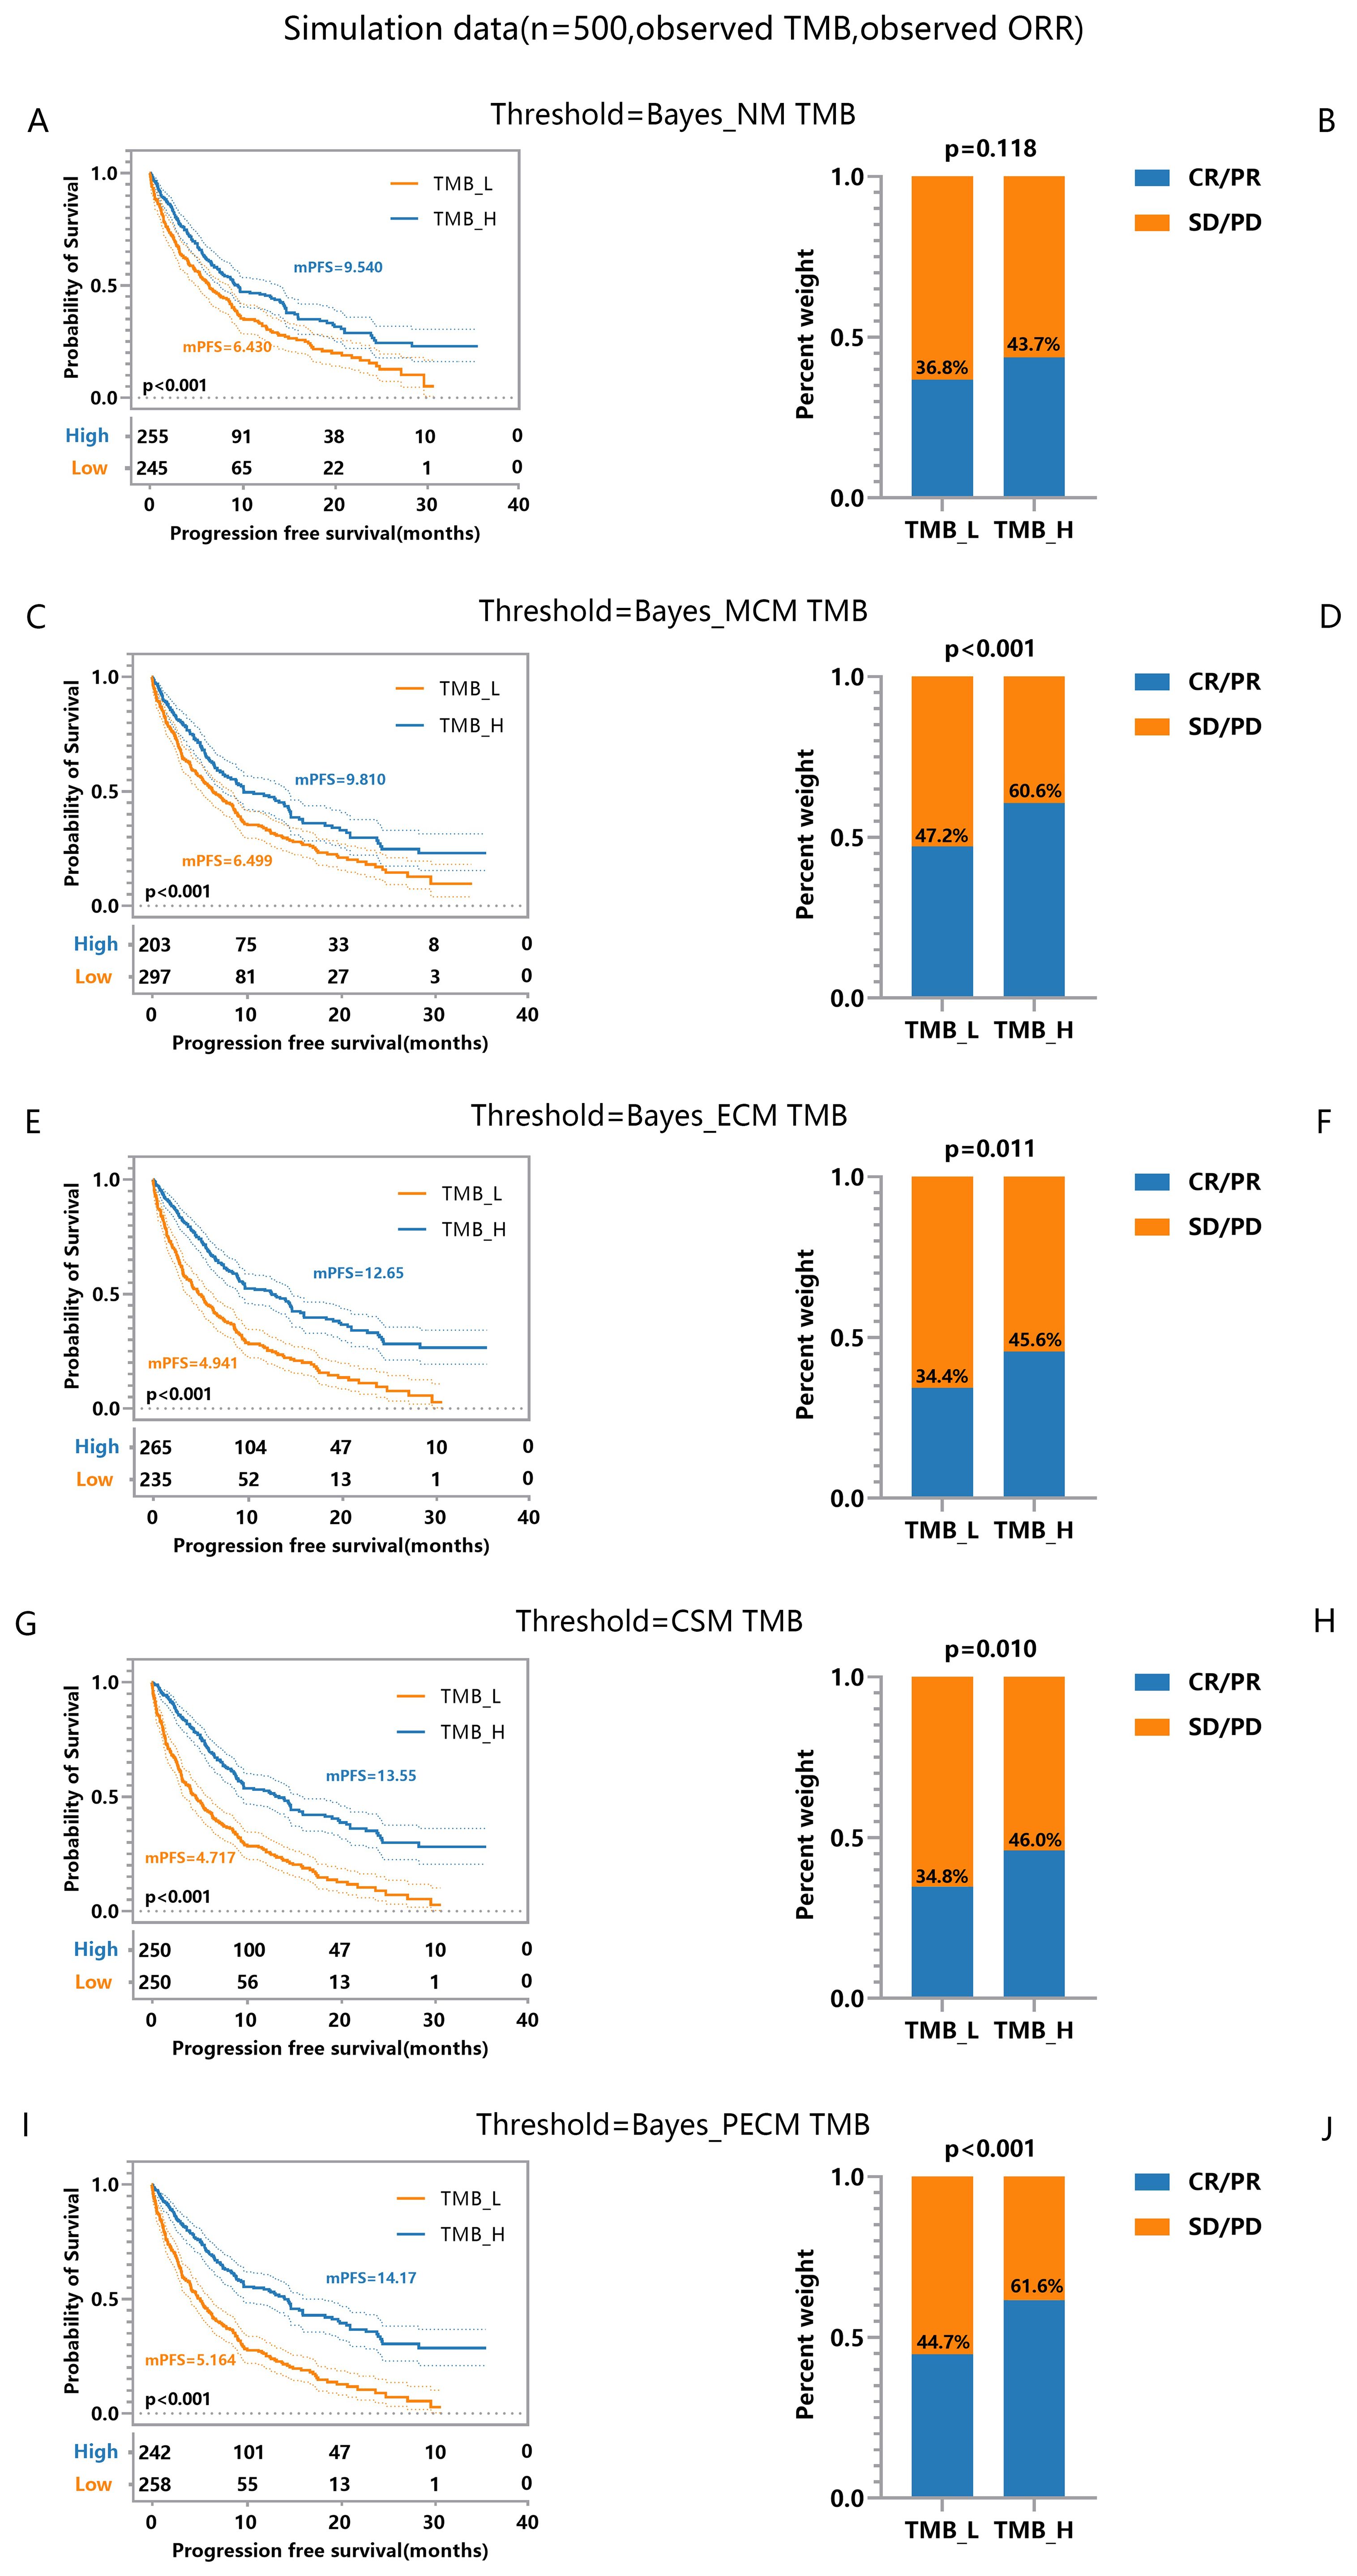
Figure 2. Efficacy Comparisons of Patients Grouped Based on Different TMB Thresholds. (A, B) Comparison of response and survival curves based on the threshold derived from Bayes-NM ignoring TMB errors and misclassification of response. (C, D) Comparison of response and survival curves based on the threshold derived from Bayes-MCM ignoring TMB errors. (E, F) Comparison of response and survival curves based on the threshold derived from Bayes-ECM ignoring misclassification of response. (G, H) Comparison of response and survival curves based on the threshold derived from Bayes-CSM ignoring misclassification of response. (I, J) Comparison of response and survival curves based on the threshold derived from Bayes-PECM considering both TMB errors and misclassification of response.
Significant efficacy disparities between TMB-low and TMB-high groups reflect the correlation between higher TMB and increased antitumor immunogenicity. Specifically, results show: i) Thresholds considering response misclassification result in greater disparities in tumor response (Figure 2D, p < 0.001) compared to the naive method (Figure 2B, p = 0.118), with similar survival curve disparities (Figures 2A, C). ii) The threshold considering TMB errors results in more significant disparities in both the survival curve and response (Figures 2E-H) compared to the threshold based on the naive method (Figures 2A, B) though tumor response disparities (Figures 2F, H, p = 0.011, 0.010) are slightly smaller than those considering only misclassification (Figure 2D, p < 0.001). iii) Thresholds considering both TMB errors and response misclassification yield the most significant disparities in survival and tumor response (Figures 2I, J) compared to all other methods (Figures 2A–H). These findings indicate that TMB errors impact survival and tumor response, while response misclassification primarily affects tumor response. The framework effectively establishes robust TMB thresholds, supporting clinical decision-making even with pairwise errors.
To emphasize posterior TMB’s role in patient classification, we used accurate response labels. Logistic predictors based on observed, posterior, and true TMB generated ROC curves in Figure 3, where Figures 3A–D derive from the same data set, and the differences stem from the randomness of the MCMC algorithm. Results showed posterior and true TMB yielded similar AUC values, both significantly higher than those for observed TMB. Variability between posterior and true TMB AUCs arises from MCMC algorithm randomness and posterior TMB’s tendency toward maximum likelihood, which cannot fully match true TMB. While posterior TMB sometimes outperforms true TMB through parameter combination, it may also perform slightly worse. Overall, posterior TMB surpasses observed TMB in classification performance, underscoring its importance in patient stratification.
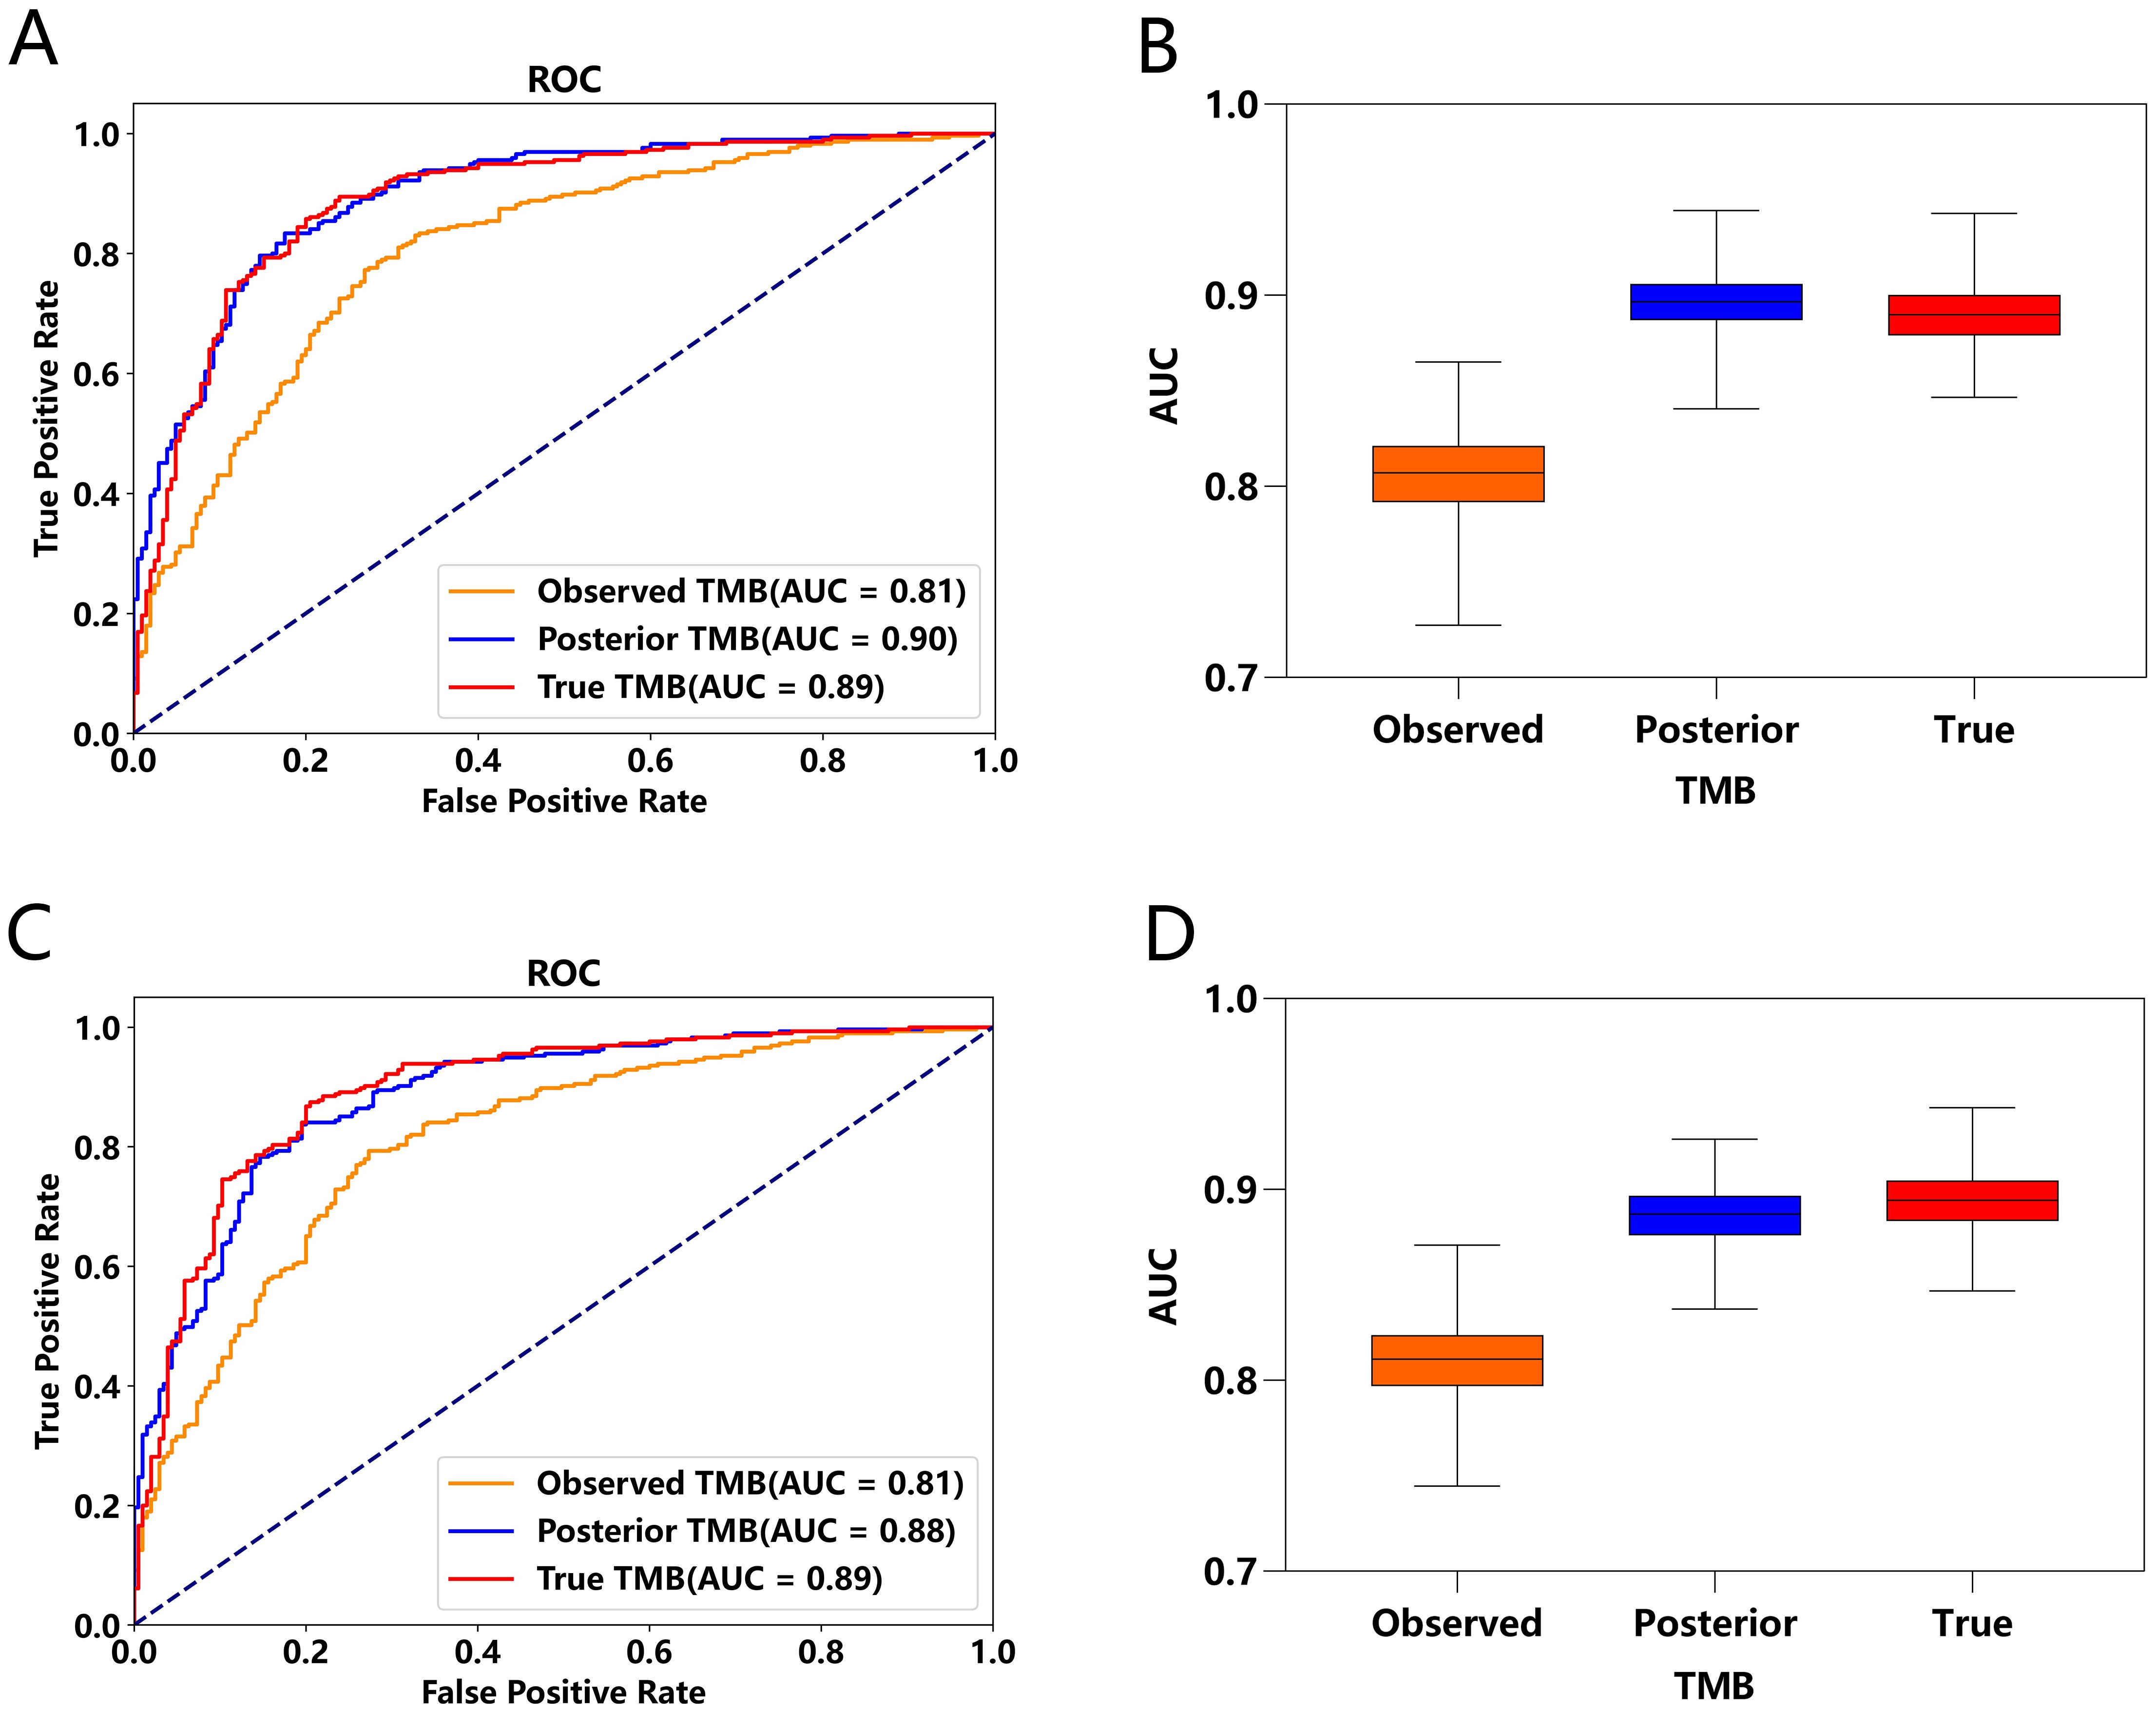
Figure 3. Comparison of ROC Curves and AUC under Observed TMB, Posterior TMB, and True TMB. (A, C) ROC curves for observed TMB, posterior TMB, and true TMB. (B, D) AUC values for observed TMB, posterior TMB, and true TMB.
Pairwise error control prompts robust efficacy stratification
Incorporating error considerations, the multi-endpoint joint analysis marks a significant advancement by addressing real-world measurement challenges and surpassing previous studies. To validate TMBocelot, we applied the Bayes-ECM to each experimental cohort, considering TMB errors as recommended by the framework. Subsequently, we determined the TMB threshold by dividing patients into two subgroups using TMBcat and comparing it with the medians. The comparison outcomes are presented in Figure 4.
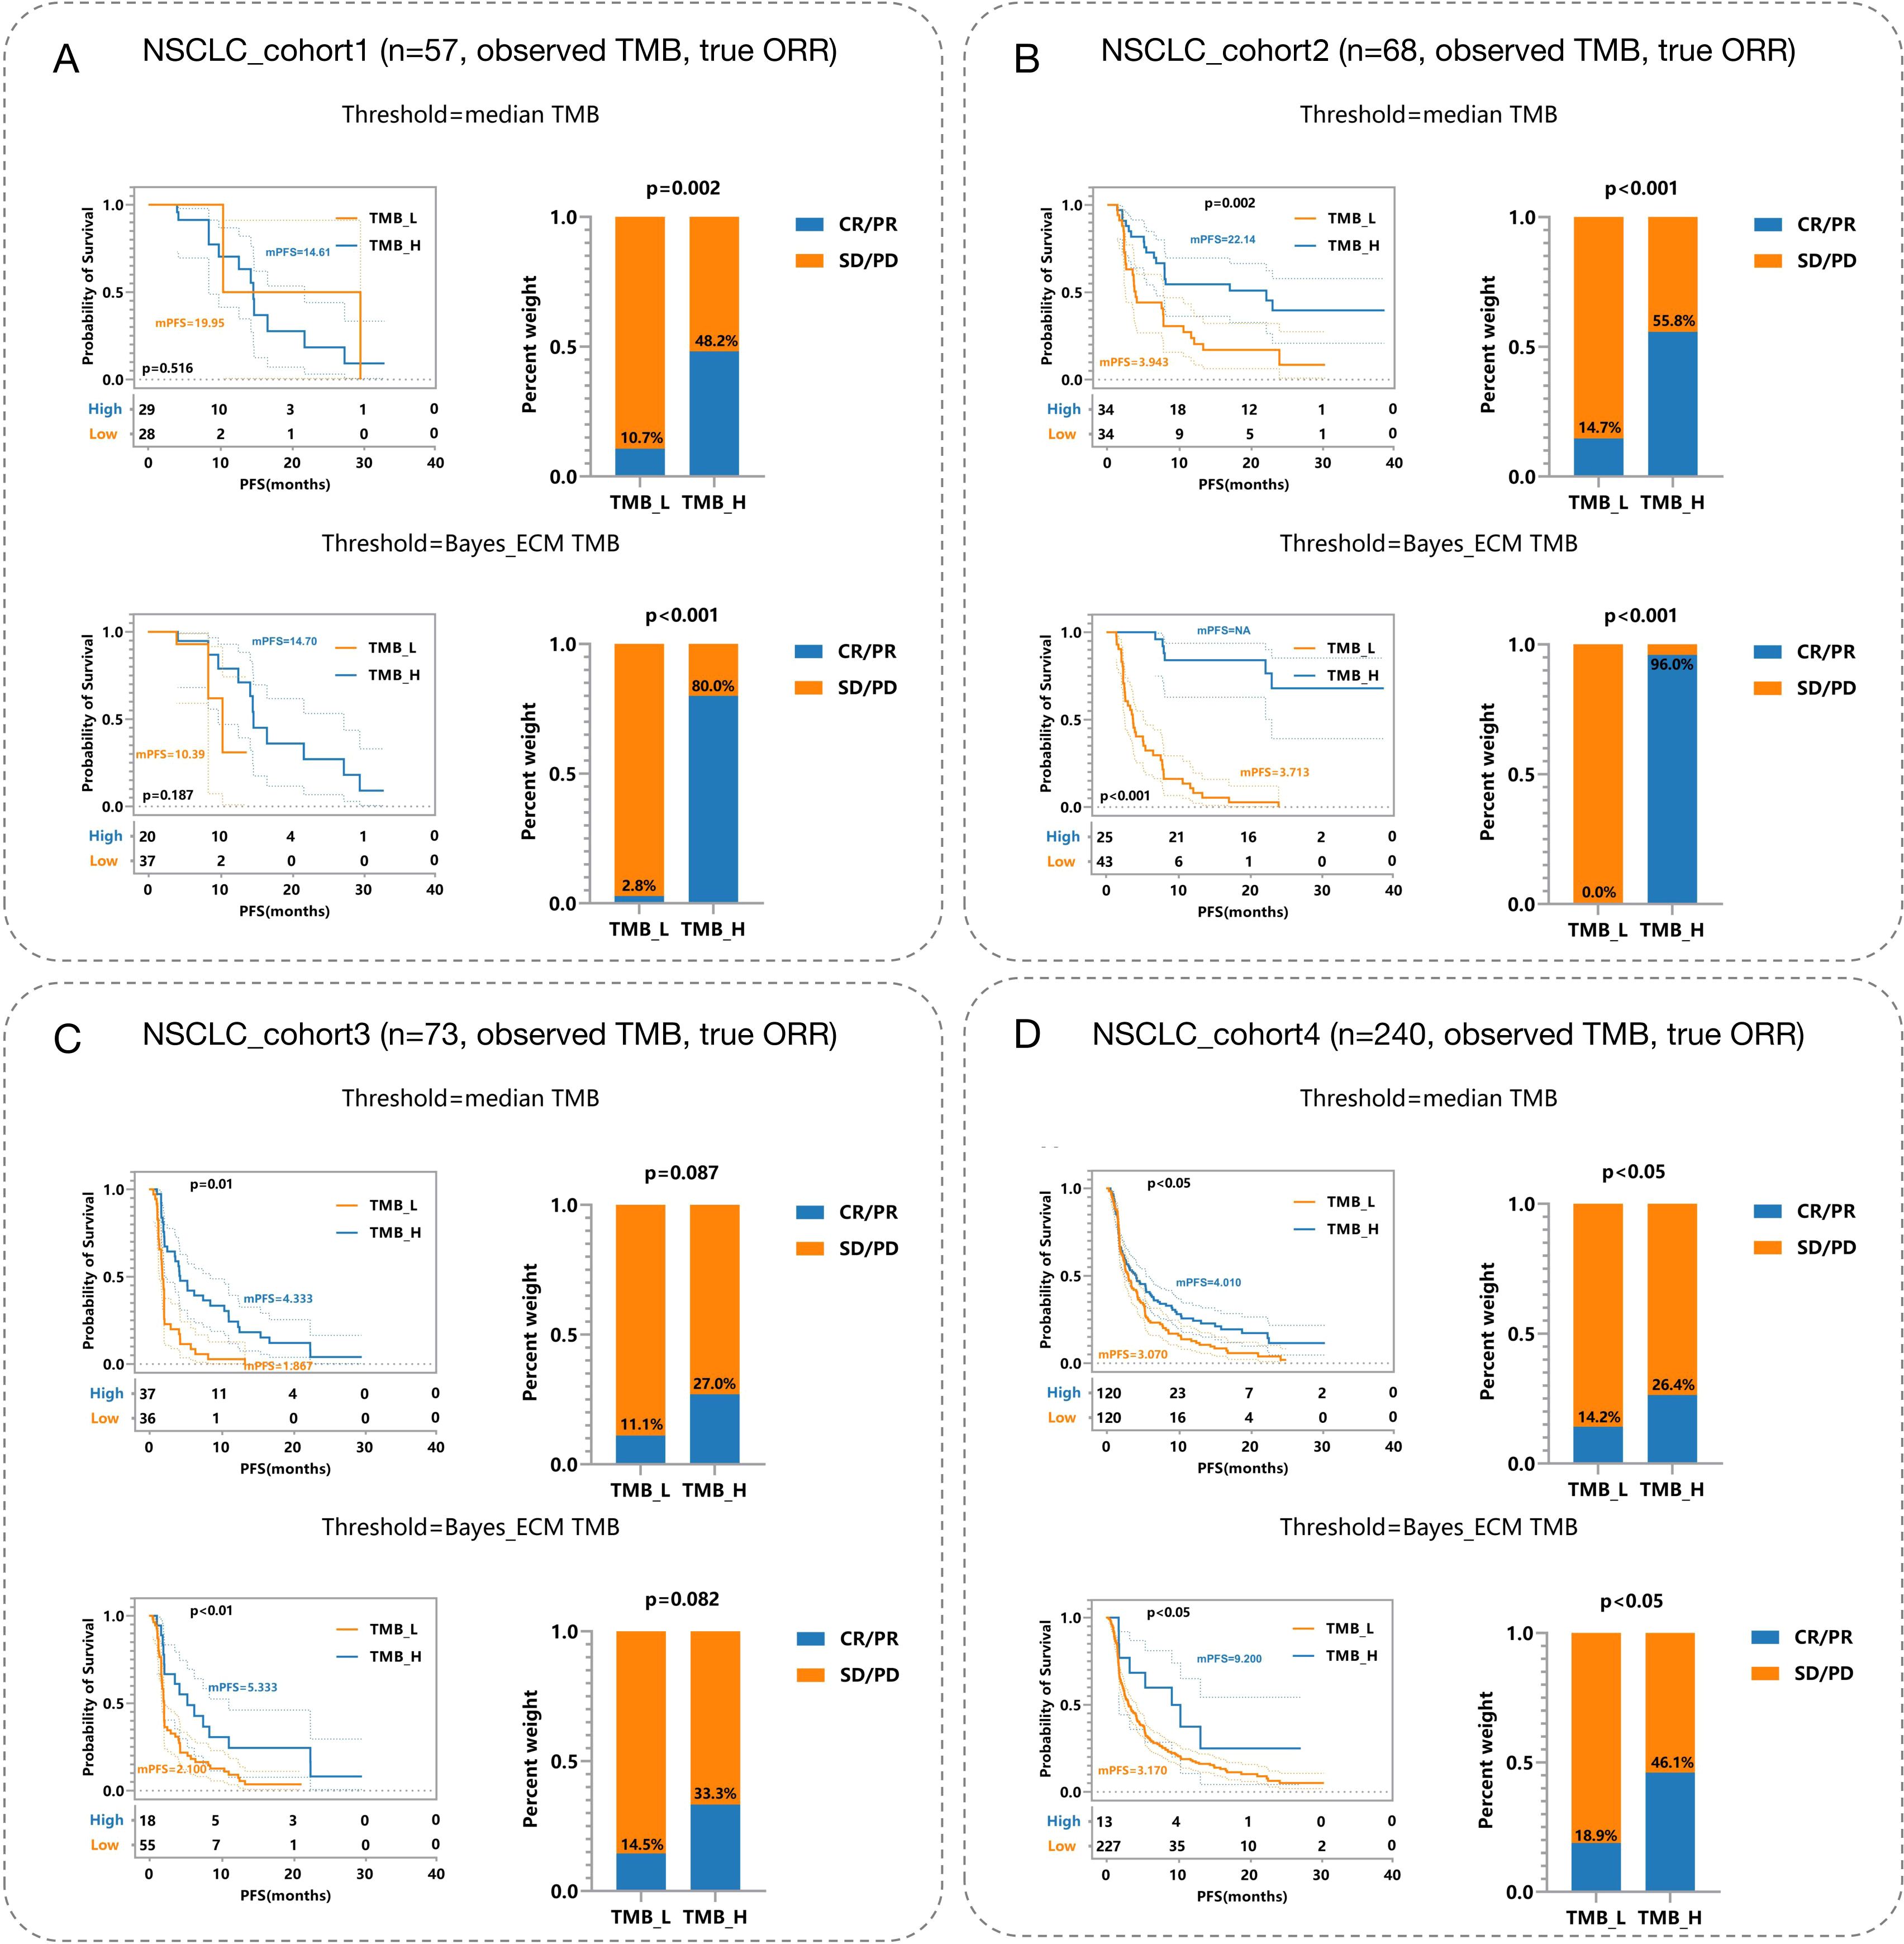
Figure 4. Efficacy Comparisons in NSCLC Patient Cohorts Based on Different TMB Thresholds. (A) NSCLC_cohort1 (n = 57): Observed TMB and true objective response rate (ORR). The top panels depict survival and response rates using median TMB thresholds, while the bottom panels utilize Bayes-ECM-derived thresholds. (B) NSCLC_cohort2 (n = 68): Similar setup as (A), showcasing efficacy outcomes based on different TMB thresholds. (C) NSCLC_cohort3 (n = 73): Displays efficacy comparisons, similar to previous cohorts, highlighting survival curves and response rates. (D) NSCLC_cohort4 (n = 240): Largest cohort illustrating the impact of TMB thresholding on patient survival and response rates, analyzed through observed TMB and true ORR.
The threshold calculated by the proposed method surpasses the medians in all cohorts. This superiority leads to more significant efficacy disparities, notably in nsclc_cohort1_57 (Figure 4A) and nsclc_cohort2_68 (Figure 4B), nsclc_cohort3_73 (Figure 4C) and nsclc_cohort4_240 (Figure 4D). Furthermore, to validate the proposed Bayes-PECM, we introduced artificial perturbations in tumor response for nsclc_cohort2_68 and nsclc_cohort4_240. This included a 25% error rate for patients with PR/CR and a 2% error rate for patients with PD/SD. The Bayes-PECM was tested on these two cohorts; the outcomes are depicted in Figure 5. Figure 5 clearly shows pronounced efficacy disparities for nsclc_68 and nsclc_240, grouped by the Bayes-PECM-based threshold. Notably, the disparities in efficacy for experimental cohorts with added tumor response misclassification are similar to those achieved by experimental cohorts without misclassification, validating the effectiveness of the Bayes-PECM proposed in the framework.
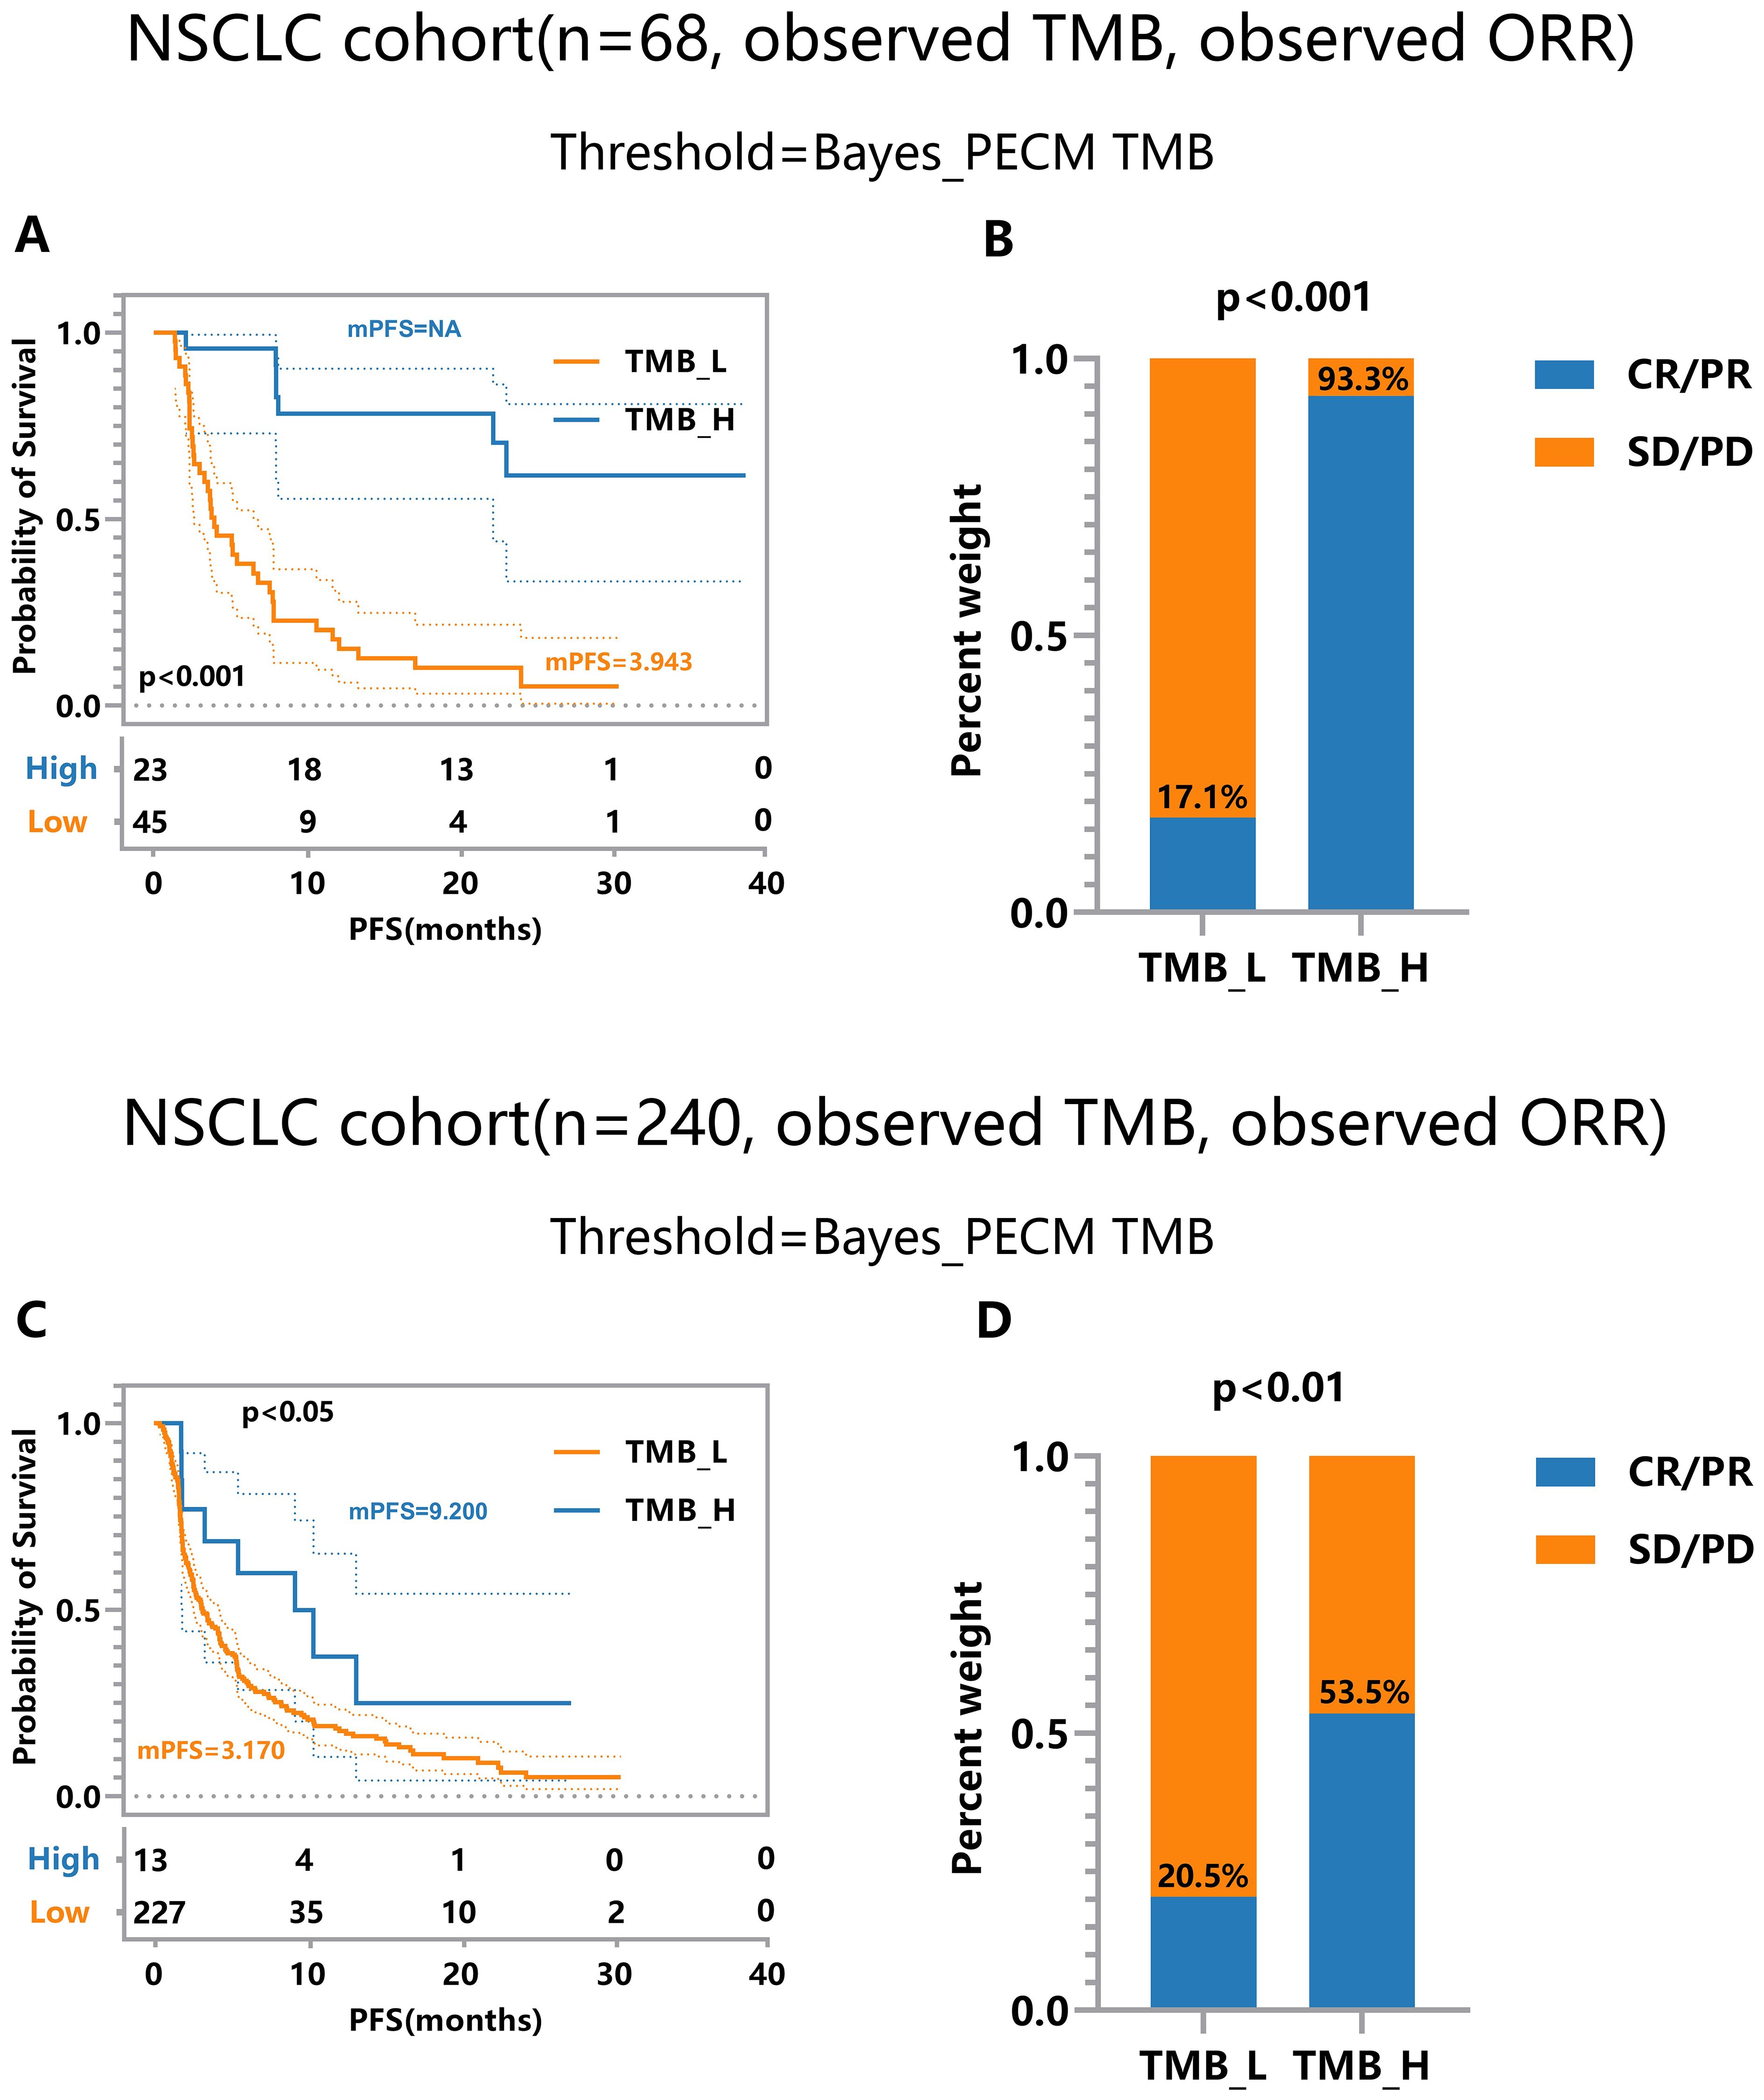
Figure 5. Efficacy Comparison of Patients Grouped Based on Different TMB Thresholds on Experimental NSCLC_cohort2&4 (n = 68, 240) under Observed TMB and Response with Perturbation. (A, B) Comparison of response and survival curves based on the threshold derived from Bayes-PECM for nsclc_68. (C, D) Comparison of response and survival curves based on the threshold derived from Bayes-PECM for nsclc_240.
A joint model with pairwise error control facilitates a more comprehensive and robust TMB subgrouping. This approach reveals more significant discrepancies between the efficacies of the TMB-low and TMB-high groups, showcasing the potential of the proposed framework in enhancing the precision and reliability of TMB subgroup classifications.
Discussion
Tumor mutational burden (TMB) has recently garnered significant interest with its recognition by regulatory bodies as a biomarker, given the association of high TMB with improved responses to ICIs. However, defining clinically actionable TMB-positive thresholds remains contentious due to variations in evaluation metrics and the complexity of error sources, including TMB measurement errors and endpoint misclassification. Although recent studies have integrated multi-endpoints into TMB threshold analysis, error considerations have been relatively simplistic.
In response, we present a generalized framework, TMBocelot, capable of handling the complexity and diversity of real-world situations, accommodating various errors, including paired TMB errors and endpoint misclassification. Our simulations and applied experiments endorse this framework, enabling robust assessment of patient efficacy even amidst TMB errors and misclassified endpoints.
Additionally, this study yields valuable insights into the differential effects of errors on outcomes. While TMB errors exert a more pervasive influence on both survival and tumor response efficacy, endpoint misclassification primarily affects tumor response efficacy. These findings emphasize the need for tailored error correction methods. For instance, when measurement error is believed to be small and symmetrical, corrected-score methods leveraging auxiliary data or deconvolution approaches may suffice. In contrast, for complex or poorly understood error sources, Bayesian robust methods are recommended for error correction.
Despite its strengths, it is important to acknowledge the limitations of TMBocelot to provide a balanced perspective. First, the framework demands significant computational resources and large datasets, posing challenges for implementation in resource-constrained settings. High-dimensional Bayesian models, such as TMBocelot, require substantial processing power and expertise in Bayesian inference, potentially limiting their accessibility for smaller clinical or research institutions. Moreover, the reliance on high-quality datasets for accurate parameter estimation may reduce the framework’s applicability in scenarios where data availability or quality is limited. These resource-intensive requirements could hinder the widespread adoption of TMBocelot.
Another limitation lies in the scope of its validation, which was restricted to non-small cell lung cancer (NSCLC) cohorts. While the findings offer robust insights into the applicability of TMBocelot for NSCLC, their generalizability to other cancer types remains uncertain. Different cancer types may exhibit distinct biological characteristics and treatment response mechanisms, potentially leading to variations in TMB thresholds and response profiles. This limitation introduces potential biases and underscores the need for further validation across diverse tumor types. Expanding the framework’s application to a broader range of cancers would enhance its generalizability, enabling the development of cancer-specific refinements and ensuring its broader relevance.
Conclusion
Measurement error is an unavoidable challenge in practical applications. However, the current approach to analyzing TMB thresholds tends to oversimplify error considerations. Our study is grounded in real-world scenarios and systematically accounts for various error scenarios to optimize the positive threshold. Theoretically, our method can result in a more comprehensive and robust TMB threshold. From the simulation and experimental results, we reasonably conclude that 1) our proposed joint model with the parameter estimation procedure can more robustly assess patient efficacy even under the interference of TMB errors and endpoints misclassification. 2) The error scenarios are complex and diverse, and we recommend choosing the scheme in the generalized framework according to the actual situation. 3) The TMB-positive threshold derived from multi-endpoint joint analysis considering errors can classify patients into two groups with more apparently stratified efficacy. Our model is applicable to clinical datasets with multiple endpoints and has the potential to significantly enhance physicians’ decision-making processes in clinical practice.
Data availability statement
The original contributions presented in the study are included in the article/Supplementary Material. Further inquiries can be directed to the corresponding authors.
Ethics statement
The studies involving humans were approved by Ethical Review Committee of Sun Yat-sen University Cancer Center. The studies were conducted in accordance with the local legislation and institutional requirements. Written informed consent for participation was not required from the participants or the participants’ legal guardians/next of kin in accordance with the national legislation and institutional requirements.
Author contributions
XL: Conceptualization, Funding acquisition, Supervision, Writing – original draft, Writing – review & editing. SW: Methodology, Software, Writing – original draft. XuZ: Project administration, Resources, Supervision, Writing – original draft. XiZ: Investigation, Software, Writing – original draft. YL: Methodology, Project administration, Writing – review & editing. ZC: Data curation, Validation, Visualization, Writing – review & editing. XW: Data curation, Resources, Validation, Writing – review & editing. YS: Data curation, Resources, Writing – review & editing. JW: Conceptualization, Funding acquisition, Project administration, Supervision, Writing – review & editing. YW: Funding acquisition, Project administration, Supervision, Writing – review & editing.
Funding
The author(s) declare financial support was received for the research, authorship, and/or publication of this article. This work was supported by the National Natural Science Foundation of China, grant numbers 72293581, 72293580, 72274152, 71872146, and 62302215.
Acknowledgments
We thank the patients and their families for participation in the study.
Conflict of interest
Authors YS, XW, and ZC are employed by Nanjing Geneseeq Technology Inc.
The remaining authors declare that the research was conducted without commercial or financial relationships that could be construed as a potential conflict of interest.
Generative AI statement
The author(s) declare that no Generative AI was used in the creation of this manuscript.
Publisher’s note
All claims expressed in this article are solely those of the authors and do not necessarily represent those of their affiliated organizations, or those of the publisher, the editors and the reviewers. Any product that may be evaluated in this article, or claim that may be made by its manufacturer, is not guaranteed or endorsed by the publisher.
Supplementary material
The Supplementary Material for this article can be found online at: https://www.frontiersin.org/articles/10.3389/fimmu.2024.1514295/full#supplementary-material
Supplementary Table S1 | The specific patient information in this study.
Supplementary Table S2 | The extensive parameter estimates in simulations.
Supplementary Material | The technical appendices for TMBocelot.
References
1. Budczies J, Kazdal D, Menzel M, Beck S, Kluck K, Altbürger C, et al. Tumor mutational burden: clinical utility, challenges and emerging improvements. Nat Rev Clin Oncol. (2024) 21:725–42. doi: 10.1038/s41571-024-00932-9
2. Marei HE, Hasan A, Pozzoli G, Cenciarelli C. Cancer immunotherapy with immune checkpoint inhibitors (ICIs): potential, mechanisms of resistance, and strategies for reinvigorating T cell responsiveness when resistance is acquired. Cancer Cell Int. (2023) 23:64. doi: 10.1186/s12935-023-02902-0
3. Ma W, Xue R, Zhu Z, Farrukh H, Song W, Li T, et al. Increasing cure rates of solid tumors by immune checkpoint inhibitors. Exp Hematol Oncol. (2023) 12:10. doi: 10.1186/s40164-023-00372-8
4. Cao K, Zhu J, Lu M, Zhang J, Yang Y, Ling X, et al. Analysis of multiple programmed cell death-related prognostic genes and functional validations of necroptosis-associated genes in esophageal squamous cell carcinoma. EBioMed. (2024) 99:104920. doi: 10.1016/j.ebiom.2023.104920
5. Akinboro O, Larkins E, Pai-Scherf LH, Mathieu LN, Ren Y, Cheng J, et al. FDA approval summary: pembrolizumab, atezolizumab, and cemiplimab-rwlc as single agents for first-line treatment of advanced/metastatic PD-L1-high NSCLC. Clin Cancer Res. (2022) 28:2221–8. doi: 10.1158/1078-0432.CCR-21-3844
6. García-González J, Ruiz-Bañobre J, Afonso-Afonso FJ, Amenedo-Gancedo M, Areses-Manrique MDC, Campos-Balea B, et al. PD-(L)1 inhibitors in combination with chemotherapy as first-line treatment for non-small-cell lung cancer: A pairwise meta-analysis. J Clin Med. (2020) 9:2093. doi: 10.3390/jcm9072093
7. Schmid P, Cortes J, Dent R, Pusztai L, McArthur H, Kümmel S, et al. Event-free survival with pembrolizumab in early triple-negative breast cancer. N Engl J Med. (2022) 386:556–67. doi: 10.1056/NEJMoa2112651
8. Subbiah V, Solit DB, Chan TA, Kurzrock R. The FDA approval of pembrolizumab for adult and pediatric patients with tumor mutational burden (TMB) ≥10: a decision centered on empowering patients and their physicians. Ann Oncol. (2020) 31:1115–8. doi: 10.1016/j.annonc.2020.07.002
9. Marcus L, Fashoyin-Aje LA, Donoghue M, Yuan M, Rodriguez L, Gallagher PS, et al. FDA approval summary: pembrolizumab for the treatment of tumor mutational burden-high solid tumors. Clin Cancer Res. (2021) 27:4685–9. doi: 10.1158/1078-0432.CCR-21-0327
10. National Medical Products Administration. The TMB detection kit (reversible terminal termination sequencing method) for non-small cell lung cancer tissue was approved for marketing . Available online at: https://www.nmpa.gov.cn/ylqx/ylqxjgdt/20231012153634120.html (Accessed October 12, 2023).
11. Samstein RM, Lee CH, Shoushtari AN, Hellmann MD, Shen R, Janjigian YY, et al. Tumor mutational load predicts survival after immunotherapy across multiple cancer types. Nat Genet. (2019) 51:202–6. doi: 10.1038/s41588-018-0312-8
12. Valero C, Lee M, Hoen D, Weiss K, Kelly DW, Adusumilli PS, et al. Pretreatment neutrophil-to-lymphocyte ratio and mutational burden as biomarkers of tumor response to immune checkpoint inhibitors. Nat Commun. (2021) 12:729. doi: 10.1038/s41467-021-20935-9
13. Conway JR, Kofman E, Mo SS, Elmarakeby H, Van Allen E. Genomics of response to immune checkpoint therapies for cancer: implications for precision medicine. Genome Med. (2018) 10:93. doi: 10.1186/s13073-018-0605-7
14. Lemery S, Keegan P, Pazdur R. First FDA approval agnostic of cancer site - when a biomarker defines the indication. N Engl J Med. (2017) 377:1409–12. doi: 10.1056/NEJMp1709968
15. Boyiadzis MM, Kirkwood JM, Marshall JL, Pritchard CC, Azad NS, Gulley JL. Significance and implications of FDA approval of pembrolizumab for biomarker-defined disease. J Immunother Cancer. (2018) 6:35. doi: 10.1186/s40425-018-0342-x
16. Cao D, Xu H, Xu X, Guo T, Ge W. High tumor mutation burden predicts better efficacy of immunotherapy: a pooled analysis of 103078 cancer patients. Oncoimmunology. (2019) 8:e1629258. doi: 10.1080/2162402X.2019.1629258
17. Wood MA, Weeder BR, David JK, Nellore A, Thompson RF. Burden of tumor mutations, neoepitopes, and other variants are weak predictors of cancer immunotherapy response and overall survival. Genome Med. (2020) 12:33. doi: 10.1186/s13073-020-00729-2
18. Alioto TS, Buchhalter I, Derdak S, Hutter B, Eldridge MD, Hovig E, et al. A comprehensive assessment of somatic mutation detection in cancer using whole-genome sequencing. Nat Commun. (2015) 6:10001. doi: 10.1038/ncomms10001
19. Xu H, DiCarlo J, Satya RV, Peng Q, Wang Y. Comparison of somatic mutation calling methods in amplicon and whole exome sequence data. BMC Genomics. (2014) 15:244. doi: 10.1186/1471-2164-15-244
20. Liu Y, Wang S, Wang Y, Li Y, Zhu X, Lai X, et al. What makes TMB an ambivalent biomarker for immunotherapy? A subtle mismatch between the sample-based design of variant callers and real clinical cohort. Front Immunol. (2023) 14:1151224. doi: 10.3389/fimmu.2023.1151224
21. Eisenhauer EA, Therasse P, Bogaerts J, Schwartz LH, Sargent D, Ford R, et al. New response evaluation criteria in solid tumors: revised RECIST guideline (version 1.1). Eur J Cancer. (2009) 45:228–47. doi: 10.1016/j.ejca.2008.10.026
22. Budczies J, Kazdal D, Allgäuer M, Christopoulos P, Rempel E, Pfarr N, et al. Quantifying potential confounders of panel-based tumor mutational burden (TMB) measurement. Lung Cancer. (2020) 142:114–9. doi: 10.1016/j.lungcan.2020.01.019
23. Campesato LF, Barroso-Sousa R, Jimenez L, Correa BR, Sabbaga J, Hoff PM, et al. Comprehensive cancer-gene panels can be used to estimate mutational load and predict clinical benefit to PD-1 blockade in clinical practice. Oncotarget. (2015) 6:34221–7. doi: 10.18632/oncotarget.5950
24. Colli LM, Machiela MJ, Myers TA, Jessop L, Yu K, Chanock SJ. Burden of nonsynonymous mutations among TCGA cancers and candidate immune checkpoint inhibitor responses. Cancer Res. (2016) 76:3767–72. doi: 10.1158/0008-5472.CAN-16-0170
25. Riaz N, Havel JJ, Makarov V, Desrichard A, Urba WJ, Sims JS, et al. Tumor and microenvironment evolution during immunotherapy with nivolumab. Cell. (2017) 171:934–949.e16. doi: 10.1016/j.cell.2017.09.028
26. Miao D, Margolis CA, Vokes NI, Liu D, Taylor-Weiner A, Wankowicz SM, et al. Genomic correlates of response to immune checkpoint blockade in microsatellite-stable solid tumors. Nat Genet. (2018) 50:1271–81. doi: 10.1038/s41588-018-0200-2
27. Wang Y, Lai X, Wang J, Xu Y, Zhang X, Zhu X, et al. A joint model considering measurement errors for optimally identifying tumor mutation burden threshold. Front Genet. (2022) 13:915839. doi: 10.3389/fgene.2022.915839
28. Ng SK, Tawiah R, Mclachlan GJ, Gopalan V. Joint frailty modeling of time-to-event data to elicit the evolution pathway of events: a generalized linear mixed model approach. Biostatistics. (2022) 24:108–23. doi: 10.1093/biostatistics/kxab037
29. Therasse P, Arbuck SG, Eisenhauer EA, Wanders J, Kaplan RS, Rubinstein L, et al. New guidelines to evaluate the response to treatment in solid tumors. J Natl Cancer Inst. (2000) 92:205–16. doi: 10.1093/jnci/92.3.205
30. Ford R, Schwartz L, Dancey J, Dodd LE, Eisenhauer EA, Gwyther S, et al. Lessons learned from independent central review. Eur J Cancer. (2009) 45:268–74. doi: 10.1016/j.ejca.2008.10.031
31. Petrick NA, Kim HJ, Clunie DA, Borradaile K, Ford R, Zeng R, et al. Evaluation of 1D, 2D and 3D nodule size estimation by radiologists for spherical and non-spherical nodules through CT thoracic phantom imaging. Med Imaging 2011: Computer-Aided Diagn SPIE. (2011) 7963:107–13. doi: 10.1117/12.878265
32. Nakamura T. Corrected score function for errors-in-variables models: Methodology and application to generalized linear models. Biometrika. (1990) 77:127–37. doi: 10.1093/biomet/77.1.127
33. Delaigle A, Hall P. Methodology for non-parametric deconvolution when the error distribution is unknown. J R Stat Soc B. (2015) 78:231–52. doi: 10.1111/rssb.12109
34. Teh YW. “Dirichlet Process”. In: Sammut C, Webb GI. (eds) Encyclopedia of machine learning. (Boston, MA: Springer) (2017). p. 280–7.
35. Ferguson TS. Bayesian density estimation by mixtures of normal distributions. Recent Adv stat Acad Press. (1983) p:287–302. doi: 10.1016/B978-0-12-589320-6.50018-6
36. Neal RM. Markov chain sampling methods for Dirichlet process mixture models. J Compute Graph Stat. (2000) 9:249–65. doi: 10.1080/10618600.2000.10474879
37. Paulino CD, Soares P, Neuhaus J. Binomial regression with misclassification. Biometrics. (2003) 59:670–75. doi: 10.1111/1541-0420.00077
38. Wang Y, Lai X, Wang J, Xu Y, Zhang X, Zhu X, et al. TMBcat: A multi-endpoint p-value criterion on different discrepancy metrics for superiorly inferring tumor mutation burden thresholds. Front Immunol. (2022) 13:995180. doi: 10.3389/fimmu.2022.995180
39. Wang Y, Wang J, Fang W, Xiao X, Wang Q, Zhao J, et al. TMBserval: a statistical explainable learning model reveals weighted tumor mutation burden better categorizing therapeutic benefits. Front Immunol. (2023) 14:1151755. doi: 10.3389/fimmu.2023.1151755
40. Hellmann MD, Callahan MK, Awad MM, Calvo E, Ascierto PA, Atmaca A, et al. Tumor mutational burden and efficacy of nivolumab monotherapy and in combination with ipilimumab in small-cell lung cancer. Cancer Cell. (2019) 35:329. doi: 10.1016/j.ccell.2019.01.011
41. Fang W, Ma Y, Yin JC, Hong S, Zhou H, Wang A, et al. Comprehensive genomic profiling identifies novel genetic predictors of response to anti-PD-(L)1 therapies in non-small cell lung cancer. Clin Cancer Res. (2019) 25:5015–26. doi: 10.1158/1078-0432.CCR-19-0585
42. Rizvi H, Sanchez-Vega F, La K, Chatila W, Jonsson P, Halpenny D, et al. Molecular determinants of response to anti-programmed cell death (PD)-1 and anti-programmed death-ligand 1 (PD-L1) blockade in patients with non-small-cell lung cancer profiled with targeted next-generation sequencing. J Clin Oncol. (2018) 36:633–41. doi: 10.1200/JCO.2017.75.3384
Keywords: tumor mutation burden, immunotherapy endpoints, pairwise error control, positive-threshold optimization, Bayesian framework
Citation: Lai X, Wang S, Zhang X, Zhu X, Liu Y, Chang Z, Wang X, Shao Y, Wang J and Wang Y (2025) TMBocelot: an omnibus statistical control model optimizing the TMB thresholds with systematic measurement errors. Front. Immunol. 15:1514295. doi: 10.3389/fimmu.2024.1514295
Received: 20 October 2024; Accepted: 24 December 2024;
Published: 20 January 2025.
Edited by:
Jinghua Pan, Jinan University, ChinaReviewed by:
Tiejun Tong, Hong Kong Baptist University, Hong Kong SAR, ChinaXing Chen, Jiangnan University, China
Copyright © 2025 Lai, Wang, Zhang, Zhu, Liu, Chang, Wang, Shao, Wang and Wang. This is an open-access article distributed under the terms of the Creative Commons Attribution License (CC BY). The use, distribution or reproduction in other forums is permitted, provided the original author(s) and the copyright owner(s) are credited and that the original publication in this journal is cited, in accordance with accepted academic practice. No use, distribution or reproduction is permitted which does not comply with these terms.
*Correspondence: Jiayin Wang, d2FuZ2ppYXlpbkBtYWlsLnhqdHUuZWR1LmNu; Yixuan Wang, d2FuZ3lpeHVhbkBudWFhLmVkdS5jbg==
†These authors have contributed equally to this work and share first authorship