 Ruoran Wang
 Jianguo Xu
 Min He
- 1Department of Neurosurgery, West China Hospital, Sichuan University, Chengdu, Sichuan, China
- 2Department of Critical Care Medicine, West China Hospital, Sichuan University, Chengdu, Sichuan, China
Background: Leukocytes play an important role in inflammatory response after a traumatic brain injury (TBI). We designed this study to identify TBI phenotypes by clustering blood levels of various leukocytes.
Methods: TBI patients from the Medical Information Mart for Intensive Care-III (MIMIC-III) database were included. Blood levels of neutrophils, lymphocytes, monocytes, basophils, and eosinophils were collected by analyzing the first blood sample within 24 h since admission. Overall, TBI patients were divided into clusters following the K-means clustering method using blood levels of five types of leukocytes. The correlation between identified clusters and mortality was tested by univariate and multivariate logistic regression analyses. The Kaplan–Meier method was used to verify the survival difference between identified TBI clusters.
Results: A total of 172 (cluster 1), 791 (cluster 2), and 636 (cluster 3) TBI patients were divided into three clusters with the following percentages, 10.8%, 49.5%, and 39.8%, respectively. Cluster 1 had the lowest Glasgow Coma Scale (GCS) and the highest Injury Severity Score (ISS) while cluster 2 had the highest GCS and the lowest ISS. The mortality rates of the three clusters were 25.6%, 13.3%, and 18.1%, respectively. The multivariate logistic regression indicated that cluster 1 had a higher mortality risk (OR = 2.211, p = 0.003) than cluster 2, while cluster 3 did not show a significantly higher mortality risk than cluster 2 (OR = 1.285, p = 0.163). Kapan–Meier analysis showed that cluster 1 had shorter survival than cluster 2 and cluster 3.
Conclusion: Three TBI phenotypes with different inflammatory statuses and mortality rates were identified based on blood levels of leukocytes. This classification is helpful for physicians to evaluate the prognosis of TBI patients.
1 Introduction
Occurring widely with an estimated incidence of 69 million each year globally, traumatic brain injury (TBI) brings huge burdens to families of patients and to social economy (1). The mortality of TBI patients is high, especially severe TBI, with the mortality rate ranging from 23.0%–38.8% (2, 3). Accurate and convenient risk stratification of admitted TBI patients in the early phase is helpful for clinicians in making personalized treatments. The conventional tool of risk stratification for TBI is the Glasgow Coma Scale (GCS), which is evaluated based on clinical symptoms. However, single GCS could not comprehensively reflect the severity and progression of TBI patients due to the complex pathophysiological process of TBI and would be influenced by intubation and status of sedation. Identifying TBI phenotypes with different risks of clinical outcomes using laboratory biomarkers may make up for the insufficiency of GCS and guide clinicians in making specific treatment options based on pathophysiological processes.
Previous studies have explored phenotypes of some critically ill patients with acute kidney injury, sepsis, or acute respiratory distress syndrome using clustering methods (4–7). Composed of neutrophils, lymphocytes, monocytes, basophils, and eosinophils, leukocytes are recruited to the injured brain tissue and activated to participate in neuroinflammation after TBI (8–13). Previous studies have used the value of a single type of leukocytes or the neutrophil-to-lymphocyte ratio to reflect the inflammatory status and predict the prognosis of TBI (14–19). There is no study yet using blood values of all types of leukocytes to evaluate the prognosis of TBI. We designed this study to identify TBI phenotypes based on blood values of leukocytes using the K-means clustering method.
2 Materials and methods
2.1 Patients
The data for this study were extracted from the Medical Information Mart for Intensive Care-III (MIMIC-III) database produced by the Beth Israel Deaconess Medical Center (BIDMC). This database was approved by the institutional review boards of the Massachusetts Institute of Technology (MIT) and BIDMC. All patients included in this database were de-identified and anonymized for privacy protection. Written informed consent was waived due to the nature of the database study. The study design was approved by the review board of West China Hospital (2021-1598).
The MIMIC-III is a free, public database of collected clinical records of critically ill patients who received treatments in intensive care units of the BIDMC (Boston, MA) between 2001 and 2012. The MIMIC-III database was designed and produced by MIT (Cambridge, MA) and received ethical approval from the institutional review boards of MIT and BIDMC, respectively. The diagnosis of TBI was identified according to ICD-9 codes: 80000-80199; 80300-80499; and 8500-85419. Overall, from 2,680 TBI patients, some were excluded due to the following standards: (1) lacked records of leukocytes on the first day (n = 1,018); (2) lacked records of GCS on admission (n = 25); and (3) lacked records of vital signs on admission (n = 38) (Figure 1). A total of 1,599 TBI patients were finally included in the study.
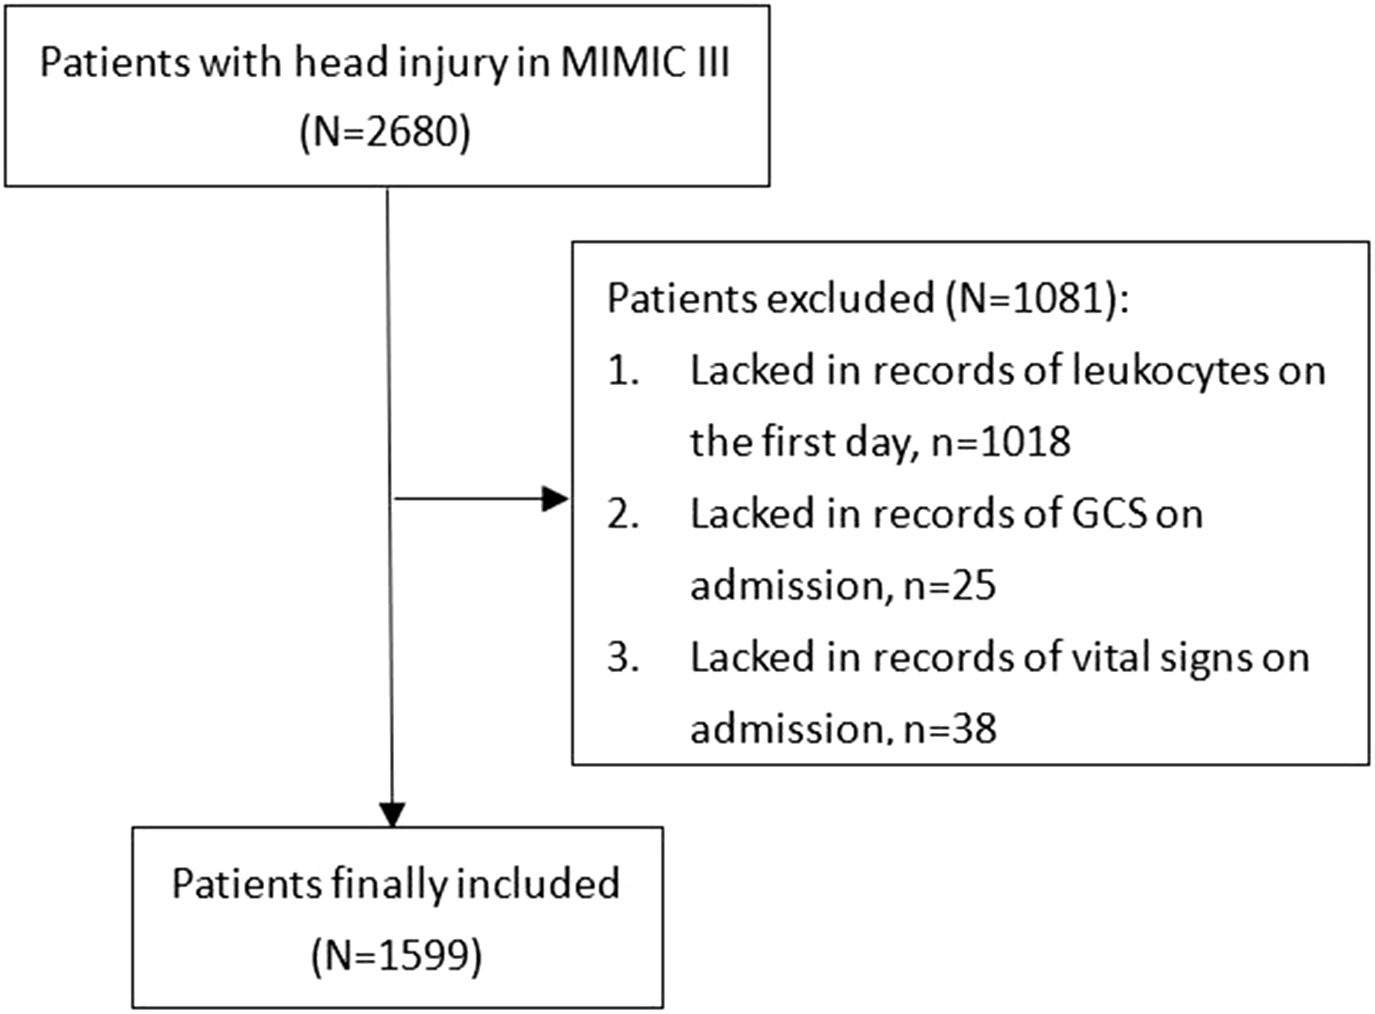
Figure 1. Flowchart of the patients’ inclusion.
2.2 Data collection
Baseline characteristics including age, gender, blood pressure, SpO2, and comorbidities (diabetes, hypertension, hyperlipidemia, coronary heart disease, and cancer) were recorded. Disease severity was evaluated by including Glasgow Coma Scale (GCS), Injury Severity Score (ISS), and Sequential Organ Failure Assessment (SOFA). The values of blood biochemical and blood routine examination were obtained by analyzing the first blood sample within 24 h since admission. The number of leukocytes including neutrophils, lymphocytes, monocytes, basophils, and eosinophils was part of the blood routine examination.
2.3 Statistical analysis
Overall, TBI patients were divided into clusters by the unsupervised K-means clustering method using values of five kinds of leukocytes (neutrophils, lymphocytes, monocytes, basophils, and eosinophils). The K-means clustering is an iterative algorithm that involves pre-dividing data into K groups, randomly selecting K objects as the initial clustering centers, and then calculating the distance between each object and each seed clustering center. Each object is assigned to the nearest cluster center. The cluster centers and the objects assigned to them represent a cluster. The optimal number of clusters was determined according to the gap statistic criterion. The differences in baseline characteristics and clinical outcomes among clusters were analyzed by Kruskal–Wallis test and Pearson’s χ2 test. Additionally, inflammatory markers including neutrophil-to-lymphocyte ratio (NLR), monocyte-to-lymphocyte ratio (MLR), platelet-to-lymphocyte ratio (PLR), neutrophil-to-monocyte ratio (NMR), and systemic inflammation index (SII = platelet × neutrophil/lymphocyte) were compared between clusters. The correlation between TBI clusters and mortality was confirmed by univariate and multivariate logistic regression analyses. The Kaplan–Meier method was used to verify the survival difference among identified TBI clusters.
A two-sided p value < 0.05 was considered statistically significant. The R software (version 3.6.1; R Foundation) was used for statistical analyses.
3 Results
3.1 Comparison of characteristics among identified TBI clusters
The optimal number of TBI clusters determined by the gap statistic criterion was 3 (Figure 2A). Two components of the cluster plots explained the 61.9% variability of the point (Figure 2B). A total of 172, 791, and 636 patients were divided into cluster 1, cluster 2, and cluster 3, respectively, with percentages of 10.8%, 49.5%, and 39.8% (Table 1). Age (p < 0.001), incidence of comorbidities including diabetes (p = 0.008), hypertension (p < 0.001), hyperlipidemia (p = 0.004), coronary heart disease (p = 0.019), and cancer (p < 0.001) showed different distributions among the three clusters. Cluster 1 had the lowest GCS and the highest ISS while cluster 2 had the highest GCS and the lowest ISS. The SOFA score did not differ among the three clusters (p = 0.256). Cluster 1 had the highest value of WBC, neutrophil, lymphocyte, monocyte, platelet, RBC, hemoglobin, and glucose (Figure 3). Cluster 2 had the lowest value of WBC, neutrophil, monocyte, platelet, RBC, hemoglobin, and glucose. Regarding inflammatory markers, cluster 1 showed a higher inflammatory status reflected by higher levels of NLR, MLR, PLR, NMR, and SII. In contrast, cluster 2 showed a lower inflammatory status indicated by lower levels of NLR, MLR, PLR, NMR, and SII. Similarly, cluster 1 had a higher incidence of mechanical ventilation, 30-day mortality, and longer length of ICU stay and length of hospital stay (Figure 4). Cluster 2 had a lower incidence of mechanical ventilation, 30-day mortality, and shorter length of ICU stay and length of hospital stay.
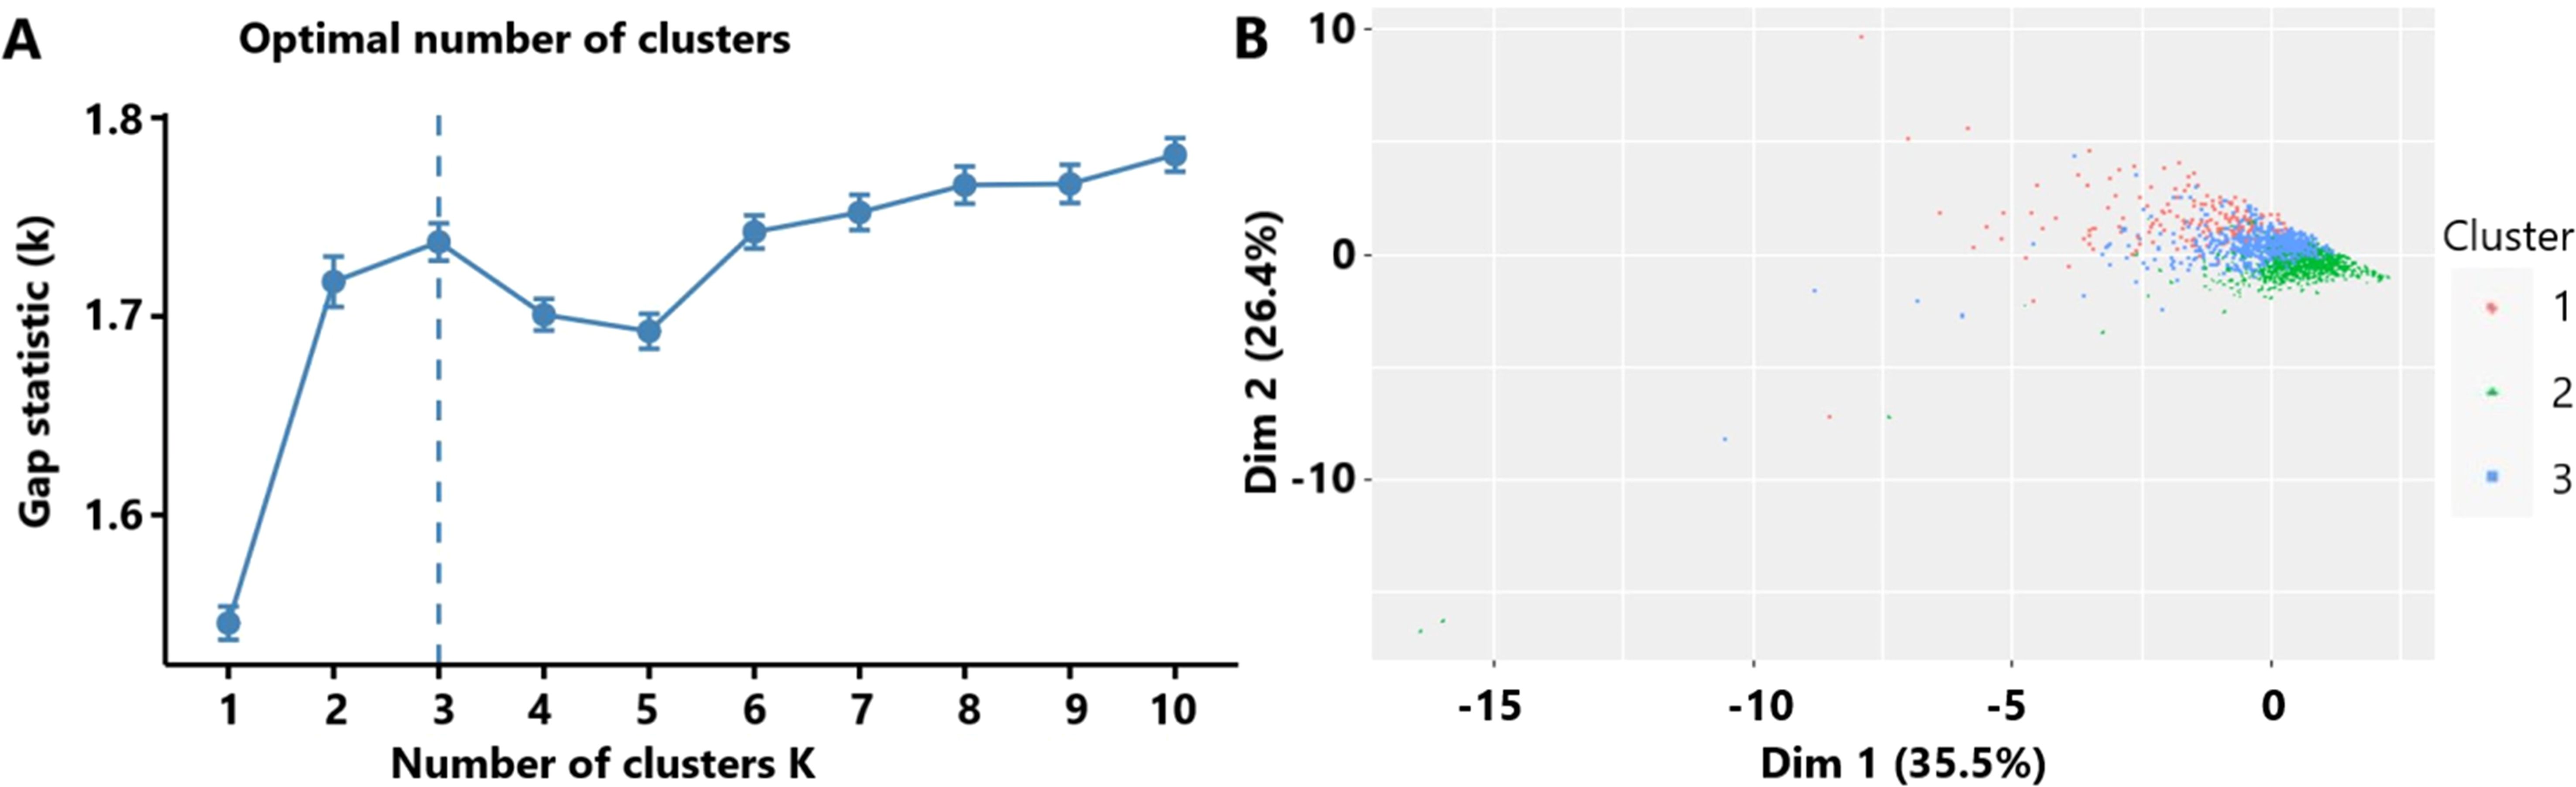
Figure 2. (A) The optimal number of clusters as determined by the gap statistic criterion. (B) Clusters’ plot. These two components explain the 61.9% point variability.
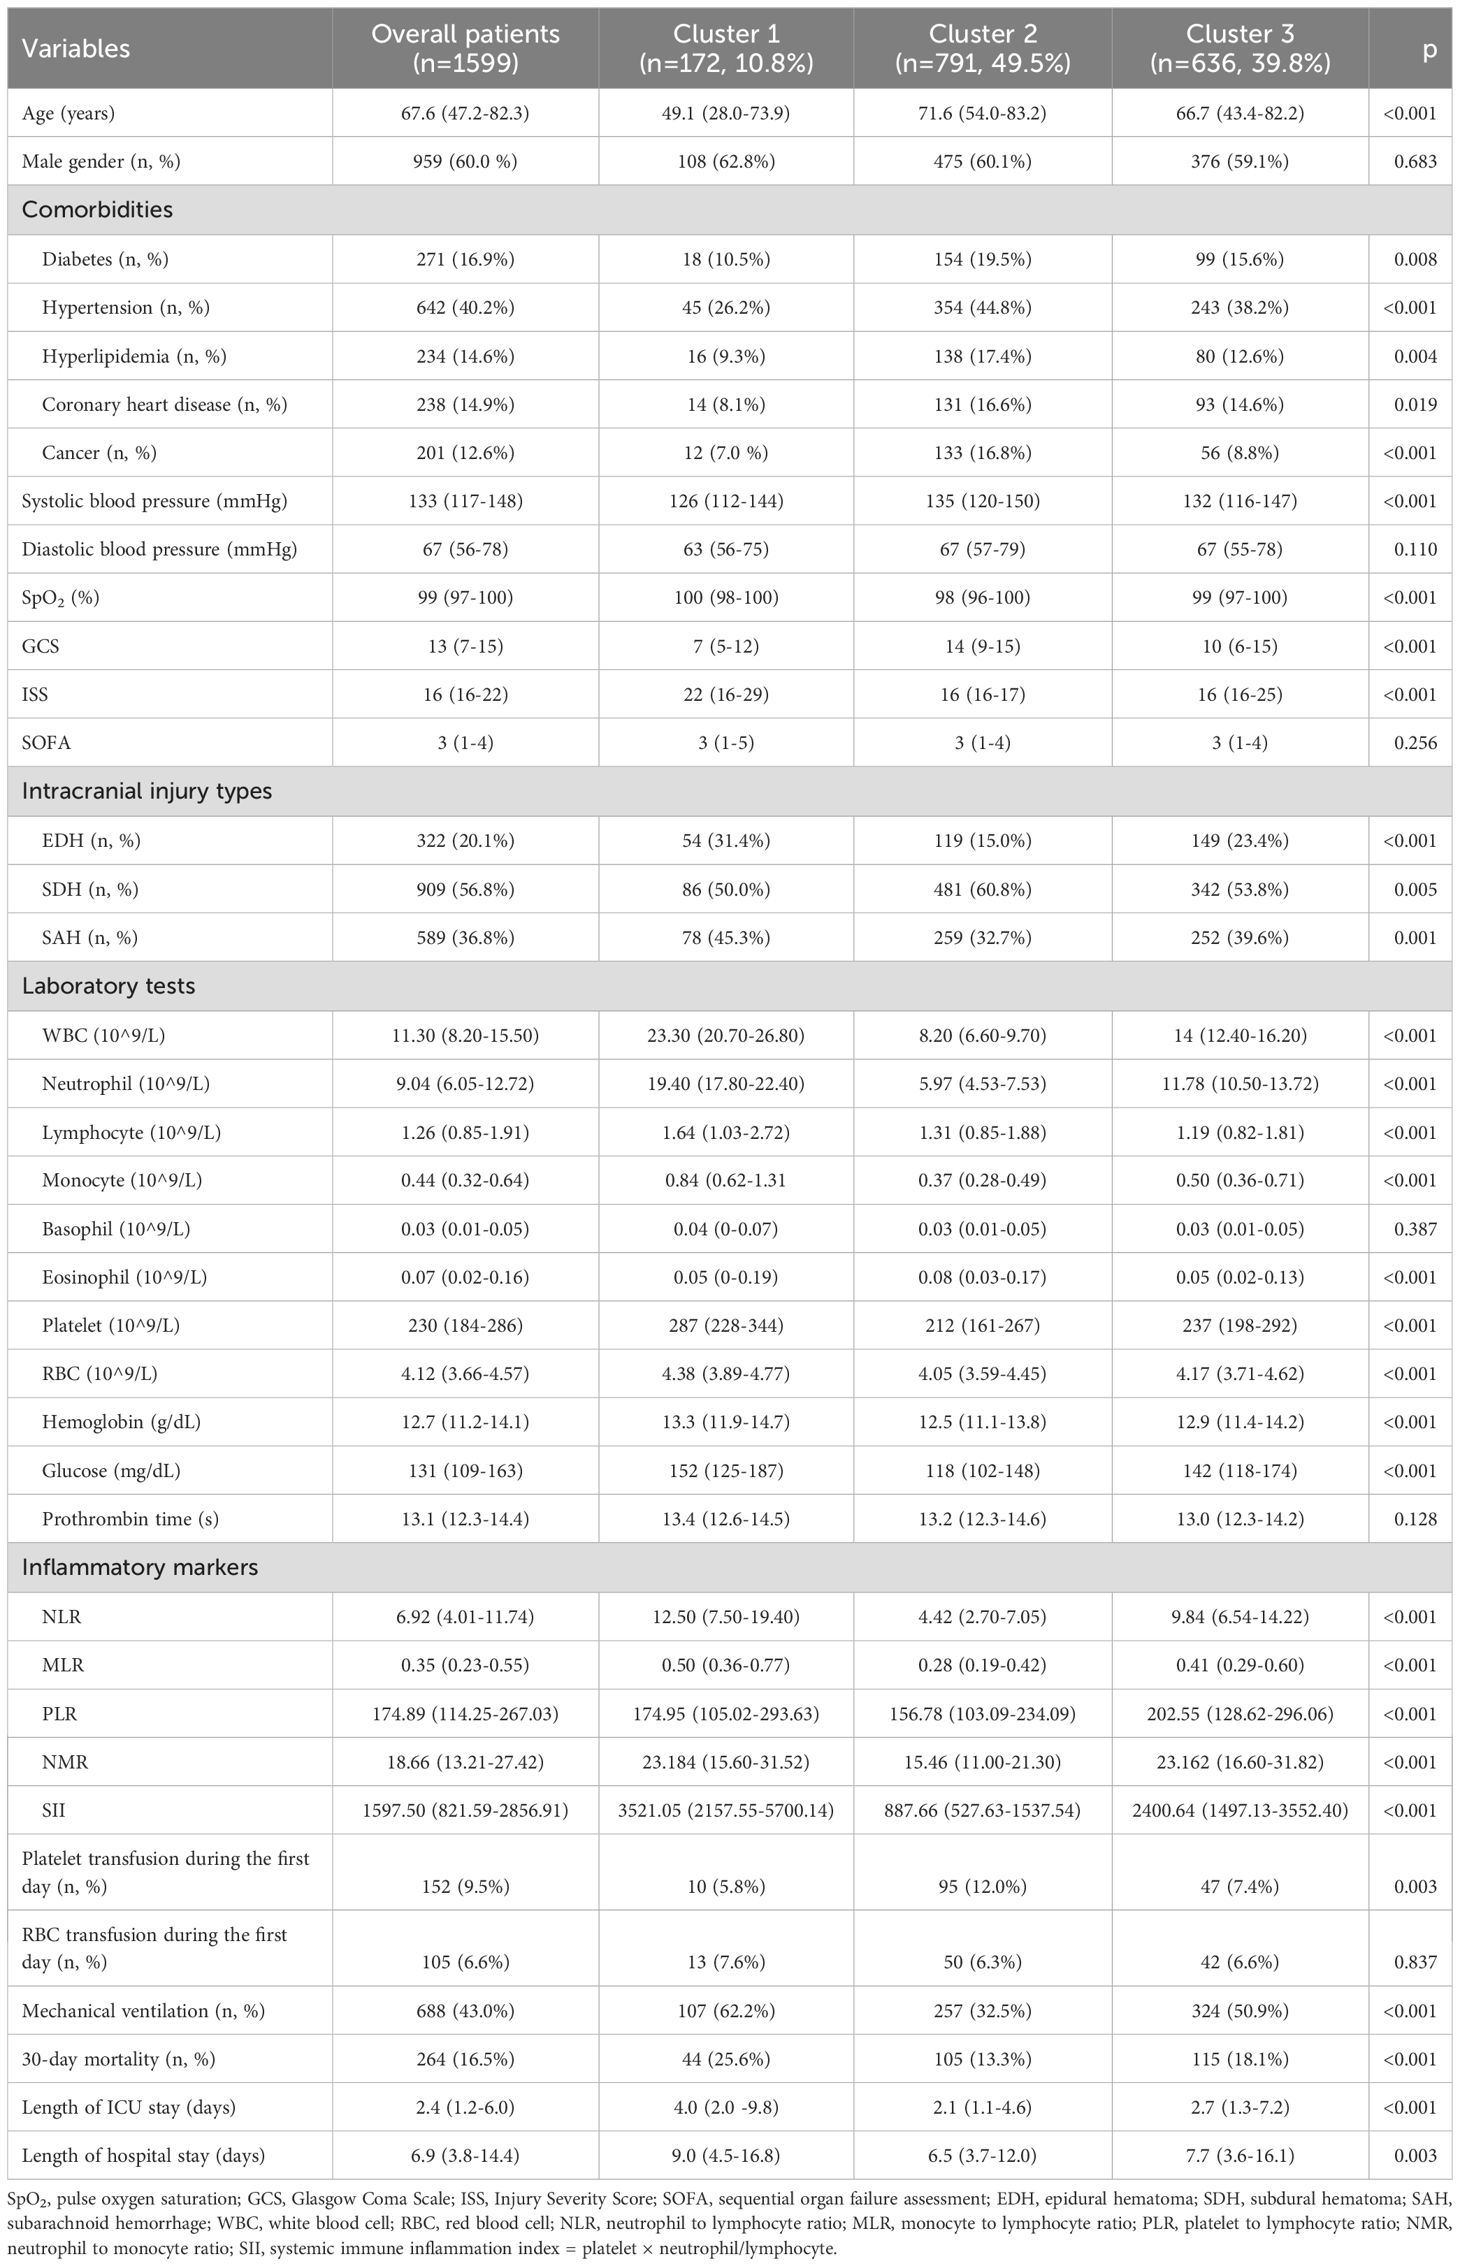
Table 1. Baseline characteristics of included TBI patients.
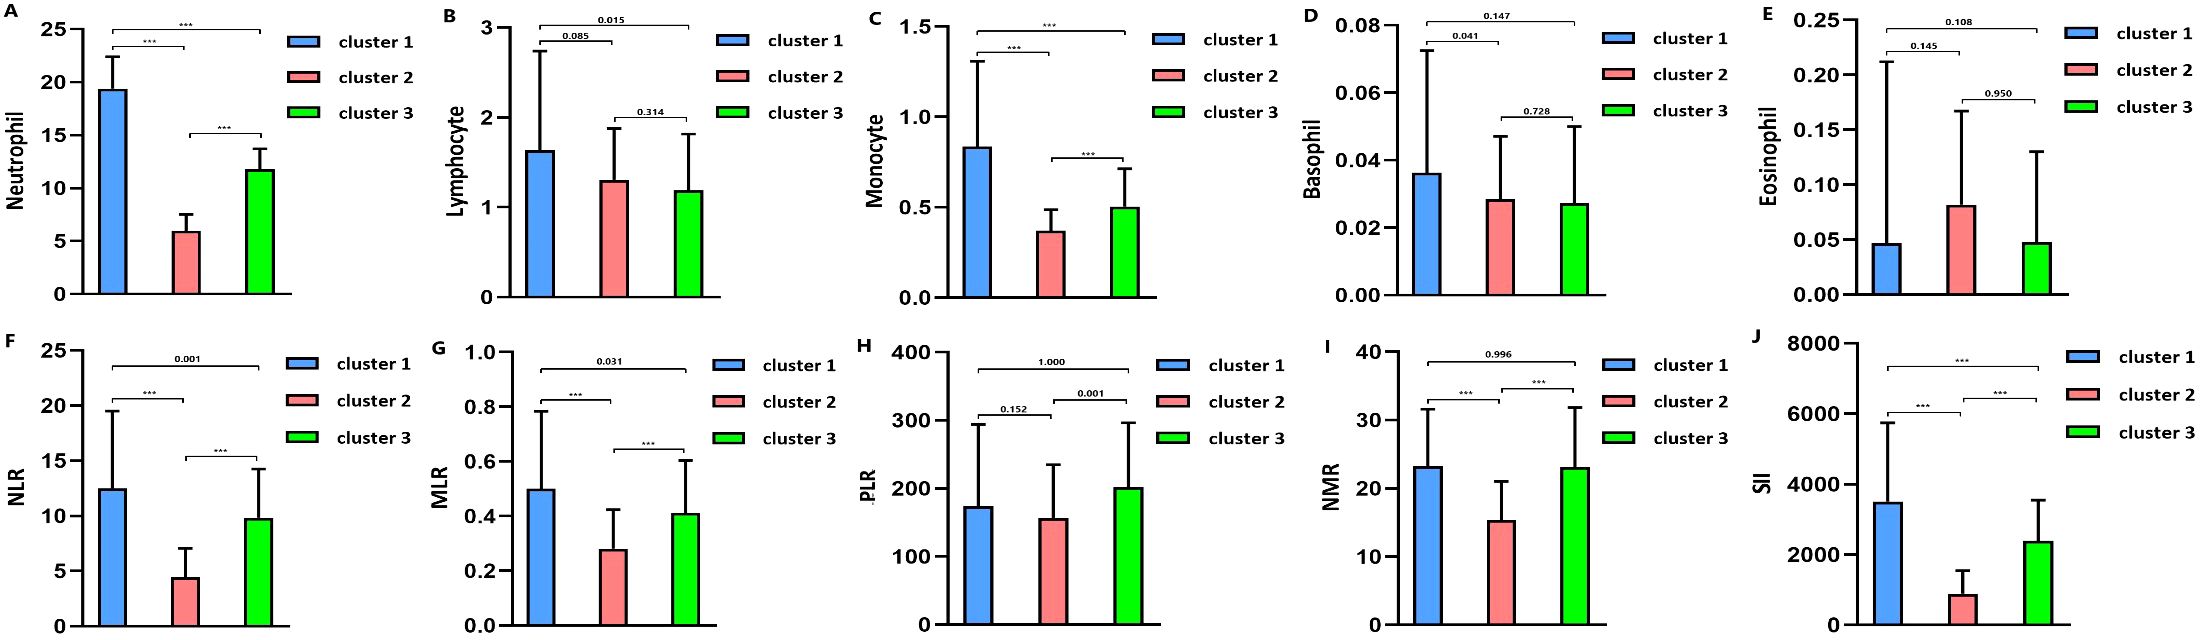
Figure 3. (A) Blood neutrophil level in clusters. (B) Blood lymphocyte level in clusters. (C). Blood monocyte level in clusters. (D) Blood basophil level in clusters. (E) Blood eosinophil level in clusters. (F) Neutrophil-to-lymphocyte ratio (NLR) level in clusters. (G) Monocyte-to-lymphocyte (MLR) level in clusters. (H) Platelet-to-lymphocyte (PLR) level in clusters. (I) Neutrophil-to-monocyte (NMR) level in clusters. (J) Systemic inflammation index (SII) level in clusters. *** means p value<0.001.
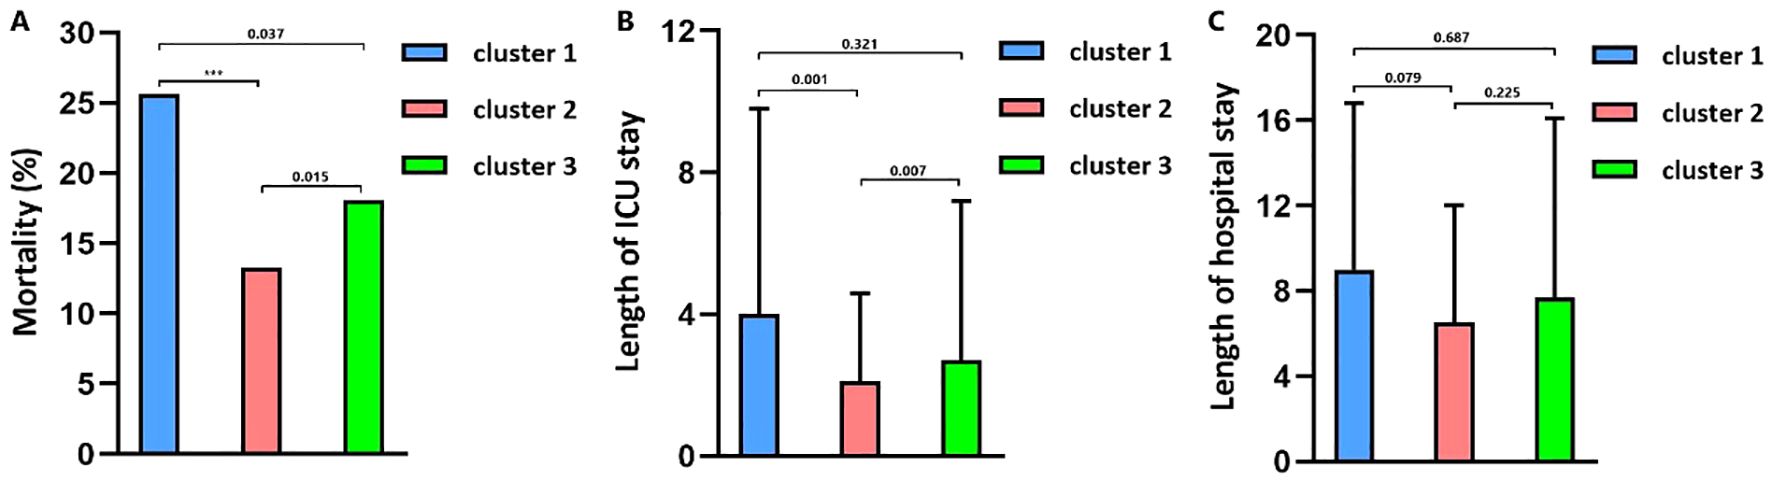
Figure 4. (A) The 30-day mortality in clusters. (B) Length of ICU stay in clusters. (C) Length of hospital stay in clusters.
3.2 Relationship between identified clusters and outcomes of TBI
The mortality rates of the three clusters were 25.6%, 13.3%, and 18.1%, respectively. Univariate regression showed that cluster 1 (OR = 2.246, p < 0.001) and cluster 3 (OR = 1.442, p = 0.003) had higher mortality risks than cluster 2 (Table 2). Additionally, age (p < 0.001), diabetes (p < 0.001), hypertension (p = 0.216), cancer (p = 0.005), diastolic blood pressure (p = 0.038), GCS (p < 0.001), ISS (p < 0.001), SOFA (p < 0.001), SAH (p = 0.040), platelet (p = 0.016), RBC (p < 0.001), hemoglobin (p < 0.001), glucose (p < 0.001), and prothrombin time (p = 0.006) were significantly associated with TBI mortality. After adjusting the confounding effects of those factors, multivariate logistic regression indicated that cluster 1 had a higher mortality risk (OR = 2.211, p = 0.003) than cluster 2 while cluster 3 did not show a significantly higher mortality risk than cluster 2 (OR = 1.285, p = 0.163). Kapan–Meier analysis found that cluster 1 (p < 0.001) had shorter survival than cluster 2 (p < 0.001) and cluster 3 (p = 0.024; Figure 5). Cluster 3 had shorter survival than cluster 2 (p = 0.009).
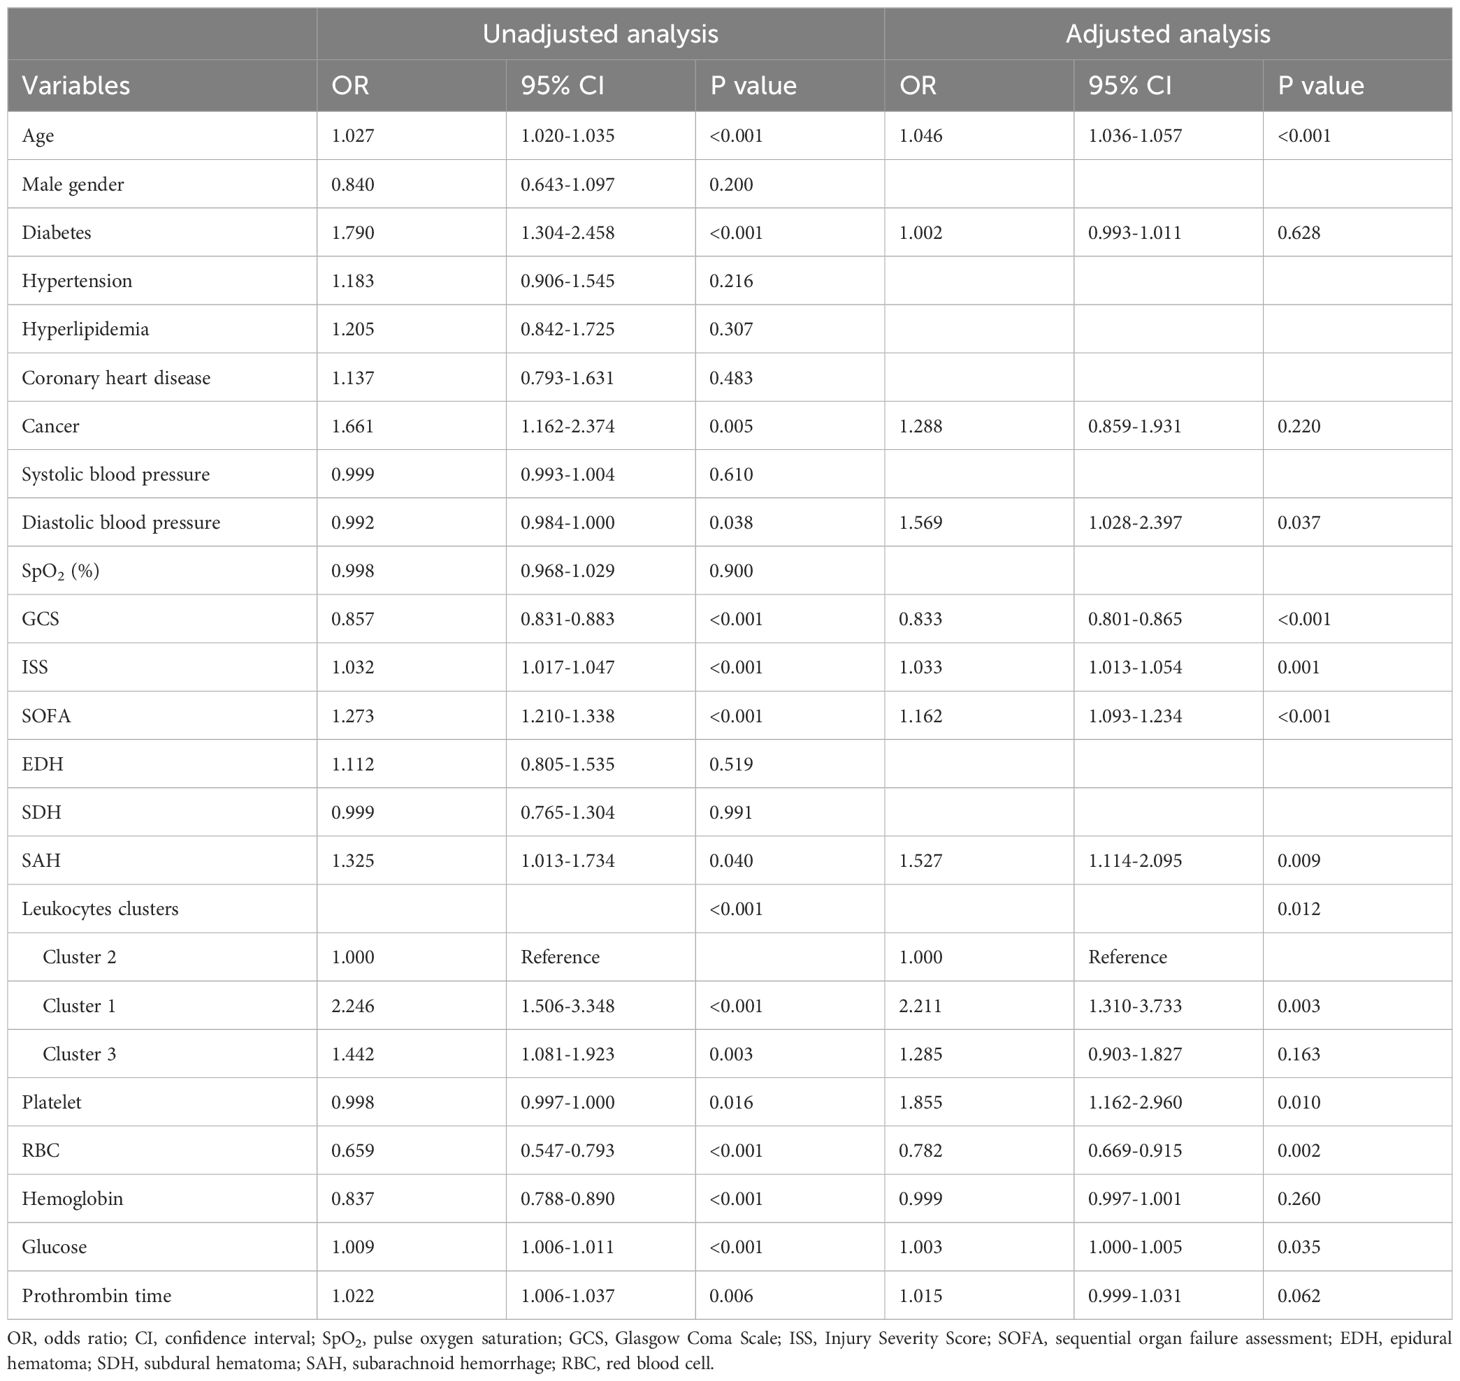
Table 2. Univariate and multivariate logistic regression analysis of risk factors for mortality in TBI patients.
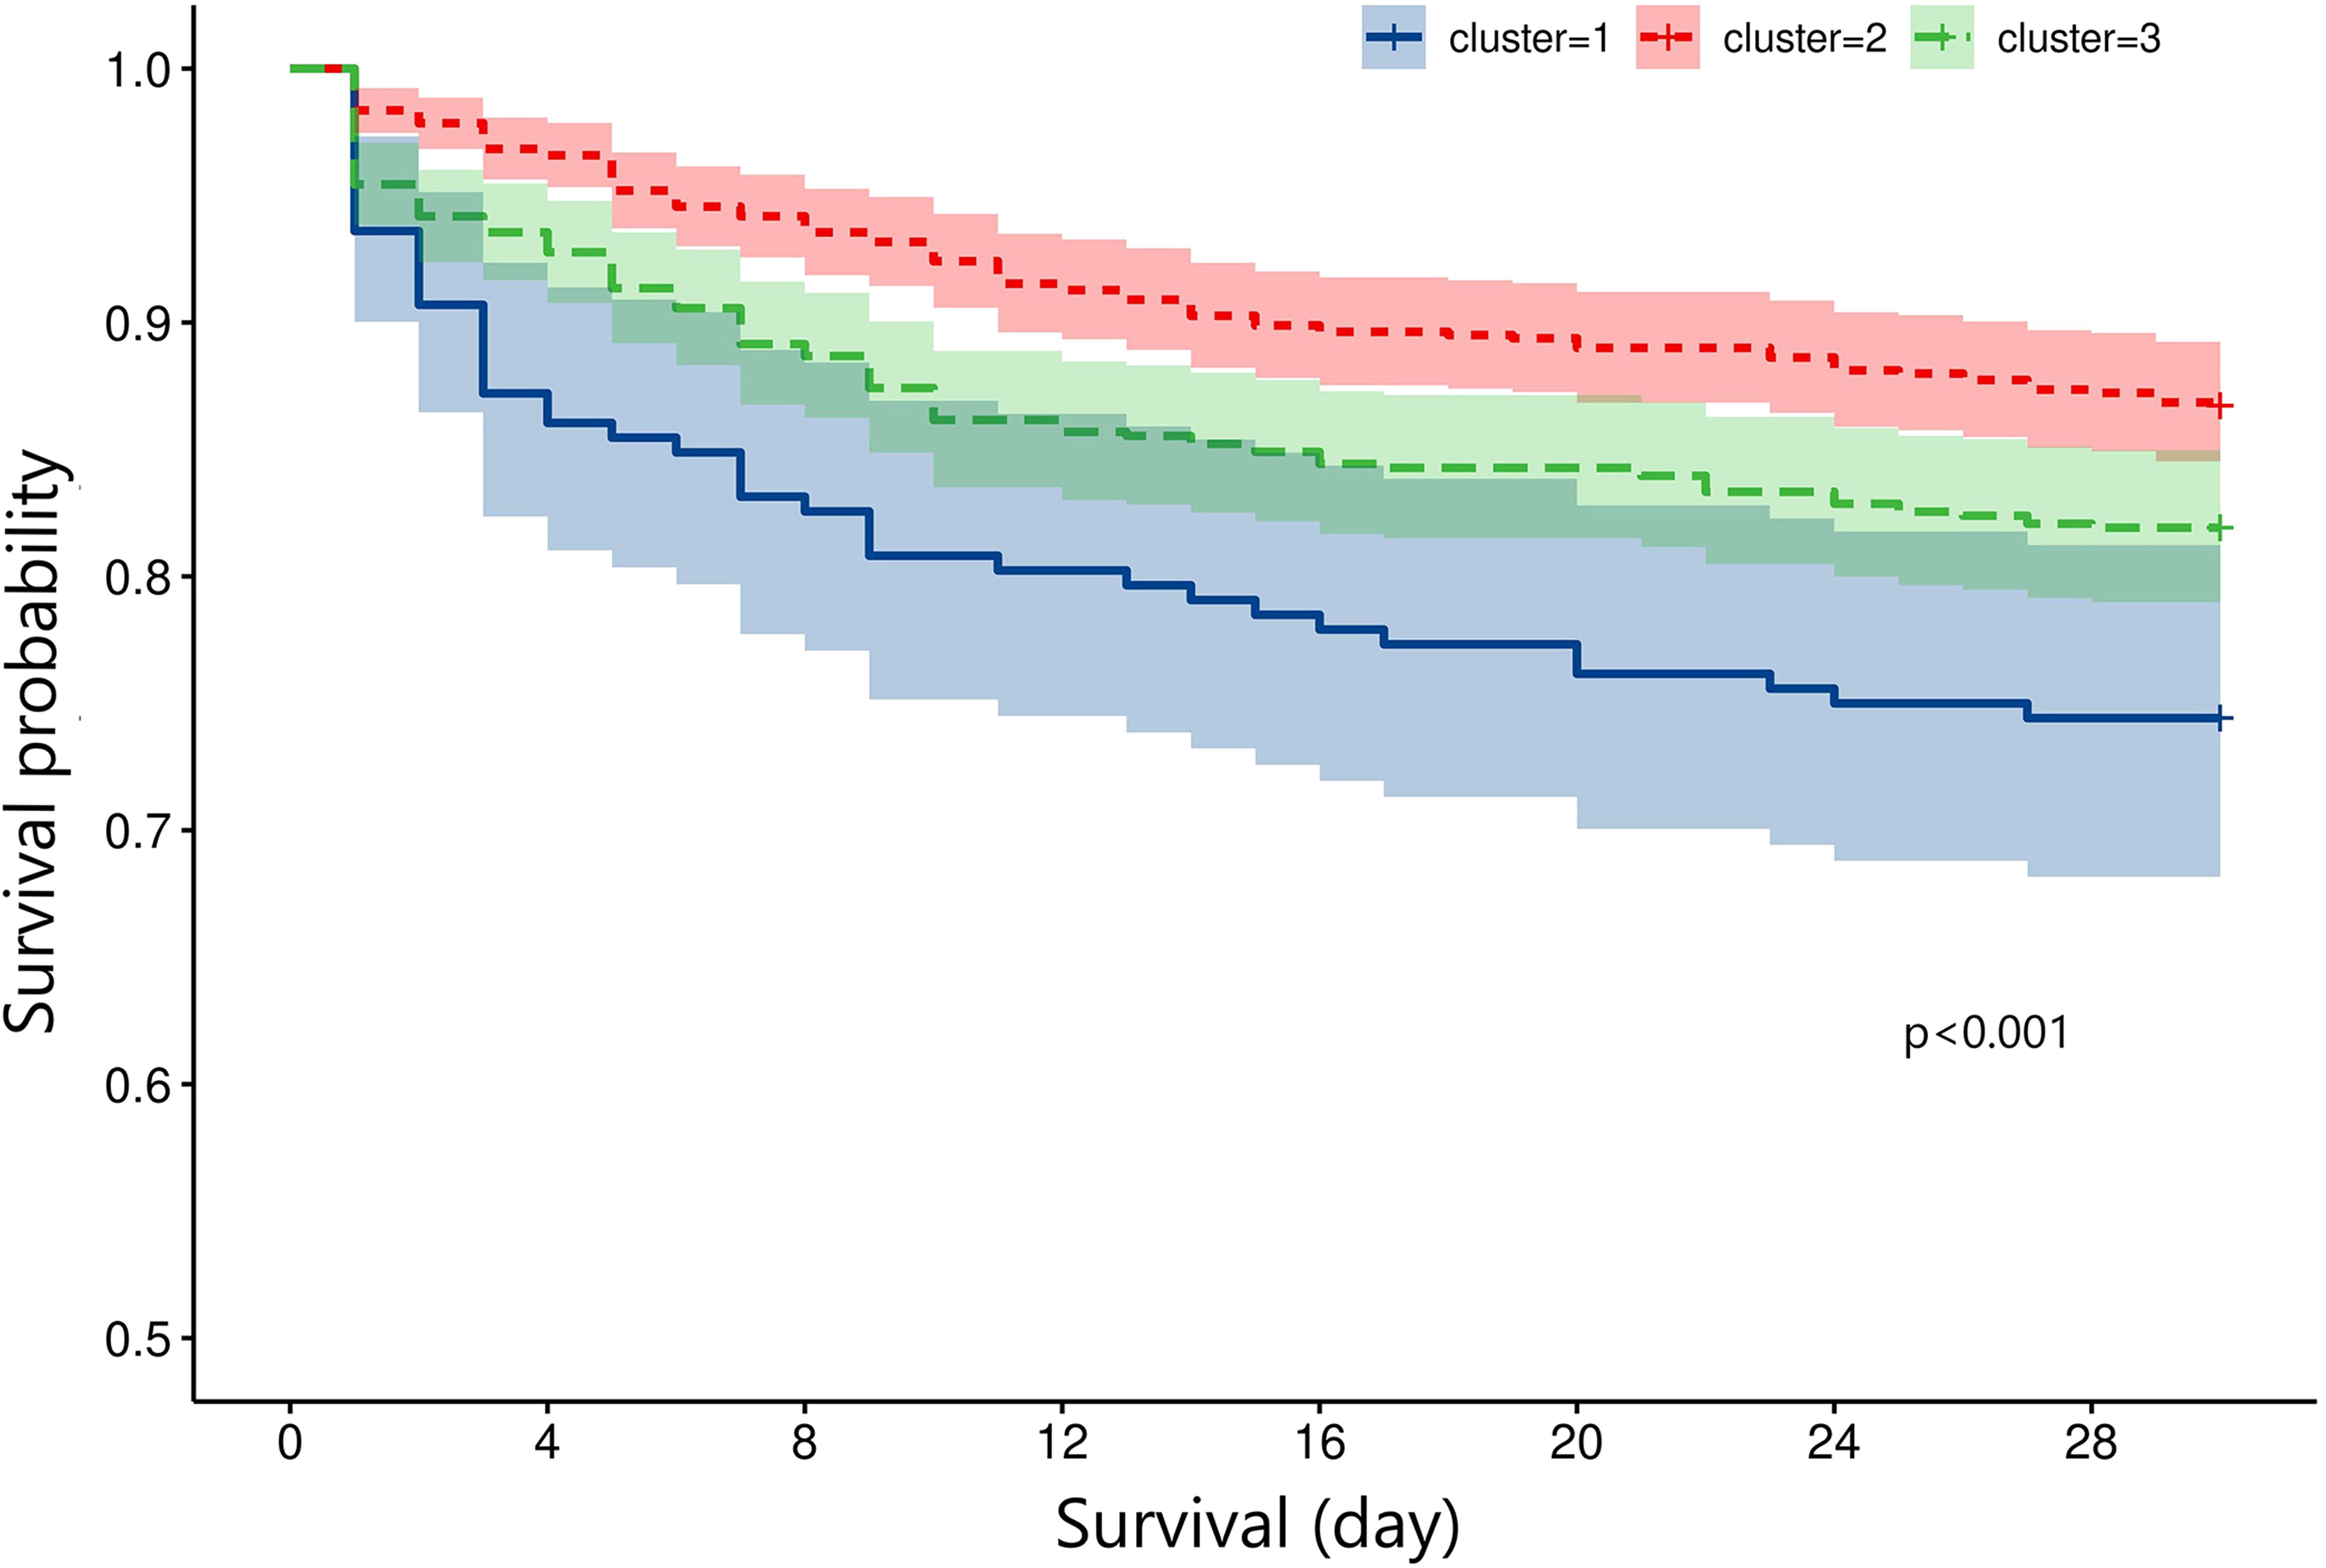
Figure 5. Survival curve of the three clusters by the Kaplan–Meier method.
4 Discussion
We found that the three TBI clusters had different inflammatory statuses through the clustering of peripheral leukocytes. Cluster 1 with a higher inflammatory status had a worse prognosis than cluster 2 with a lower inflammatory status. TBI could induce an increase in leukocytes soon after an initial injury. Neutrophils would be released from the bone marrow by stimulating cortisol and catecholamines after TBI (20). The activated microglia after TBI would then activate the endothelial cell and recruit the peripheral neutrophil to infiltrate the injured area by releasing inflammatory chemokines and cytokines (8, 9). Then, activated T cells and monocytes/macrophages would be recruited to the injured brain area and participate in the response of the adaptive immune system for the injured brain tissue (10–13). These cells would interactively activate and promote a secondary brain injury by aggravating neuroinflammation and immune response (21).
The relatively lower level of lymphocytes in the cluster and the higher level of lymphocytes in cluster 2 indicated that the peripheral immunosuppressive status might be related with a higher inflammatory status and worse outcome. Actually, previous studies found that TBI could cause the acute increase of cortisol levels both in serum and cerebrospinal fluid (22, 23). The increased plasma cortisol in the early phase after TBI would prevent the lymphocyte egress from the secondary lymphoid tissues, which may be an endogenous protective response to inhibit the excessive infiltration of T cells in the injured brain area, subsequently amplifying neuroinflammation (24). However, the peripheral immunosuppressive status is certainly associated with a higher risk of infection among extracranial organs.
Many previous studies used the value of a single type of leukocytes or neutrophil-to-lymphocyte ratio to evaluate the risk of poor prognosis of TBI (14–19), while not all types of leukocytes were included and analyzed to evaluate the prognosis risk, which was a limitation of these studies. We performed this study to identify inflammatory clusters of TBI patients with different mortality risks by comprehensively clustering multiple types of leukocytes, namely, neutrophils, lymphocytes, monocytes, basophils, and eosinophils. Three inflammatory clusters of TBI were identified and were consistent with their GCS. This classification is beneficial for physicians to stratify risks and make personalized treatment schedules. It may also be helpful to identify TBI subgroups benefiting from specific treatments targeted at inflammation.
Several limitations were unavoidable in this study. Firstly, a number of patients were excluded from this study mainly due to lack of records on leukocytes on the first day, causing a selection bias. The classification we identified should be further verified in other medical centers with more generalized TBI patients and a prospective design collecting levels of leukocytes at a fixed time period, as early as possible, after admission. Secondly, specific subgroups of lymphocytes were not analyzed including NK cells, B cells, cytotoxic T cells, and regulatory T cells due to lack of records from the MIMIC-III database. Thirdly, common inflammation markers such as C-reactive protein, interleukin-1, interlukin-6, TNF-α, and interferon-γ were not analyzed among the three clusters due to lack of records from MIMIC-III. Future studies could be performed to measure these markers among our identified clusters and evaluate the consistency between these markers and clusters with different inflammatory statuses. Fourthly, functional outcomes and recovery statuses were not recorded in MIMIC-III, so we were unable to analyze the relationship between the discovered three clusters and these outcomes. Future studies could be designed to verify the importance of the three clusters on functional outcomes and recovery statuses. Finally, agents with immunomodulatory effects or cytotoxicity were not particularly extracted and analyzed, which may limit the reliability of our classifications.
5 Conclusion
Three TBI clusters with different inflammatory statuses and prognoses were identified based on levels of blood leukocytes. This classification is beneficial for physicians in evaluating the prognosis and making personalized treatments for TBI patients.
Data availability statement
Publicly available datasets were analyzed in this study. This data can be found here: https://physionet.org/content/mimiciii/1.4/.
Ethics statement
The studies involving humans were approved by Ethics Committee of the West China hospital (2021-1598). The studies were conducted in accordance with the local legislation and institutional requirements. The participants provided their written informed consent to participate in this study.
Author contributions
RW: Conceptualization, Data curation, Formal Analysis, Writing – original draft. JX: Funding acquisition, Supervision, Validation, Writing – review & editing. MH: Funding acquisition, Supervision, Validation, Writing – review & editing, Project administration.
Funding
The author(s) declare that financial support was received for the research, authorship, and/or publication of this article. This study was funded by the Sichuan Science and Technology Program (24QYCX0411, 2024YFHZ0070), the 1•3•5 project for disciplines of excellence—Clinical Research Incubation Project, West China Hospital, Sichuan University (2020HXFH036), and the National Natural Science Foundation of China (82173175).
Conflict of interest
The authors declare that the research was conducted in the absence of any commercial or financial relationships that could be construed as a potential conflict of interest.
Generative AI statement
The author(s) declare that no Generative AI was used in the creation of this manuscript.
Publisher’s note
All claims expressed in this article are solely those of the authors and do not necessarily represent those of their affiliated organizations, or those of the publisher, the editors and the reviewers. Any product that may be evaluated in this article, or claim that may be made by its manufacturer, is not guaranteed or endorsed by the publisher.
References
1. Dewan MC, Rattani A, Gupta S, Baticulon RE, Hung YC, Punchak M, et al. Estimating the global incidence of traumatic brain injury. J Neurosurg. (2018) 2018:1–18. doi: 10.3171/2017.10.JNS17352
2. Roozenbeek B, Chiu YL, Lingsma HF, Gerber LM, Steyerberg EW, Ghajar J, et al. Predicting 14-day mortality after severe traumatic brain injury: application of the IMPACT models in the brain trauma foundation TBI-trac® New York State database. J Neurotrauma. (2012) 29:1306–12. doi: 10.1089/neu.2011.1988
3. Dawes AJ, Sacks GD, Cryer HG, Gruen JP, Preston C, Gorospe D, et al. Intracranial pressure monitoring and inpatient mortality in severe traumatic brain injury: A propensity score-matched analysis. J Trauma acute Care Surg. (2015) 78:492–501; discussion 501-492. doi: 10.1097/TA.0000000000000559
4. Boussina A, Wardi G, Shashikumar SP, Malhotra A, Zheng K, Nemati S. Representation learning and spectral clustering for the development and external validation of dynamic sepsis phenotypes: observational cohort study. J Med Internet Res. (2023) 25:e45614. doi: 10.2196/45614
5. Lai CF, Liu JH, Tseng LJ, Tsao CH, Chou NK, Lin SL, et al. Unsupervised clustering identifies sub-phenotypes and reveals novel outcome predictors in patients with dialysis-requiring sepsis-associated acute kidney injury. Ann Med. (2023) 55:2197290. doi: 10.1080/07853890.2023.2197290
6. Sinha P, Kerchberger VE, Willmore A, Chambers J, Zhuo H, Abbott J, et al. Identifying molecular phenotypes in sepsis: an analysis of two prospective observational cohorts and secondary analysis of two randomised controlled trials. Lancet Respir Med. (2023) 11(11):965–74. doi: 10.1016/S2213-2600(23)00237-0
7. Chen H, Yu Q, Xie J, Liu S, Pan C, Liu L, et al. Longitudinal phenotypes in patients with acute respiratory distress syndrome: a multi-database study. Crit Care (London England). (2022) 26:340. doi: 10.1186/s13054-022-04211-w
8. Zhou H, Lapointe BM, Clark SR, Zbytnuik L, Kubes P. A requirement for microglial TLR4 in leukocyte recruitment into brain in response to lipopolysaccharide. J Immunol (Baltimore Md: 1950). (2006) 177:8103–10. doi: 10.4049/jimmunol.177.11.8103
9. Clark RS, Schiding JK, Kaczorowski SL, Marion DW, Kochanek PM. Neutrophil accumulation after traumatic brain injury in rats: comparison of weight drop and controlled cortical impact models. J Neurotrauma. (1994) 11:499–506. doi: 10.1089/neu.1994.11.499
10. Holmin S, Mathiesen T. Biphasic edema development after experimental brain contusion in rat. Neurosci Lett. (1995) 194:97–100. doi: 10.1016/0304-3940(95)11737-H
11. Beschorner R, Nguyen TD, Gözalan F, Pedal I, Mattern R, Schluesener HJ, et al. CD14 expression by activated parenchymal microglia/macrophages and infiltrating monocytes following human traumatic brain injury. Acta neuropathologica. (2002) 103:541–9. doi: 10.1007/s00401-001-0503-7
12. Ziebell JM, Morganti-Kossmann MC. Involvement of pro- and anti-inflammatory cytokines and chemokines in the pathophysiology of traumatic brain injury. Neurotherapeutics: J Am Soc Exp Neurother. (2010) 7:22–30. doi: 10.1016/j.nurt.2009.10.016
13. Jassam YN, Izzy S, Whalen M, McGavern DB, El Khoury J. Neuroimmunology of traumatic brain injury: time for a paradigm shift. Neuron. (2017) 95:1246–65. doi: 10.1016/j.neuron.2017.07.010
14. Mukherjee S, Sivakumar G, Goodden JR, Tyagi AK, Chumas PD. Prognostic value of leukocytosis in pediatric traumatic brain injury. J Neurosurg Pediatr. (2020) 27:335–45. doi: 10.3171/2020.7.PEDS19627
15. Li Z, Wu X, Wu X, Yu J, Yuan Q, Du Z, et al. Admission circulating monocytes level is an independent predictor of outcome in traumatic brain injury. Brain injury. (2018) 32:515–22. doi: 10.1080/02699052.2018.1429023
16. Matias LF, Pimentel MD, Medeiros MF, Rocha FR, Gambetta MV, Lopes SC. Predictive value of neutrophil-to-lymphocyte ratio and neutrophil-to-monocyte ratio in severe traumatic brain injury: a retrospective cohort. J neurosurgical Sci. (2023) 68(5):604–11. doi: 10.23736/S0390-5616.23.05877-0
17. Alexiou GA, Lianos GD, Zika J, Alexiou ES, Voulgaris S. Neutrophil-to-lymphocyte ratio to predict prognosis in traumatic brain injury. Am J Emergency Med. (2022) 56:341. doi: 10.1016/j.ajem.2021.09.017
18. Chen L, Xia S, Zuo Y, Lin Y, Qiu X, Chen Q, et al. Systemic immune inflammation index and peripheral blood carbon dioxide concentration at admission predict poor prognosis in patients with severe traumatic brain injury. Front Immunol. (2022) 13:1034916. doi: 10.3389/fimmu.2022.1034916
19. Ge X, Zhu L, Li M, Li W, Chen F, Li Y, et al. A novel blood inflammatory indicator for predicting deterioration risk of mild traumatic brain injury. Front Aging Neurosci. (2022) 14:878484. doi: 10.3389/fnagi.2022.878484
20. Hazeldine J, Naumann DN, Toman E, Davies D, Bishop JRB, Su Z, et al. Prehospital immune responses and development of multiple organ dysfunction syndrome following traumatic injury: A prospective cohort study. PloS Med. (2017) 14:e1002338. doi: 10.1371/journal.pmed.1002338
21. Simon DW, McGeachy MJ, Bayır H, Clark RS, Loane DJ, Kochanek PM. The far-reaching scope of neuroinflammation after traumatic brain injury. Nat Rev Neurol. (2017) 13:171–91. doi: 10.1038/nrneurol.2017.13
22. Wagner AK, McCullough EH, Niyonkuru C, Ozawa H, Loucks TL, Dobos JA, et al. Acute serum hormone levels: characterization and prognosis after severe traumatic brain injury. J Neurotrauma. (2011) 28:871–88. doi: 10.1089/neu.2010.1586
23. Santarsieri M, Niyonkuru C, McCullough EH, Dobos JA, Dixon CE, Berga SL, et al. Cerebrospinal fluid cortisol and progesterone profiles and outcomes prognostication after severe traumatic brain injury. J Neurotrauma. (2014) 31:699–712. doi: 10.1089/neu.2013.3177
Keywords: traumatic brain injury, leukocytes, clusters, phenotypes, K-means
Citation: Wang R, Xu J and He M (2025) Blood leukocyte-based clusters in patients with traumatic brain injury. Front. Immunol. 15:1504668. doi: 10.3389/fimmu.2024.1504668
Received: 03 October 2024; Accepted: 16 December 2024;
Published: 09 January 2025.
Edited by:
Lynn Xiaoling Qiang, Northwell Health, United StatesReviewed by:
Hailong Song, University of Pennsylvania, United StatesIvana Kawikova, National Institute of Mental Health, Czechia
Copyright © 2025 Wang, Xu and He. This is an open-access article distributed under the terms of the Creative Commons Attribution License (CC BY). The use, distribution or reproduction in other forums is permitted, provided the original author(s) and the copyright owner(s) are credited and that the original publication in this journal is cited, in accordance with accepted academic practice. No use, distribution or reproduction is permitted which does not comply with these terms.
*Correspondence: Jianguo Xu, eHVqZ0BzY3UuZWR1LmNu; Min He, aGVtaW4xOTkxMDMwNkB3Y2hzY3UuY24=