- 1Department of Oral Surgery, Shanghai Ninth People’s Hospital, Shanghai Jiao Tong University School of Medicine, College of Stomatology, Shanghai Jiao Tong University, National Center for Stomatology, National Clinical Research Center for Oral Diseases, Shanghai Key Laboratory of Stomatology, Shanghai Research Institute of Stomatology, Shanghai, China
- 2Department of Oromaxillofacial Head and Neck Oncology, Shanghai Ninth People’s Hospital, Shanghai Jiao Tong University School of Medicine, College of Stomatology, Shanghai Jiao Tong University, National Center for Stomatology, National Clinical Research Center for Oral Diseases, Shanghai Key Laboratory of Stomatology, Shanghai Research Institute of Stomatology, Shanghai, China
Objective: This study aimed to construct a radiomics model that predicts the expression level of CD27 in patients with head and neck squamous cell carcinoma (HNSCC).
Materials and methods: Genomic data and contrast-enhanced computed tomography (CT) images of patients with HNSCC were downloaded from the Cancer Genome Atlas and Cancer Imaging Archive for prognosis analysis, image feature extraction, and model construction. We explored the potential molecular mechanisms underlying CD27 expression and its relationship with the immune microenvironment and predicted CD27 mRNA expression in HNSCC tissues. Using non-invasive, CT-based radiomics technology, we generated a radiomics model and evaluated its correlation with the related genes and HNSCC prognosis.
Results and conclusion: The expression level of CD27 in HNSCC may significantly influence the prognosis of patients with HNSCC. Radiomics based on contrast-enhanced CT is potentially effective in predicting the expression level of CD27.
Introduction
Head and neck squamous cell carcinoma (HNSCC) accounts for approximately 90% of all head and neck tumors (1). At present, the treatment of patients with HNSCC predominantly consists in surgery combined with radiotherapy and chemotherapy; however, the 5-year survival rate remains considerably low, and approximately half of the patients die within 5 years (2). The classical prognostic indicators of HNSCC, including clinical pathological features, presence of the human papillomavirus (HPV), and computed tomography (CT) and magnetic resonance imaging (MRI) findings, no longer satisfy the clinical requirements for precision medicine (3). Therefore, further investigation of novel prognostic markers and prognostic stratification of patients are necessary to provide new indicators for individualized precision treatment.
The T-cell activation antigen encoded by the CD27 gene is a member of the tumor necrosis factor (TNF) receptor superfamily (4). The CD27 receptor is necessary for the production and long-term maintenance of T-cell immunity. It binds to the ligand CD70 and plays a key role in regulating B-cell activation and immunoglobulin synthesis (5). Furthermore, the CD27 protein transduces signals that lead to NF KappaB and MAPK8/JNK activation (6). The adaptor proteins TNF receptor-related factor (TRAF2) and TRAF5 have been shown to mediate the CD27 signaling process (7). The CD27 binding protein Siva is a pro-apoptotic protein that is considered to play an important role in CD27-induced cell apoptosis (8). The NCT01460134 phase I study evaluated the safety and dose in 56 patients with blood tumors and advanced solid tumors (including metastatic melanoma, renal cell carcinoma, prostate cancer, ovarian cancer, colorectal cancer, and non-small cell lung cancer). One of the 15 patients with metastatic renal cell carcinoma achieved partial remission, with a tumor reduction rate of 78% and progression-free survival of 2.3 years. Moreover, eight (14.29%) patients were stable for 3.8–47.3 months. Among 19 patients with advanced B-cell lymphoma who underwent intensive pretreatment, one achieved complete remission (9). To date, the ongoing phase I/II dose escalation and cohort expansion study (NCT02335918) that investigates combination therapy with nivolumab for different solid malignancies (including HNSCC) has only obtained results for colorectal and ovarian cancers. These results indicated that 5 of 49 patients (10%) with ovarian cancer achieved partial remission, while 19/49 (39%) achieved stability (10).
Radiomics is a high-throughput image sequencing technique that can yield several image feature parameters (11). It is a non-invasive, dynamic detection and quantitative-reaction technological tool for evaluating tumor characteristics. Radiomics technology has been used widely in clinical settings. Previous studies have demonstrated that radiomics can be used for the early diagnosis of HNSCC and classification into types as well as the evaluation of the tumor’s heterogeneity and microenvironment (12).
Therefore, this study aimed to (i) predict the mRNA expression of CD27 in HNSCC tissues using non-invasive, CT-based radiomics technology; (ii) evaluate the correlation between the constructed radiomics model and the related genes and prognosis; and (iii) explore the potential molecular mechanism underlying the expression of CD27 and its relationship with the immune microenvironment.
Materials and Methods
Sources of data and images
The medical imaging data (including the clinical and follow-up data) and transcriptome sequencing data (including the clinical and follow-up data) were obtained from The Cancer Imaging Archive (TCIA, https://www.cancerimagingarchive.net/) and the Cancer Genome Atlas (TCGA, https://portal.gdc.cancer.Gov/) databases, respectively, to determine the prognostic value of CD27 expression as well as to construct a radiomics prediction model and determine its prognostic value. The R package “surfminer” was used to calculate the cutoff values.
Analysis of differences between groups
UCSC Xena (https://xenabrowser.net/datapages/) RNA-Seq data in the “fragments per kilo base of transcript per million mapped fragments” (FPKM) format were processed uniformly via the coil process. The processing of the RNA-seq data in the FPKM format and a log2 transformation were performed to compare CD27 expression between samples. The R package “ggplot2” was used for visualization.
Survival analyses
Kaplan–Meier survival curve analysis was used to reveal changes in the survival rates in different groups, wherein the median survival time represented the survival time that corresponded to a survival rate of 50%. A log-rank test was used to test the significance of the survival rate in the groups.
Univariate and multivariate Cox regression analysis
Cox proportional hazard models are potentially useful in examining the relationships between one or more research factors and survival outcomes. Therefore, a single-factor Cox regression was used in a comparison analysis to explore the influencing factors of overall survival (OS). Using a multifactor Cox regression, the eligibility of a factor as an independent influencing factor of OS was determined, and the role of multiple influencing factors was also explored. When the hazard ratio (HR) > 1, the independent variable was considered to be a risk factor. When the HR was < 1, the independent variable was considered as a protective factor. The R packages “survival” and “forest plot” were used in these analyses.
Subgroup analysis and interaction test
An exploratory subgroup analysis was conducted using a univariate Cox regression to analyze the impact of the main variable, CD27 expression, (high-expression group vs. low-expression group) on the prognosis of patients in each covariate subgroup. A likelihood ratio test was used to analyze the interaction between CD27 expression and other covariates.
Subtype analysis
Using the mesenchymal, basal, classical, and atypical subtypes of HNSC as groups, the differences in CD27 expression values between the four groups were calculated. The subtype data was downloaded from PMID: 25631445, and the sample size was 272. The Kruskal–Wallis test was used to analyze the differences in CD27 expression values between groups of different subtypes, and the Bonferroni correction was used to correct the differences between two groups.
Single-cell sequencing analysis
The expression of CD27 in immune cells was analyzed using the GSE103322 data set provided by the scTIME network (http://sctime.sklehabc.com/unicellular/home).
Correlation analysis
Spearman’s rank correlation coefficient was used to analyze the correlation, and the results were displayed using a correlation heat map.
Analysis of correlation between CD27 expression and immune-cell infiltration
We uploaded the gene expression matrix of the HNSCC samples to the ImmuCellAI (http://bioinfo.life.hust.edu.cn/ImmuCellAI#!/) and CIBERSORTx (https://cibersortx.stanford.edu/) databases and measured immune-cell infiltration in each sample (13). Spearman’s rank correlation coefficient was used to analyze the correlation between the main variable CD27 expression and immune cell infiltration. The R-package “limma” was used to analyze the differences in immune-cell infiltration between the CD27 high- and low-expression groups, and the Wilcoxon test was used to draw the box diagram.
Enrichment analysis of differentially-expressed genes
To further confirm the functions of potential targets, the data were analyzed using a function enrichment analysis. Gene Ontology (GO) is a widely-used tool for annotating functional genes, especially regarding their related molecular functions (MF), biological processes (BP), and cellular components (CC). The Kyoto Encyclopedia of Genes and Genomes (KEGG) is a widely-used database for storing information regarding genomes, biological pathways, diseases, and drugs. We visualized the top 10 significantly-enriched pathways obtained from the BP, CC, and MF enrichment analyses and the top 30 significantly-enriched pathways from the KEGG enrichment analysis. We used the R package “clusterprofiler” to conduct the GO (BP/CC/MF) and KEGG enrichment analyses, with a q-value filter < 0.05 as the filter condition.
Screening of radiomics features
The parameters of 107 radiomics feature extracted using pyradiomics from 139 TCIA–TCGA intersection samples were standardized. The data were divided randomly into a training set and a validation set according to a 6:4 ratio using the R package “caret, cbcgrps.” The differences between the training and validation sets were analyzed.
Before modeling, features were screened through recursive feature elimination (RFE), whereby the predictive factors were sorted, and the less-important factors were eliminated in turn. The goal was to identify a subset of predictors that could be used to generate accurate models. We maintained model training, deleted n features of low importance after each training, subsequently retrained the new features to reacquire feature importance, and deleted n features of low importance again until the optimal feature subset was obtained.
Construction of radiomics model
The support vector machine (SVM) algorithm uses support vectors to identify high-latitude hyperplanes as decision boundaries. Using the R package “caret,” the selected radiomics features were modeled using the SVM algorithm to predict gene expression.
Evaluation of radiomics model and consistency evaluation
The radiomics model was used to evaluate the effectiveness of the models in the training and validation groups. The evaluation indexes included accuracy, specificity, sensitivity, positive predictive value, and negative predictive value. The x-axis of the receiver operating characteristic (ROC) curve represented the false-positive rate, while the y-axis represented the true-positive rate. The x-axis of the recall curve (PR) represented coverage (recall), that is, the true-positive rate, whereas the y-axis represented accuracy (precision). The calibration degree of the radiomics prediction model was evaluated by constructing the calibration-curve and using the Hosmer–Lemeshow goodness-of-fit testing method. The comprehensive performance of the image ensemble prediction model was quantified using the Brier Score. The clinical benefit of the radiomics prediction model was displayed via a decision curve analysis (DCA). The area under the curve (AUC) values of the training and validation sets were compared using the DeLong test to verify fitting.
The intraclass correlation coefficient (ICC) was used to evaluate the consistency of the radiomics features that were extracted based on the volume of interest (VOI) outlines obtained from two doctors. After one doctor sketched all the cases, 20 samples were selected randomly using the random number table method and sketched by another doctor, and the radiomics characteristics were then extracted.
Time-dependent ROC curve
The probability value (radiomics score) of the prediction of the radiomics model, with a cutoff value of 0.565, was used to obtain the radiomics signature (RS) and combined with the clinical data. With respect to the survival analysis data (survival time and survival state), the disease status and factors were expected to change with time. We constructed different ROC curves according to varying time nodes, that is, time-dependent ROC curves, to illustrate the predictive ability of various factors at different time points. We also constructed the corresponding time-dependent ROC curves at different time nodes (12, 36, and 60 months) after HNSCC diagnosis and drew a time-based AUC curve to evaluate RS-expression differences in order to predict the survival of patients at different time points.
Results
Patient characteristics
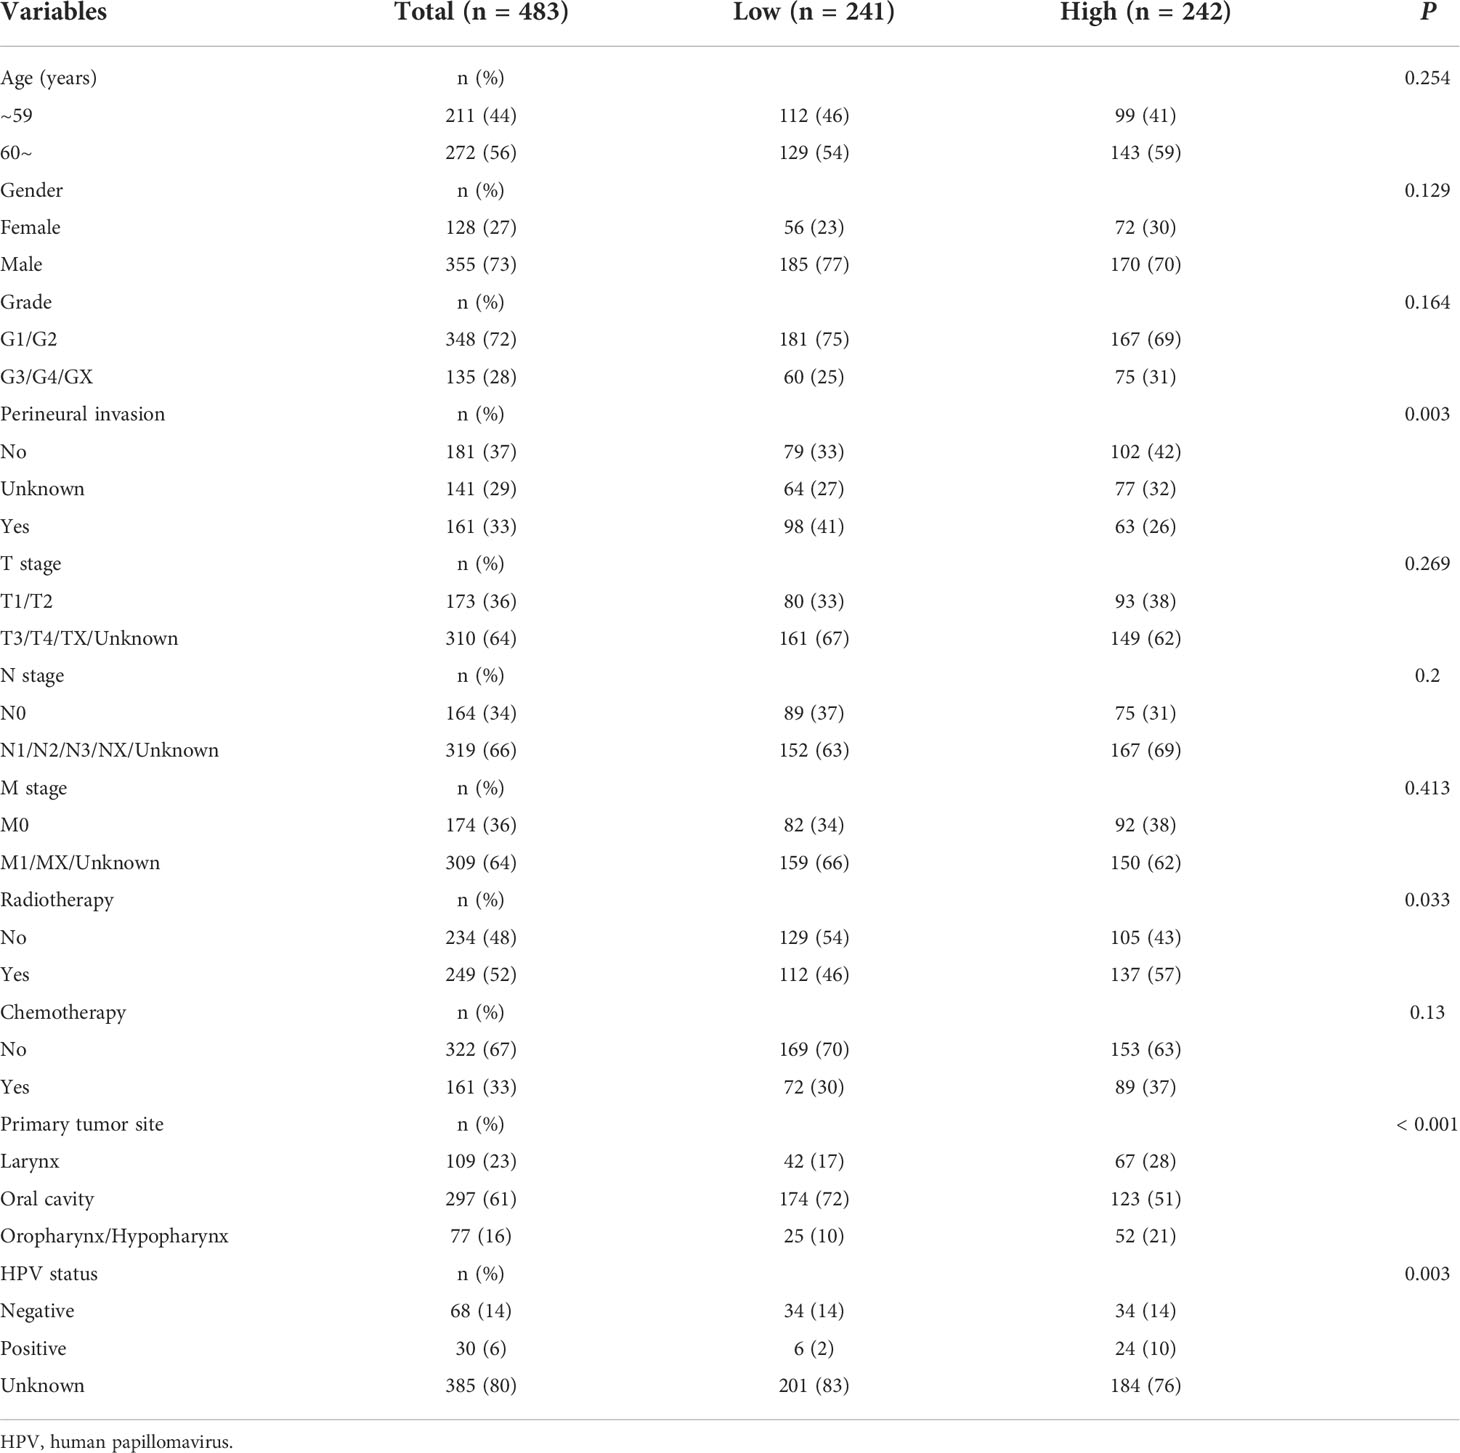
A total of 483 patients with HNSCC from the TCGA database were included in the survival analysis and categorized into CD27 high-expression (n = 242) and low-expression (n = 241) groups, with 1.2205156 as the cutoff value. The clinical information of the patients is shown in Table 1. Significant differences in the distribution of perineural invasion, radiotherapy, primary tumor site, and HPV status were noted between the CD27 high- and low-expression groups.
Association between gene expression level and clinical characteristics
We found the CD27 expression in tumors to be higher than that in normal tissue, and the difference was statistically significant (Figure 1A). The median survival times in the CD27 low- and high-expression groups were 32.93 (95% confidence interval [CI], 25.43–58.26) and 69.43 (95% CI, 57.73–158.66) months, respectively. The Kaplan–Meier curve analysis demonstrated that higher CD27 expression levels were associated with OS improvement (Figure 1B). In addition, the T and N cancer stages, perineural invasion, and radiotherapy were also associated significantly with OS (Figures S1A–D). Furthermore, the univariate analysis showed that high CD27 expression (HR = 0.555; 95% CI, 0.419–0.735, P < 0.001), male, and radiotherapy were protective factors for OS (Figure 1C). After multivariate adjustment, the multivariate analysis showed that high CD27 expression (HR = 0.589; 95% CI, 0.436–0.796, P < 0.001) and radiotherapy were protective factors for OS (Figure 1D). Within the primary-tumor-site subgroup, the subgroup analysis revealed that a CD27 increase was a protective factor for OS. The P value for the interaction test was 0.026, suggesting a significant interaction between CD27 and the different primary tumor sites (Figure 1E). Besides, the difference in the expression values of CD27 between different subtypes was statistically significant (P < 0.001). After pairwise comparison, there was no statistical difference in CD27 expression between the basal and classical groups, but there were significant differences in CD27 expression between the atypical and basal groups and the basal and mesenchymal groups (P < 0.001) (Figure 1F). Moreover, the CD27 expression value in the atypical group was higher than that in the basal, classical, and mesenchymal groups. Finally, the main variable, CD27 expression, showed a significant correlation with the tumor grade, perineural invasion, chemotherapy, and the HPV status (Figure 1G).
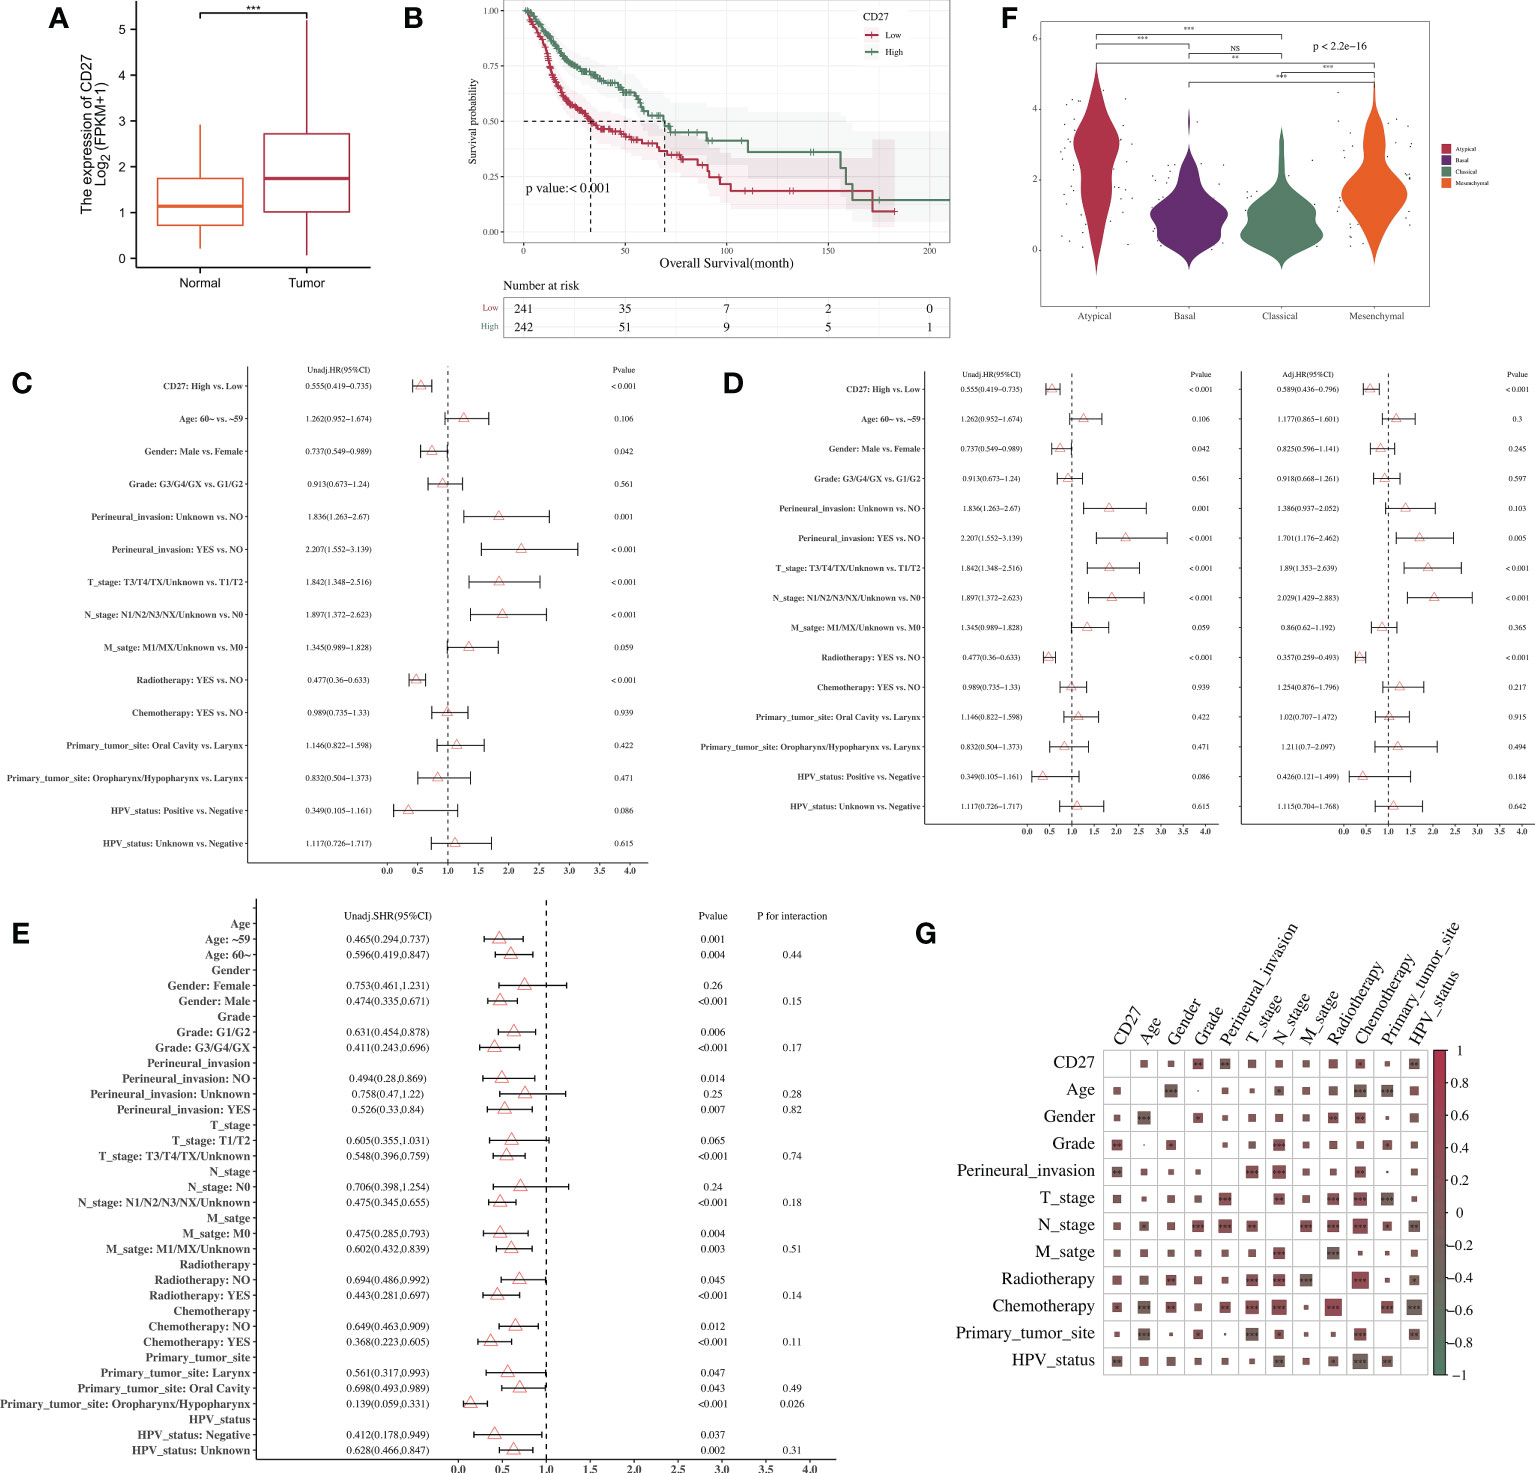
Figure 1 Association between gene expression level and clinical characteristics. (A) CD27 expression in normal and tumor tissues. (B) Correlations between CD27 expression and OS in HNSCC. (C) Univariate Cox regression analyses. (D) Multivariate Cox regression analyses. (E) Subgroup analysis and interaction test. (F) Subtype analysis. (G) Correlation analysis between CD27 expression and clinical parameters of HNSCC. **p < 0.01, ***p < 0.001, NS, no significance.
CD27 expression correlates with HNSCC immune-cell infiltration
We analyzed single-cell sequencing data on HNSCC provided by the scTIME network. We visualized the clustering of 40 immune cells (Figure 2A) and the distribution of CD27 expression in 33 immune cells (Figures 2B, C). Single-cell RNA sequencing analysis showed that CD27 was expressed in CD4-CCR7-FOS, CD4-LEF1 Treg, cycling T cells, and other immune cells. Besides, the correlation analysis showed that CD27 expression had a significant correlation with cytotoxic T cells, depleted T cells, and other activated T cells (P < 0.001) (Figure 2D). Moreover, the degree of macrophage (M0 cell) infiltration was significantly elevated in the CD27 high-expression group (P < 0.05), while the degree of infiltration of activated natural killer (NK) cells was not significantly different between the two groups (P > 0.05) (Figure 2E).
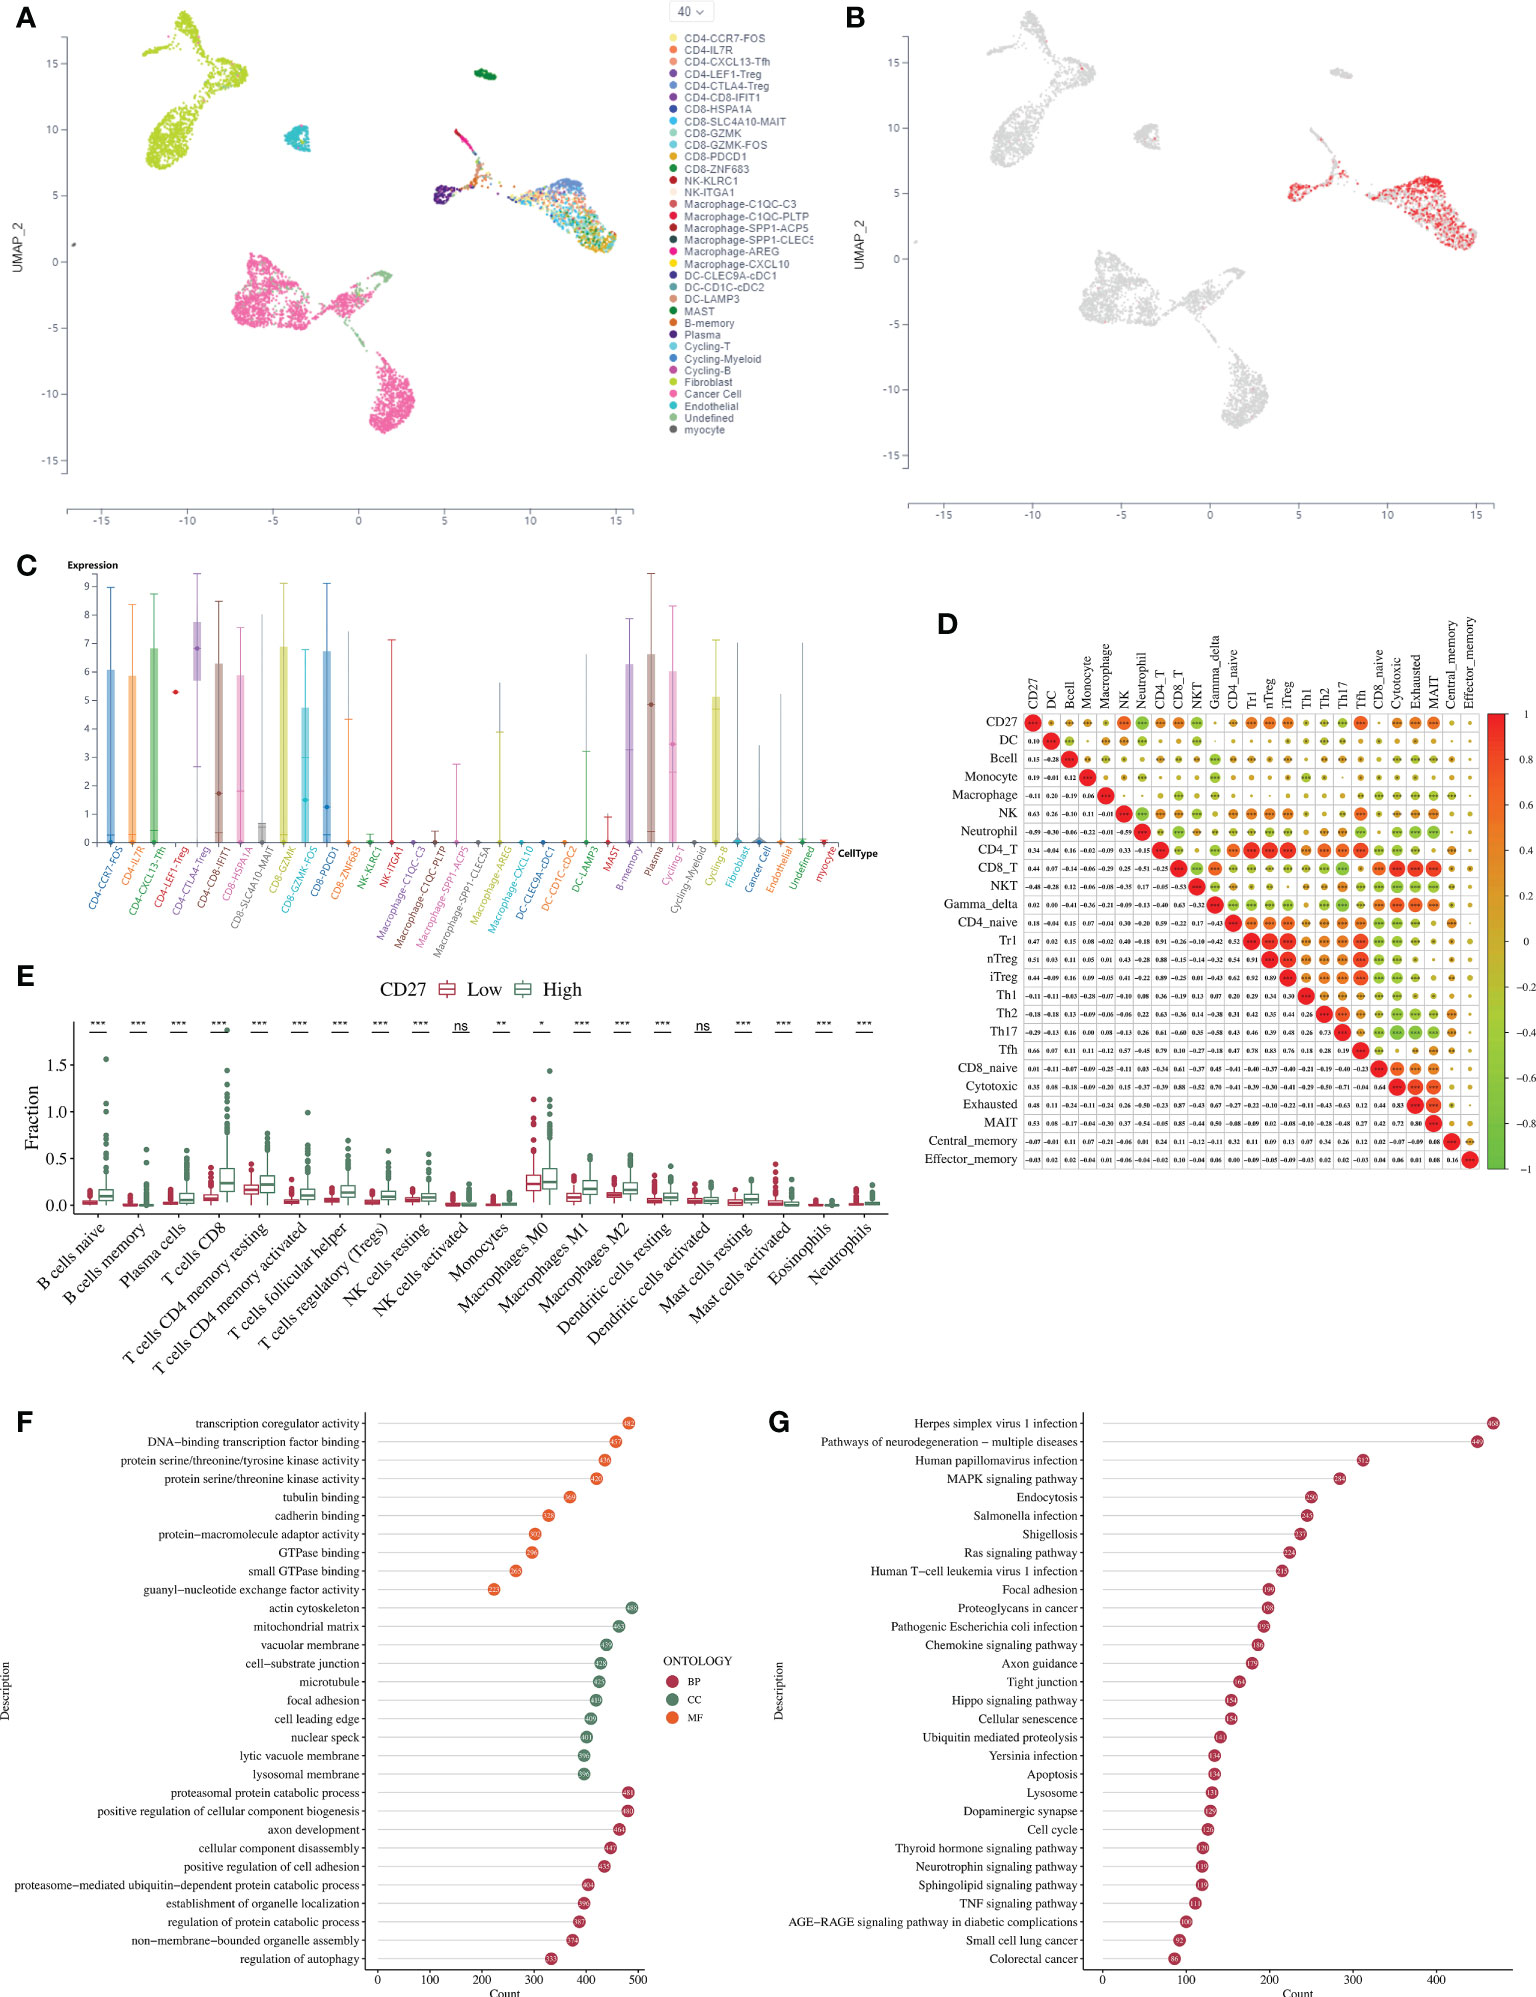
Figure 2 Analysis of the immune-cell infiltration and the DEGs associated with CD27 expression in HNSCC. (A) Clustering of 40 types of immune cells. (B) Immune cells exhibiting CD27 expression. (C) Expression and distribution of CD27 in 33 types of immune cells. (D) Correlations between CD27 expression and immune-cell infiltration in HNSCC in the ImmuCellAI database. (E) Correlations between CD27 expression and immune-cell infiltration in HNSCC in the CIBERSORTx database. (F) GO enrichment analysis. (G) KEGG enrichment analysis. *p < 0.05, **p < 0.01, ***p < 0.001, NS, no significance.
Analysis of differentially-expressed genes (DEGs) in HNSCC associated with high and low CD27 expression
The GO enrichment analysis revealed that DEGs related to DNA-binding, transcription-factor binding, and transcriptional auxiliary regulatory activity were enriched in the CD27 high-expression group compared to the low-expression group (Figure 2F). The KEGG enrichment analysis revealed that DEGs were significantly enriched in the MAPK signaling pathway, cell cycle, and RAS signaling pathway in the CD27 high-expression group compared to the low-expression group (Figure 2G).
Clinicopathological characteristics of radiomics participants
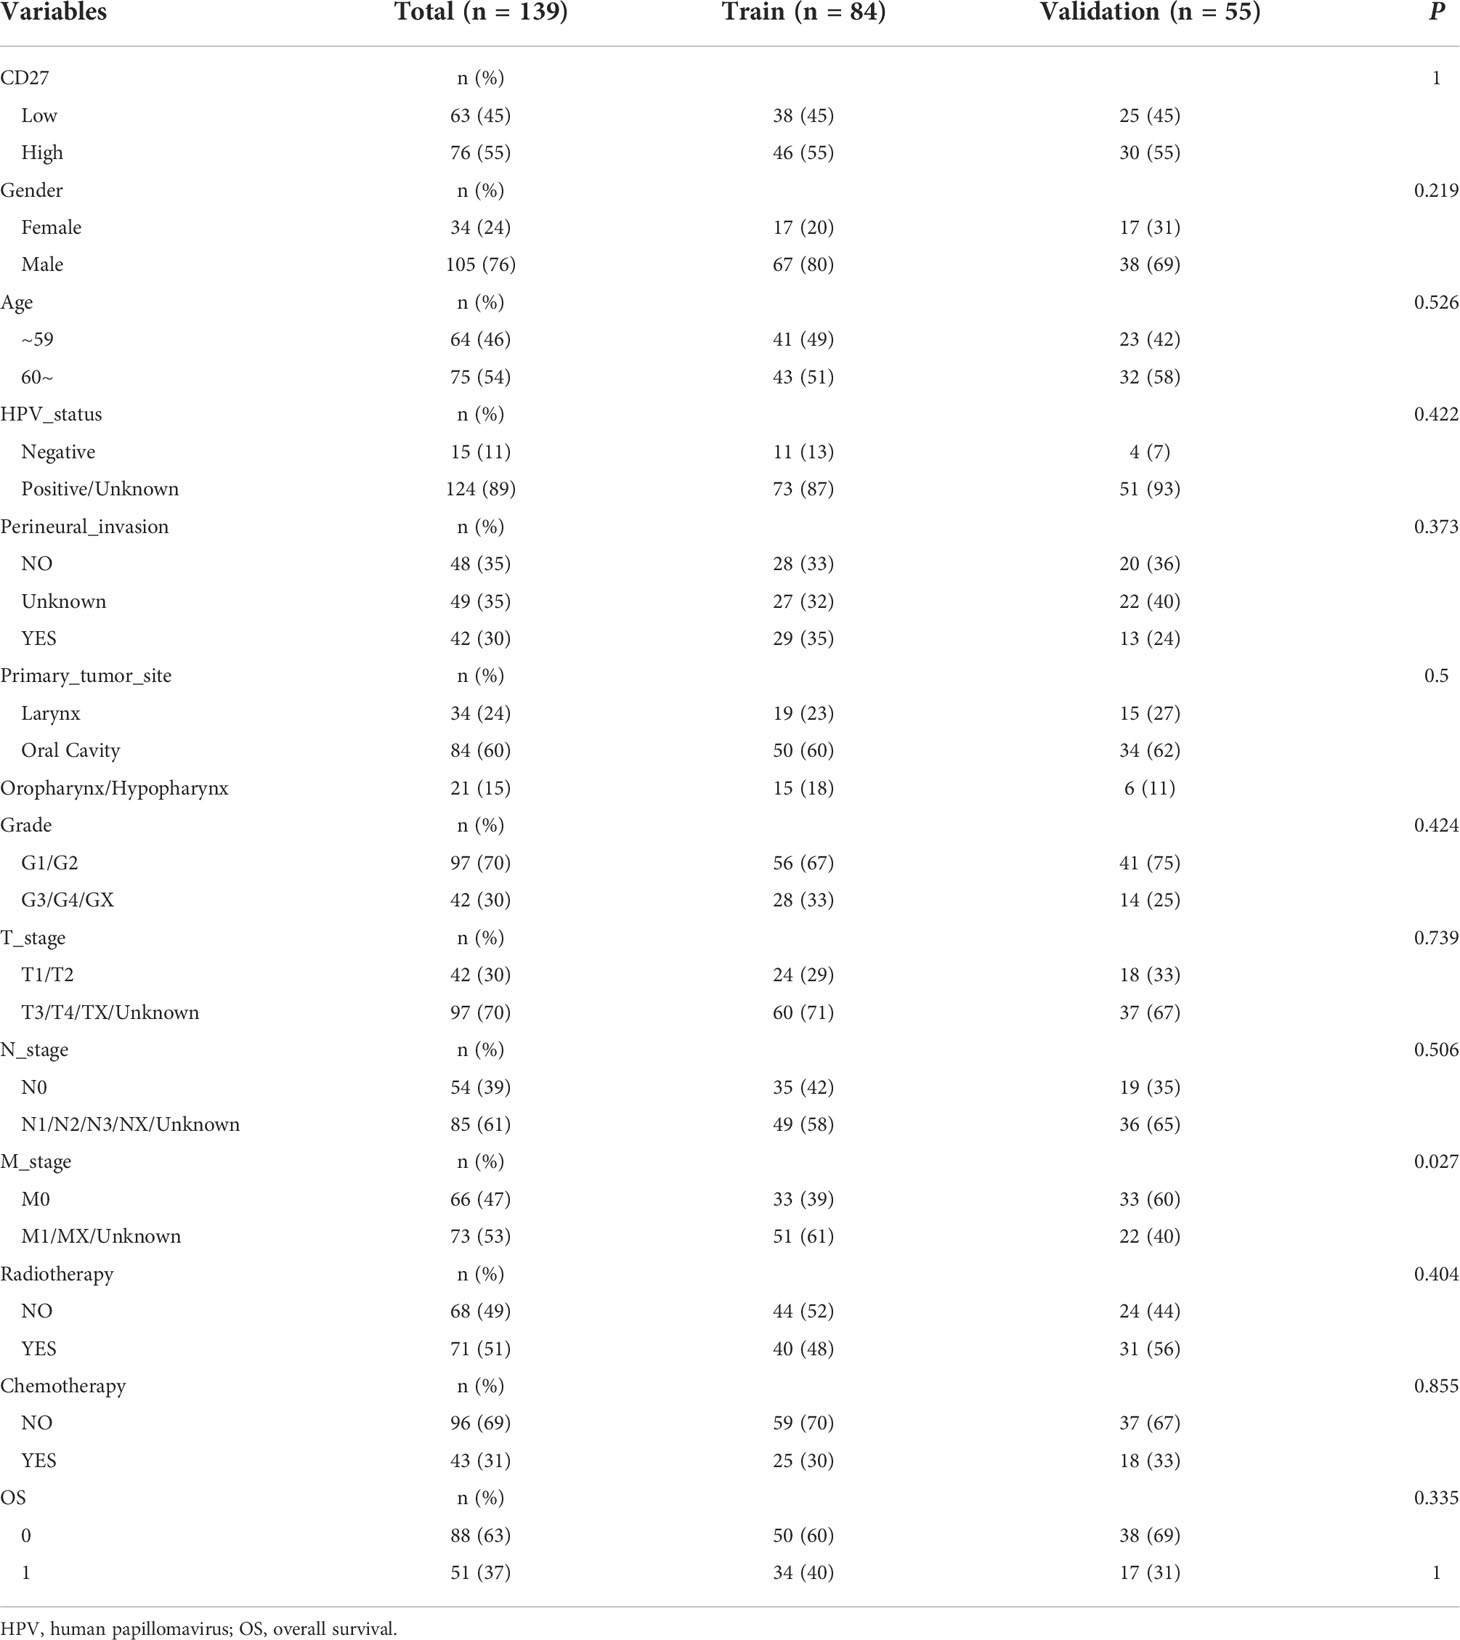
We divided the overall data set and obtained 84 training sets and 55 verification sets (Table 2). The P value of each variable in the analysis of differences between groups was > 0.05, indicating that the baseline status of the patients in the training and validation sets was consistent and comparable between groups. Nine radiomics features were screened out (Figure 3A).
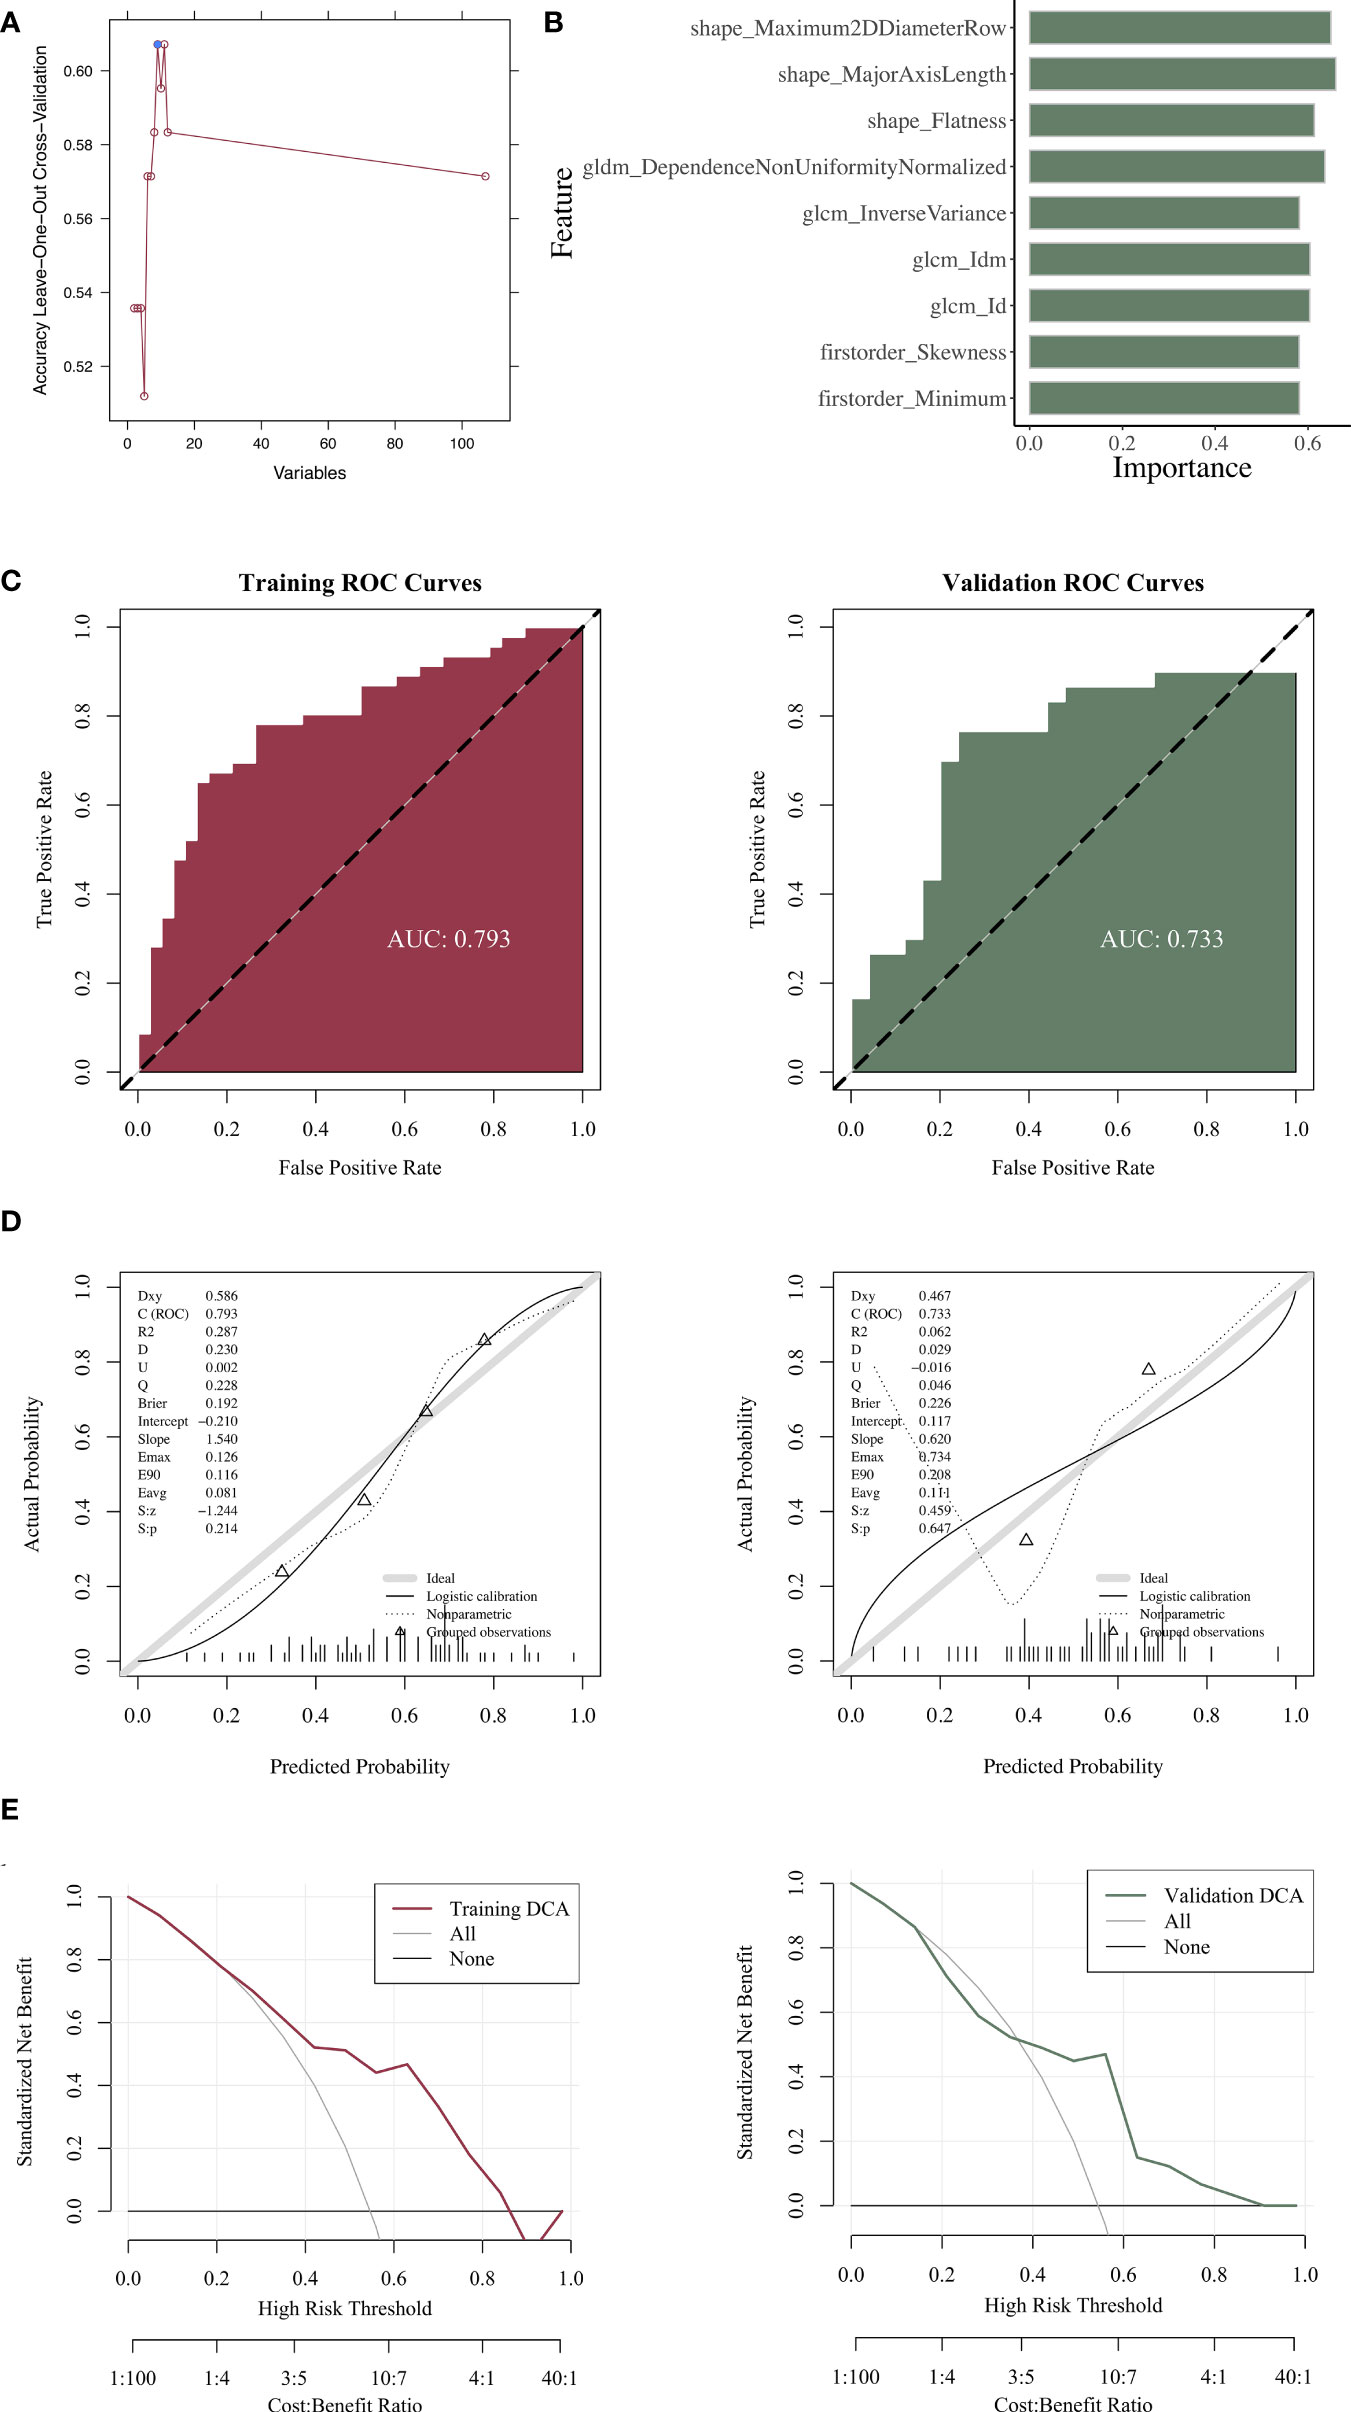
Figure 3 Construction and evaluation of the radiomics models. (A) Radiomics features with statistical differences. (B) Importance of the selected features in the model. (C) ROC curve analysis of the radiomics model. (D) Calibration-curve analysis of the radiomics model. (E) Hosmer–Lemeshow goodness-of-fit testing of the radiomics model.
Construction and evaluation of radiomics models
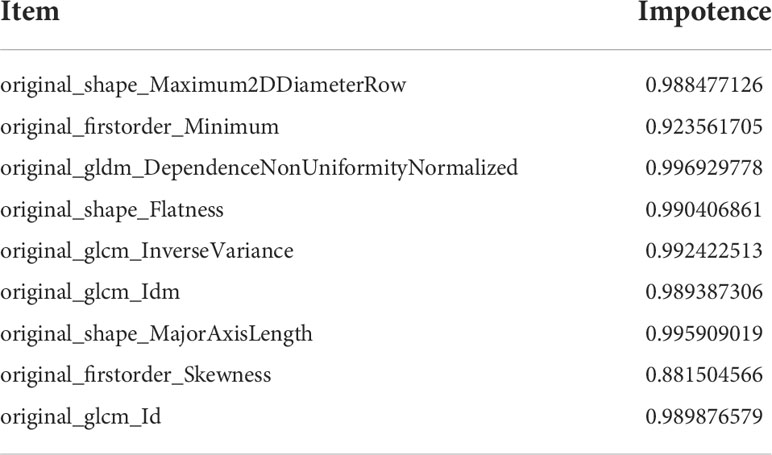
We constructed a radiomics model and analyzed the importance of the selected features (Figure 3B). After the evaluation, the radiomics model exhibited a favorable predictive ability, as demonstrated by the ROC curve. The model’s AUC values in the training and validation sets were 0.793 and 0.733, respectively (Figure 3C). The calibration-curve analysis (Figure 3D) and Hosmer–Lemeshow goodness-of-fit testing (Figure 3E) revealed that the prediction probability of the radiomics prediction model for determining the level of genetic expression was consistent with the true value (P > 0.05). The DCA model displayed clinical practicability. When comparing the AUC values, no statistical difference was noted between the validation and training sets (P = 0.496), indicating that the model had a favorable fit. In addition, the ICC values of the radiomics features included in the model were all above 0.85, indicating that these radiomics features had a favorable consistency (Table 3).
Association between RS and clinical characteristics
The RS distribution in the training and validation sets was significantly different between the CD27 high- and low-expression groups (p < 0.05). In the CD27 high-expression group, the RS value was high (Figure 4A). The RS exhibited a significant positive correlation with the model’s prediction of CD27 expression, with a correlation coefficient of 0.420 (P < 0.001). The correlation between the RS value and the expression of immune-related genes was similar to that between CD27 expression and the expression of immune-related genes, with both correlations being positive and statistically significant (Figure 4B). A total of 139 patients with HNSCC from the TCGA database were included in the survival analysis and were divided into the RS for high CD27 expression (n = 70) and low CD27 expression (n = 69) groups. The clinical information of the patients is shown in Table S1. As shown by the ROC curve, the AUC value for the ability of CD27 expression, as determined by the RS, to predict OS prognosis (60 months) was 0.725. The AUC value increased with time (Figure 4C). Finally, the median survival time in the CD27 low-expression group, as determined by the RS, was 58.27 months. In contrast, the median survival time in the CD27 high-expression group, as determined by the RS, was longer than the follow-up period, demonstrating that a higher RS value was related to OS improvement (Figure 4D).
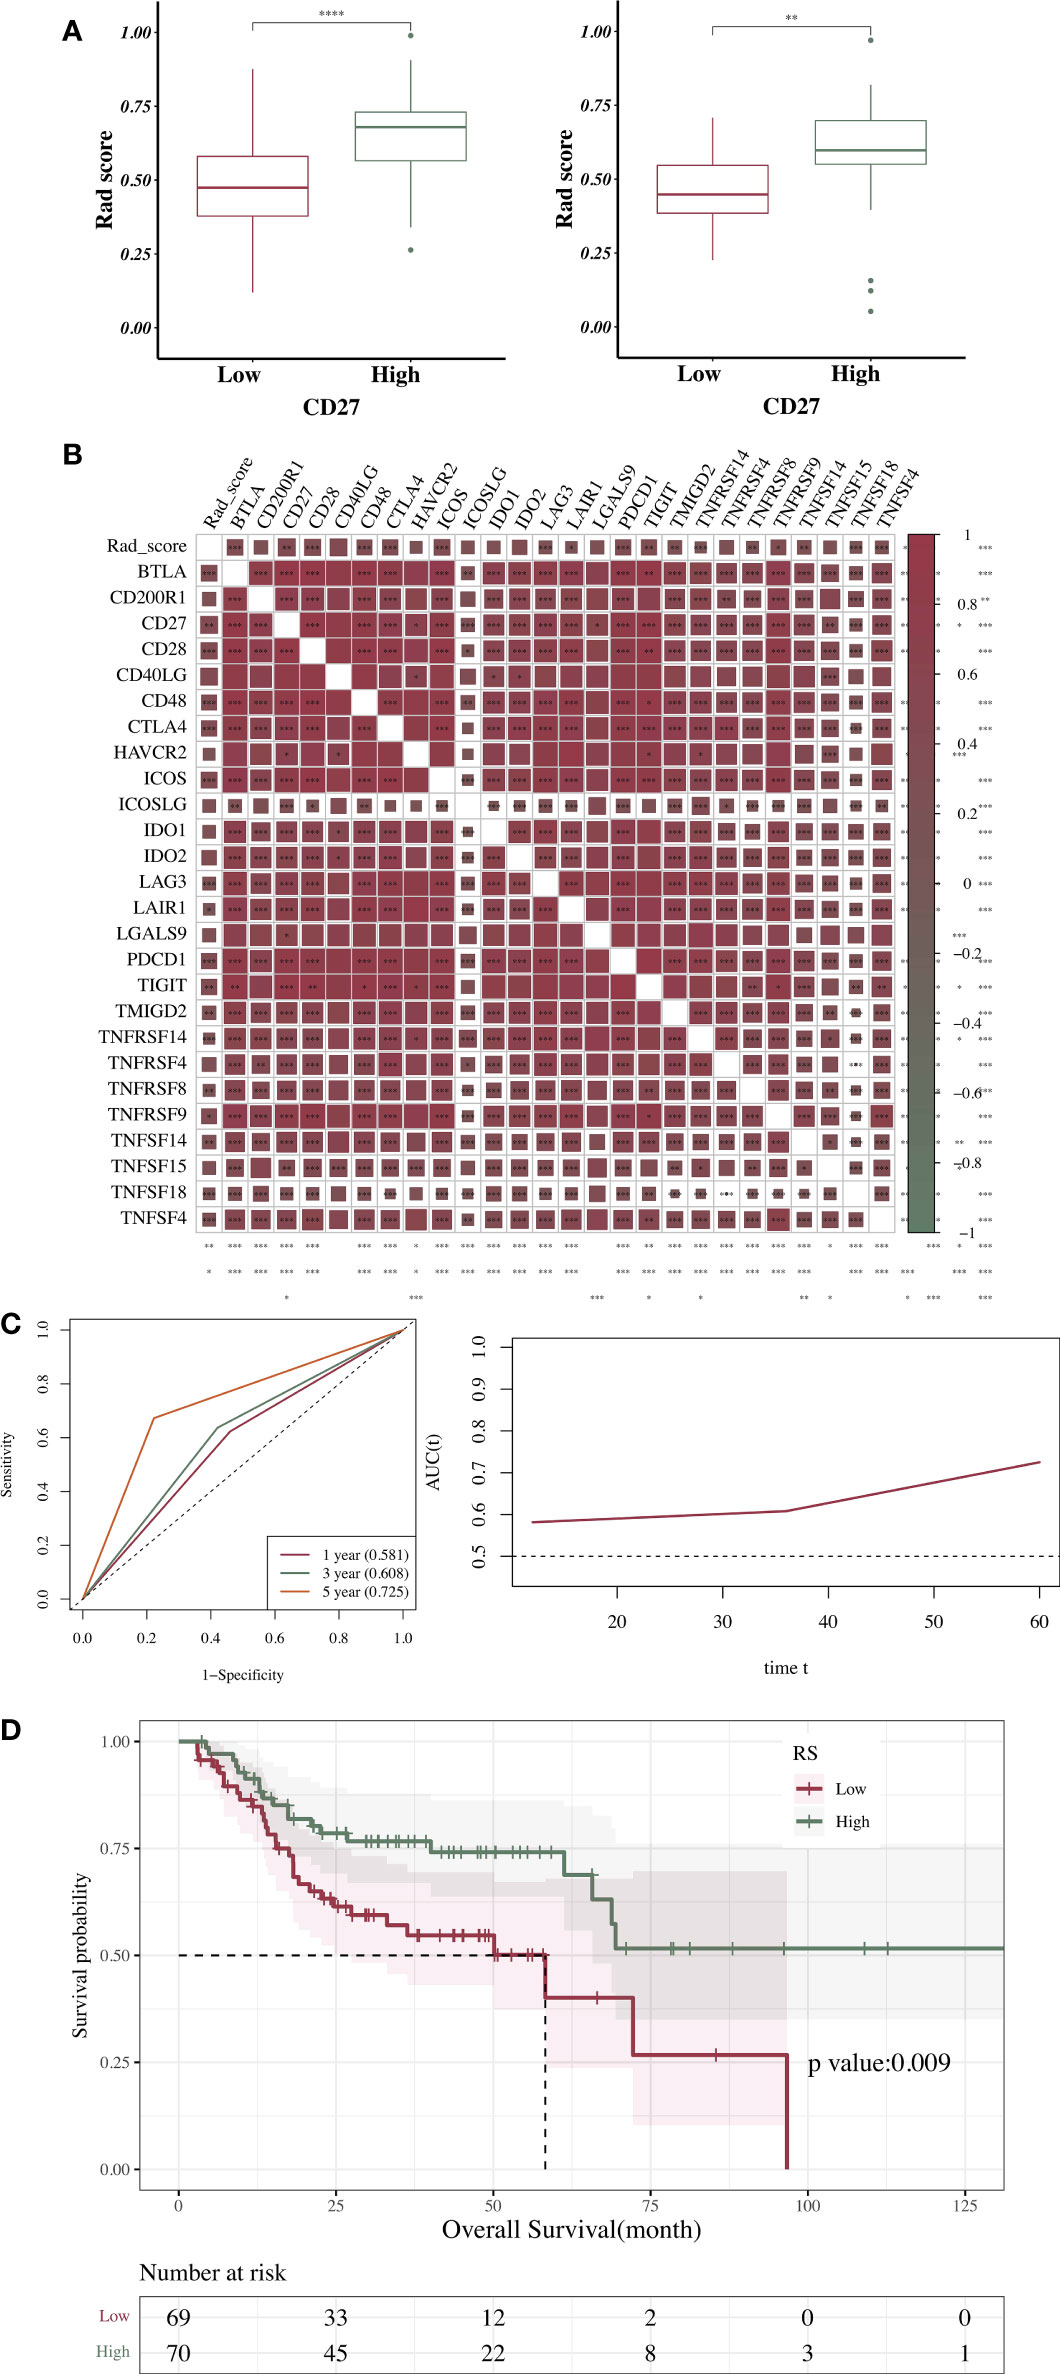
Figure 4 Association between RS and clinical characteristics. (A) Association between RS and CD27 expression. (B) Correlation analysis of RS, CD27 expression, and expression of immune genes expression. (C) Time-dependent ROC curve obtained according to the AUC value of the main variable at each time point (12, 36, and 60 months). (D) Correlations between RS and OS in HNSCC. *p < 0.05, **p < 0.01, ***p < 0.001, ****p < 0.0001.
Discussion
Since the classical approaches for identifying prognostic indicators in HNSCC, such as CT and MRI, no longer satisfy the clinical requirements for precision medicine (14), identification of novel prognostic markers and stratification of patients based on prognosis are warranted to provide new indicators for individualized precision treatment (15). On this premise, this study established CD27 expression as a potentially significant prognostic indicator in patients with HNSCC.
CD27, a member of the TNF receptor superfamily, is structurally expressed on immature T cells, memory B cells, NK cells, hematopoietic stem cells, and progenitor cells. CD27 is a transmembrane phosphoglycoprotein expressed on CD4+ and CD8 + T cells (5). CD27 expression increases when T cells are activated, as well as during apoptosis. After activation, CD27 takes a soluble form (sCD27). CD70 (also known as CD27L) is the sole ligand of CD27. After binding with CD70, CD27 can bind to TRAF to produce intracellular signals that may potentially enhance the survival and activation of T cells, B cells, and NK cells through the activation of TRAF2 and TRAF5 signals and the NF-κB pathway (16). CD27–CD70 interaction is strictly regulated to prevent overexpression and subsequent lymphocyte overactivation (17). In this study, we found that CD27 expression was significantly and positively correlated with T- and B-cell infiltration, thus further corroborating the above view. Besides, the correlation analysis showed that CD27 expression had a weak correlation with naive CD8+ T cells, while it had a significant correlation with cytotoxic T cells, depleted T cells, and other activated T cells.
Recently, with the development of T-cell therapy with immune checkpoint inhibitors and other advances in treating tumors, the costimulatory mechanisms underlying T-cell activation and proliferation have drawn increasing attention (18, 19). Costimulatory activation of the CD27–CD70 axis has been has been harnessed as a treatment for cancers made of various tumor cell types (20, 21). Therefore, activation of the CD27–CD70 axis as a novel, future therapeutic target demonstrates great prospects.
Radiomics can be used to predict prognosis in several diseases (22). In some studies, the treatment response of patients with HNSCC undergoing radical radiotherapy was predicted based on quantitative ultrasound radiomics with an accuracy > 90% (23). The SVM model can accurately identify patients at high risk of disease recurrence, thus having a great impact on survival rate (24). Additional studies have also compared several models, including logistic regression, random forest, Naïve Bayes, SVM, AdaBoost, and neural network models, in predicting occult neck lymph node metastasis in early oral tongue squamous cell carcinoma based on preoperative MRI texture features (25–28). These studies have demonstrated that Naïve Bayes offers the best performance, with the node status correctly identified in 74.1% of patients. All the above studies underscore the potential of radiomics in clinical treatment.
Radiomics has shown great potential in predicting tumor prognosis and evaluating treatment effect, but there are still some limitations. For example, there is a lack of multicenter prospective radiomics research to guide clinical practice. The reason is that there is no gold standard yet for radiomics research methods and the repeatability of radiomics features needs to be further improved. In addition, image reconstruction algorithms, preprocessing methods, individual differences, and feature extraction algorithms can affect the stability and repeatability of the radiomics features. At present, radiomics is still in its infancy. Solving the repeatability issue is the key for future research, and will further promote individualized, precise treatment in cancer.
This study aimed to predict CD27 expression in HNSCC and determine its clinical prognostic value based on an enhanced-contrast CT radiomics model. For example, CD27 in TCGA-BA-5152 was measured to be highly expressed. As determined by the radiomics model, the radiomics score was 0.632 (the threshold determined by the Joden index of the ROC curve was 0.62), predicting that CD27 was highly expressed. In addition, as a costimulatory T-cell receptor, CD27 is closely related to the prognosis of patients with HNSCC (29). In this study, we found CD27 to be correlated with tumor grade. The Kaplan–Meier curve revealed that a low molecular expression was associated with the deterioration of survival. A multivariate analysis revealed that a high CD27 expression was a protective factor for OS. Most patients with HNSCC who reached the advanced stage at diagnosis exhibited no obvious precancerous lesions clinically. HNSCC possesses significant heterogeneity, and increasing prognostic information may be helpful in clinical decision-making. In this study, we constructed a model for selected imaging characteristics in order to predict the expression level of CD27 non-invasively. This may provide a novel diagnostic tool to faciliate the clinical application of immunotherapy.
Contrast-enhanced CT may increase the difference in density between lesions and adjacent normal tissues through the injection of contrast agent, thereby improving the lesions’ display rate (30); nonetheless, contrast-enhanced CT lacks objectivity and is non-quantitative. On the other hand, radiomics can mine high-throughput features from the images, recognize deep information that cannot be obtained directly with the naked eye, and conduct quantitative analysis. In previous studies, it was possible to distinguish the phenotypes of metastatic colorectal cancer by evaluating their imaging characteristics (31). One study that used positron emission tomography imaging to predict disease-free survival and OS in patients with gastric cancer found that it exhibited a predictive function superior to that of the tumor–node–metastasis staging system or tumor markers (32).
Machine learning is a specific field of artificial intelligence, which can be broadly defined as a computing algorithm/method that uses data to improve performance or make accurate predictions (33). The six most commonly-used machine learning classifiers are Logical Regression, Naive Bayes, SVM, Decision Tree, Neural Networks, and Deep learning (33). In this study, an RFE algorithm was used to identify the optimal feature set (34), and the SVM model was established to predict CD27 expression. This prediction model exhibited a favorable consistency between its predictive probability and the true value of gene expression. DCA revealed that the model had high clinical practicability. No statistical differences in the AUCs of the training and validation sets were observed, and the model exhibited a favorable model fit. When applying the DeLong test to verify the fitting of the training and validation sets, the AUC value of the SVM model was found to exhibit no statistical differences between the training and validation sets, and the model exhibited a favorable prediction efficiency. Further analysis found the probability of predicting the gene-expression-level Rad score to be positively correlated with CD27 expression. The Wilcoxon test revealed significant Rad-score differences between the CD27 high- and low-expression groups, and both the training and validation sets. In addition, Kaplan–Meier curve analysis revealed an association between high Rad scores and improved OS, indicating that our radiomics-based prediction model had a favorable efficiency in predicting CD27 gene expression and potentially offered substantial value in guiding clinical prognosis prediction.
Conclusion
Our results showed that a significant correlation existed between CD27 expression and the prognosis of HNSCC. Based on our contrast-enhanced CT radiomics model, the expression level of CD27 can be predicted effectively. This prediction model, which was based on radiomics characteristics, exhibited favorable stability and diagnostic efficiency.
Data availability statement
Publicly available datasets were analyzed in this study. This data can be found here: The medical imaging data (including the clinical and follow-up data) and transcriptome sequencing data (including the clinical and follow-up data) were obtained from The Cancer Imaging Archive (TCIA, https://www.cancerimagingarchive.net/) and the Cancer Genome Atlas (TCGA, https://portal.gdc.cancer.Gov/) databases.
Author contributions
YH designed the experiments. FW, WZ, and YC collected the data. HW and ZL performed the calculations. FW and WZ wrote the main manuscript text, and all the authors approved the manuscript. All authors contributed to the article and approved the submitted version.
Funding
This study was supported by the Fundamental Research Program of the Ninth People’s Hospital affiliated to the Shanghai Jiao Tong University School of Medicine (JYZZ158); The National Natural Science Foundation of China (82173451 and 81900969); Special Research on Medical Innovation of Shanghai Municipal Commission of Science and Technology (21Y11903500); Clinical Research Booster Program of Ninth People’s Hospital, Shanghai Jiao Tong University School of Medicine (JYLJ201903); Shanghai Jiaotong University Medical-Engineering Cross Research Fund (YG2022QN050), Science and Technology Commission of Shanghai Funding/Supporting (16411960900); Shanghai Municipal Science Research Project (SHDC12017101), Shanghai Summit & Plateau Disciplines and General project of Shanghai Health and Family Planning Commission (201740168).
Conflict of interest
The authors declare that the research was conducted in the absence of any commercial or financial relationships that could be construed as a potential conflict of interest.
Publisher’s note
All claims expressed in this article are solely those of the authors and do not necessarily represent those of their affiliated organizations, or those of the publisher, the editors and the reviewers. Any product that may be evaluated in this article, or claim that may be made by its manufacturer, is not guaranteed or endorsed by the publisher.
Supplementary material
The Supplementary Material for this article can be found online at: https://www.frontiersin.org/articles/10.3389/fimmu.2022.1015436/full#supplementary-material
Supplementary Figure 1 | Correlations between the T (A) and N (B) stages, perineural invasion (C), radiotherapy (D), and OS in HNSCC.
References
1. Johnson DE, Burtness B, Leemans CR, Lui VWY, Bauman JE, Grandis JR. Head and neck squamous cell carcinoma. Nat Rev Dis Primers (2020) 6:92. doi: 10.1038/s41572-020-00224-3
2. Méry B, Rancoule C, Guy JB, Espenel S, Wozny AS, Battiston-Montagne P, et al. Preclinical models in HNSCC: A comprehensive review. Oral Oncol (2017) 65:51–6. doi: 10.1016/j.oraloncology.2016.12.010
3. Cramer JD, Burtness B, Le QT, Ferris RL. The changing therapeutic landscape of head and neck cancer. Nat Rev Clin Oncol (2019) 16:669–83. doi: 10.1038/s41571-019-0227-z
4. Starzer AM, Berghoff AS. New emerging targets in cancer immunotherapy: CD27 (TNFRSF7). ESMO Open (2020) 4:e000629. doi: 10.1136/esmoopen-2019-000629
5. Wajant H. Therapeutic targeting of CD70 and CD27. Expert Opin Ther Targets (2016) 20:959–73. doi: 10.1517/14728222.2016.1158812
6. Takeuchi T, Tsuzaka K, Kameda H, Amano K. Therapeutic targets of misguided T cells in systemic lupus erythematosus. Curr Drug Targets Inflammation Allergy (2005) 4:295–8. doi: 10.2174/1568010054022060
7. Nagashima H, Ishii N, So T. Regulation of interleukin-6 receptor signaling by TNF receptor-associated factor 2 and 5 during differentiation of inflammatory CD4+T cells. Front Immunol (2018) 9:1986. doi: 10.3389/fimmu.2018.01986
8. Li T, Lv M, Chen X, Yu Y, Zang G, Tang Z. Plumbagin inhibits proliferation and induces apoptosis of hepatocellular carcinoma by downregulating the expression of SIVA. Drug Des Dev Ther (2019) 13:1289–300. doi: 10.2147/DDDT.S200610
9. Ansell SM, Flinn I, Taylor MH, Sikic BI, Brody J, Nemunaitis J, et al. Safety and activity of varlilumab, a novel and first-in-class agonist anti-CD27 antibody, for hematologic malignancies. Blood Adv (2020) 4:1917–26. doi: 10.1182/bloodadvances.2019001079
10. Sanborn RE, Pishvaian MJ, Callahan MK, Weise A, Sikic BI, Rahma O, et al. Safety, tolerability and efficacy of agonist anti-CD27 antibody (varlilumab) administered in combination with anti-PD-1 (nivolumab) in advanced solid tumors. J Immunother Cancer (2022) 10:e005147. doi: 10.1136/jitc-2022-005147
11. Mayerhoefer ME, Materka A, Langs G, Häggström I, Szczypiński P, Gibbs P, et al. Introduction to radiomics. J Nucl Med (2020) 61:488–95. doi: 10.2967/jnumed.118.222893
12. Avanzo M, Wei L, Stancanello J, Vallières M, Rao A, Morin O, et al. Machine and deep learning methods for radiomics. Med Phys (2020) 47:e185–202. doi: 10.1002/mp.13678
13. Zhang X, Shi M, Chen T, Zhang B. Characterization of the immune cell infiltration landscape in head and neck squamous cell carcinoma to aid immunotherapy. Mol Ther Nucleic Acids (2020) 22:298–309. doi: 10.1016/j.omtn.2020.08.030
14. Leemans CR, Snijders PJF, Brakenhoff RH. The molecular landscape of head and neck cancer. Nat Rev Cancer (2018) 18:269–82. doi: 10.1038/nrc.2018.11
15. Doescher J, Minkenberg P, Laban S, Kostezka U, von Witzleben A, Hoffmann TK, et al. Immune checkpoint expression in HNSCC patients before and after definitive chemoradiotherapy. Head Neck (2021) 43:778–87. doi: 10.1002/hed.26534
16. Han BK, Olsen NJ, Bottaro A. The CD27-CD70 pathway and pathogenesis of autoimmune disease. Semin Arthritis Rheum (2016) 45:496–501. doi: 10.1016/j.semarthrit.2015.08.001
17. Lutfi F, Wu L, Sunshine S, Cao X. Targeting the CD27-CD70 pathway to improve outcomes in both checkpoint immunotherapy and allogeneic hematopoietic cell transplantation. Front Immunol (2021) 12:715909. doi: 10.3389/fimmu.2021.715909
18. Carlino MS, Larkin J, Long GV. Immune checkpoint inhibitors in melanoma. Lancet (2021) 398:1002–14. doi: 10.1016/S0140-6736(21)01206-X
19. Bagchi S, Yuan R, Engleman EG. Immune checkpoint inhibitors for the treatment of cancer: Clinical impact and mechanisms of response and resistance. Annu Rev Pathol (2021) 16:223–49. doi: 10.1146/annurev-pathol-042020-042741
20. Denoeud J, Moser M. Role of CD27/CD70 pathway of activation in immunity and tolerance. J Leukoc Biol (2011) 89:195–203. doi: 10.1189/jlb.0610351
21. Ghosh S, Köstel Bal S, Edwards ESJ, Pillay B, Jiménez Heredia R, Erol Cipe F, et al. Extended clinical and immunological phenotype and transplant outcome in CD27 and CD70 deficiency. Blood (2020) 136:2638–55. doi: 10.1182/blood.2020006738
22. Yip SS, Aerts HJ. Applications and limitations of radiomics. Phys Med Biol (2016) 61:R150–66. doi: 10.1088/0031-9155/61/13/R150
23. Dasgupta A, Fatima K, DiCenzo D, Bhardwaj D, Quiaoit K, Saifuddin M, et al. Quantitative ultrasound radiomics in predicting recurrence for patients with node-positive head-neck squamous cell carcinoma treated with radical radiotherapy. Cancer Med (2021) 10:2579–89. doi: 10.1002/cam4.3634
24. Kourou K, Exarchos TP, Exarchos KP, Karamouzis MV, Fotiadis DI. Machine learning applications in cancer prognosis and prediction. Comput Struct Biotechnol J (2015) 13:8–17. doi: 10.1016/j.csbj.2014.11.005
25. Yuan Y, Ren J, Tao X. Machine learning-based MRI texture analysis to predict occult lymph node metastasis in early-stage oral tongue squamous cell carcinoma. Eur Radiol (2021) 31:6429–37. doi: 10.1007/s00330-021-07731-1
26. Dohopolski M, Chen L, Sher D, Wang J. Predicting lymph node metastasis in patients with oropharyngeal cancer by using a convolutional neural network with associated epistemic and aleatoric uncertainty. Phys Med Biol (2020) 65:225002. doi: 10.1088/1361-6560/abb71c
27. Shan J, Jiang R, Chen X, Zhong Y, Zhang W, Xie L, et al. Machine learning predicts lymph node metastasis in early-stage oral tongue squamous cell carcinoma. J Oral Maxillofac Surg (2020) 78:2208–18. doi: 10.1016/j.joms.2020.06.015
28. Eun YG, Lee JW, Kim SW, Hyun DW, Bae JW, Lee YC. Oral microbiome associated with lymph node metastasis in oral squamous cell carcinoma [Sci. rep.]. Sci Rep (2021) 11:23176. doi: 10.1038/s41598-021-02638-9
29. von Witzleben A, Fehn A, Grages A, Ezić J, Jeske SS, Puntigam LK, et al. Prospective longitudinal study of immune checkpoint molecule (ICM) expression in immune cell subsets during curative conventional therapy of head and neck squamous cell carcinoma (HNSCC). Int J Cancer (2021) 148:2023–35. doi: 10.1002/ijc.33446
30. Ohno Y, Koyama H, Lee HY, Miura S, Yoshikawa T, Sugimura K. Contrast-enhanced CT- and MRI-based perfusion assessment for pulmonary diseases: Basics and clinical applications. Diagn Interv Radiol (2016) 22:407–21. doi: 10.5152/dir.2016.16123
31. Mühlberg A, Holch JW, Heinemann V, Huber T, Moltz J, Maurus S, et al. The relevance of CT-based geometric and radiomics analysis of whole liver tumor burden to predict survival of patients with metastatic colorectal cancer. Eur Radiol (2021) 31:834–46. doi: 10.1007/s00330-020-07192-y
32. Betancourt-Cuellar SL, Benveniste MFK, Palacio DP, Hofstetter WL. Esophageal cancer: Tumor-node-metastasis staging. Radiol Clin North Am (2021) 59:219–29. doi: 10.1016/j.rcl.2020.11.008
33. Bruixola G, Remacha E, Jiménez-Pastor A, Dualde D, Viala A, Montón JV, et al. Radiomics and radiogenomics in head and neck squamous cell carcinoma: Potential contribution to patient management and challenges. Cancer Treat Rev (2021) 99:102263. doi: 10.1016/j.ctrv.2021.102263
Keywords: enhanced-CT, radiomics, CD27, head and neck squamous cell carcinoma, clinical prognosis
Citation: Wang F, Zhang W, Chai Y, Wang H, Liu Z and He Y (2022) Constrast-enhanced computed tomography radiomics predicts CD27 expression and clinical prognosis in head and neck squamous cell carcinoma. Front. Immunol. 13:1015436. doi: 10.3389/fimmu.2022.1015436
Received: 09 August 2022; Accepted: 28 October 2022;
Published: 15 November 2022.
Edited by:
Wendy Nevala, Mayo Clinic, United StatesReviewed by:
Stergios Doumas, William Harvey Hospital, United KingdomNerina Denaro, Azienda Sanitaria Ospedaliera S.Croce e Carle Cuneo, Italy
Copyright © 2022 Wang, Zhang, Chai, Wang, Liu and He. This is an open-access article distributed under the terms of the Creative Commons Attribution License (CC BY). The use, distribution or reproduction in other forums is permitted, provided the original author(s) and the copyright owner(s) are credited and that the original publication in this journal is cited, in accordance with accepted academic practice. No use, distribution or reproduction is permitted which does not comply with these terms.
*Correspondence: Yue He, ZWRkaWVsZXdAYWx1bW5pLnNqdHUuZWR1LmNu
†These authors have contributed equally to this work
 Fang Wang1†
 Yue He