- 1International Institute of Tropical Agriculture, Ibadan, Nigeria
- 2Department of Biotechnology, Faculty of Science, University of Kisangani, Kisangani, Democratic Republic of Congo
- 3University of California, Riverside, Riverside, CA, United States
Introduction: Landrace accession of yam species in the Democratic Republic of Congo (DRC) represents a valuable genetic resource for yam breeding programs. These accessions possess traits such as stress resilience and desirable food quality attributes that can be introduced into modern yam varieties. By analyzing the genetic diversity, identifying quantitative trait loci (QTLs) linked to key traits, and the genetic merits of these landraces, we can identify promising genetic markers for breeding programs aimed at improving yam production in DRC.
Materials and methods: We analyzed 181 yam accessions from the Democratic Republic of Congo (DRC), representing six species commonly cultivated by farmers and their wild relatives. These accessions were genotyped using 10,621 DArTseq SNP markers and characterized for key productivity and food quality traits.
Results and discussion: Population structure analysis revealed six distinct genetic groups within the yam accessions. Genome-wide association studies (GWAS) identified 14 SNP markers associated with five key traits, suggesting the accessions’ potential as a valuable genetic resource. Further dissection of their genetic merits in yam breeding using the Genomic Prediction of Cross Performance (GPCP) allowed the identification of several accessions with high crossing merit for multiple traits. Genomic Prediction of Cross Performance (GPCP) identified 20 accessions with high crossing merit (>2).
Conclusions: These accessions demonstrate favorable genetic combinations for multiple traits, making them promising progenitors for developing segregating populations with improved characteristics. These findings highlight the potential of these accessions to contribute to genetic improvement in yam breeding programs in the DRC, focusing on traits such as productivity and food quality.
Introduction
Yam (Dioscorea spp.) is a monocotyledonous vine cultivated in the tropics and subtropics for its starchy tubers and aerial bulbils. With about 600 species, this genus is the most important within the Dioscoreaceae family (Asiedu and Sartie, 2010; Bassey, 2017; FAOSTAT, 2022). Eleven species are primarily grown for food and income globally, while others have potential pharmaceutical applications due to their bioactive compounds (Adejumobi et al., 2022a; Asiedu and Sartie, 2010; Bukatuka et al., 2016). Of the globally cultivated species, the white Guinea yam (D. rotundata), water yam (D. alata), and yellow yam (D. cayenensis) dominate global yam production (over 95%) (Adejumobi et al., 2023a). In the Democratic Republic of Congo (DRC), yam is crucial for food security, especially for people living in rural areas of the DRC. In addition to the three species that dominate global yam production, bitter yam (D. dumetorum), aerial yam (D. bulbifera), bush yam (D. praehensilis), and wild yam (D. burkilliana) have also been documented as cultivated species in DRC (Adejumobi et al., 2022b; Bukatuka et al., 2016; Jeancy et al., 2021).
Yams propagate mainly vegetatively but can also flower and produce seeds. Many yam varieties have separate male and female flowers (dioecious) and are highly heterozygous due to outcrossing (Adejumobi et al., 2022a; Egesi et al., 2007). Ploidy levels vary within and between species, with a basic chromosome number of x=20 (Agre et al., 2022). Although yams are a vital food source for rural communities in the DRC, Landraces, with diverse origins and adaptations, form the core of cultivated yam diversity in DRC and the production faces several challenges throughout the growing season. These include pests, diseases, poor soil fertility, and limited access to improved varieties. These constraints have consistently reduced the productivity of many traditionally cultivated varieties, increased genetic erosion, and ultimately decreased interest in yam farming in many parts of the country.
To mitigate these challenges, a systematic collection and evaluation of yam landraces would be crucial for the conservation and identification of valuable genes in the available yam gene pool in DRC. Morphological markers, like the above soil characteristics (plant vigor, leaf type, etc.), tuber size, and tuber shape, are common parameters used to assess yam diversity but can be misleading (Darkwa et al., 2020; Mulualem et al., 2018; Schulman, 2007; Ude et al., 2019). These markers are limited in number, influenced by the environment, and may not accurately reflect genetic variation (Agre et al., 2021a; Pachakkil et al., 2021). Molecular markers provide a more accurate way to identify yam genotypes and assess genetic diversity (Loko et al., 2017; Mignouna et al., 2002; Pachakkil et al., 2021). Various marker types have been successfully employed, including Restriction Fragment Length Polymorphism (RFLP) (Terauchi et al., 1991), Simple Sequence Repeats (SSR) (Adewumi et al., 2020; Loko et al., 2017), and Single Nucleotide Polymorphism (SNP) markers from Next-Generation Sequencing (NGS) techniques (Adejumobi et al., 2023b; Bhattacharjee et al., 2013; Onyilagha and Lowe, 1986; Saski et al., 2015; Tamiru et al., 2017 These markers have been explored to assess yam diversity and its evolution. While previous studies explored yam diversity, few have linked it to breeding value for addressing current and future challenges (Agre et al., 2019; Agre et al., 2021b) and Darkwa et al. (2020) used combined genomic and phenotypic data to identify breeding groups for yam improvement. However, limited genomic and agronomic data exist for popular landraces, which are the major cultivated yam diversity in DRC. Local landraces are potential sources of genes for stress resistance, adaptation, and quality traits (Adejumobi et al., 2022a; Magwé-Tindo et al., 2018; Scarcelli et al., 2019). Therefore, understanding their genetic diversity and agronomic value is critical for the efficient utilization, management, and conservation of yam landraces in DRC. This study aimed to assess the genetic diversity, identify Quantitative Trait Nucleotides (QTN) linked to key agronomic and quality traits, and evaluate the genetic merits of cultivated landraces in DRC using DArT-derived SNP markers.
Materials and methods
Plant materials
A panel of white 192 yam accessions distributed across six species (D. rotundata, D. alata, D. cayenensis, D. bulbifera, D. praehensilis, and D. dumetorum) was collected from three of the major yam provinces in the Democratic Republic of Congo (Supplementary Table 1). During the collection, local names and origins of yams were documented and yam accessions with the same name were differentiated by the location.
Field establishment and phenotypic data analysis
The 192 yam accessions underwent a two-year evaluation (2021 and 2022) at the University of Kisangani’s research field. Located at 0°33′05.9”N latitude and 25°05′17.3”E longitude, the site sits at an elevation of 396 meters above sea level (m a.s.l.) and experiences a dense, humid forest climate. Rainfall is irregular throughout the year, averaging 3156 mm annually. The soil is primarily classified as Oxisols (ferralsols in the FAO system), and the average temperature ranges from a minimum of 21°C to a maximum of 35°C. A 12 x 16-lattice design with two replicates was used to establish the yam accessions. Each experimental plot consisted of a five-meter ridge with five plants spaced one meter apart within and between planting ridges. Traits phenotyping for tuber yield, dry matter content, tuber oxidative browning, tuber flesh texture, plant vigor, yam mosaic virus disease severity, yam anthracnose disease, and set multiplication ratio follow the recommendations of Asfaw (2016) detailed in Supplementary Table 2 and Supplementary Figure 1. To analyze the phenotypic data, we curated the phenotypic data collected using box and whisker plots in bioflow software (bioflow.ebsproject.org) to eliminate outliers and ensure quality phenotypic data for further analysis in R statistical computing environment (R Core Team, 2017). This analysis involved several steps. including estimating the Best Linear Unbiased Estimates (BLUEs), which act as proxies for the genetic value of each yam accession using the lme4 package (Bates et al., 2015). Comparing the mean values of each trait across the different yam accessions, and identifying trait relationships using the pairs.panels function in the Psych R package (Revelle, 2015) to understand how these traits influence each other. Finally, various genetic parameters were estimated including genotypic and environmental variances, broad-sense heritability, and genotypic and phenotypic coefficients of variation in the formula below to help quantify the contribution of genetic factors to the observed variations in the traits.
Where; δ2p = phenotypic variance, δ2g = genotypic variance, δ2gl = genotype by environment interaction variance; δ2e: residual variance, r = number of replications; l = number of environments; µ: grand mean of the trait.
Genotypic data assessment
Yam leaves were collected from 181 yam genotypes that emerged and got established successfully on the soil at 8 weeks after planting using Dry silica gel and sent to the Diversity array technology (DArT, Australia) where the DNAs were sequenced using DArTSeq 1.2 Mln. At DArT, high-throughput genotyping was performed using their 96-plex DArTseq protocol. Single Nucleotide Polymorphisms (SNPs) were identified and analyzed using DArT’s proprietary software, DArTSoft, as described by Kilian et al (2016). Finally, the generated sequencing reads were aligned with the White Guinea yam (Dioscorea rotundata) reference genome of version 2 (Sugihara et al., 2020).
Analysis of molecular data
The Hapmap file containing 20,275 SNP markers obtained from the DArT sequencing platform was first converted into a Variant Call Format (VCF) file in Tassel software (Bradbury et al., 2007). To ensure high-quality data for further analysis, filtering steps were applied. Markers with a minor allele frequency (MAF) below 0.05, and missing values exceeding 20% were excluded from the raw data generated by DArT. This resulted in a final set of 10,620 reliable SNP markers. Missing data points within these markers were imputed using Beagle software v4.0 (Browning and Browning, 2013). Expected (He) and observed (Ho) heterozygosity, minor allele frequency, and polymorphism information content (PIC) (MAF) were estimated using VCFtools and PLINK software (Danecek et al., 2011; Purcell et al., 2007). The CMplot function in the CMplot package (Yin, 2022) was used to determine the SNP density across the 20 yam chromosomes. Admixture was used to access the population structure implemented in the df2genind function in the adegenet package (Jombart, 2008) in R. The optimal number of clusters was determined based on posterior probability. Membership probabilities (MP) were then estimated for each landrace within each cluster, with a threshold of 60% set for assignment. Landraces exceeding this threshold were assigned to a specific cluster, while those with lower MP (<60%) were considered admixt (having genetic contributions from multiple clusters). To further explore genetic relationships, a distance matrix was calculated using the IBS method implemented in PLINK 2.0 using the ibs-matrix function. This matrix was used for hierarchical cluster analysis using the upgma function in the ape package (Paradis and Schliep, 2019) in R.
Genome-wide association study analysis for target traits
The association between SNP markers and the measured traits was determined using two models: the K+Q and Naïve Mixed Linear Model (MLM) using the GAPIT function implemented in the GAPIT (Genome Association and Prediction Integrated Tool) – R package (Lipka et al., 2012).
The first model (K+Q) considers each SNP marker individually and accounts for the influence of other factors like genetic background. This analysis was based on the previously established method of Yu et al. (2006) as described below.
Where; Y is the observed vector of means; β is the fixed effect vector (p × 1) other than molecular marker effects and population structure (from the principal component); α is the fixed effect vector of the SNP markers; ν is the fixed effect vector from the population structure; u is the random effect vector from the polygenic background effect; X, W, and Z are the incidence matrices from the associated β, α, ν, and u parameters; ∈ is the residual effect vector.
To detect reliable associations, a threshold (>5) was set and calculated as follows: -log10 (0.05/m), where m is the number of the total SNP markers. The second model (Naïve MLM) focuses solely on the SNP markers’ effect. The marker effect or SNP contribution was estimated for the significant SNPs using multiple regression analysis using lme4 package (Bates et al., 2015), where the trait was considered a response variable while the SNP markers above the Bonferroni threshold for the trait were used as the independent variable.
Estimation of multi-trait index
The total genetic values (BLUP) were used to calculate a multi-trait index based on the factor analysis and ideotype-design (FAI-BLUP) (Rocha et al., 2018) index using the waasb and fai_blup functions in the Metan package (Olivoto and Nardino, 2021) implemented in R. The FAI-BLUP index was used to identify the best yam accessions (ideotype) based on multi-traits and free from multicollinearity. Tuber yield, dry matter content, tuber multiplication ratio, plant vigor, tuber oxidative browning, tuber flesh texture, yam anthracnose severity score, and yam mosaic virus severity score were used to identify the best yam accessions. A radar chart was generated to visualize the selected yam accession using the radar chart function implemented in the Metan R package. The weaknesses and strengths of the selected yam ideotypes were also visualized using the radar chart function (Olivoto and Nardino, 2021).
Estimation of genomic prediction and cross-performance
For estimation of genomic prediction and cross performance, we chose to focus our analysis on the white Guinea yam (D. rotundata) for two key reasons: D. rotundata made up over 60% of the yam accessions selected by the multi-traits index. This focus allowed for more accurate and relevant results. A statistical method was implemented in ASReml-R software (Butler et al., 2017) following the formula given by Falconer and Mackay (1996) as shown below was employed to estimate how well different yam accessions might perform if crossed together.
Where MF1 is the predicted mean genotypic value of the cross (F1), a and d are additive and dominant effects of the SNP marker, p and q represent the allele dosage in one parent and y=pp’=q-q’ represents the gene frequency difference between two parents.
Using this formula, we proceeded to estimate the predicted average genetic value for the offspring of each potential cross between the chosen yam accessions. It is important to note that only compatible crosses were considered, as yam species like D. rotundata typically have separate male and female plants (dioecious).
Results
Phenotypic profiles of the 181 yam accessions
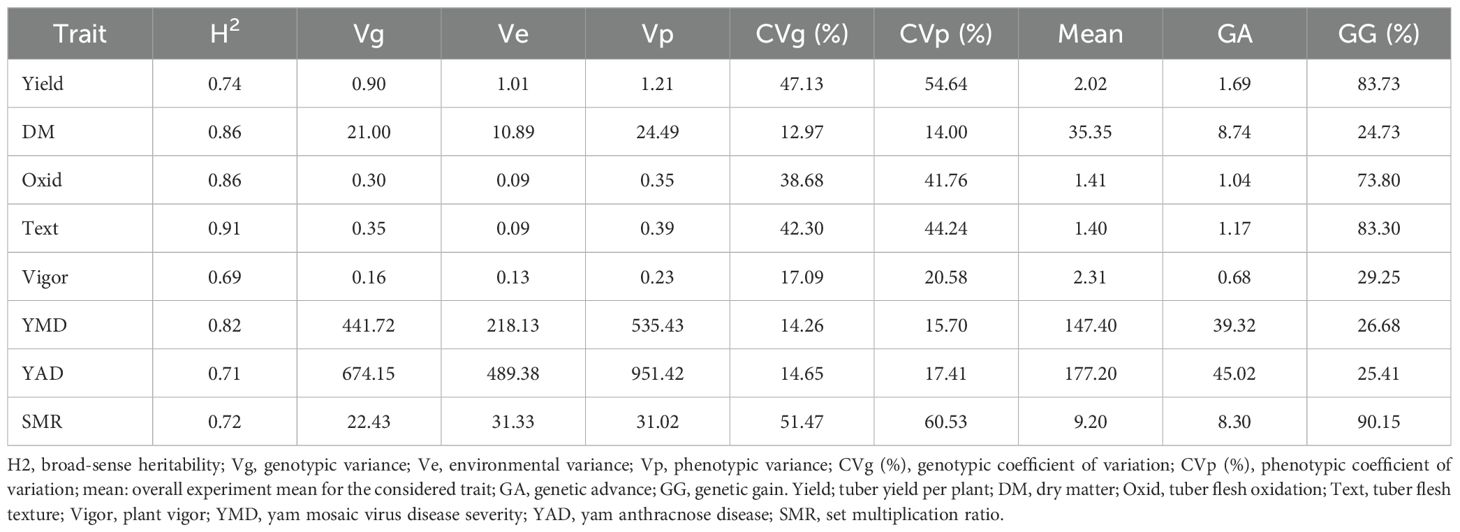
The phenotypic profiling of the assessed yam accessions is presented in Table 1. Based on the species of yam used in the study, tuber yield per plant ranged from 0.32 Kg translating to 3 t/ha (D. bulbifera) to 2.87 Kg translating to 29 t/ha (D. cayenensis). The dry matter content varied from 26% in D. bulbifera to 37% in D. rotundata. The seed multiplication ratio was highest in yam accessions from D. alata (14 setts/tuber) and lowest in D. bulbifera (2 setts/tuber). Tuber oxidative browning was highest in yam accessions from D. praehensilis (~ 2) while lowest in yam accessions from D. alata and D. dumetorum (-0.01 and -0.12, respectively). Tuber flesh texture varied from smooth (~ 1) in D. bulbifera and D. dumetorum to highly grainy (> 2) in accessions of D. alata. Yam accessions from D. bulbifera displayed the lowest AUPDC score for yam mosaic severity while accessions from D. rotundata displayed the highest. For yam anthracnose severity, accessions from D. praehensilis displayed the lowest AUDPC score while accessions from D. alata displayed the highest severity score. Accessions from D. alata, D. bulbifera, and D. dumetorum were more vigorous than other species. The traits correlation revealed a positive and significant relationship between tuber yield and tuber flesh texture (0.24, p< 0.01), plant vigor (0.41, P< 0.001), and seed multiplication ratio (0.80, p< 0.001). Dry matter content negatively and significantly correlated with plant vigor and yam anthracnose severity score (Figure 1). High phenotypic variations were observed for most of the measured traits. Broad-sense heritability ranged from 0.69 for plant vigor to 0.91 for tuber flesh texture. Tuber yield recorded a broad-sense heritability estimate of 0.74 (Table 2). The estimated breeding values of the genotypes for traits assessed are presented in Supplementary Table 3. In these results, tuber yield per plant ranged from -1.82 (TDb21_023) to +5.36 (TDr21_053), dry matter varied from -15.78 (TDd21_094) to 9.40 (TDr21_187), tuber flesh oxidation varied from -0.41 (TDr21_162) to +1.56 (TDr21_187) and plant vigor was lowest in TDp21_026 (-1.25) and highest in TDr21_175 (+0.65).

Table 1. Mean variability in the traits performance of yam germplasm based on species evaluated across two seasons.
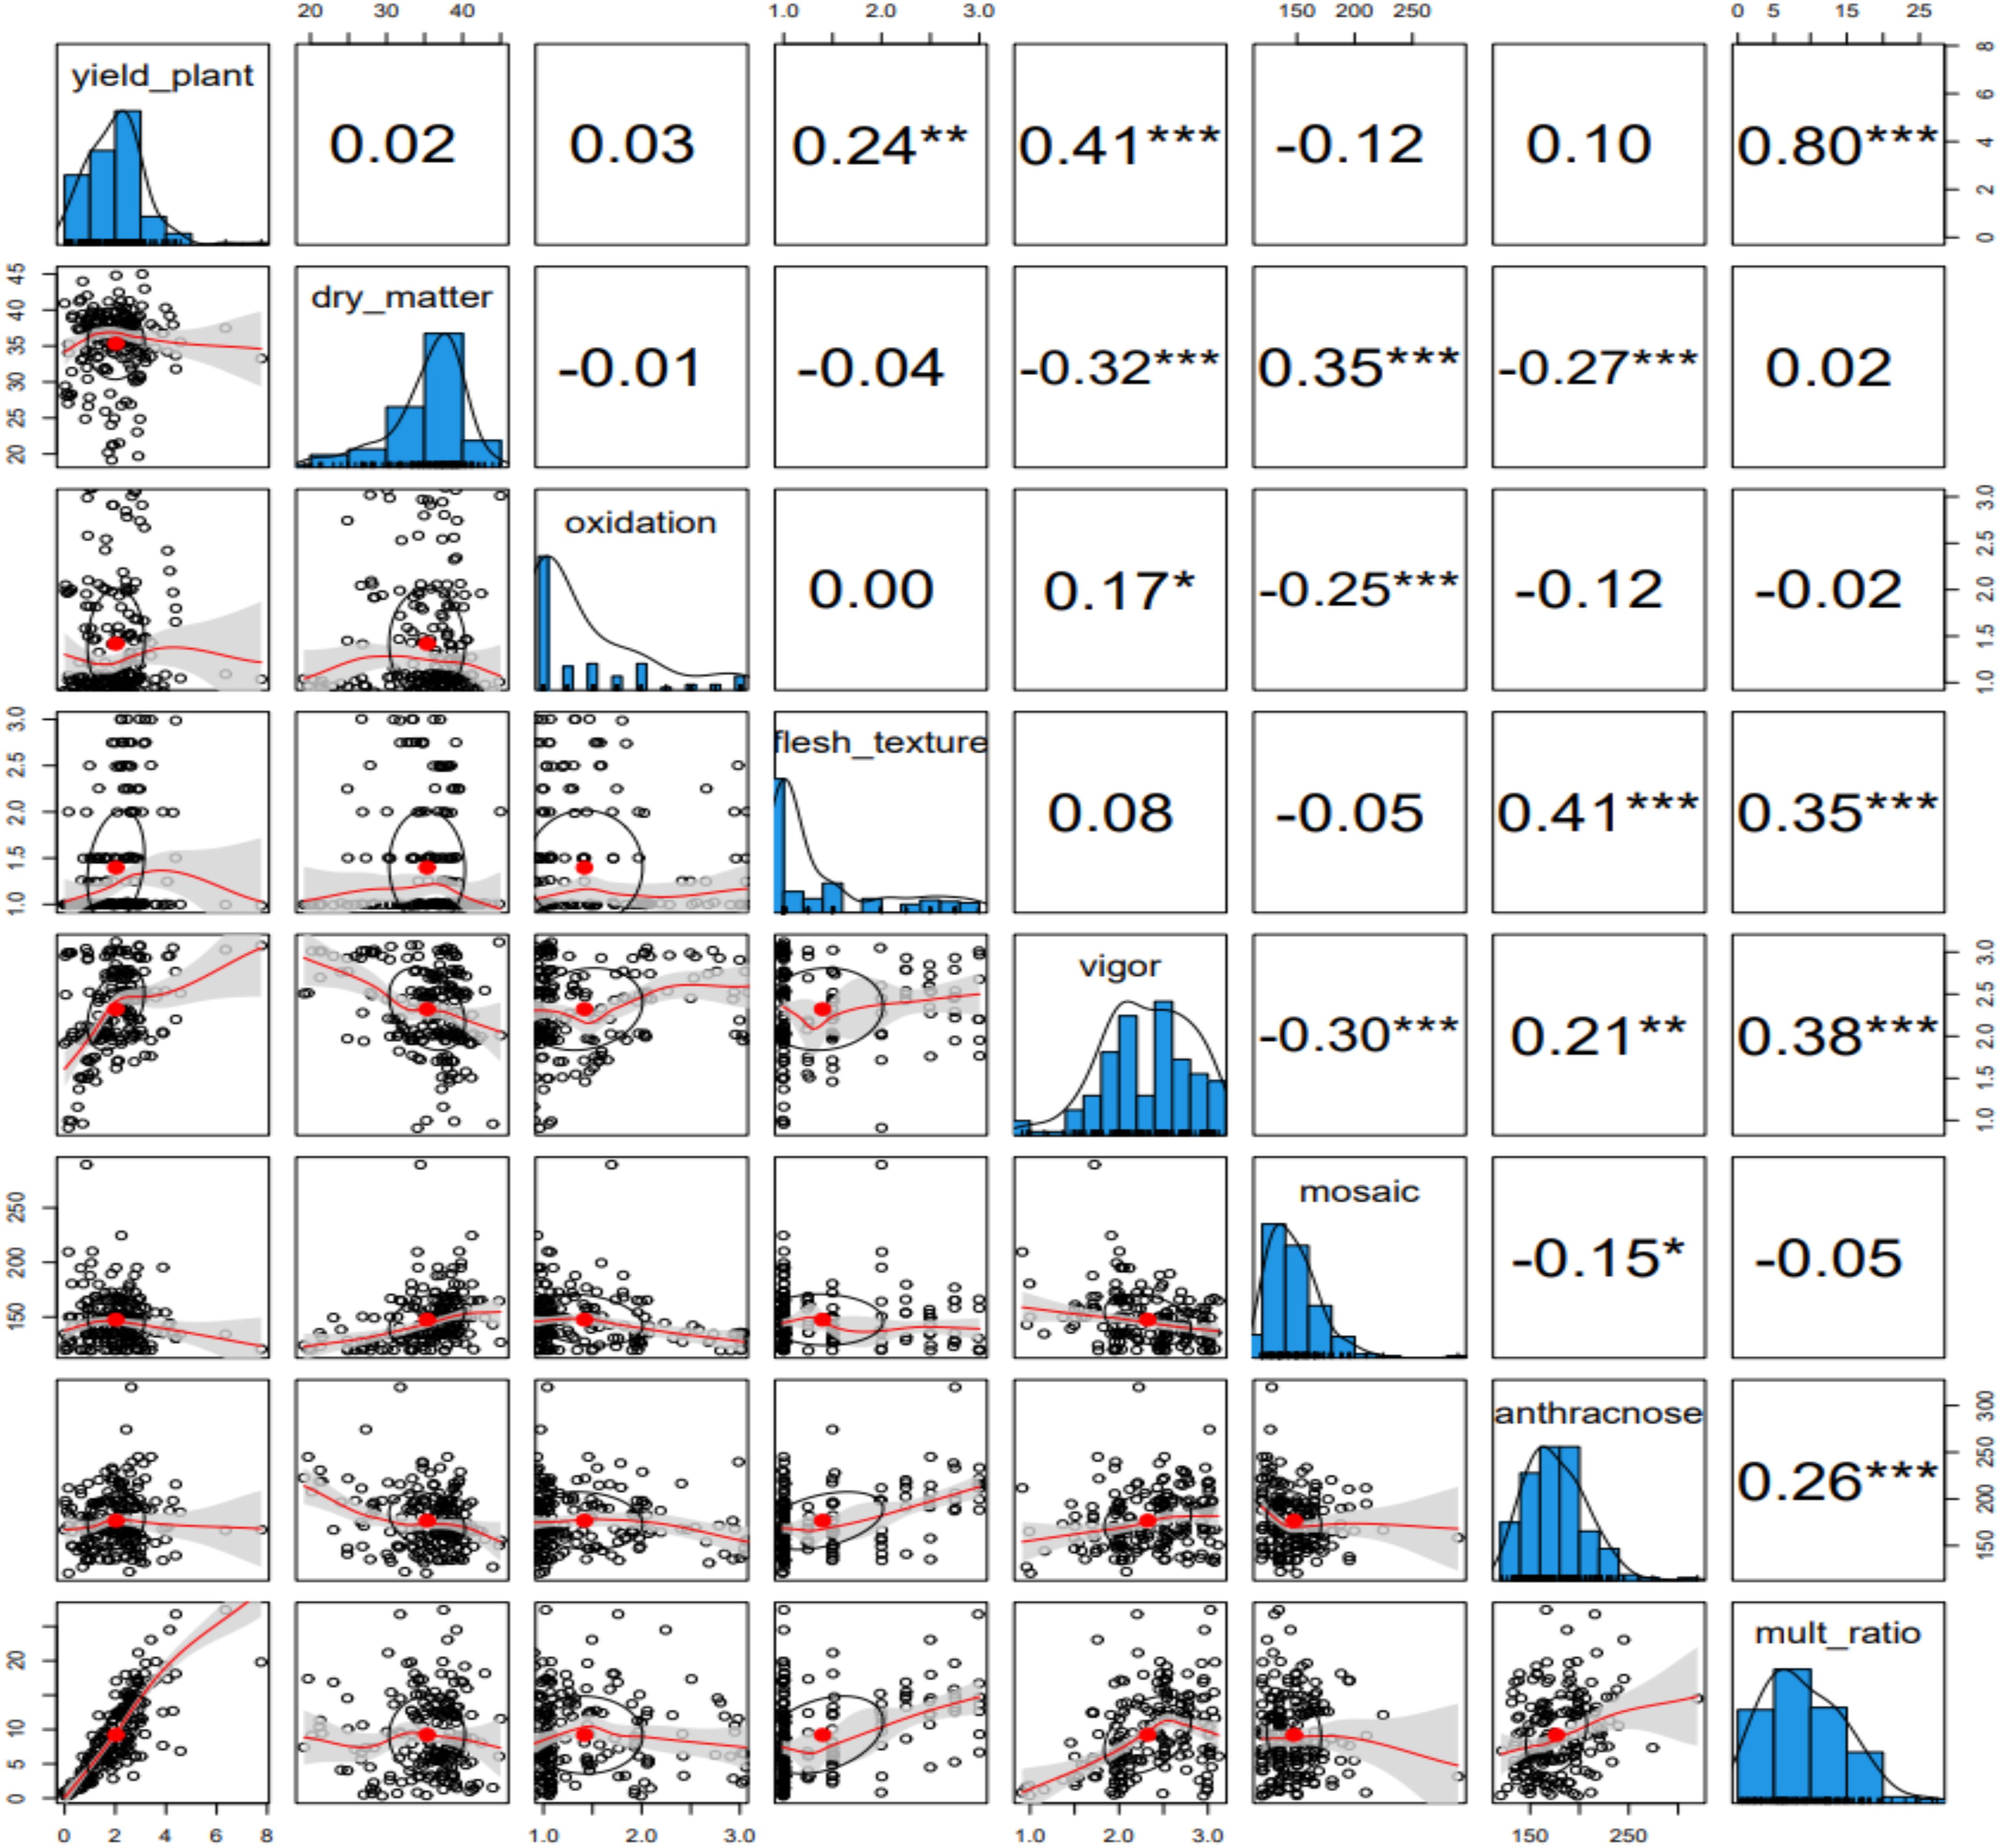
Figure 1. Phenotypic traits relationship among the traits assessed for the evaluation of 181 yam accessions. * represents a significant association at 0.05, ** represents a significant association at 0.01, and *** represents a significant association at 0.001.
Marker diversity and summary statistic
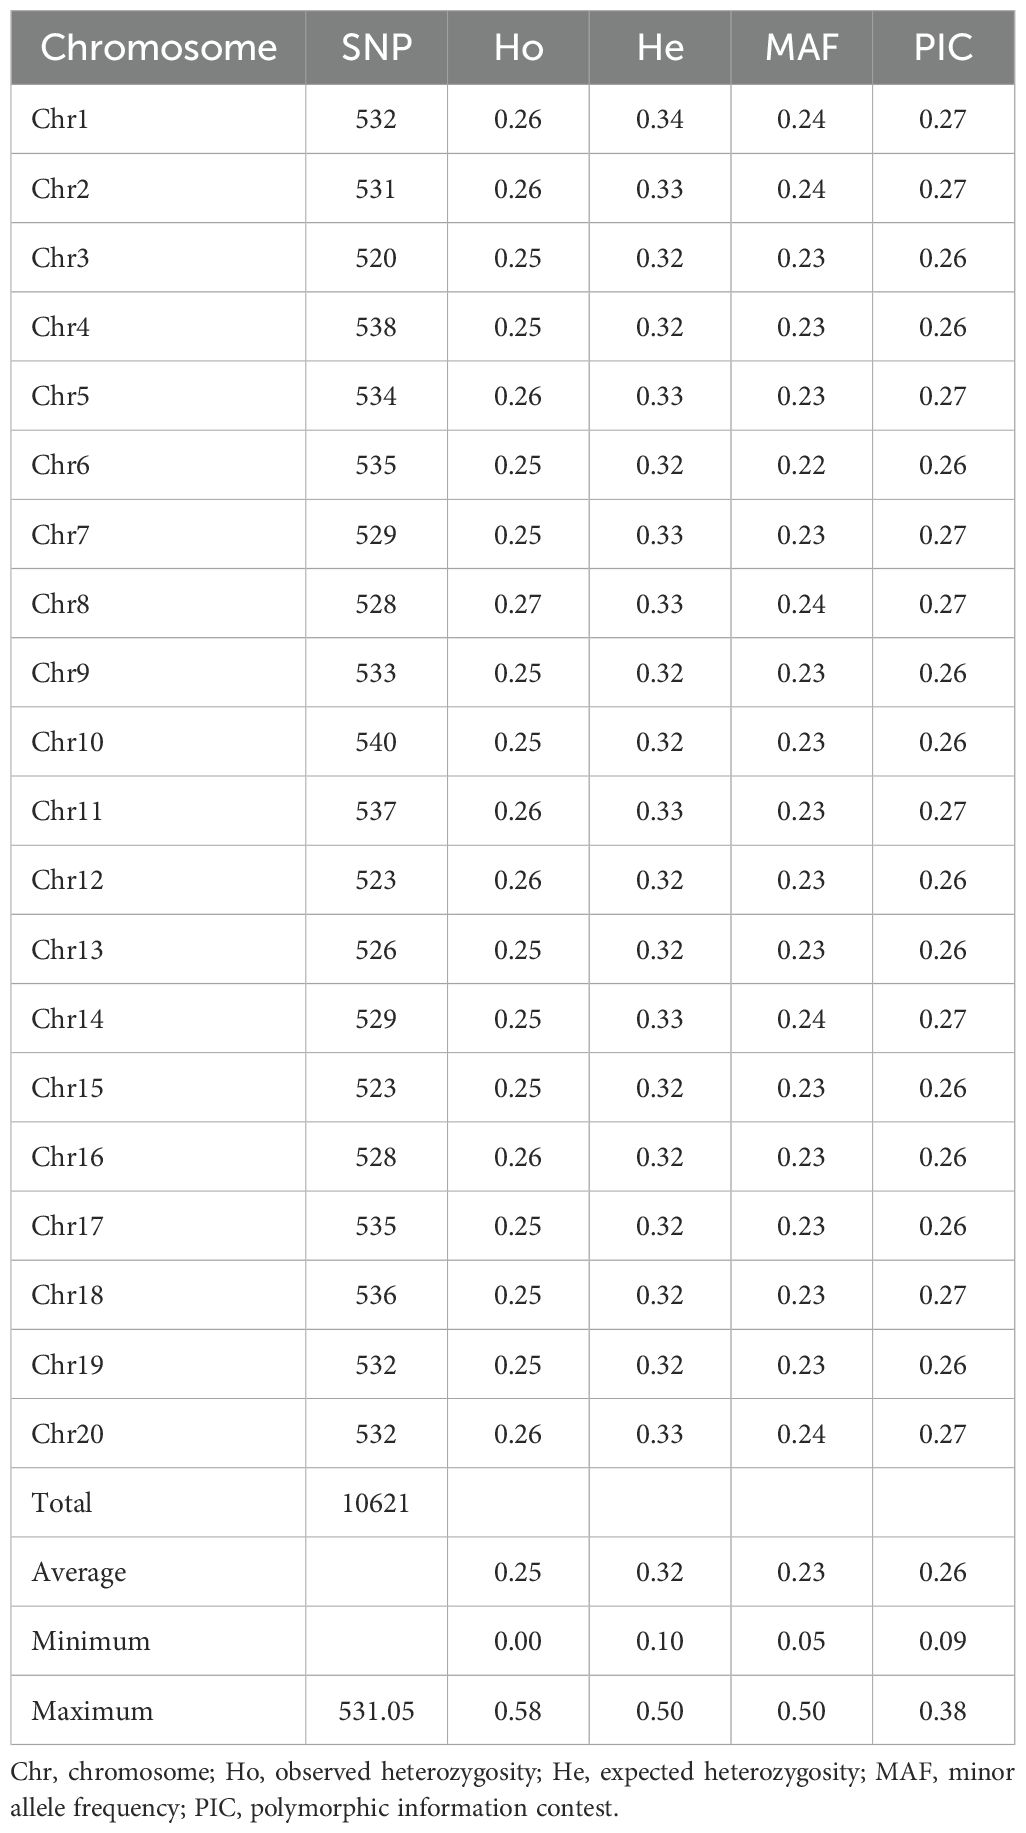
A total of 10,621 SNP markers were identified across the 20 yam chromosomes (Table 3). Marker distribution varied across chromosomes, with chromosome 3 containing the fewest (520) and chromosome 10 the most (540) markers. Genetic diversity assessments revealed an average observed heterozygosity of 0.25 (range: 0.00-0.58) and an expected heterozygosity of 0.32 (range: 0.10-0.50). The minor allele frequency averaged 0.23 (range: 0.05-0.50), while polymorphic information content (PIC) averaged 0.26 (range: 0.09-0.38).
Genetic variability and population structure
The population structure analysis based on Bayesian Criteria Information (BIC) indicated six distinct clusters of accessions. The largest cluster (Cluster 5, purple) comprised 18% of the yam accessions, followed by Cluster 6 (cyan) at 16%, followed by Cluster 3 (Orange) at 14%, followed by Cluster 4 (green) at 11%, followed by Cluster 2 (blue) at 8%, and lastly Cluster 1 (red) at 7%. Forty-nine yam accessions (27%) were not assigned to a definite cluster due to mixed ancestry (Figure 2). Clusters 1 and 2 included yam accessions from D. alata (85%) and D. bulbifera (15%), Clusters 2 to 5 included yam accessions from D. rotundata, and Cluster 6 included yam accessions from D. dumetorum (43%), D. cayenensis (36%), and D. praehensilis (21%) (Supplementary Table 4).
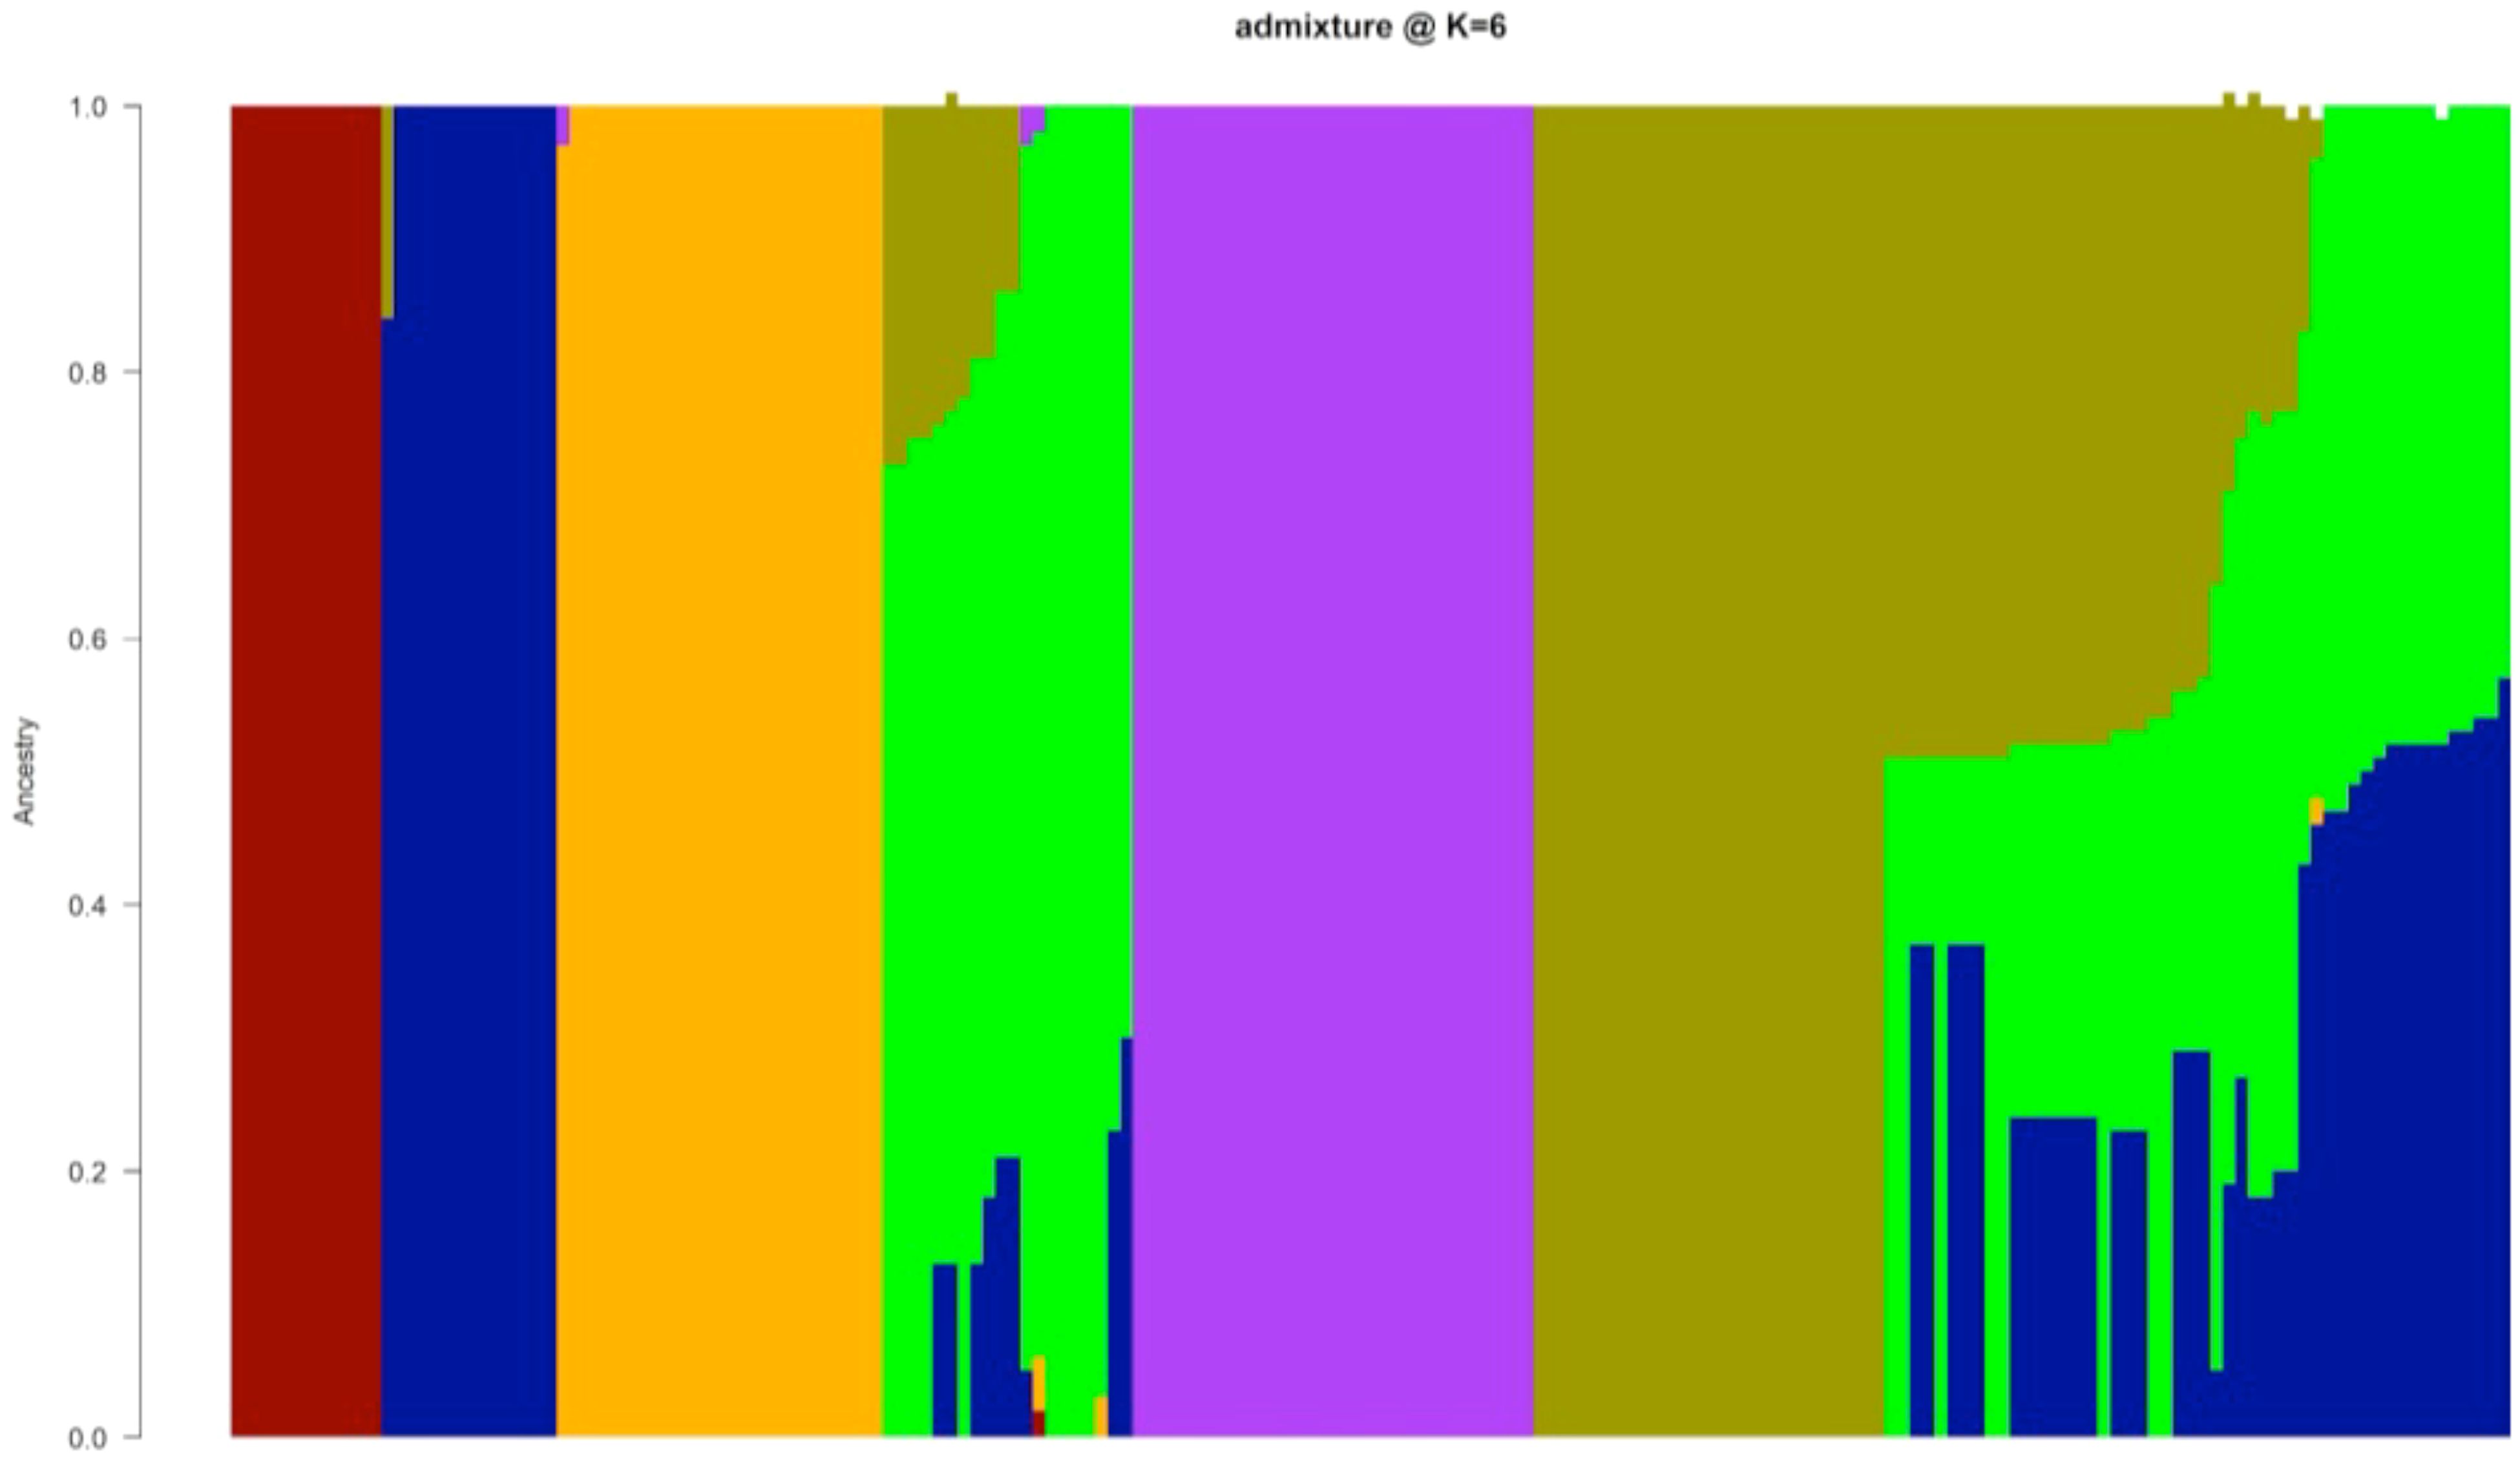
Figure 2. Graphical representation of yam accessions population structure based on admixture analysis. Populations were set at k = 6. The colors represent the six groups: group 1 (red), group 2 (blue), group 3 (orange), group 4 (green), group 5 (purple), and group 6 (cyan) based on a membership coefficient of ≥ 60%.
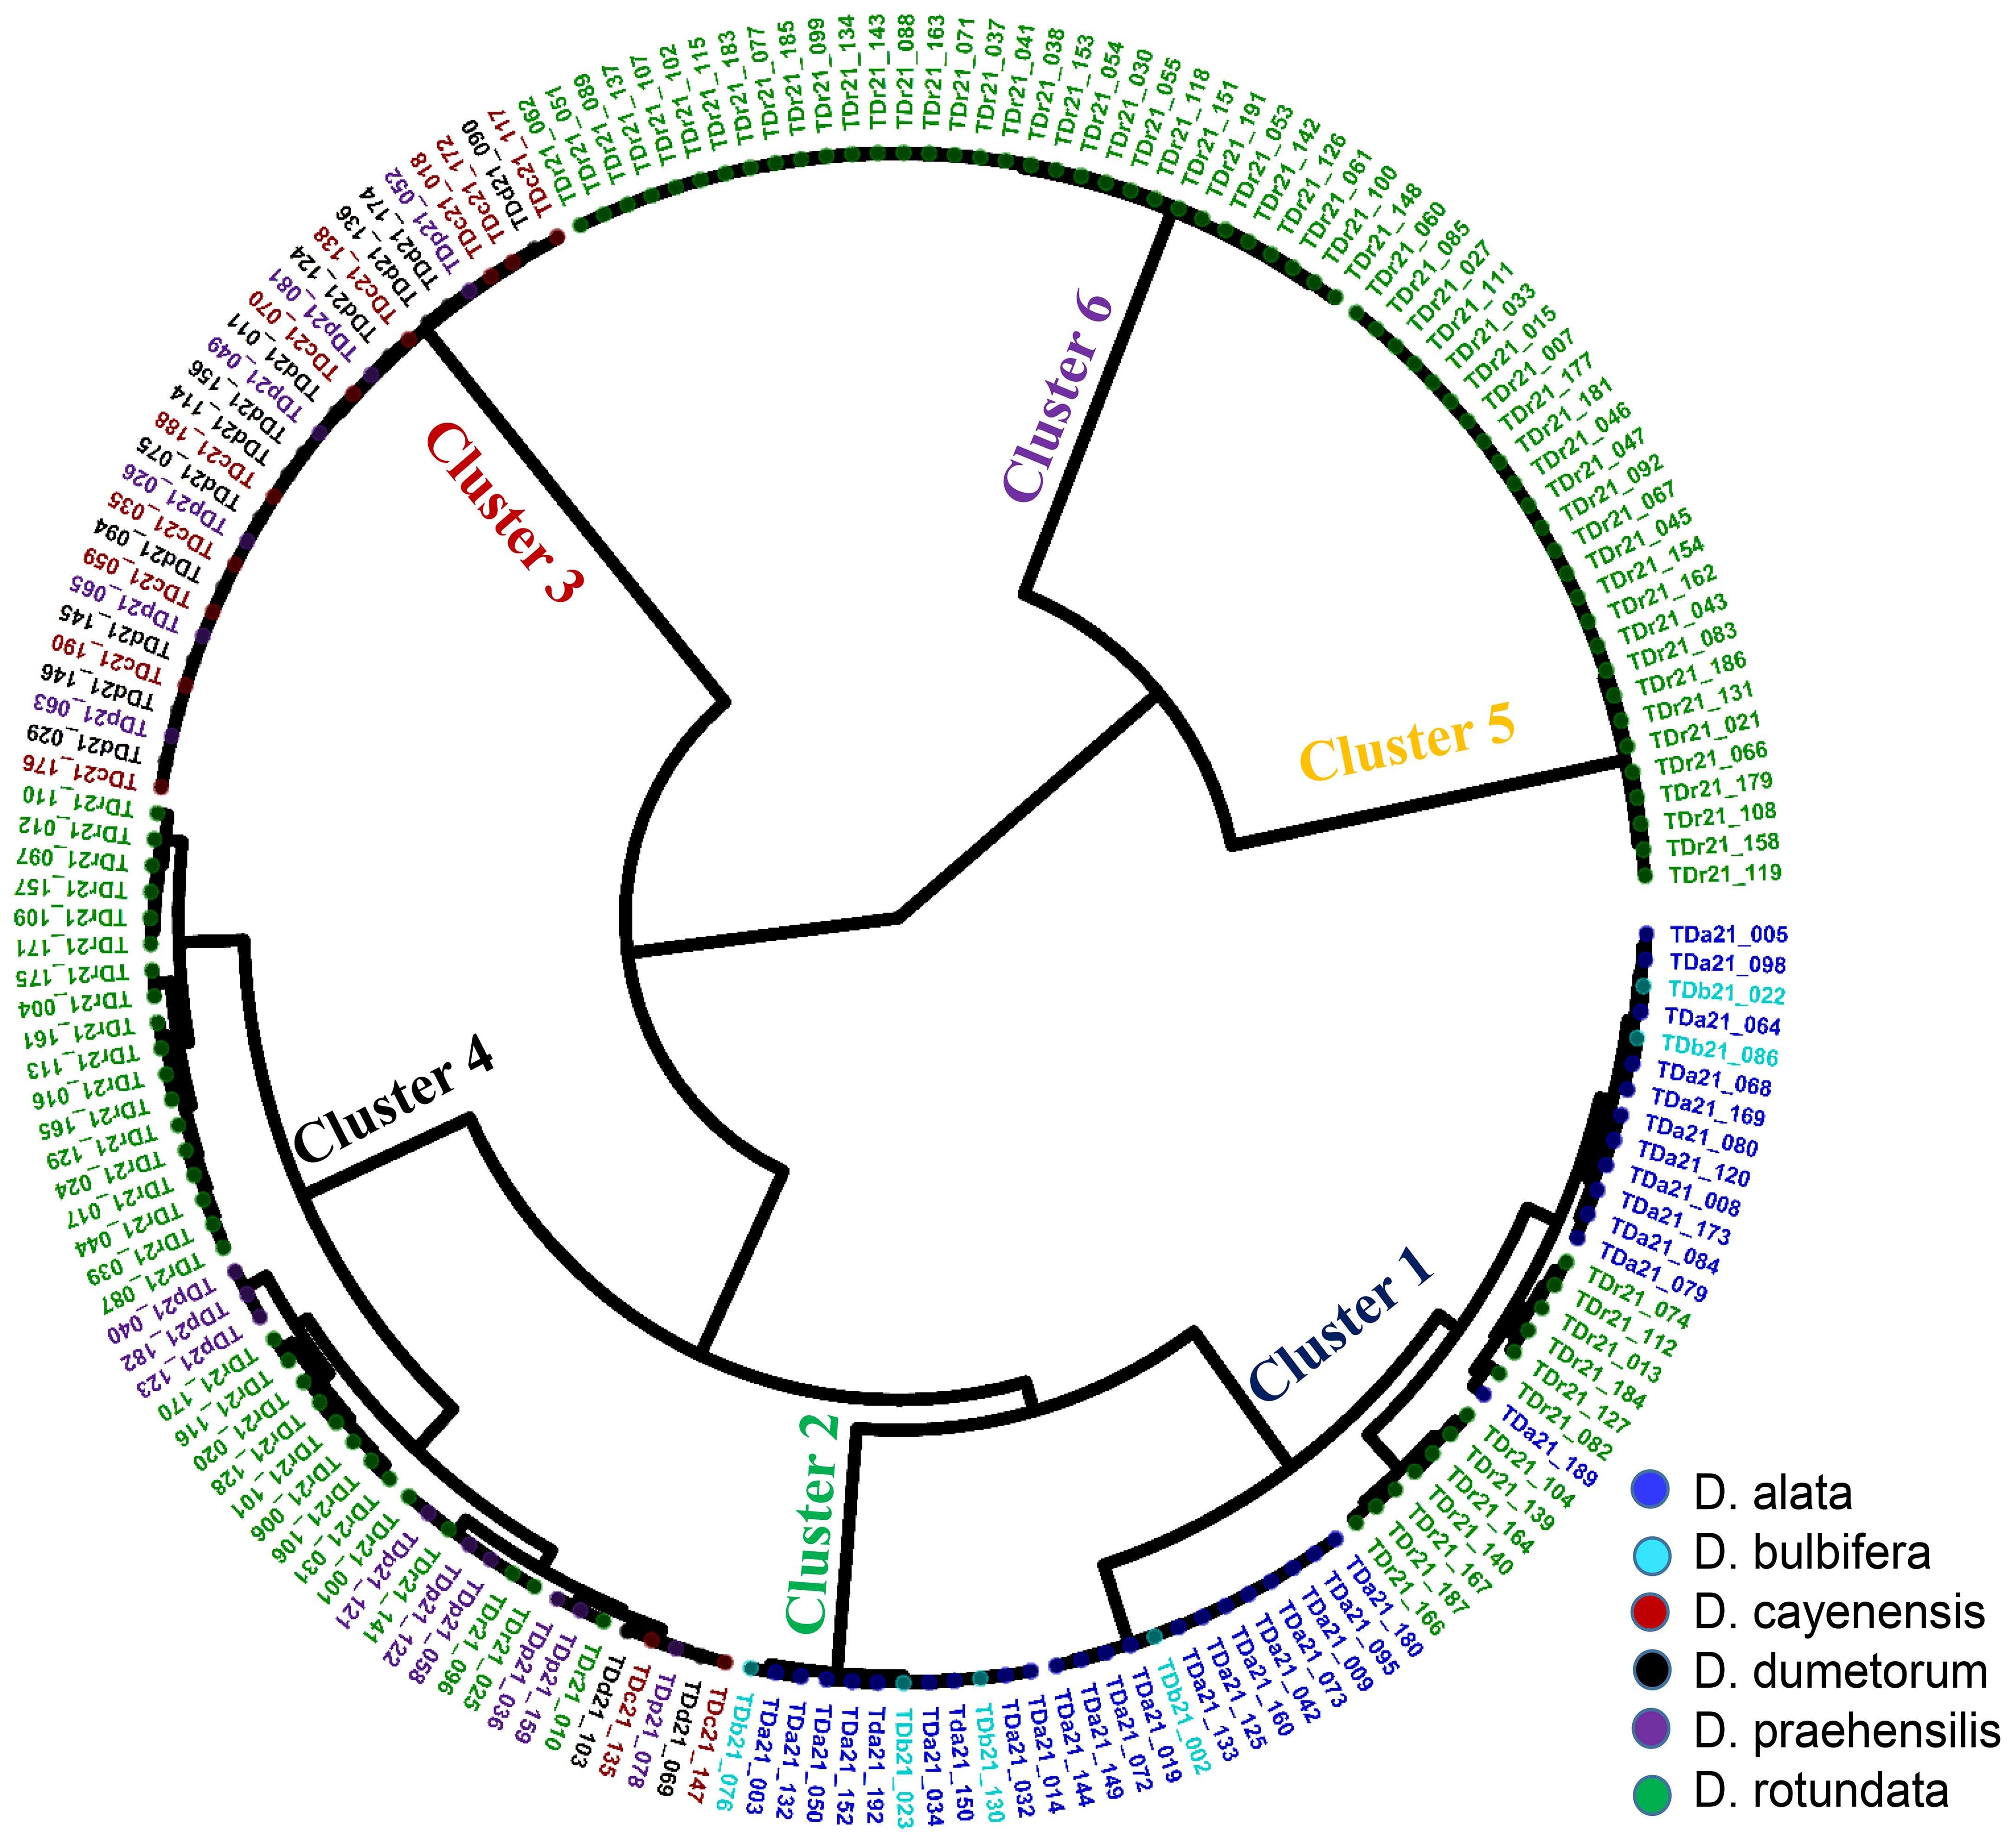
Genetic relationships among landraces were assessed using Identity-by-State (IBS) distances. Based on these distances observed in the hierarchical clustering, the 181 yam accessions were grouped into six distinct clusters (Figure 3). The largest cluster (group 4) comprised 44 yam accessions (24%), followed by 40 yam accessions (22%) in cluster 1, followed by 32 yam accessions (18%) in cluster 6, followed by 28 yam accessions (16%) in cluster 3, followed by 26 yam accessions (14%) in cluster 5, and a smaller cluster of 12 yam accessions (7%) in cluster 2. The distribution of landraces across these clusters did not correspond to yam species adequately. Genetic distances among landraces spanned from 0.006 to 0.378. Notably, two D. praehensilis accessions exhibited the lowest distance, suggesting potential synonymy. The characteristics of the cluster members showed that cluster 1 comprised landraces with a wide genetic distance range (0.006-0.304), characterized by high yield, moderate YMD severity, grainy texture, high dry matter, and rapid multiplication. Cluster 2 exhibited a narrower genetic distance range (0.008-0.04) with lower yield, reduced YMD, smooth texture, and vigorous plants. Cluster 3 showed a similar narrow genetic distance range (0.006-0.02) and was characterized by higher yield, slight oxidation, smooth texture, and reduced YMD. Cluster 4 had a broad genetic distance range (0.008-0.373) with low yield, high dry matter, and moderate disease severity. Cluster 5 was homogenous (0.007-0.030) with low yield, high dry matter, and no oxidation. Finally, Cluster 6 displayed a narrow genetic distance range (0.006-0.027), combining high yield, high dry matter, and smooth texture (Table 4).

Table 4. Agronomic performance of farmers’ landraces and genetic characteristics of clusters generated using SNP markers.
Analysis of molecular variance (AMOVA) revealed substantial genetic differentiation within the six clusters (53%), while among-cluster variation was relatively low (47%). Similarly, substantial genetic differentiation exists within the species (69%) than among-species variability (31%) (Table 5). Genetic differentiation (FST) among some species is high, indicating distinct genetic structures for some species while some species show high levels of shared alleles (Table 6).
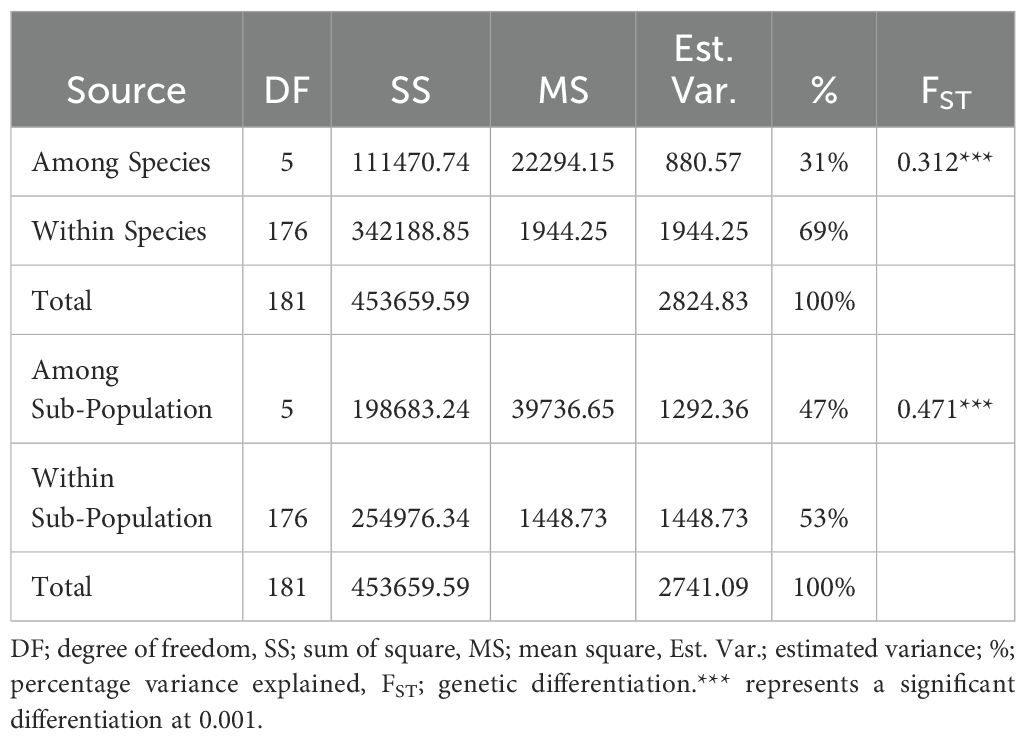
Table 5. Analysis of molecular variance (AMOVA) among and within yam accessions based on population structure and species collected from the Democratic Republic of Congo and Nigeria.
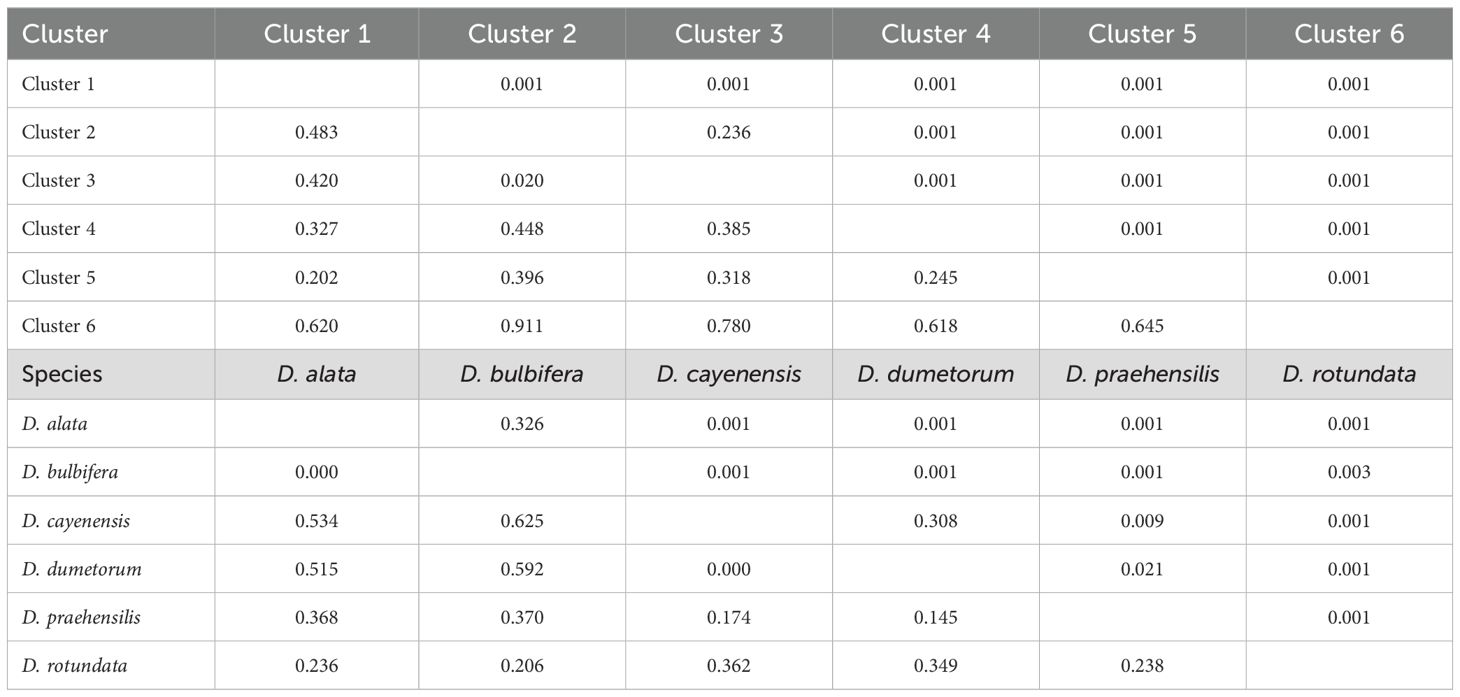
Table 6. Pairwise differentiation based on population structure and species of yam accessions in the Democratic Republic of Congo.
Genome-wide association results for key traits
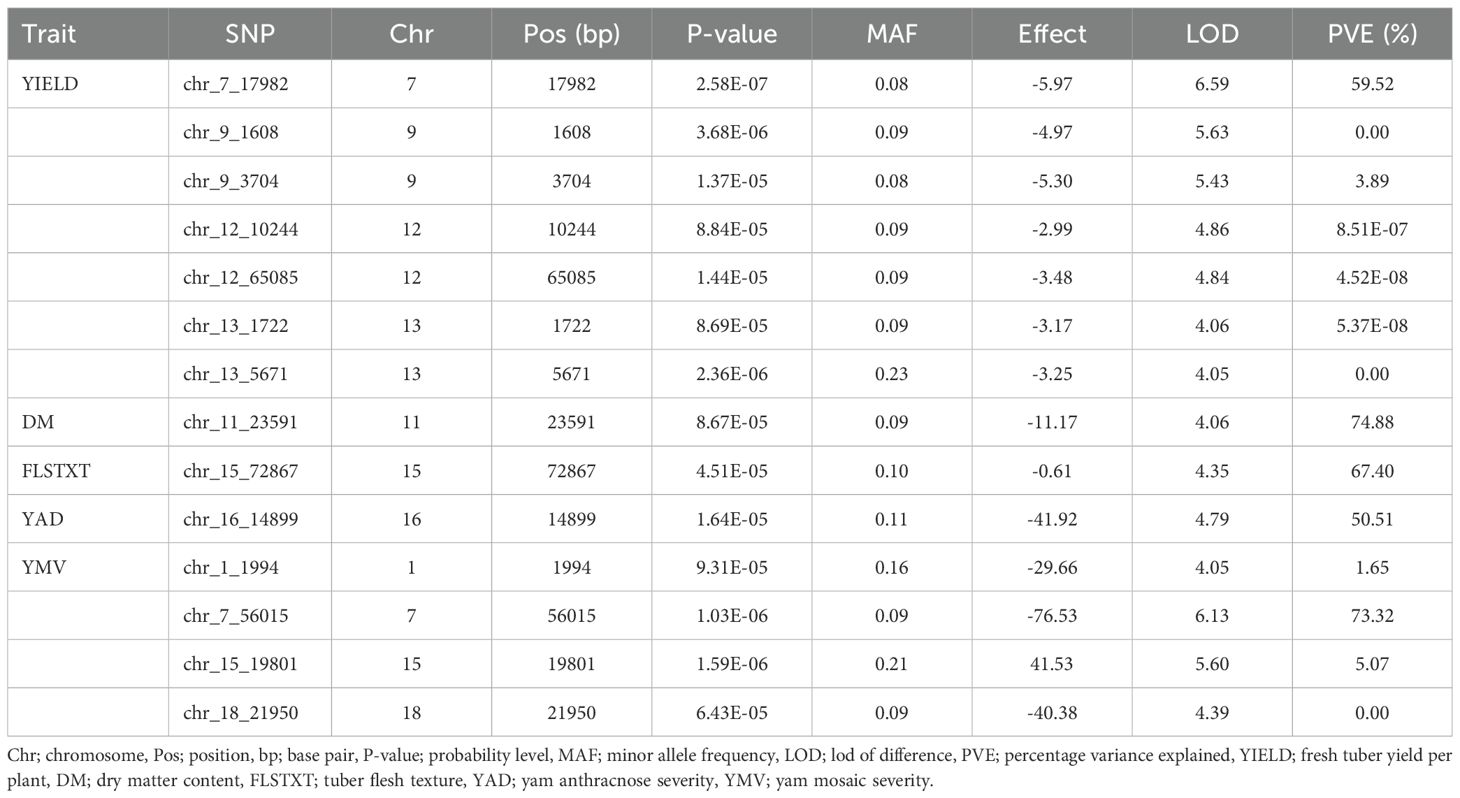
Association mapping analysis showed 14 SNP markers in significant association with five traits (tuber yield, tuber dry matter content, tuber flesh texture, yam anthracnose, and yam mosaic severity scores), out of the eight traits phenotyped for this study (Table 7 and Figure 4). Tuber fresh yield was linked to seven SNPs located on four distinct chromosomes, explaining over 60% of the phenotypic variance with LOD scores exceeding four. All the SNPs associated with this trait have negative marker effects. One SNP was associated with dry matter content on chromosome 11, with a negative marker effect, explaining a substantial portion of the phenotypic variance (74%). Similarly, a single SNP was linked to tuber flesh texture on chromosome 15, with a negative marker effect, explaining 67% of the phenotypic variance. For yam anthracnose severity, a single SNP on chromosome 16, accounting for 51% of the phenotypic variance with a negative marker effect was associated with this trait. Lastly, four SNPs located on four distinct chromosomes were associated with yam mosaic severity. Three of these SNPs on chromosomes 1, 7, and 18 have negative marker effects, and that on chromosome 15 has a positive marker effect. The markers explained over 80% of the phenotypic variance. Notably, chromosome 7 harbored SNPs associated with both yield and yam mosaic severity, and chromosome 15 harbored SNPs associated with both yam mosaic severity and tuber flesh texture (Table 7).
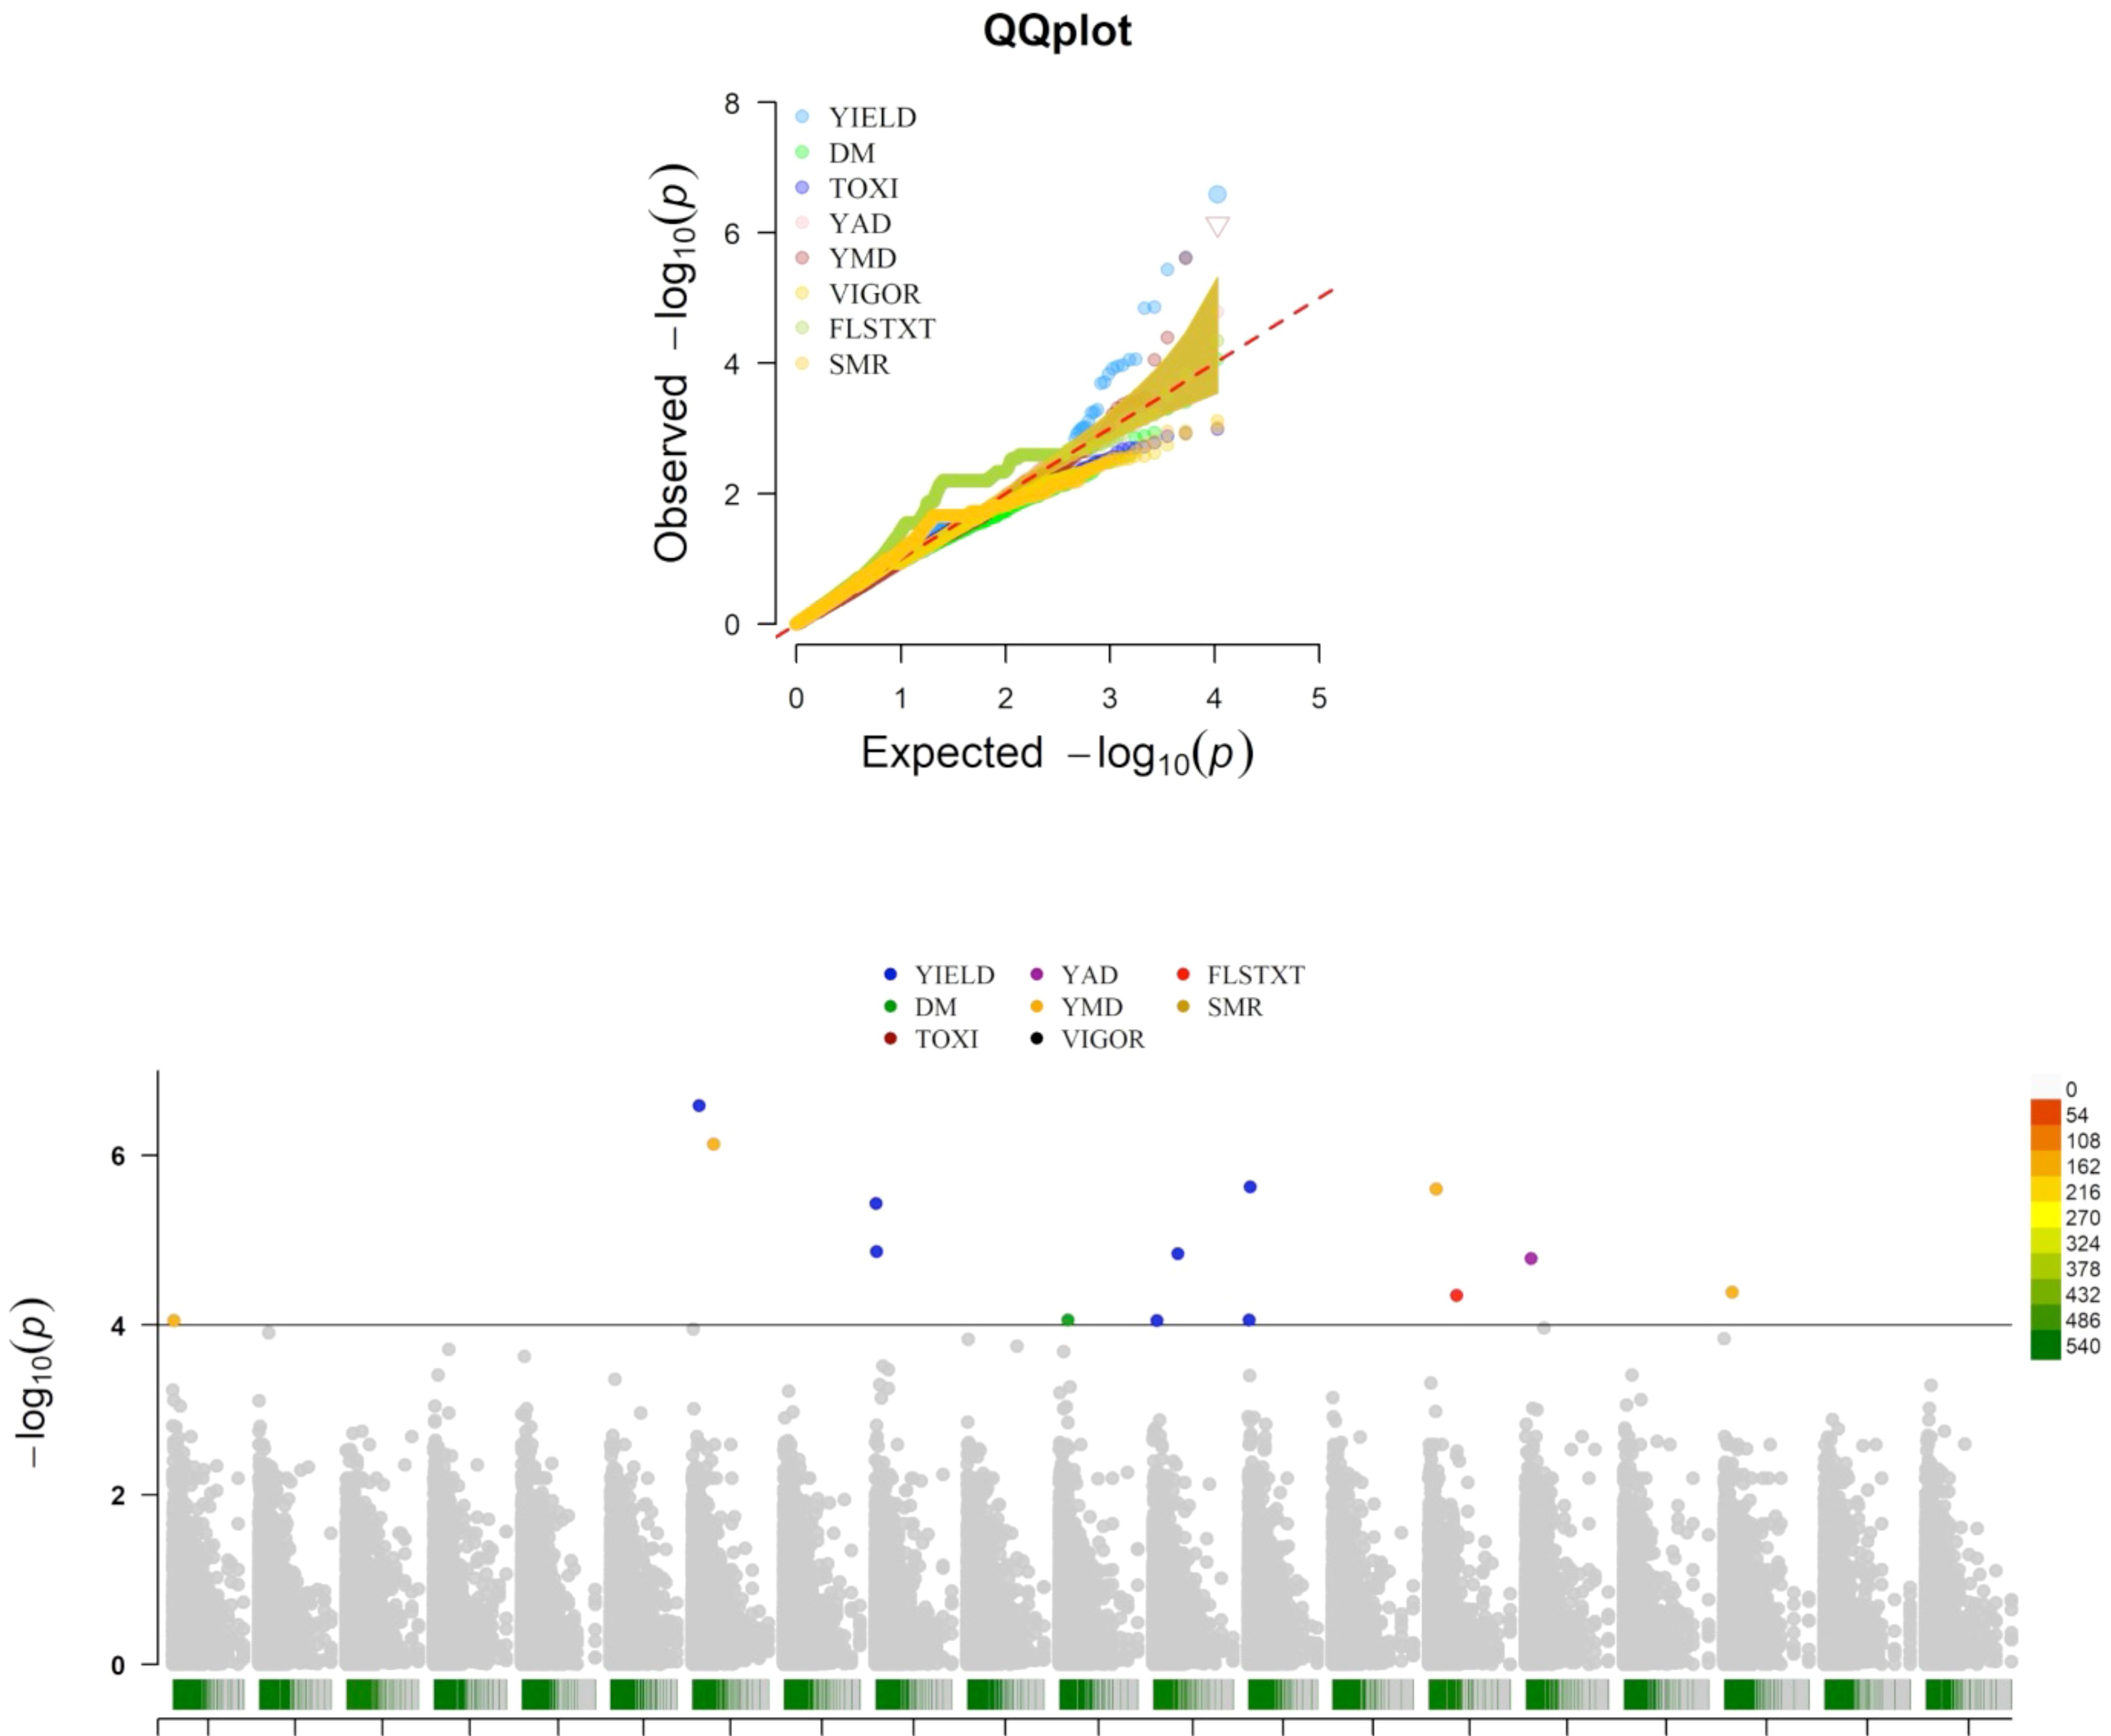
Figure 4. Manhattan and QQ plots displaying the genomic regions significantly associated with natural variation for five of the eight assessed traits targeted in this study using the K+Q model. YIELD, fresh tuber yield per plant; DM, dry matter (%); FLSTXT, tuber flesh texture (scale); YMD, yam mosaic virus severity (AUDPC value), YAD, yam anthracnose severity (AUDPC value).
Genetic merits and cross performance of the landraces
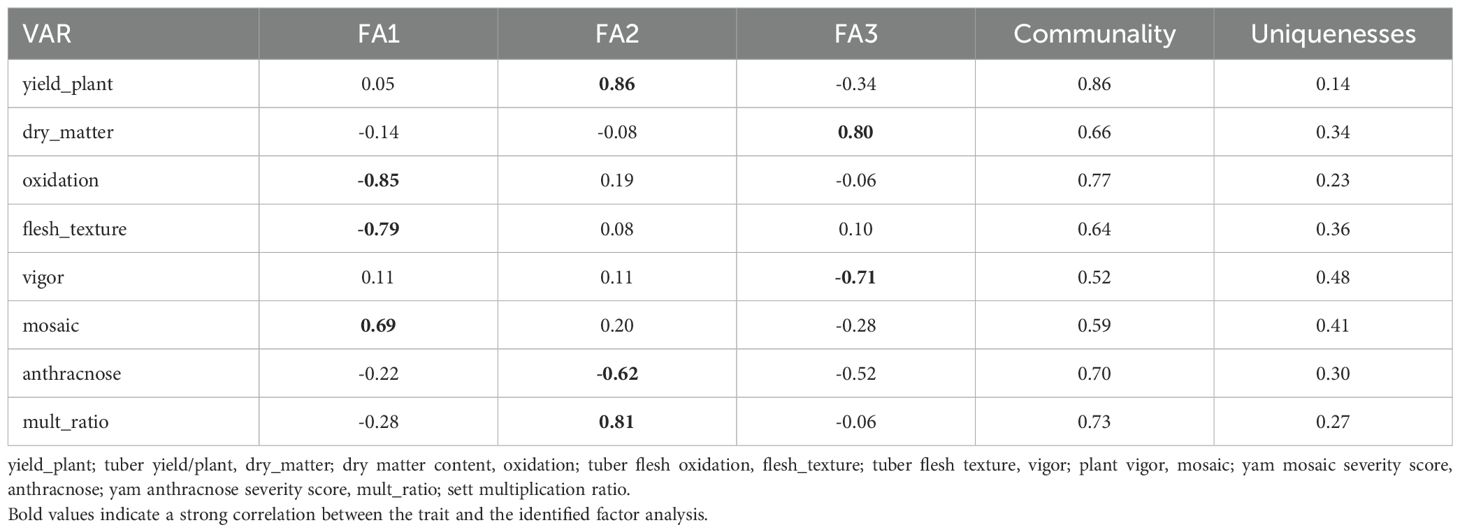
The exploratory factor analysis identified the first three factors (FA) (Eigenvalue >1) that explained 66.44% of the total variation among the eight traits as the most discriminative (Supplementary Table 5). After the varimax rotation, the comunalit (proportion of variance in a specific trait explained by the three FAs) ranged from 0.46 for tuber flesh oxidation to 0.87 for sett multiplication ratio. The eight traits were grouped into three based on their highest genetic correlations for the first three factors. The high genetic correlations for the FA1 were observed with tuber flesh oxidation, tuber flesh texture, and yam mosaic virus severity score. Those of FA2 were tuber fresh yield per plant, sett multiplication ratio, and anthracnose severity score while FA3 were tuber dry matter content and plant vigor (Table 8).
The analysis of the FAI-BLUP index ranged from 0.06 to 0.31 and from the 181 yam accessions, 27 yam accessions with FAI-BLUP index values greater than 0.15 were selected as top ranking for their high multi-trait performance (Supplementary Table 7 and Supplementary Figure 5). The predicted selection gain was in the desired direction for seven of the eight traits considered in this study. The strengths and weaknesses of the selected 27 yam accessions were presented in a radar plot that accounted for the proportion of each factor to the FAI-BLUP index of the yam accessions (Figure 5). The first factor (FA1) had strength for tuber flesh oxidation, texture, and mosaic severity score with communality and uniqueness varying from 0.59 to 0277 and 0.23 to 0.41, respectively. The FA1 has genotypes including TDr21_077, TDr21_092, TDr21_131, TDr21_134, TDr21_137, TDr21_139, TDr21_154, TDr21_162, TDr21_187, TDr21_163, TDr21_166, TDc21_172, TDc21_176, TDp21_159, TDr21_004, TDr21_017, and TDr21_039. The FA2 had strength for tuber fresh yield, anthracnose severity score, and sett multiplication ratio with communality and uniqueness ranging from 0.73 to 0.86 and 0.14 to 0.30, respectively. The FA2 has yam accessions including TDr21_053 and TDc21_070. The FA3 has strength for dry matter content and plant vigor with communality and uniqueness ranging from 0.52 to 0.66 and 0.34 to 0.48, respectively. The third FA has yam accessions including TDr21_099, TDc21_035, TDc21_138, TDp21_040, TDp21_063, TDp21_078, and TDp21_182.
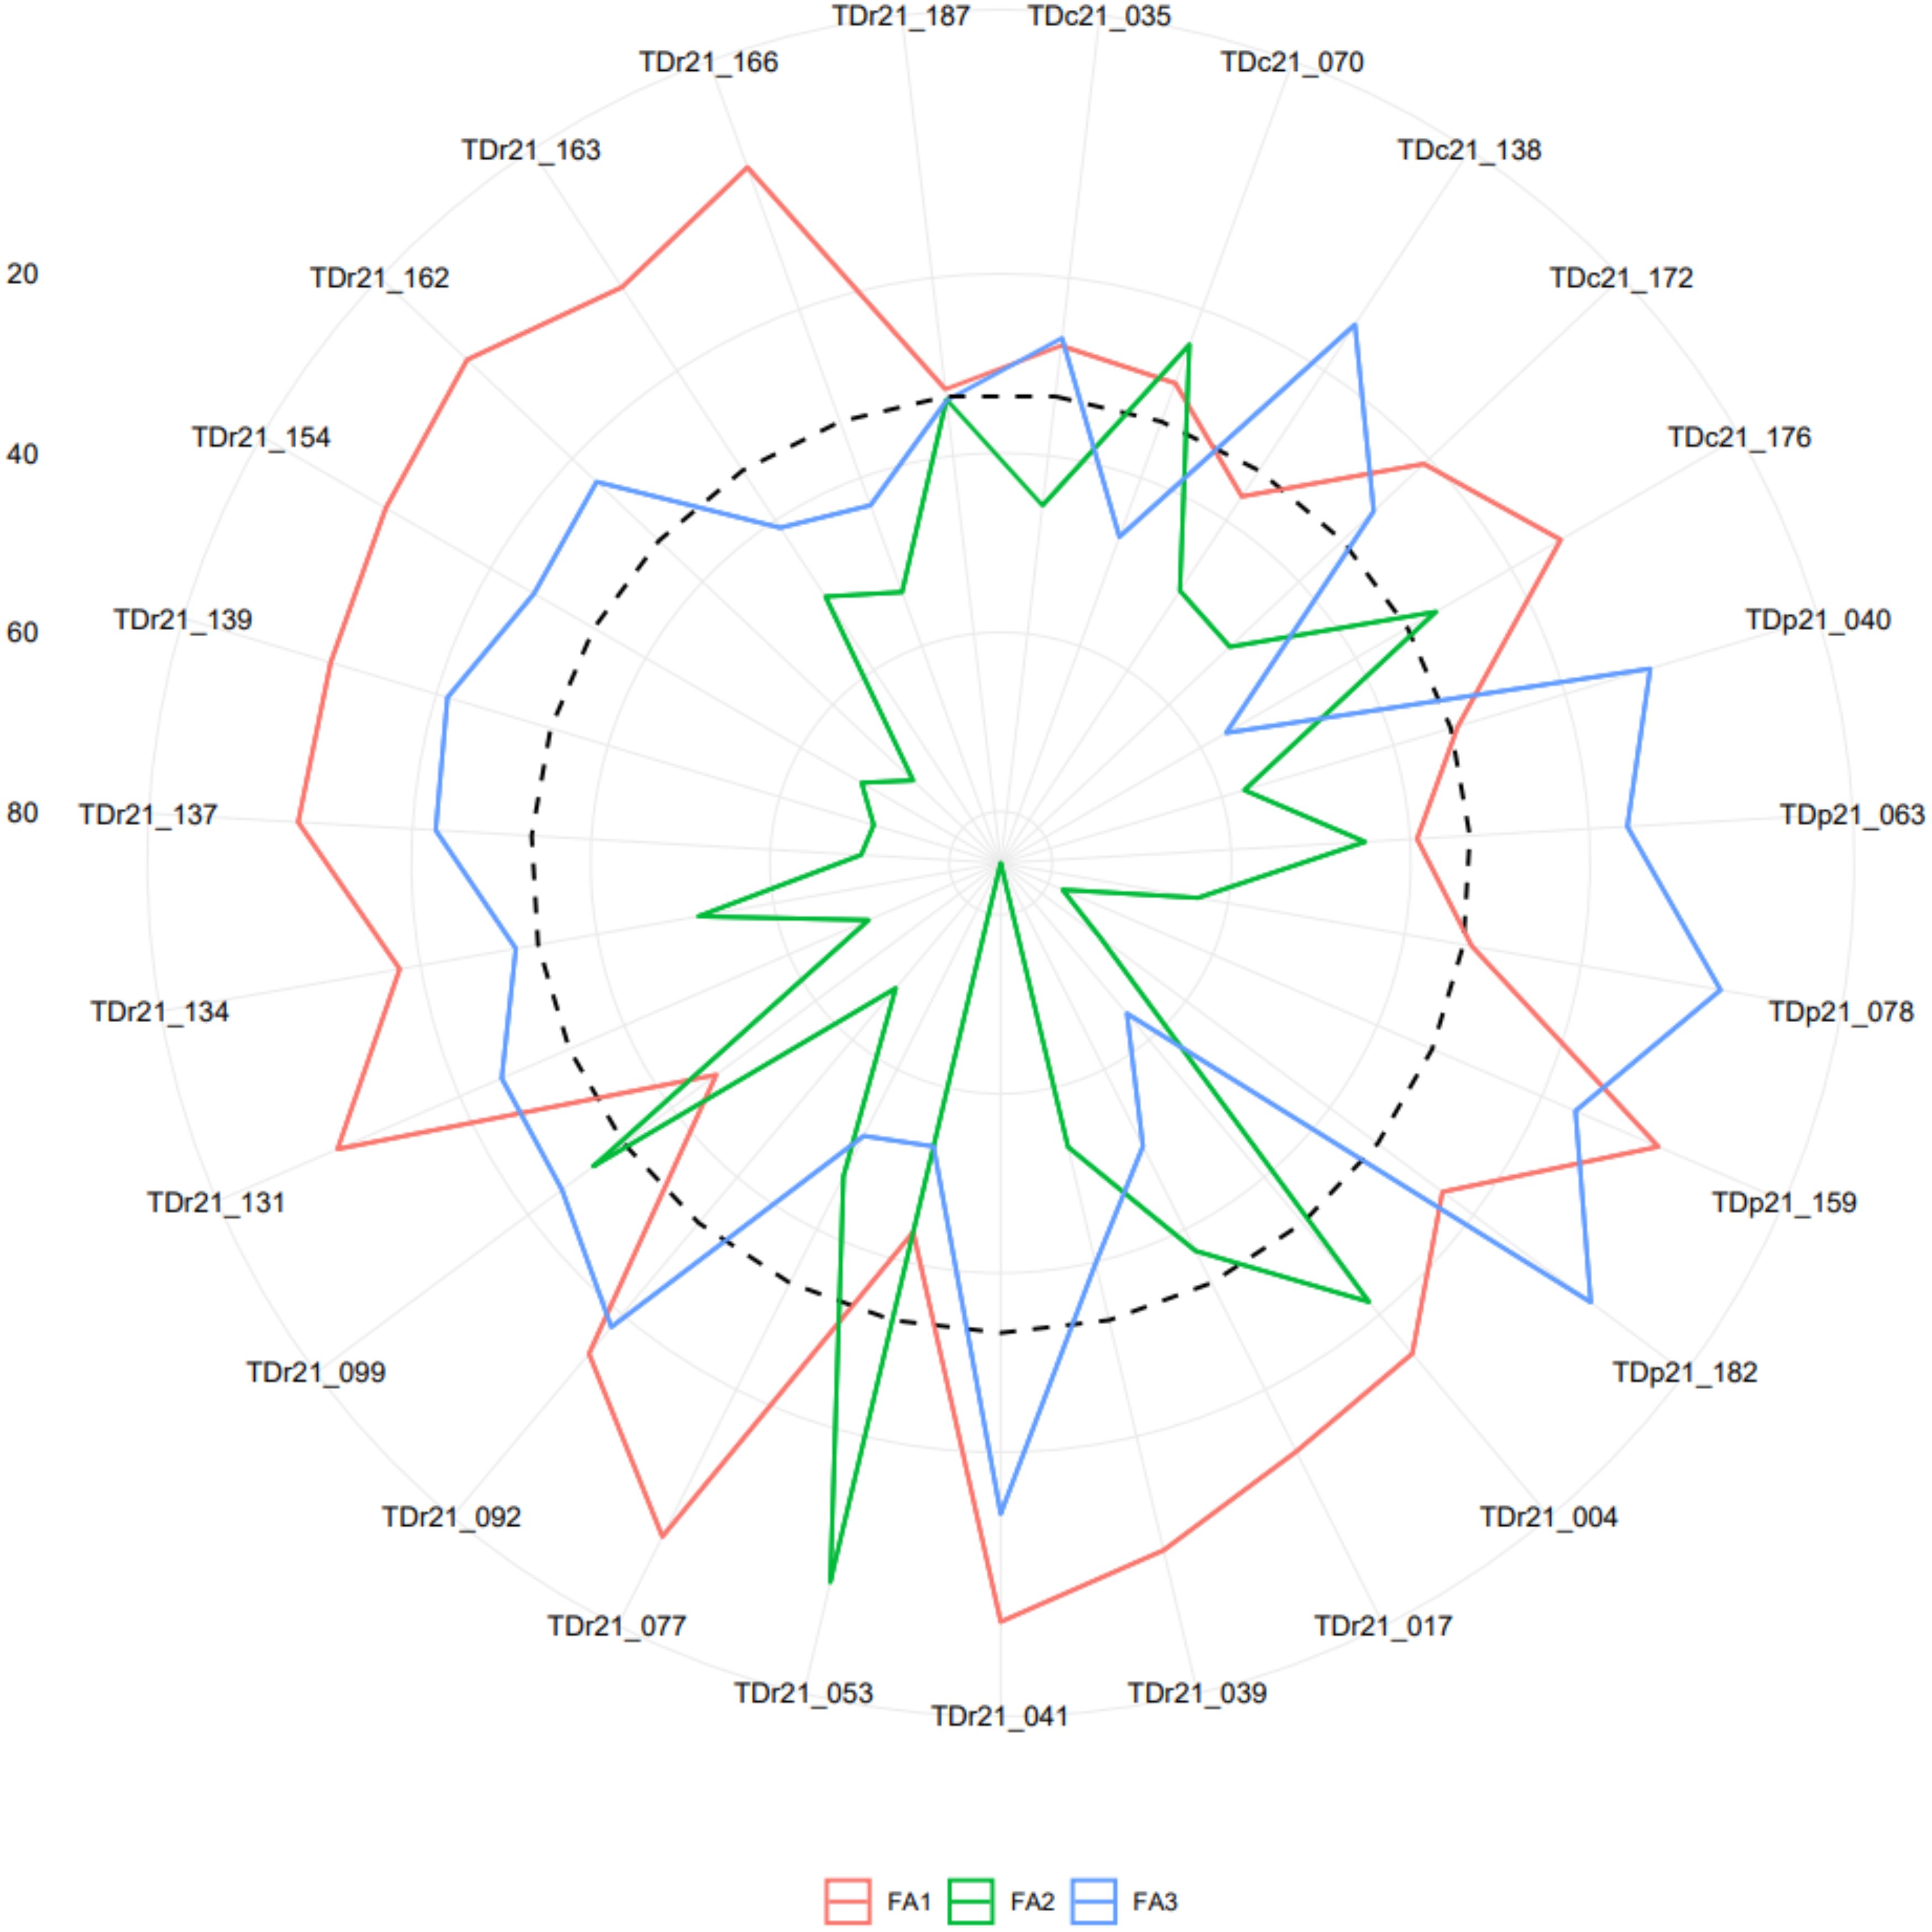
Figure 5. Radar chart displaying the strengths and weaknesses of selected yam accessions based on the multi-traits genotype-ideotype index. The dashed line shows the theoretical value if all three factors had contributed equally.
Analysis for the genomic prediction of cross-performance of the 17 yam accessions (12 males and 5 females) belonging to the D. rotundata species from the 27 yam accessions selected by the FAI-BLUP index resulted in 60 cross combinations with varying cross merit (-3.34 – 3.67). The lowest average cross merit was found in the male TDr21_039 (-1.83) and the highest was observed in the male TDr21_053 (2.73) (Table 9). Among the five females predicted for cross-performance, TDr21_041 had the highest average cross merit (1.43). The yam accession has high cross-compatibility with five different males indicated by > 2 and moderate compatibility with five males indicated by > 1 but cross-incompatible (<0) with two male accessions (TDr21_039 and TDr21_139). The female accessions TDr21_092, TDr21_099, and TDr21_134 had somewhat close average cross merits (0.8, 0.83, and 0.86, respectively). These female accessions were highly cross-compatible with four male accessions each (>2), moderately compatible with four male accessions each (>1), and showed cross-incompatibility with four different accessions (<0). The female accession TDr21_163 had the least number of cross-compatibility with only three male accessions showing cross merit of >2. This female showed cross incompatibility with three male accessions, which were lesser when compared to TDr21_092, TDr21_099, and TDr21_134, which recorded four male accessions individually (Table 9).
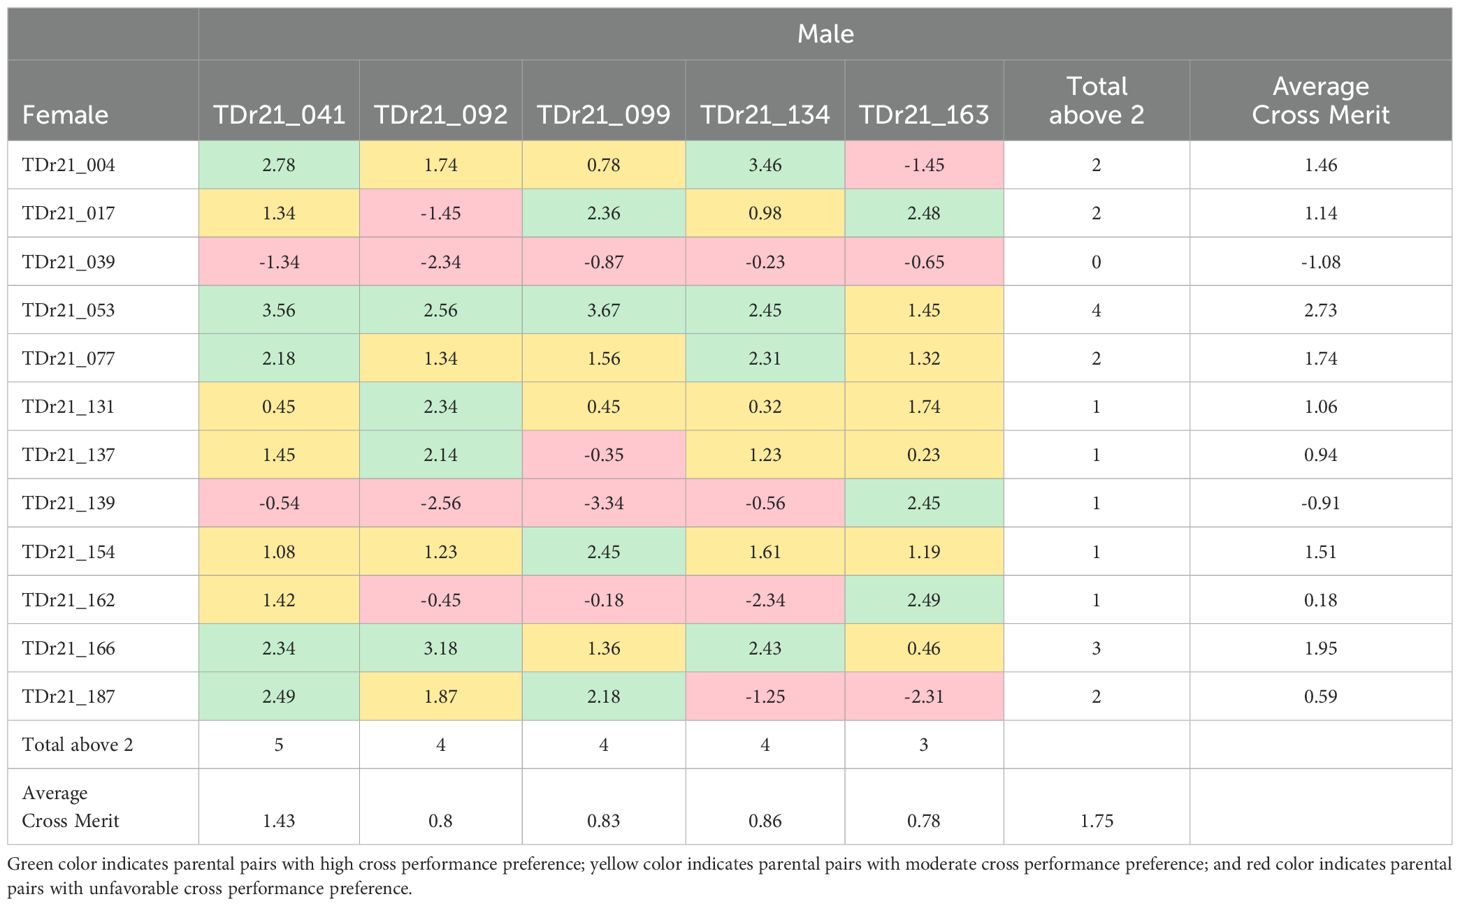
Table 9. Genomic prediction cross performance among the accessions of the Dioscorea rotundata among the top ranking 27 yam accessions for multi-trait performance based on FAI-BLUP index.
Discussion
We used DArT-SNP markers to assess the genetic diversity of yam accessions in the Democratic Republic of Congo (DRC). The 10,621 informative SNPs detected were unevenly distributed across the yam genome. Population structure and phylogenetic analyses revealed a non-random distribution of alleles and genotypes, classifying the 181 accessions into six distinct groups. The high genetic variability observed among these accessions suggests their potential for genetic improvement. The consistency between the results from population structure analysis and phylogenetic analysis indicates the effectiveness of both methods. Agre et al. (2021, 2023) also reported similar observations with the two methods. While the yam germplasm exhibits a low level of admixture (27%), a few accessions from D. cayenensis, D. dumetorum, and D. praehensilis likely represent the progeny of hybridization events. The admixed accessions belonging to the D. rotundata species suggest that its genome has not yet fully stabilized, as it is a hybrid of D. praehensilis and D. abyssinica.
The results of the AMOVA revealed higher genetic variation within the six clusters compared to the variation observed among clusters. In addition, higher genetic variation was observed within species than among species. Contrary to our findings, Agre et al. (2023) reported low molecular variability within groups and high between groups of D. rotundata accessions from Nigeria using SNP markers. In addition, Bakayoko et al. (2021) reported low molecular variability within groups and high between groups of D. alata accessions from Côte d’Ivoire using SNP markers. High levels of genetic variation among clusters of yam landraces in Nigeria indicated a lack of gene flow, possibly due to low seed-yam (mini or small whole tubers or portion of tubers used for propagation) exchange among farmers in geographically distant areas. In contrast, the low variation within the cluster revealed a low degree of genetic differentiation, which may be attributed to regional preferences for some dominant varieties (Bakayoko et al., 2021). As stated by Stuart et al. (2021), the exchange of tubers as a gift is a traditional and common practice among farmers of the same and or different communities.
Yam breeding programs usually strive to develop and deploy superior varieties, which combine traits preferred for production and consumption (Darkwa et al., 2020). In regions where the yam breeding or improvement program is well structured, breeding efforts have resulted in the development of superior yam varieties with improved tuber yield, resilience to pests and diseases, reduced oxidative browning, and better tuber quality attributes encompassing sensory characteristics mostly preferred by end-user (Agre et al., 2022; Darkwa et al., 2020). However, In DRC where the Yam improvement program is still in the infancy stage, and as such trait profiling becomes essential for identifying accessions that possess desired traits that could be used as parents for improvement (Adejumobi et al., 2023a). Through traits profiling, we have identified yam accessions with combinations of high tuber yield, dry matter content, vigor, multiplication ratio, low tuber flesh oxidation, smooth flesh texture, and resilience to mosaic and anthracnose severity in the Congolese farmers’ accessions. Even though our study has used accessions from six different species, we recognize the importance of D. rotundata as a more preferred species compared to other species in cultivation and consumption (Adejumobi et al., 2022a). The D. rotundata accessions with high crossing merit values (>2) from the genomic prediction and crop performance results identified in our study could be harnessed for trait introgression in the breeding programs to complement breeding clones and to broaden the genetic variation in breeding materials for increased genetic gain in DRC.
Moreover, the SNP markers associated with natural variation for the studied traits would be valuable resources to enhance genetic gain in yam breeding. With the mixed linear model employed, we identified 14 SNP markers in significant association with five traits (tuber yield, dry matter content, tuber flesh texture, mosaic, anthracnose disease severity) across the genomes of the six species studied. Several researchers have also reported QTLs on some of the chromosomes identified in our study (Adewumi et al., 2024). found QTLs associated with tuber yield on chromosomes 7, 9, 12, and 13 and mosaic severity on chromosome 7 in D. praehensilis. Agre et al. (2023) found QTLs associated with tuber yield on chromosome 9 and mosaic severity score on chromosomes 7 and 15 in D. rotundata. In addition to the QTLs identified for dry matter of chromosome 11 by our study, other researchers have also reported QTLs on chromosomes 7, 9, 14, and 15 (Adejumobi et al., 2023a; Agre et al., 2023; Gatarira et al., 2020). Among 14 genomic regions significantly associated with tuber yield, dry matter content, tuber flesh texture, mosaic, and anthracnose disease severity, we found chromosome 7 as the potential regions controlling tuber yield per plant and mosaic severity resistance and chromosome 15 controlling tuber flesh texture and mosaic severity resistance. Ma et al. (2022) reported that such a region should be investigated to reveal the potentiality of developing a single SNP marker for multiple trait prediction.
The QTLs identified in this study provided information on the chromosome regions controlling yam productivity and food quality, which can be useful genomic resource information for faster and more efficient breeding, especially in countries like DRC where yam improvement program is undergoing rapid transformation.
Conclusion
Population structure and hierarchical clustering methods classified the yam accessions from DRC into six distinct genetic groups, revealing higher variability within clusters than among clusters. A similar pattern of variability was observed among the species of yam. The wide genetic variability among the Congolese yam accessions suggests their potential as valuable sources of novel genes for yam breeding and variety development in the country. The promising accessions identified with good attributes and high crossing merit values could be exploited for genetic improvement in new and existing yam breeding programs in DRC. This will particularly focus on the introgression of genes controlling high tuber yield, dry matter content, smooth tuber flesh texture, resilience to yam anthracnose, and yam anthracnose resistance. This will translate into new, improved yam varieties with huge food security implications in DRC.
Data availability statement
The datasets presented in this study can be found in online repositories. The names of the repository/repositories and accession number(s) can be found in the article/Supplementary Material.
Author contributions
IA: Conceptualization, Data curation, Formal analysis, Funding acquisition, Methodology, Writing – original draft, Writing – review & editing. AA: Writing – original draft, Writing – review & editing. FO: Writing – review & editing. EO: Writing – review & editing. JA: Supervision, Writing – review & editing. DO: Supervision, Writing – review & editing. SK: Writing – review & editing. OA: Writing – review & editing. HM: Writing – review & editing. PA: Conceptualization, Data curation, Formal analysis, Funding acquisition, Investigation, Methodology, Resources, Software, Supervision, Validation, Visualization, Writing – original draft, Writing – review & editing.
Funding
The author(s) declare that financial support was received for the research, authorship, and/or publication of this article. The African trans-regional cooperation through Mobilité Université en Afrique (MOUNAF) project funded by the European Union Commission within the framework of “Intra Africa Mobility Scheme”. This study is also partially supported by the BMGF through covering of the publication fees.
Acknowledgments
Authors acknowledge the MOUNAF project for providing part funding for the research through the University of Kisangani. The International Foundation of Science (IFS) for Co-funding the research to make it a whole, and the BMGF for covering the publication fee.
Conflict of interest
The authors declare that the research was conducted in the absence of any commercial or financial relationships that could be construed as a potential conflict of interest.
Generative AI statement
The author(s) declare that no Generative AI was used in the creation of this manuscript.
Publisher’s note
All claims expressed in this article are solely those of the authors and do not necessarily represent those of their affiliated organizations, or those of the publisher, the editors and the reviewers. Any product that may be evaluated in this article, or claim that may be made by its manufacturer, is not guaranteed or endorsed by the publisher.
Supplementary material
The Supplementary Material for this article can be found online at: https://www.frontiersin.org/articles/10.3389/fhort.2024.1510083/full#supplementary-material
References
Adejumobi I. I., Agre P. A., Adewumi A. S., Shonde T. E., Cipriano I. M., Komoy J. L., et al. (2023a). Association mapping in multiple yam species (Dioscorea spp.) of quantitative trait loci for yield-related traits. BMC Plant Biol. (London, United Kingdom: BioMed Central) 23. doi: 10.1186/s12870-023-04350-4
Adejumobi I. I., Agre P. A., Adeyinka A. S., Cipriano I. M., Adheka J. G., Onautshu D. O. (2023b). “Status of yam (Dioscorea spp.) in the Democratic Republic of Congo,” in Plant breeding (Hoboken, New Jersey, USA: Wiley), 142, 563–572. doi: 10.1111/pbr.13123
Adejumobi I., Agre A. P., Onautshu O. D., Adheka G. J., Cipriano M. I., Jean-Claude L., et al. (2022a). Assessment of yam landraces (Dioscorea spp.) of DR Congo for reaction to pathological diseases, yield potential and tuber quality characteristics. Agronomy 12, 1–20. doi: 10.3390/agriculture12050599
Adejumobi I., Agre P. A., Onautshu D. O., Adheka J. G., Mokonzi G. B., Jean-Claude L. M., et al. (2022b). Diversity, trait preferences, management and utilization of yams landraces (Dioscorea species): an orphan crop in DR Congo. Sci. Rep. 12, 1–16. doi: 10.1038/s41598-022-06265-w
Adewumi A. S., Adejumobi I. I., Opoku V. A., Asare P., Michael A. O., Kingsley J. T., et al. (2024). Exploring Quantitative Trait Nucleotides (QTNs) Associated with Response to Yam Mosaic Virus Severity and Tuber Yield Traits in Dioscorea praehensilis Benth. Germplasm via Genome-Wide Association Scanning. Front. Horticulture 3, 1459476. doi: 10.3389/fhort.2024.1459476
Adewumi A. S., Taah K. J., Asare P. A., Adu M. O., Agre P. A. (2020). A(Mssessment of Genetic Diversity of Dioscorea praehensilis (Berth.) Collected from Central Region, Ghana using Simple Sequence Repeat (SSR) Markers. J. Agric. Curr. Res. 1, 1005.
Agre P., Asibe F., Darkwa K., Edemodu A., Bauchet G., Asiedu R., et al. (2019). Phenotypic and molecular assessment of genetic structure and diversity in a panel of winged yam (Dioscorea alata) clones and cultivars. Sci. Rep. 9, 1–11. doi: 10.1038/s41598-019-54761-3
Agre P., Dassou A. G., Loko L. E. Y., Idossou R., Dadonougbo E., Gbaguidi A., et al. (2021a). Diversity of white Guinea yam (Dioscorea rotundata Poir.) cultivars from Benin as revealed by agro-morphological traits and SNP markers. Plant Genet. Resources: Characterization Utilization (Cambridge, England: Cambridge University Press) 19, 437–446. doi: 10.1017/s1479262121000526
Agre P. A., Edemodu A., Obidiegwu J. E., Adebola P., Asiedu R., Asfaw A. (2023). Variability and genetic merits of white Guinea yam landraces in Nigeria. Front. Plant Sci. 14. doi: 10.3389/fpls.2023.1051840
Agre P. A., Mondo J. M., Edemodu A., Matsumoto R., Kolade O., Kumar L. P., et al. (2022). Biotechnology approaches in breeding for biotic stress resistance in yam (Dioscorea spp.),” in Genomic designing for biotic stress resistant technical crops. (New York City: Springer Nature Publishing). doi: 10.1007/978-3-031-09293-0_11
Agre P., Norman P. E., Asiedu R., Asfaw A. (2021b). Identification of quantitative trait nucleotides and candidate genes for tuber yield and mosaic virus tolerance in an elite population of white Guinea yam (Dioscorea rotundata) using genome-wide association scan (London, United Kingdom: BioMed Central). doi: 10.21203/rs.3.rs-612999/v1
Asfaw A. (2016). Standard operating protocol for yam variety performance evaluation trial (Ibadan, Nigeria: IITA).
Asiedu R., Sartie A. (2010). Crops that feed the world 1. Yams. Food Secur. 2, 305–315. doi: 10.1007/s12571-010-0085-0
Bakayoko L., Markers S. N. P., Traits A., Bakayoko L., Da N., Kouassi A. B., et al. (2021). Diversity of Water Yam (Dioscorea alata L.) Accessions from. Plants 10, 1–18. doi: 10.3390/plants10122562
Bassey E. E. (2017). Constraints and prospects of yam production in Nigeria. Eur. J. Phys. Agric. Sci. 5, 55–64.
Bates D., Mächler M., Bolker B. M., Walker S. C. (2015). Fitting linear mixed-effects models using lme4. J. Stat. Software 82, 1–26. doi: 10.18637/jss.v067.i01
Bhattacharjee R., Lopez-Montes A., Abberton M., Asiedu R. (2013). “Application of advanced genomic technologies to accelerate yam breeding,” in Yams 2013: first global conference on yam (Ibadan, Nigeria: IITA).
Bradbury P. J., Zhang Z., Kroon D. E., Casstevens T. M., Ramdoss Y., Buckler E. S. (2007). TASSEL: Software for association mapping of complex traits in diverse samples. Bioinformatics 23 (19). doi: 10.1093/bioinformatics/btm308
Browning B. L., Browning S. R. (2013). Improving the accuracy and efficiency of identity-by-descent detection in population data. Genetics 194, 459–471. doi: 10.1534/genetics.113.150029
Bukatuka F., Ngombe K., Mutwale K., Moni B., Makengo K., Pambu L., et al. (2016). Bioactivity and nutritional values of some dioscorea species traditionally used as medicinal foods in bandundu, DR congo. Eur. J. Medicinal Plants 14, 1–11. doi: 10.9734/ejmp/2016/25124
Butler D. G., Cullis B. R., Gilmour A. R., Gogel B. J., Thompson R. (2017). ASReml-R reference manual version 4. ASReml-R Reference Manual., 1–187.
Danecek P., Auton A., Abecasis G., Albers C. A., Banks E., DePristo M. A., et al. (2011). The variant call format and VCFtools. Bioinformatics 27, 2156–2158. doi: 10.1093/bioinformatics/btr330
Darkwa K., Olasanmi B., Asiedu R., Asfaw A. (2020). Review of empirical and emerging breeding methods and tools for yam (Dioscorea spp.) improvement: Status and prospects. Plant Breed. J. 139, 474–497. doi: 10.1111/pbr.12783
Egesi C. N., Odu B. O., Ogunyemi S., Asiedu R., Hughes J. (2007). Evaluation of water yam (Dioscorea alata L.) germplasm for reaction to yam anthracnose and virus diseases and their effect on yield. J. Phytopathol. 155, 536–543. doi: 10.1111/j.1439-0434.2007.01273.x
Falconer D. S., Mackay T. F. C. (1996). Introduction to quantitative genetics. 4th Edition (London, England: Longman Group Ltd). Available at: http://www.amazon.com/Introduction-Quantitative-Genetics-Douglas-Falconer/dp/0582243025 (Accessed September 9, 2024).
FAOSTAT. (2022). FAO Food and Agriculture Organization of the United Nations Statistics database. Available online at: http://www.fao.org/faostat/en/data/QC (Accessed on July 15, 2024).
Gatarira C., Agre P., Matsumoto R., Edemodu A., Adetimirin V., Bhattacharjee R., et al. (2020). Genome-wide association analysis for tuber dry matter and oxidative browning in water Yam (Dioscorea alata L.). Plants 9, 1–19. doi: 10.3390/plants9080969
Jeancy N. L., Paul M., Alasca E. L., Yves-dady B. (2021). Yam production on the sandy soil of Bateke Plateau (DR Congo). J. Appl. Biosci. 17, 16886–16896. doi: 10.35759/JABs.163.7
Jombart T. (2008). Adegenet: A R package for the multivariate analysis of genetic markers. Bioinformatics 24, 1403–1405. doi: 10.1093/bioinformatics/btn129
Kilian A., Sanewski G., Ko L. (2016). The application of DArTseq technology to pineapple. Acta Hortic. 1111, 181–188. doi: 10.17660/ActaHortic.2016.1111.27
Lipka A. E., Tian F., Wang Q., Peiffer J., Li M., Bradbury P. J., et al. (2012). GAPIT: Genome association and prediction integrated tool. Bioinformatics 28, 2397–2399. doi: 10.1093/bioinformatics/bts444
Loko Y. L., Bhattacharjee R., Agre A. P., Dossou-Aminon I., Orobiyi A., Djedatin G. L., et al. (2017). Genetic diversity and relationship of Guinea yam (Dioscorea cayenensis Lam.–D. rotundata Poir. complex) germplasm in Benin (West Africa) using microsatellite markers. Genet. Resour. Crop Evol. 64,1205–1219. doi: 10.1007/s10722-016-0430-z
Ma C., Pei Z. Q., Bai X., Lu S. H., Su M., Kang X., et al. (2022). Exogenous Melatonin and CaCl2 Alleviate cold-induced oxidative stress and photosynthetic inhibition in cucumber seedlings. J. Plant Growth Regul. 42 (6), pp.3441–3458. doi: 10.1007/s00344-022-10805-z
Magwé-Tindo J., Wieringa J. J., Sonké B., Zapfack L., Vigouroux Y., Couvreur T. L. P., et al. (2018). Guinea yam (Dioscorea spp., dioscoreaceae) wild relatives identified using whole plastome phylogenetic analyses. Taxon 67, 905–915. doi: 10.12705/675.4
Mignouna H. D., Abang M. M., Onasanya A., Agindotan B., Asiedu R. (2002). Identification and potential use of RAPD markers linked to Yam mosaic virus resistance in white yam (Dioscorea rotundata). Ann. Appl. Biol. 140, 163–169. doi: 10.1111/j.1744-7348.2002.tb00169.x
Mulualem T., Mekbib F., Shimelis H., Gebre E., Amelework B. (2018). Genetic diversity of yam (Dioscorea spp.) landrace collections from Ethiopia using simple sequence repeat markers. Aust. J. Crop Sci. 12, 1222–1230. doi: 10.21475/ajcs.18.12.08.PNE885
Olivoto T., Nardino M. (2021). MGIDI: Toward an effective multivariate selection in biological experiments. Bioinformatics 37, 1383–1389. doi: 10.1093/bioinformatics/btaa981
Onyilagha J. C., Lowe J. (1986). Studies on the relationship of dioscorea cayenensis and dioscorea rotundata cultivars. Euphytica 35, 733–739. doi: 10.1007/BF00028581
Pachakkil B., Yamanaka S., Girma G., Matsumoto R., Tamiru-Oli M., Bhattacharjee R., et al. (2021). Simple sequence repeat-based mini-core collection for white Guinea yam (Dioscorea rotundata) germplasm. Crop Sci. 61, 1268–1279. doi: 10.1002/csc2.20431
Paradis E., Schliep K. (2019). Ape 5.0: An environment for modern phylogenetics and evolutionary analyses in R. Bioinformatics 35, 526–528. doi: 10.1093/bioinformatics/bty633
Purcell S., Neale B., Todd-Brown K., Thomas L., Ferreira M. A. R., Bender D., et al. (2007). PLINK: A tool set for whole-genome association and population-based linkage analyses. Am. J. Hum. Genet. 81, 559–575. doi: 10.1086/519795
R Core Team. (2017). “A language and environment for statistical computing,” in R foundation for statistical computing (Vienna, Austria: R Foundation).
Revelle W. (2015). Package “psych” - procedures for psychological, psychometric and personality research. R package (Comprehensive R Archive Network (CRAN)).
Rocha J. R., do A. S., de C., MaChado J. C., Carneiro P. C. S. (2018). Multitrait index based on factor analysis and ideotype-design: proposal and application on elephant grass breeding for bioenergy. GCB Bioenergy 10, 52–60. doi: 10.1111/gcbb.12443
Saski C. A., Bhattacharjee R., Scheffler B. E., Asiedu R. (2015). Genomic resources for water yam (Dioscorea alata L.): Analyses of estsequences, de novo sequencing and GBS libraries. PloS One 10, e0134031. doi: 10.1371/journal.pone.0134031
Scarcelli N., Cubry P., Akakpo R., Thuillet A. C., Obidiegwu J., Baco M. N., et al. (2019). Yam genomics supports West Africa as a major cradle of crop domestication. Sci. Adv. 5, 1–8. doi: 10.1126/sciadv.aaw1947
Schulman A. H. (2007). Molecular markers to assess genetic diversity. Euphytica 158, 313–321. doi: 10.1007/s10681-006-9282-5
Stuart E., Asfaw A., Adebola P., Maroya N., Edemodu A., Adeosun T., et al. (2021). Yam seed system characteristics in Nigeria: Local practices, preferences, and the implications for seed system interventions. Outlook Agric. 50, 455–467. doi: 10.1177/00307270211058209
Sugihara Y., Darkwa K., Yaegashi H., Natsume S., Shimizu M., Abe A., et al. (2020). Genome analyses reveal the hybrid origin of the staple crop white Guinea yam (Dioscorea rotundata). Proc. Natl. Acad. Sci. U. S. A. 117, 31987–31992. doi: 10.1073/pnas.2015830117
Tamiru M., Natsume S., Takagi H., White B., Yaegashi H., Shimizu M., et al. (2017). Genome sequencing of the staple food crop white Guinea yam enables the development of a molecular marker for sex determination. BMC Biol. 15, 1–20. doi: 10.1186/s12915-017-0419-x
Terauchi R., Terachi T., Tsunewaki K. (1991). Intraspecific variation of chloroplast DNA in Dioscorea bulbifera L. Theor. Appl. Genet. 81, 461–470. doi: 10.1007/BF00219435
Ude G. N., Igwe D. O., McCormick J., Ozokonkwo-Alor O., Harper J., Ballah D., et al. (2019). Genetic diversity and DNA barcoding of yam accessions from southern Nigeria. Am. J. Plant Sci. 10, 179–207. doi: 10.4236/ajps.2019.101015
Yin L. (2022). CMplot: Circle Manhattan plot. Available online at: https://github.com/YinLiLin/CMplot (Accessed on August 26, 2024).
Keywords: breeding value, cultivar development, SNP markers, trait profiling, Dioscorea spp.
Citation: Adejumobi I, Adewumi AS, Ouattara F, Olatunde E, Adheka J, Onautshu D, Kayondo SI, Alaba O, Mushoriwa H and Agre PA (2024) Exploring the genetic resources of yam in the Democratic Republic of Congo: implications for breeding. Front. Hortic. 3:1510083. doi: 10.3389/fhort.2024.1510083
Received: 12 October 2024; Accepted: 05 December 2024;
Published: 20 December 2024.
Edited by:
Nicola Busatto, Fondazione Edmund Mach, ItalyReviewed by:
Takuya Morimoto, Kyoto Prefectural University, JapanJorge Franco, International Maize and Wheat Improvement Center, Mexico
Copyright © 2024 Adejumobi, Adewumi, Ouattara, Olatunde, Adheka, Onautshu, Kayondo, Alaba, Mushoriwa and Agre. This is an open-access article distributed under the terms of the Creative Commons Attribution License (CC BY). The use, distribution or reproduction in other forums is permitted, provided the original author(s) and the copyright owner(s) are credited and that the original publication in this journal is cited, in accordance with accepted academic practice. No use, distribution or reproduction is permitted which does not comply with these terms.
*Correspondence: Paterne Angelot Agre, cC5hZ3JlQGNnaWFyLm9yZw==; Idris Adejumobi, aS5hZGVqdW1vYmlAY2dpYXIub3Jn
 Idris Adejumobi
 Adeyinka Saburi Adewumi
 Fatim Ouattara1
 Siraj Ismail Kayondo
 Oluwafemi Alaba
 Paterne Angelot Agre