
94% of researchers rate our articles as excellent or good
Learn more about the work of our research integrity team to safeguard the quality of each article we publish.
Find out more
ORIGINAL RESEARCH article
Front. Hortic., 22 November 2023
Sec. Breeding and Genetics
Volume 2 - 2023 | https://doi.org/10.3389/fhort.2023.1289646
 Eric Bertrand Kouam1*
 Joseph Djeugap-Fovo2*
 Solange Meka-Sindje2,3Nadia Mokia Mbinkar Afsah2Arielle Meyia2,4Blaise Franky Babagnack2Niky K. J. Nouteka2
 Joseph Hubert Galani-Yamdeu5
For successful plant breeding in any crop species, the importance of diversity in the available germplasm population is known and established. Thirty-two common bean (Phaseolus vulgaris) genotypes from the IRAD gene bank in Cameroon were evaluated for divergence in terms of their morpho-agronomic traits, fungal disease resistance, and bacterial disease resistance to assess the opportunity for genetic improvement of the crop. The trait associations were estimated using correlation coefficients and genotypes were classified into groups using cluster and principal component analyses. Seven qualitative and 16 quantitative traits comprising growth, phenological, yield, and disease variables were evaluated in this study. The qualitative markers revealed the degree of polymorphism among the 32 common bean genotypes. The number of phenotypic classes per character (Na) ranged from 2 to 18, with an average of 5.14. The expected gene diversity (He) ranged from 0.37 to 0.93 (mean = 0.56). The number of effective phenotypic classes (Ne) ranged from 1.82 to 14.22, with a mean of 3.85. An extensive range of variation was evident for the majority of traits, highlighting their utility for characterizing common bean germplasm. Many qualitative traits, including seed coat color, seed shape, and seed size, and also some quantitative traits of economic importance including seed yield, were found to be highly variable within the collection, with the MAC55 genotype displaying the highest yield (32.65 g per plant). Four genotypes, namely MAC55, BOA-5-1M6, FEB 192, and Banguem showed resistance to the two main common bean diseases, angular leaf spot and common blight. We detected highly significant correlations among several traits related to yield. A high broad-sense heritability was found for most of the quantitative traits. We carried out two-dimensional principal component analysis and used hierarchical clustering to group the analyzed germplasm according to their phenotypic similitudes. The evidence of agro-morphological diversity in the present collection and the identification of discriminant characters between the available germplasm through the use of PCA analysis have significant implications for establishing breeding schemes in common bean.
Common bean (Phaseolus vulgaris L.) is an important component of the production systems in tropical regions. P. vulgaris is a true diploid plant species (2n = 22) that is predominantly self-pollinating and comprises both cultivated and wild forms, which easily hybridize (Singh et al., 1991). Cross-pollination, although occasional, is assured by way of pollinators such as the bumblebee (Wells et al., 1988). Numerous genetic maps have been developed and are available for common bean according to Gepts et al. (2008). This plant has a genome size that is estimated to be between 588 and 637 megabase pairs (Arumuganthan and Earle, 1991; Bennett and Leitch, 1995). The literature indicates that the Mesoamerican and Andean gene pools have a common wild ancestor, P. vulgaris, which went through two distinct domestication events that resulted in their development (Gepts et al., 1986; Schmutz et al., 2014). Mesoamerican cultivars have small seeds, with a 100-seed weight of less than 25 g, whereas Andean varieties have medium-sized seeds, with a 100-seed weight of 25 g–40 g, and in larger seeds, the 100-seed weight exceeds 40 g (Singh et al., 1991).
Common bean is a dietary legume for more than 300 million people, especially those in developing countries (Ngueguim et al., 2011). Its total production exceeds 23 million tons, seven million of which is produced in Latin America and Africa, with an average per capita consumption that varies across countries and regions. It is estimated to be 12 kg–18 kg/year in Latin American countries (Beebe et al., 2013) and 60 kg/year in western Kenya and Rwanda (Uebersax et al., 2023). This legume has a short growth cycle of approximately 65 days–110 days and is mostly cultivated through subsistent practice, mainly by women (Katungi et al., 2009; Siri et al., 2020). P. vulgaris displays a wide range of variation in its growth habits and exhibits many disparities in seed and pod shape, pigmentation, size, and color, reflecting the evolution of this plant in various environments (Leakey, 1988; Singh, 1989). Bean production provides both income and food for millions of people in tropical Africa (Nasar et al., 2023). In Cameroon, the most production and marketing of common beans occurs in the western highland region, where more than 90% of the national production occurs. It is mostly cultivated by small-scale farmers for food and as a source of income. The common bean production in this region is done in two seasons yearly: the first planting season is from March to June, and the second is between August and December (Siri et al., 2017; Sanyang et al., 2019). Common bean farmers in this region and all across tropical Africa suffer low yields due to a large number of fungal and bacterial diseases, including angular leaf spot, caused by Phaeoisariopsis griseola (Aggarwal et al., 2004); floury leaf spot, caused by Mycovellosiella phaseoli (Sharma et al., 1996); bean rust, induced by Uromyces appendiculatus (Mershaab and Haub, 2008); and common bacterial blight, caused by Xanthomonas citri and Xanthomonas phaseoli (Chen et al., 2021). These major common bean diseases have been reported in Cameroon (Sanyang et al., 2019; Akwa et al., 2020; Eke et al., 2020). These diseases can cause yield loss of 80%–100%, especially when damage happens during the early seedling and pod formation stages. The farmers in the western region control the disease on beans by using chemical fungicides, which improve their production. This appears to be more costly, however, and poses a lot of problems as far as human health and the environment are concerned. Pathogens also become more resistant to these chemicals with time. The best and cheapest approach would be the use of resistant varieties, as has been proposed in many studies on crops such as maize (Abdelsalam et al., 2022) and cowpea (Dobie, 1981). These resistant varieties are known to be less vulnerable to pest and disease attack. This is a result of their suppression or limitation of pathogen activity, which means that they show little or no symptoms of infection (Lupton, 1968).
For any crop, the genetic variability in the available germplasm is important for successful plant breeding (Subramanian and Subbaraman, 2010). The genetic variability in common bean has largely been estimated through the means of several markers, including molecular tools (Khaidizar et al., 2012; Fisseha et al., 2016; Sakhravi et al., 2023), allozymes and protein markers (Koenig and Gepts, 1989; Santalla et al., 2002; Kouam et al., 2017), and phenotypic descriptors (Lima et al., 2012; Boros et al., 2014; Okii et al., 2014). Determining the variability in yield and related traits of different genotypes would enable a breeder to estimate the environmental effects on the yield, as reported by Ullah et al. (2012). Broad-sense heritability provides indication for genetic control for the expression of a given character (Ullah et al., 2012). Hierarchical cluster analysis highlights, with the help of descriptors, the relationships among the genotypes constituting the population. It classifies the genotypes into different groups based on their Euclidian distance and indicates the parental lines that could produce superior hybrids, as reported by Subramanian and Subbaraman (2010). Correlation analysis helps in the determination of traits that are significantly related, especially those associated with yield as they can be used to improve yield in breeding programs. Principal component analysis generally suggests the contribution of each trait to the variation established among genotypes. It shows which trait explains greater variability and exhibits the greatest discrimination among the genotypes. The present study aims to determine the level of polymorphism among 32 common bean genotypes, estimate the broad-sense heritability of important agronomic characters, and assess the significance of the relationships among the different traits.
Thirty-two different genotypes of common bean were used for the field experiment. They were obtained from IRAD Foumbot in the western region of Cameroon. Table 1 illustrates the qualitative attributes of the common bean genotypes used. Figure 1 shows the seed morphology of the different genotypes. The study site was the IRAD research farm in Dschang in the western region of Cameroon. We chose the land on which to set up the experiment based on the crops that had been cultivated on it for the past 2 years (i.e., crops not belonging to the bean family). This was to prevent inocula developing on plant debris and infected soil, which are major sources of infection. The land preparation consisted of clearing and treatment with herbicide (glyphosate). A tractor was used to plough, loosen, and soften the soil. The land was demarcated, and this was followed by the pegging and formation of the experimental units. A randomized complete block experimental design with three repetitions was used. Each experimental unit occupied a surface of 4 m2 (2 m × 2 m). The total surface used was 640 m2 for the 96 experimental units. The space between the two adjacent experimental units measured 50 cm. The space between row in an experimental unit was 50 cm and within row spacing were 30 cm for dwarf genotypes and a plant density of 50 cm x 50 cm was used for climbing genotypes. The sowing of the seeds was done on 17 March 2020 and repeated during the same period in 2021. This activity was carried out manually using a cutlass to make holes approximately 5 cm–7 cm deep to permit seed deposition and covering. Two seeds per hole were planted. Each experimental unit contained at the end four rows for a total of 24 plants for dwarf and 16 plants for climbing genotypes of common beans. Different management techniques were employed to ensure good productivity. This included weeding and mulching, which were done 1 month and 2 months after sowing manually with the aid of hoes and cutlasses. Inorganic fertilizer (NPK: 12–6–20) was also applied at a dose of 5 g per plant when the plants were 1 month old. Insect pest control was done using chemical insecticide (Diamant 35EC) at a dosage of 30 mL per sprayer (16 L) on 2-month-old common bean plants. Plants with the climbing genotype were also staked at the R4 stage to help support and direct the climbing stems. The harvesting was done manually when the plants were physiologically mature with dry pods.
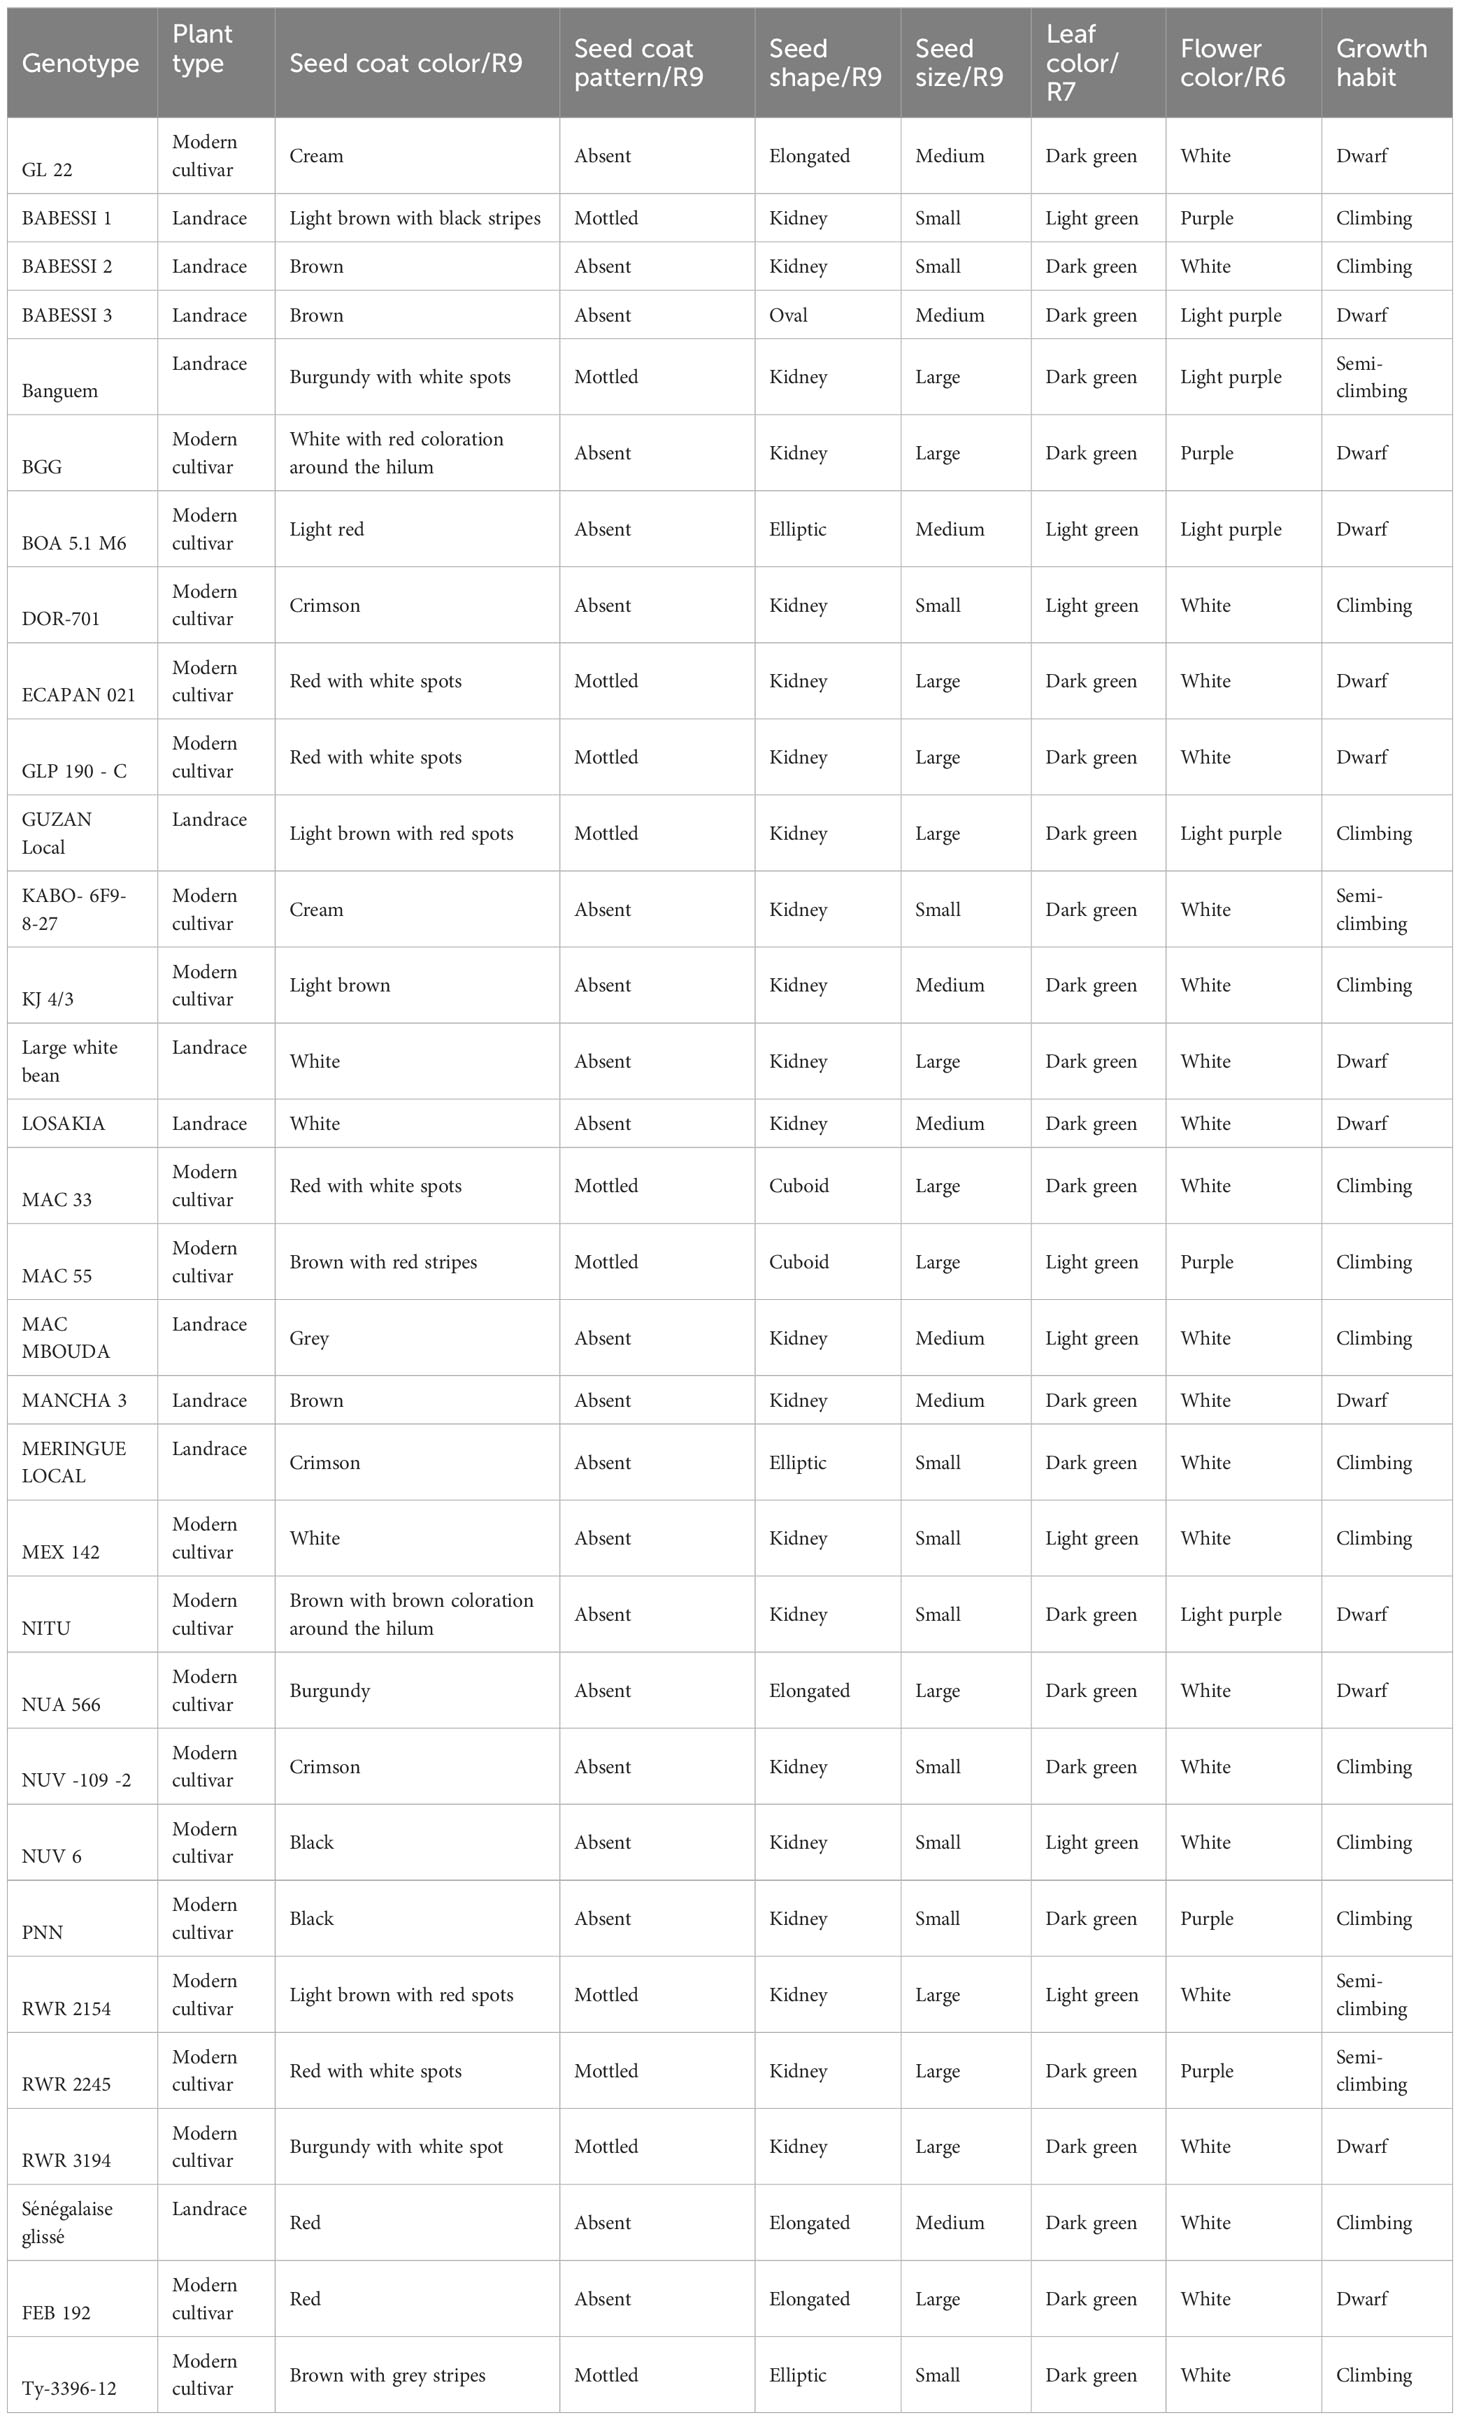
Table 1 Qualitative attributes of the 32 studied common bean genotypes.
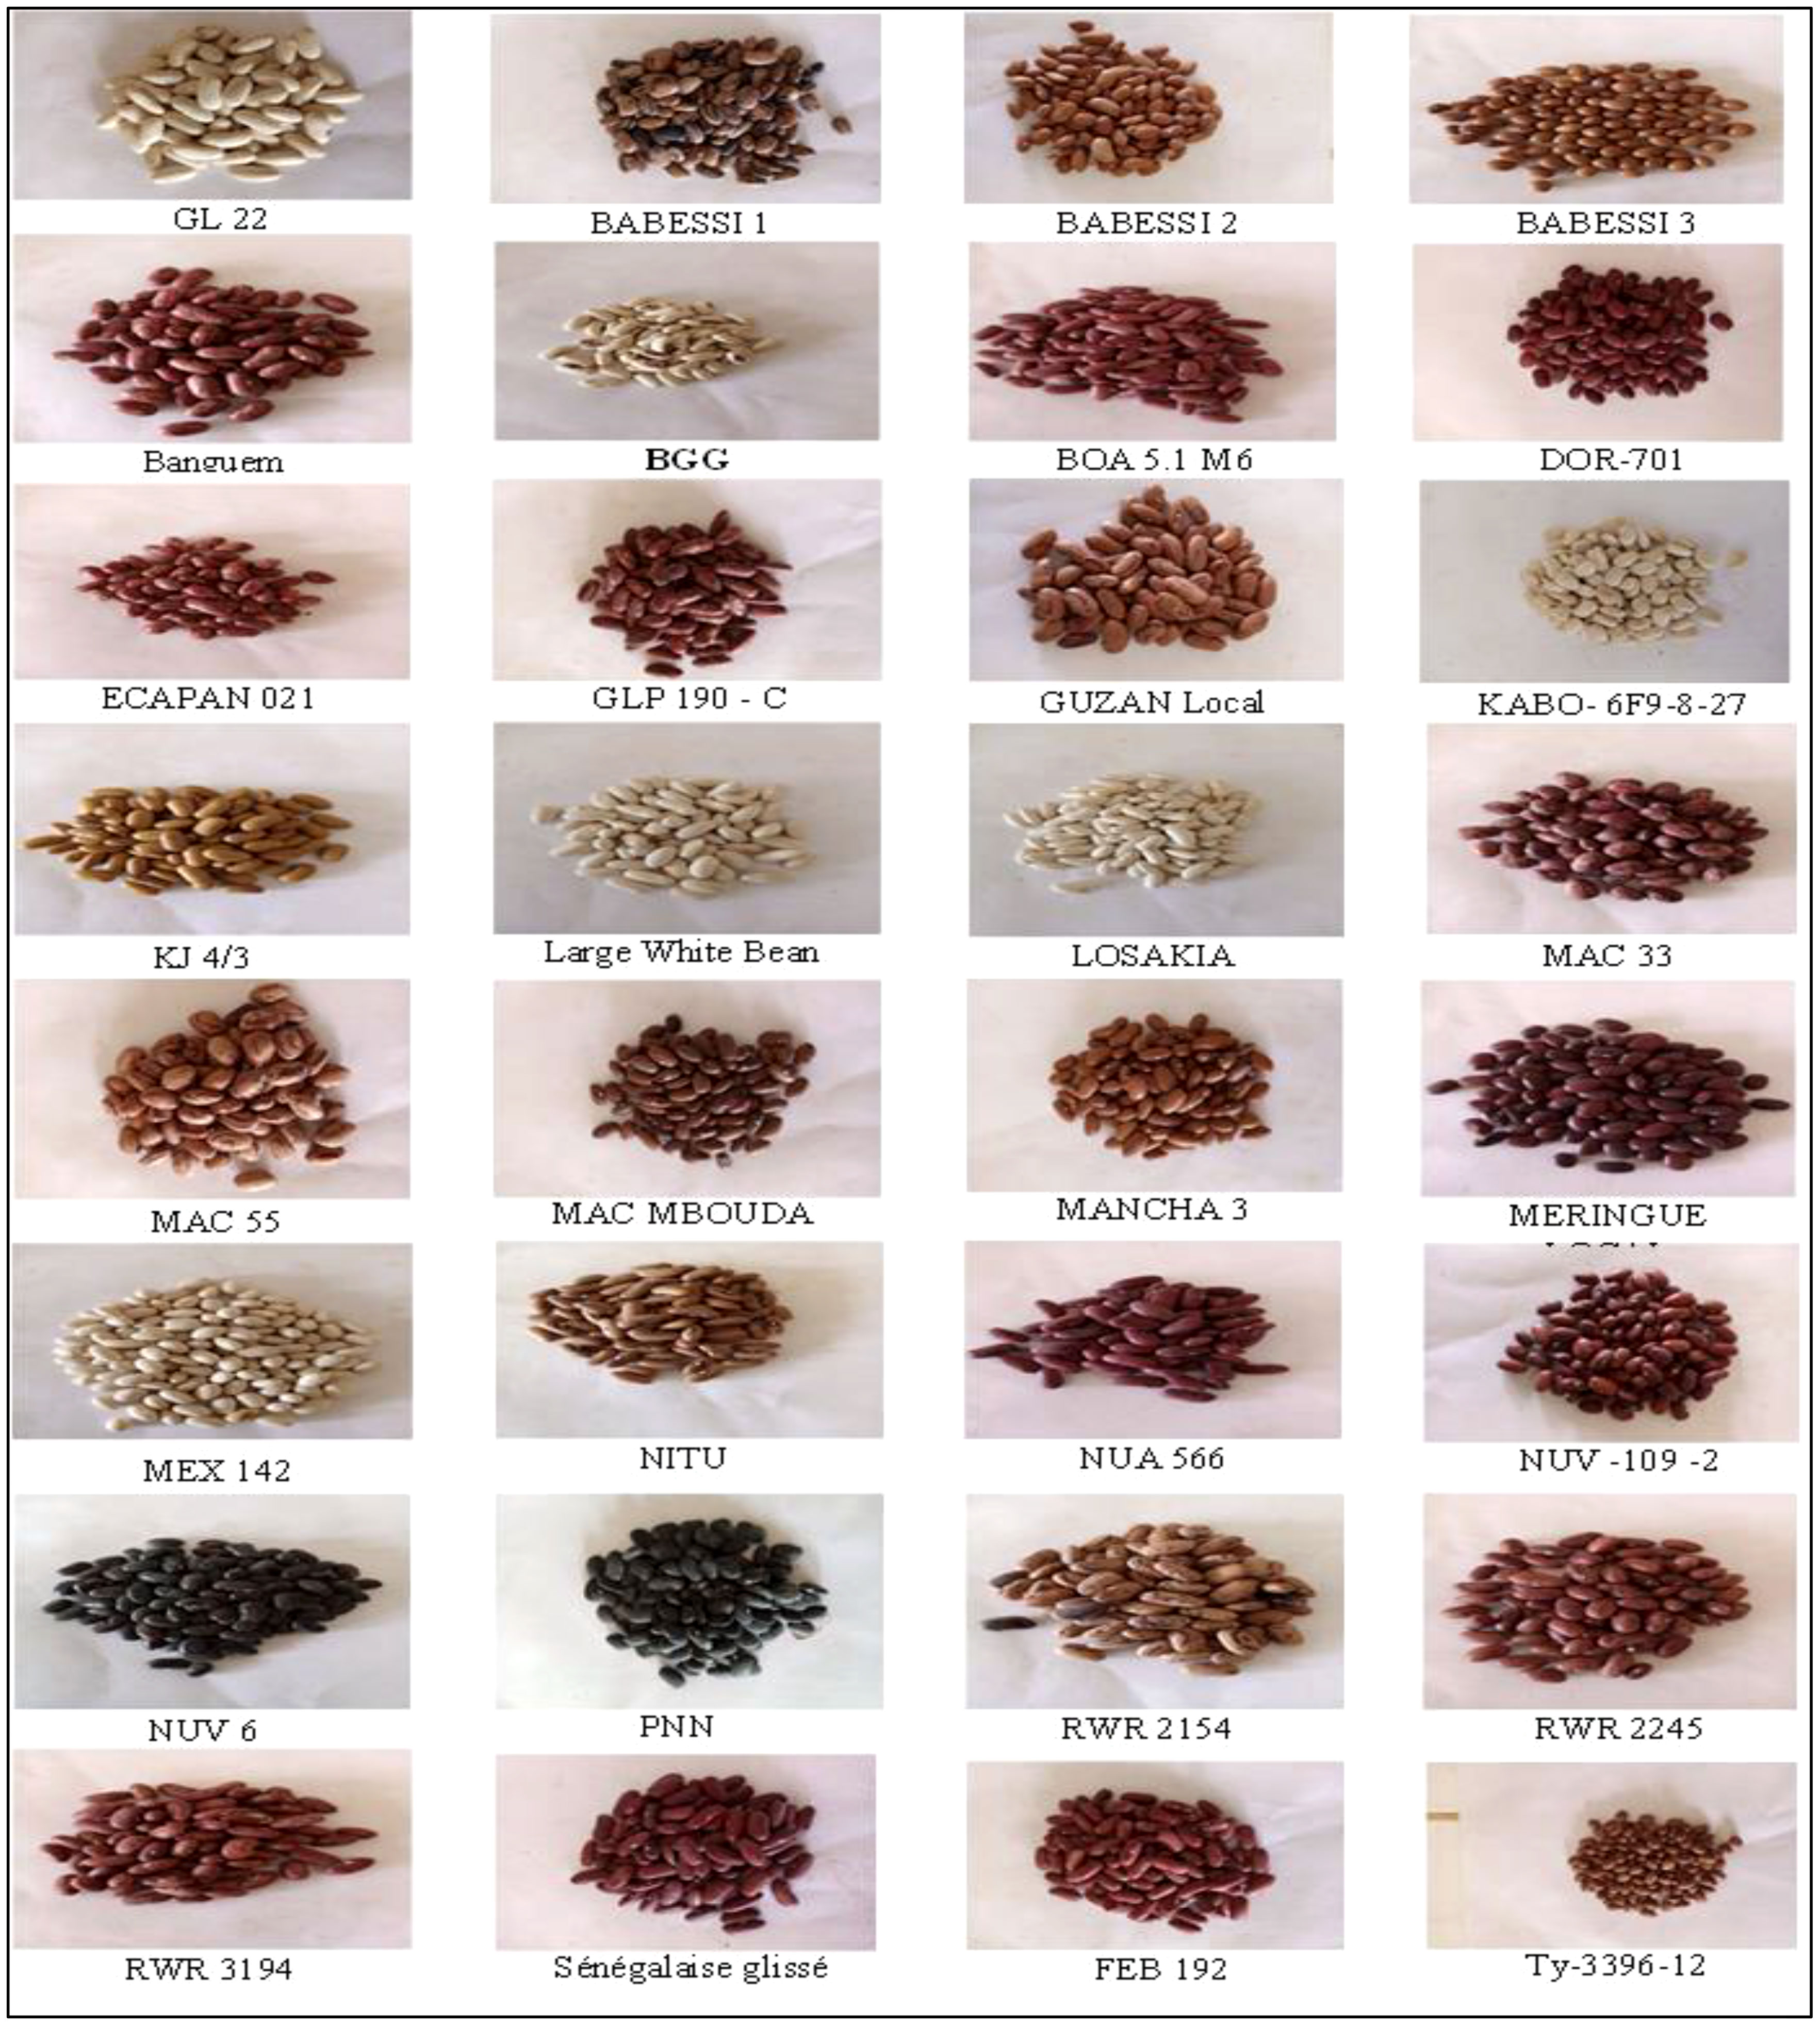
Figure 1 Seed morphology of the 32 studied common bean genotypes.
The assessment of the qualitative characteristics involved visual assessment of the following: seed coat color, seed coat pattern, seed shape, seed size (obtained by calculating the 100-seed weight), leaf and flower color, and growth habit. The assessment of the quantitative characteristics was done using the following variables, measured using various methods: plant height (measured using a tape); 100-seed weight, seed yield, and seeds yield (measured using an electronic balance); the number of leaves per plant (measured by counting); leaf length and width (measured using a transparent ruler from the base to the tip of the leaf and from one side of the leaf to the other side perpendicular to the leaf node and parallel to the leaf vein, respectively); the collar diameter (measured using an electronic Vernier caliper); the frequency of empty pods per plant (determined by dividing the average number of empty pods per plant by the total number of pods per plant); and the frequency of damaged seeds per plant (determined by dividing the average number of damaged seeds per plant by the total number seeds per plant). The phenological characteristics noted 50%F and 50%M were the duration in days from planting to 50% of plants flowering, and developing mature pods, respectively. The diagnosis of common bean diseases in the field was done through symptomology and microscopy. For each disease, the symptoms of the diseases that manifested on the plant leaves were carefully studied following the literature and recorded. Floury leaf spot, angular leaf spot, common blight, and rust disease were evaluated in terms of their severity using the nine-point CIAT rating scale described by Schoonhoven and Pastor-Corrales (1987), in which 1 indicates asymptomatic plants, 0%; 2 indicates that up to 3% of the leaf area is covered with disease lesions; 3 indicates that up to 5% of the leaf area is covered with disease lesions; 4 indicates that approximately 10% of the leaf area is covered with disease lesions; 5 indicates that approximately 10%–15% of the leaf area is covered with disease lesions; 6 indicates that 15%–20% of the leaf area is covered with disease lesions; 7 indicates that 20%–25% of the leaf area is covered with disease lesions; 8 indicates that 25%–35% of the leaf area is covered with disease lesions; and 9 indicates that there are severe disease symptoms resulting in leaf fall and death.
Qualitative traits were used to assess the phenotypic diversity of the collected genotypes. For each qualitative trait, the observed (Na) and the effective (Ne) numbers of the phenotypic classes were calculated. Phenotypic class frequencies were used to compute the Nei (1987) gene diversity (He), which was calculated as follows:
The data collected for the quantitative traits were subjected to ANOVA using XLSTAT software (2016 version) (Addinsoft, 2016). The means were used to calculate genetic parameters such as genotypic (GCV), phenotypic (PCV), and environmental (ECV) coefficients of variation. The genotypic, phenotypic, and environmental variances and coefficients of variation (CVs) were estimated to show the variability among the studied genotypes. Correlation, principal component, and hierarchical cluster analyses were also carried out using XLSTAT software (2016 version) (Addinsoft, 2016) to assess association between quantitative traits, identify the most discriminating traits and determine the relationships among the studied common bean genotypes. The mean data for each analyzed trait were subjected to Mahalanobis D2 statistics to determine the genetic distance between clusters, as suggested by Mahalanobis (1936). The different pairwise genetic distances were then tested for significance using Fisher’s test. For each trait, the phenotypic variation was separated into genetic and non-genetic factors and estimated following Burton (1952) and Sharma (1988):
where σ2P, σ2G, and σ2E represent phenotypic, genotypic, and environmental variance, respectively. MSG, MSE, and r represent the mean squares of genotypes, mean squares of error, and number of replications, respectively. The broad-sense heritability (h2bs) was estimated following Burton (1952). It is expressed as the percentage of the ratio between the genotypic (σ2G) and phenotypic variance (σ2P).
The seven studied qualitative traits showed polymorphism (Tables 1, 2). The number of observed phenotypic classes per trait ranged from 2 (seed coat pattern and leaf color) to 18 (seed coat color), with a mean across all traits of 5.14. The effective number of observed phenotypic class per qualitative trait was Ne = 3.85. We found that there was significant gene diversity, which we measured following Nei’s method (1987). It varied from 0.37 (leaf color) to 0.929 (seed coat color), with a mean of 0.57 (Table 2). A wide range of variation in quantitative traits was observed. The means, ranges, and coefficients of variation of 16 quantitative traits are presented in Table 3. The mean squares and genetic parameters of 32 common bean genotypes are displayed in Table 4. The ANOVA test showed significant (p < 0.05) variation among genotypes for all the studied quantitative traits. The coefficient of variation varied from 5.88% for days to 50% maturity to 229% for rust disease. The mean number of days to 50% maturity for the entire collection was 76.96. The earliest-maturing germplasm were NITU and Guzan local, of which 50% of the plants required around 69 days to reach maturity. The latest-maturing genotype was the introduced variety (MEX142), which reached maturity after an average of 90.67 days. The genotype with the highest seed yield (32.65 g/plant) was MAC55 (Table 3). A high level of variation was found in terms of disease resistance, for which various ranges were observed. The coefficients of variation were 76.99% for floury leaf spot, 37.70% for angular leaf spot, 42.04% for common blight, 229.07% for rust disease, and 93.77% for the percentage of damaged seeds. BARESSI 1 (0%) and MAC MBOUDA (0%) were found to be not affected by floury leaf spot, whereas RWR3194 (9.50%) and RWR2245 (8.33%) were the most affected. Angular leaf spot affected BOA5.1 M6 (0.5%), MAC55 (5.5%), and Banguem (5.67%) to a lesser degree, and mostly affected MANGA3 (21.17%). Common blight was also found to mostly affect MANGA3 (13.0%) and 22GL (11.40%), while the genotypes resistant to it were BOA 5.1 M6 (1.40%), Banguem (3.80%), MAC55 (3.0%), and FEB192 (4.13%). Many of the genotypes, including BOA5.1 M6 (0%), Banguem (0%), and FEB 192 (0%), were not affected by rust disease, while Kabo 6Fg-8-27 (7.93%) and BARESSI1 (5.80%) were the most affected. The largest proportions of damaged seeds were recorded for NUA566 (16.40%), 22GL (13.65%), and LOSAKIA (12.43%), and the smallest proportions of damaged seeds were recorded for PNN (0%), MAC MBOUDA (0.51%), and MAC55 (0.63%). Overall, four genotypes showed significant resistance to diseases; these were FEB192, MAC55, BOA 5.1 M6, and Banguem (Table 3).
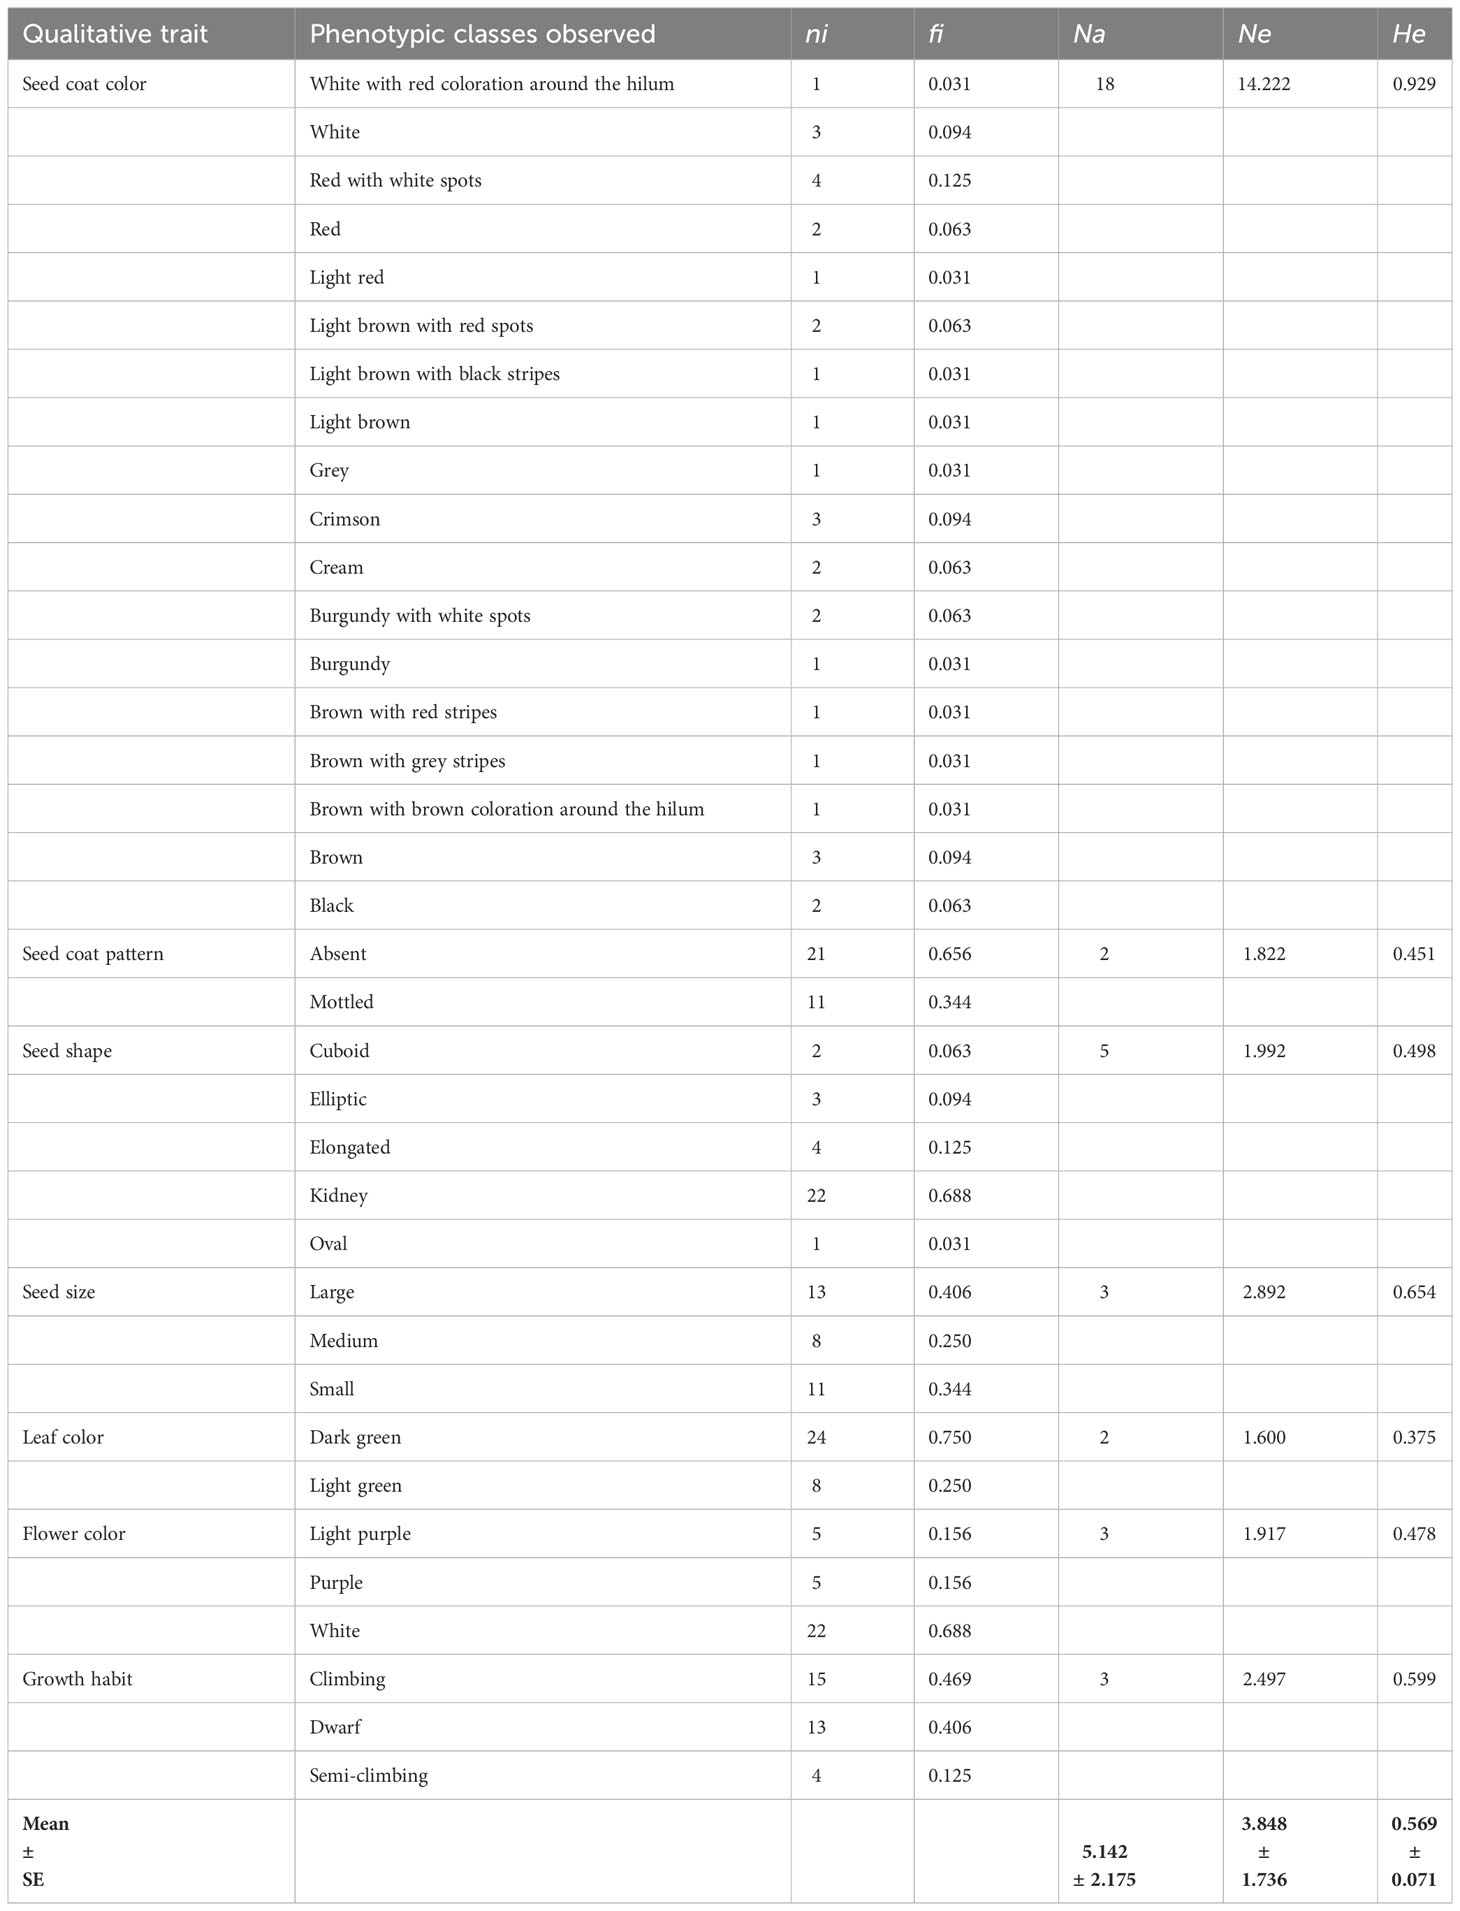
Table 2 Qualitative traits and diversity parameters estimates.
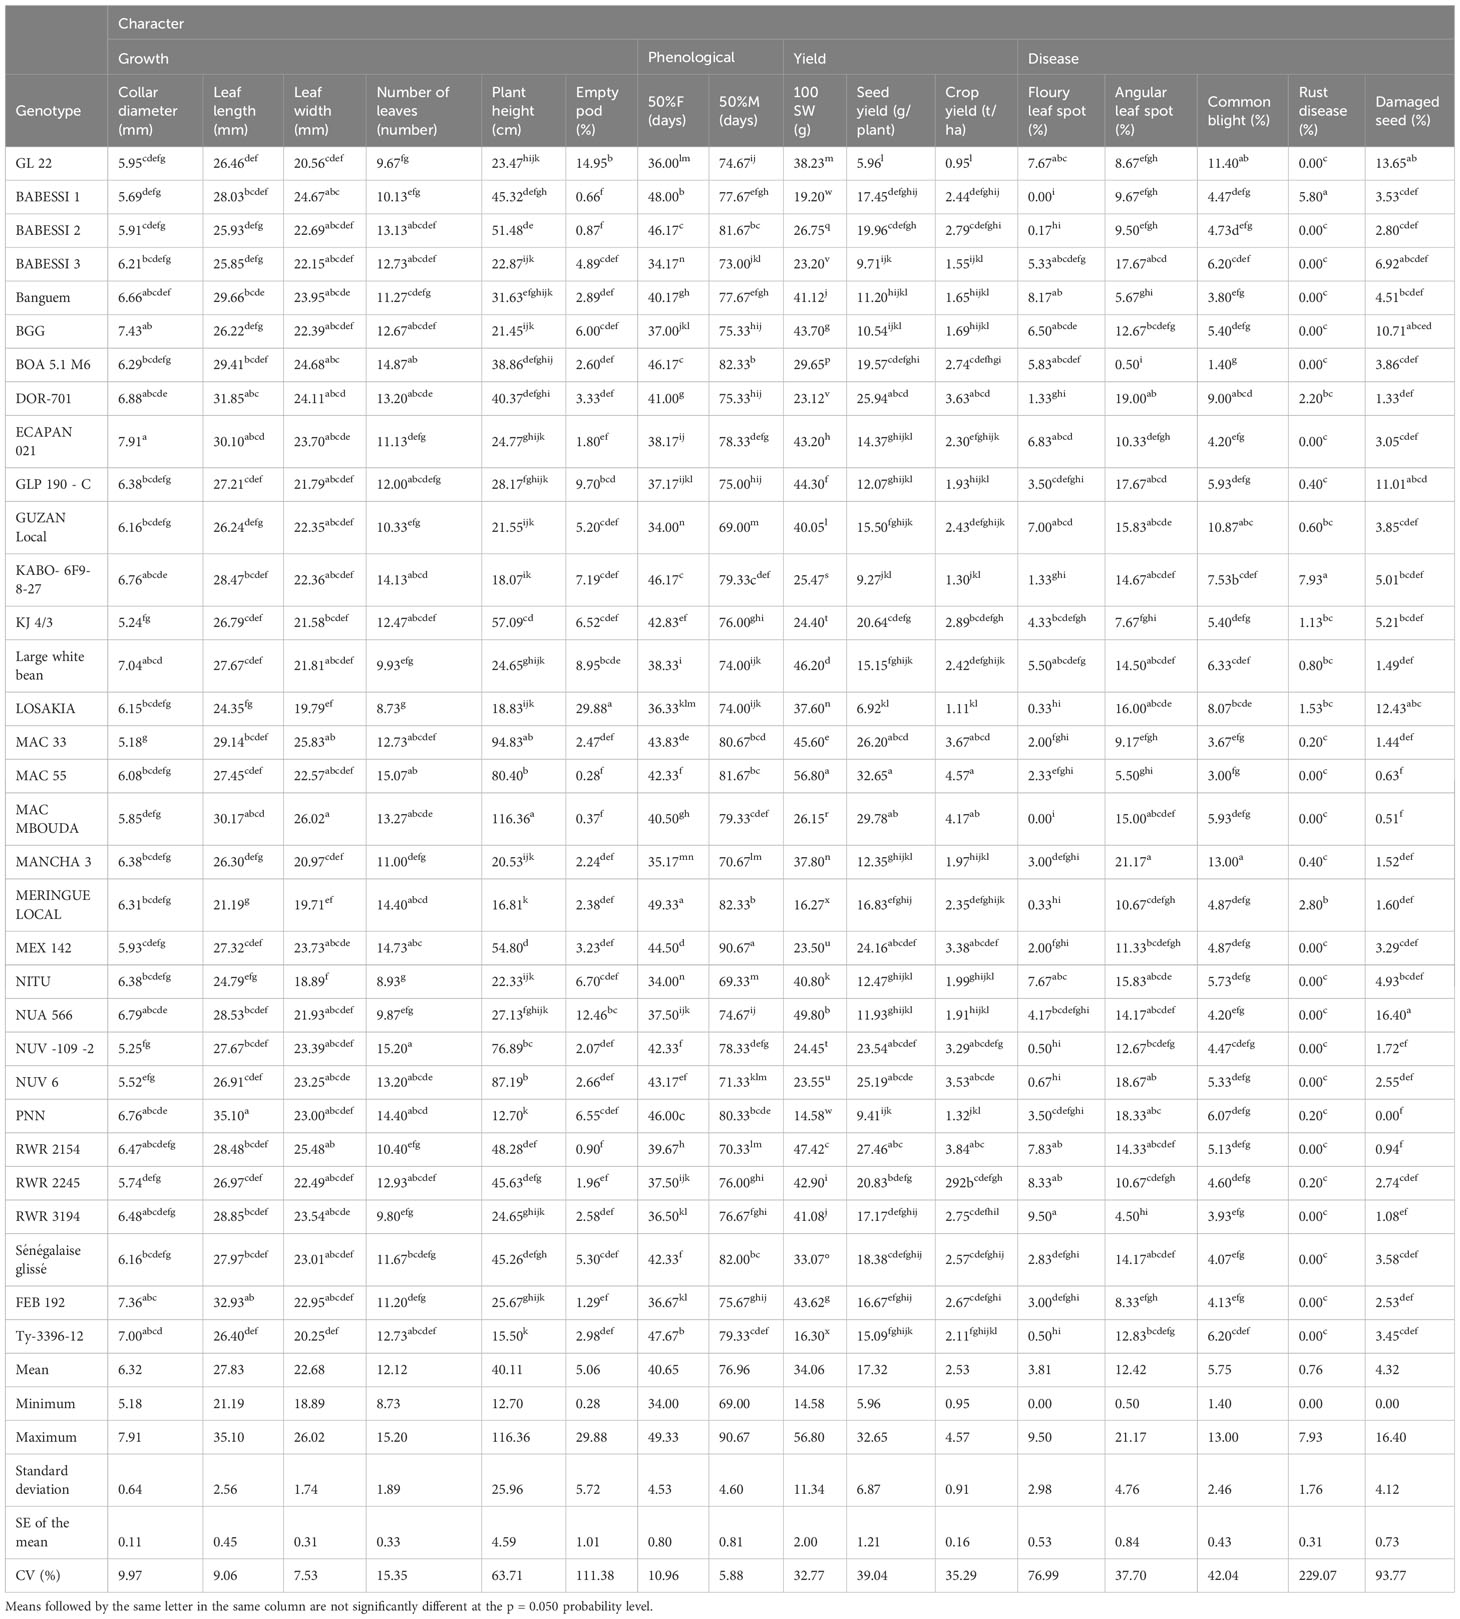
Table 3 Mean performances of growth, phenological, yield, and disease characteristics in the 32 studied common bean genotypes.
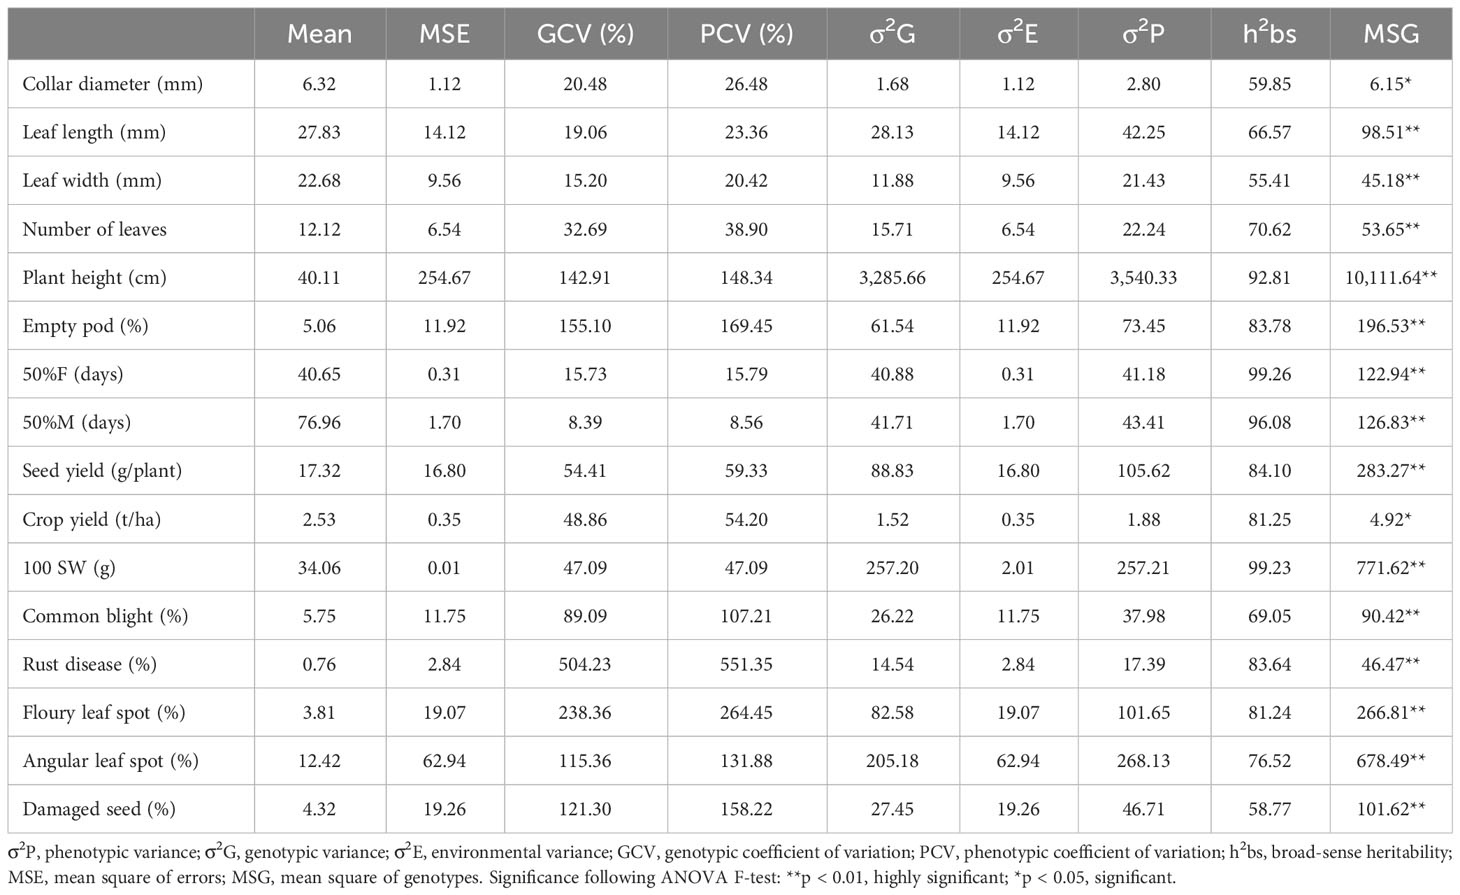
Table 4 Estimates of genetic parameters of 16 qualitative traits among 32 common bean genotypes.
High broad-sense heritability was recorded for all the studied quantitative traits, as shown in Table 4. It ranged from 55.51% (leaf width) to 99.26% (time to 50% flowering). The correlation matrix of the measured quantitative characteristics is presented in Supplementary Table S1. It showed positive and negative correlations among the traits at various probability levels (5%, 1%, and 1‰). The seed yield correlated significantly with common blight (r = −0.39), number of damaged seeds (r = −0.61), collar diameter (r = −0.42), plant height (r = 0.83), time to 50% flowering (r = 0.37), number of empty pods r = −0.59), leaf length (r = 0.59), and leaf width (r = 0.46). Common blight was found to be associated with nine other traits, namely, angular leaf spot (r = 0.60), time to 50% flowering (r = −0.40), time to 50% maturity (r = −0.50), number of leaves (r = −0.37), plant height (r = −0.38), seed yield (r = −0.39), number of empty pods (r = 0.36), leaf width (r = −0.40), and crop yield (r = −0.38). Floury leaf spot was found to be related to the number of leaves (r = −0.43), plant height (r = −0.37), 100-seed weight (r = 0.54), rust disease (r = −0.36), and time to 50% flowering and maturity (r = −0.60 and r = −0.39, respectively). Angular leaf spot was associated with common blight (r = −0.60) and time to 50% maturity (r = −0.46). Rust disease was found to be related to floury leaf spot (r = −0.36), 100-seed weight (r = −0.38), and time to 50% flowering (r = 0.40).
The cluster analysis, which was carried out using qualitative and quantitative descriptors following Ward’s method (Ward, 1963), showed that the dissimilarity ranged from 3.94 to 160.64, and enabled the identification of three main phenotypic clusters of 6, 16, and 10 genotypes each (Figure 2). The qualitative characteristics of each cluster are presented in Table 5 and the mean values of all quantitative traits are presented in Table 6. Cluster I was characterized by early-maturing and early-flowering genotypes, medium seed size, larger numbers of dwarf and low-seed-yield genotypes, and increased susceptibility to common blight and angular leaf spot plants. Cluster II was characterized by late-flowering and late-maturing plants, small seed size and high-seed-yield genotypes, and a larger number of climbing genotypes resistant to floury leaf spot. Cluster III was characterized by genotypes susceptible to floury leaf spot and plants with larger, kidney-shaped seeds. The clustering pattern and average inter-cluster Mahalanobis D2 distances are presented in Table 7. The greatest Mahalanobis D2 inter-cluster distance was 1,256.55, and this was observed between clusters I and II. Each cluster was significantly different from the two others, as revealed by the results of Fisher’s test. The results of the principal component analysis revealed the phenotypic diversity that exists among the 32 studied common beans genotypes is based on 16 quantitative and seven qualitative traits. The results of the first four principal components (PC1, PC2, PC3, and PC4) for quantitative traits are presented in Supplementary Table S2. They constituted 35.39%, 16.99%, 11.84, and 8.66% of the variation, respectively, for a total cumulative variation of 73.88%. Ten traits, including common blight, the number of damaged seeds, seed and crop yield, time to 50% flowering and maturity, plant height, the number of leaves, leaf width, and the frequency of empty pods contributed significantly to the first principal component. The second principal component was significantly related to the 100-seed weight, rust disease, and floury leaf spot. The third principal component was linked to angular leaf spot and collar diameter, and the fourth principal component was significantly associated with leaf length. The distribution of the genotypes according to the first two principal components is shown in Figure 3B for quantitative traits, and Figure 3A for qualitative traits. The principal component analysis results for the qualitative traits are presented in Supplementary Table S3. The first four PCs cumulatively explained 76.66% of the total variation. PC1 explained 26.23% of the variation and was significantly associated with seed coat color, seed coat pattern, and seed size. PC2 described 20.57% of the total variation and was related to leaf color and growth habit. The flower color was linked to PC3 (16.55% of the total variation) and the seed shape was linked to PC4 (13.31% of the total variance).
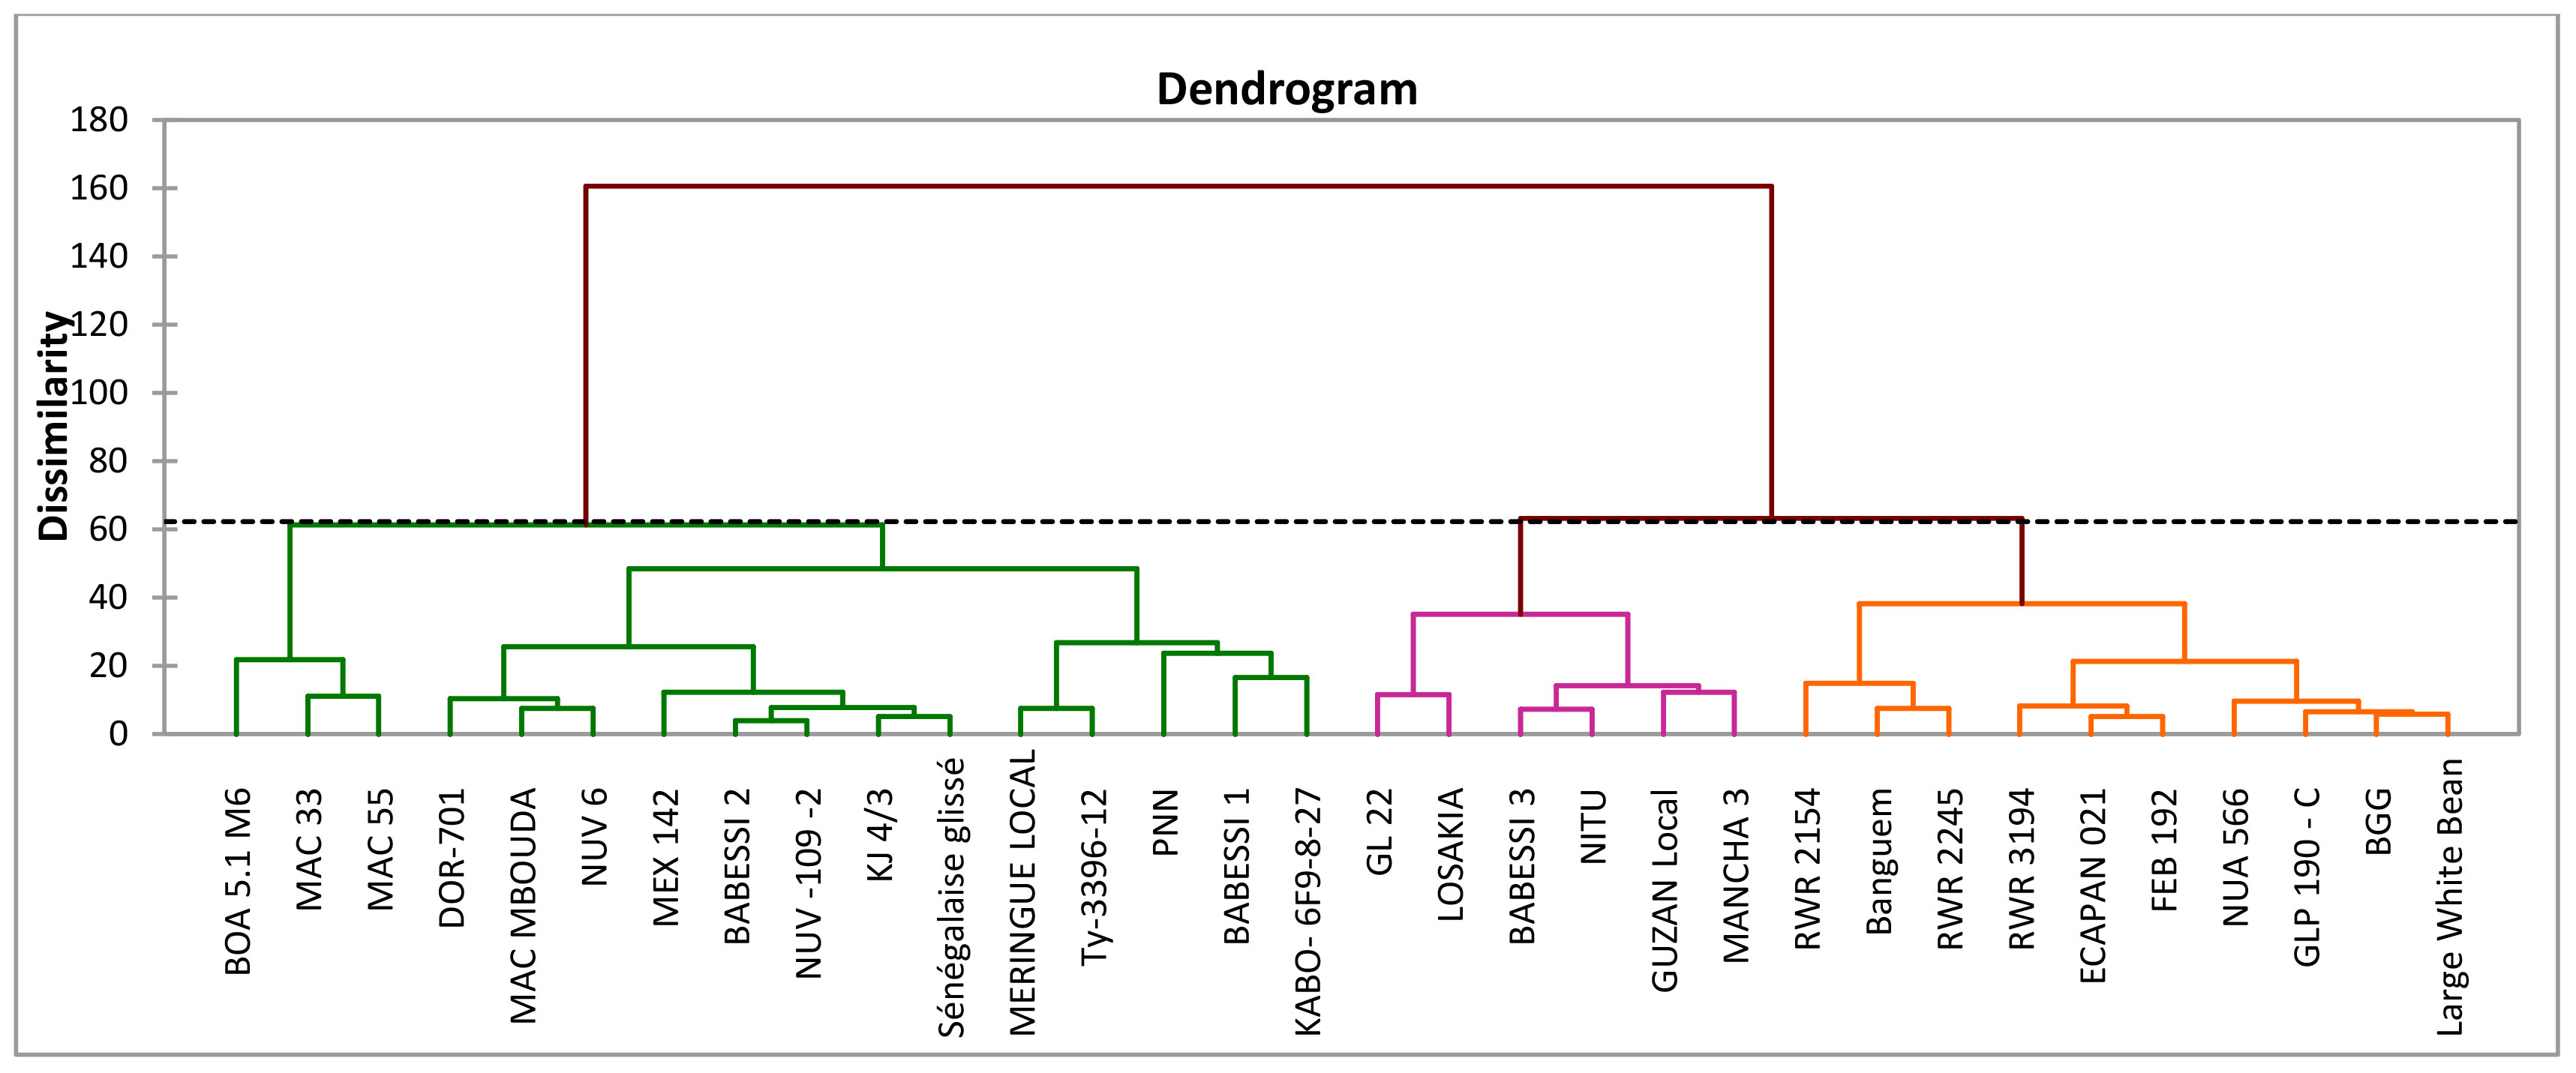
Figure 2 Dendrogram grouping of the 32 common bean genotypes based on both qualitative and quantitative traits.
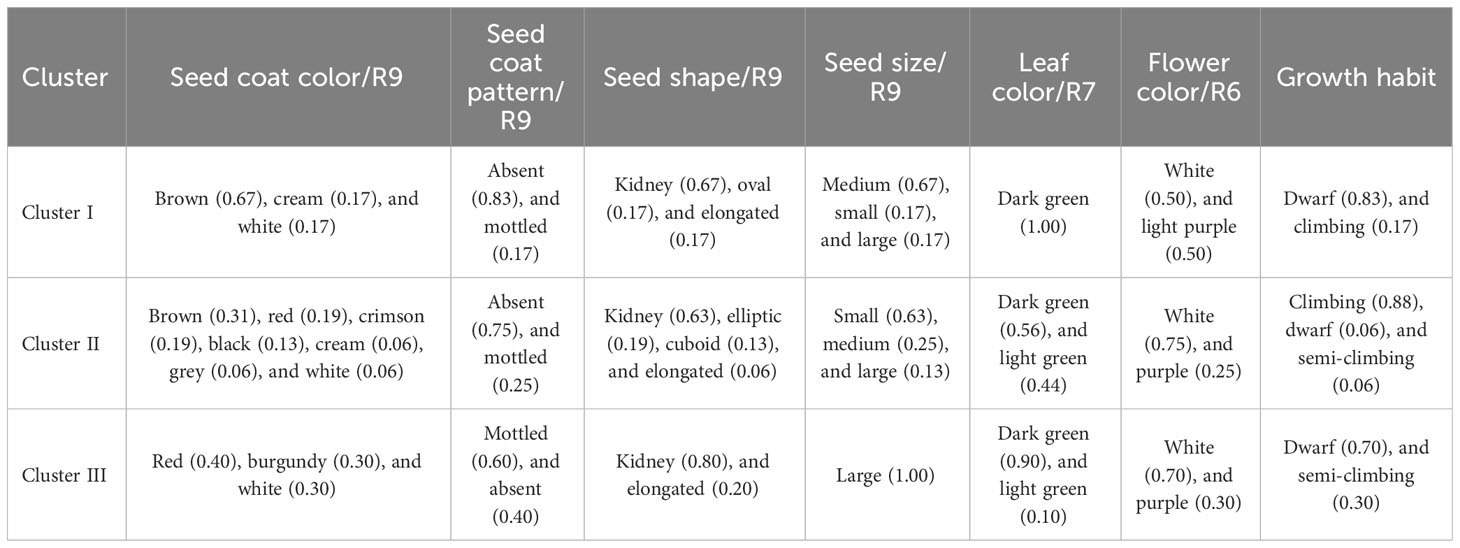
Table 5 Clusters characteristics for seven qualitative traits for common bean genotypes from the IRAD gene bank in Cameroon.
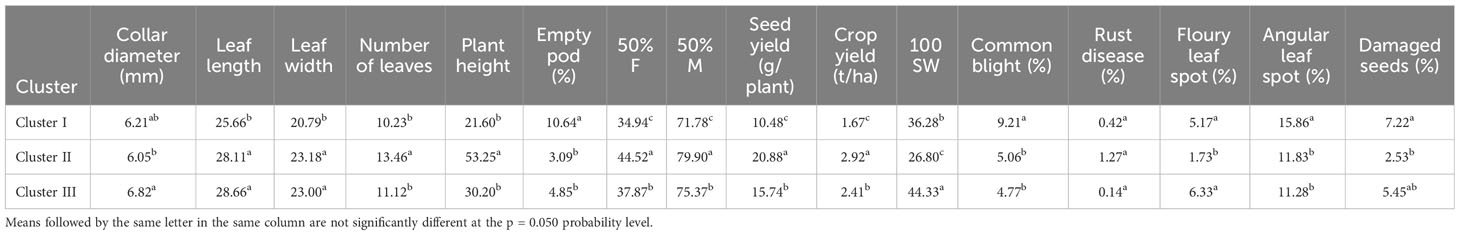
Table 6 Clusters characteristics for 16 quantitative traits for common bean genotypes from the IRAD gene bank in Cameroon.
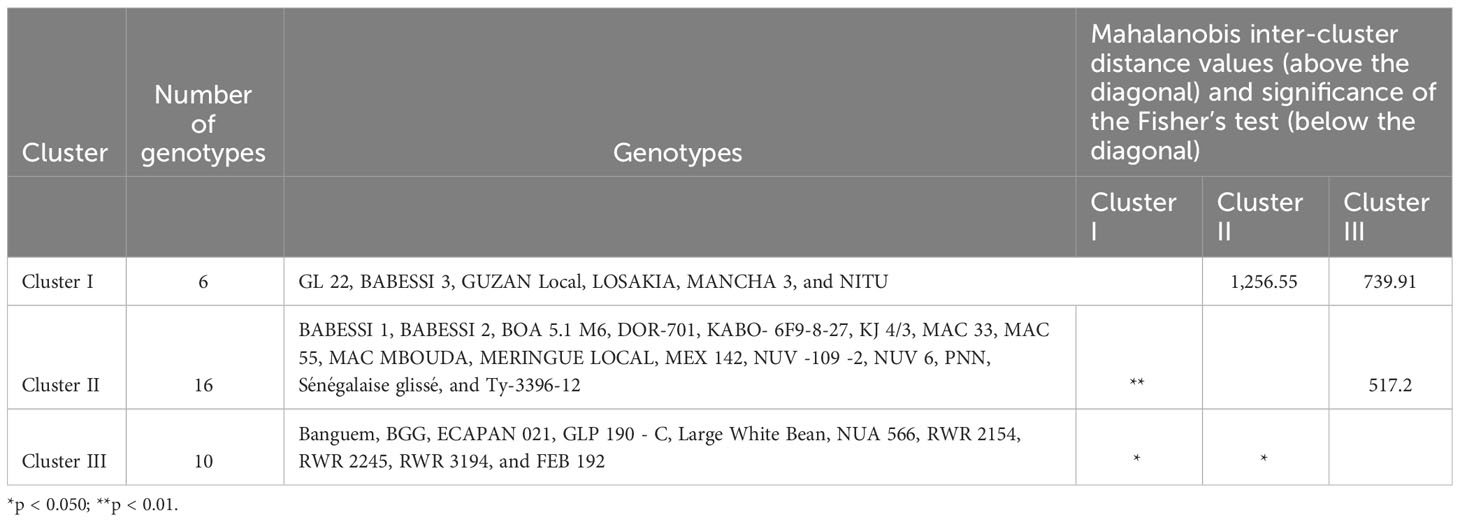
Table 7 Clustering pattern, average inter-cluster Mahalanobis D2 distances and Fisher test significance matrices for common bean genotypes from the IRAD gene bank in Cameroon.
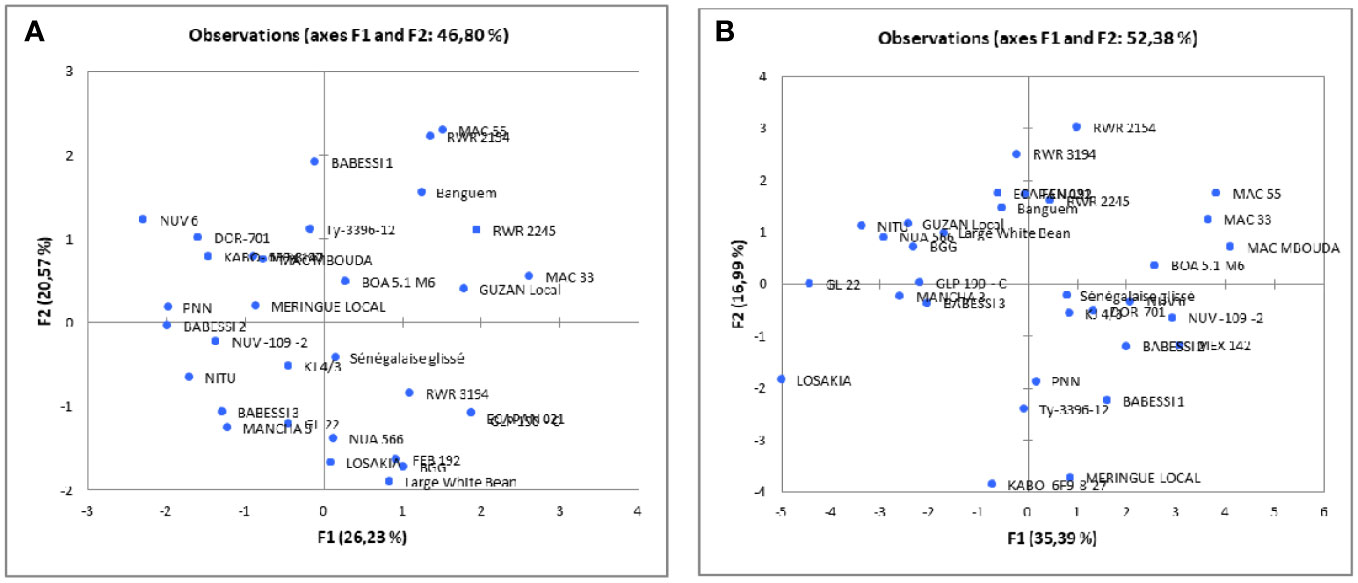
Figure 3 Two-dimensional PCA plot of the first two components of the 32 studied common bean genotypes based on the seven qualitative traits (A) or the 16 quantitative traits (B).
Plant breeders, in order to develop superior cultivars, always rely on the genetic diversity prevailing and accessible for the crop. The genetic variation in plants species can be evaluated through morphological characterization that uses visual attributes, as carried out in many studies on several crops worldwide. Morphological descriptors have therefore been intensively used in evaluating crop diversity, and this includes those of common bean (Lima et al., 2012; Boros et al., 2014). Using qualitative and quantitative descriptors for studying genetic diversity in common bean from the IRAD gene bank in Cameroon, we found an extremely high level of polymorphism associated with the important observed and expected number of phenotypic classes per trait. We also observed a high level of genetic diversity indices using qualitative traits and increased coefficients of variation of a large number of quantitative traits. These observations are strong indicators of the appropriateness of the chosen descriptors for addressing common bean diversity. The reported diversity index was high (He = 0.57) and was found to be comparable to that in the report by Okii et al. (2014) on common bean from the Ugandan and Rwandan gene banks (H = 0.56). Four out of the seven qualitative variables studied were on seed visual characteristics. This shows that seeds play an important role as indicators of common bean diversity. Similar results were obtained by Loko et al. (2018), with the majority (39%) of the studied qualitative traits being on seeds. This also explains why most of the folk nomenclature and taxonomy is based on the seed coat color and seed pattern. Moreover, seed descriptors are extensively used to distinguish common beans genotypes, as reported by Piergiovanni and Lioi (2010); Bianco et al. (2015), and Delfini et al. (2017). The traits describing seed quality are also known to be highly heritable and hence important for breeding programs (Merrick et al., 2022). Observable seed characteristics, including color and shape are of special interest to consumers (Stoilova et al., 2013). The dominant seed qualities observed could therefore reflect both farmer and consumer preferences. Brown and red seed coat colors and the kidney shape dominated in the common bean genotypes investigated in this study. Similar results have been reported by Loko et al. (2018), who worked on 57 accessions from Benin, by Okii et al. (2014) when determining the morphological diversity of 284 accessions from national gene banks in Uganda and Rwanda, and by Saba et al. (2016) when comparing 203 common bean lines from national and international gene banks. The growth habit of the common bean genotypes was mostly of the climbing and dwarf types. The predominance of the climbing growth habit type could be related to the ecological adaptation and cropping system that is mostly carried out in the western highlands, where common bean is highly cultivated. Sanyang et al. (2019) and Siri et al. (2017) reported the practice of intercropping plants in this region of Cameroon. They reported that common bean is mostly intercropped with maize, especially for economic reasons, and in some cases with cassava, potatoes, and cocoyam. There was also quite a number of dwarf genotypes identified, which makes sense, especially as the farmers in the study area suffer from a scarcity of appropriate staking materials. The white predominant flower color was also recorded by Okii et al. (2014). The predominant leaf color was found to be dark green. This indicates the presence of more chlorophyll in most genotypes. A light-green color was also seen in quite many genotypes with less chlorophyll, as Zhang et al. (2021) stated that the plant leaf color is dependent on the chlorophyll content. Singh et al. (1991) grouped common bean seeds in terms of their 100-seed weight into groups of small (< 25 g), medium (25 g to 40 g), and large seeds (> 40 g). All three types were found in the studied germplasm, indicating the representativeness of the plant material used. Okii et al. (2014) and Boros et al. (2014) both reported on these three types of seeds in their studies.
The quantitative characterization (growth parameters, phenological, disease, and yield variables) was seen to vary among the different genotypes with desirable characteristics, such as the high-yielding variety (MAC55), disease-resistant genotypes (MAC55, BOA-5-1M6, FEB 192, and Banguem), and early-maturing plants (Guzan local and NITU) were identified and are to be used in setting up common bean breeding. Similar studies aiming at identifying the suitable genotypes for common bean breeding were carried out, including that of Stoilova et al. (2005) who characterized 30 landraces from Portugal and Bulgaria with the help of morphological descriptors and identified suitable accessions for the purpose of breeding. Durán et al. (2005) phenotyped 56 bean plants from the Caribbean and sorted them based on whether they originated from the Mesoamerican or Andean gene pools. It was also observed that the earliest to attain 50% flowering was the first to attain 50% physiological maturity, and this was confirmed by the positive and significant correlation found between the number of days to 50% of plant flowering and the number of days to 50% of plants reaching physiological maturity. This result was similar to that of Zilio et al. (2013), who stated that genotypes with the shortest emergence/flowering periods are generally the earliest to reach maturity. From this study, the genotypes seen to be resistant to angular leaf spot were associated with a large seed size and dwarf growth habits. This is contrary to the results of Djeugap et al. (2014) and Lemessa and Tesfaye (2005), who both reported that small-seeds varieties were more resistant to angular leaf spot. This could be linked to the source of infection, as Pseudocercospora griseola has been identified to be a seed-borne pathogen (Serrato-Diaz et al., 2020). In terms of disease rate, angular leaf spot had the highest rate in the field. This result was similar to that of Sanyang et al. (2019), who reported that angular leaf spot was a major disease in the western highlands of Cameroon. In general, most genotypes were found to be resistant to rust disease. This could be explained by the climatic conditions experienced during the study period. The temperature was around 20°C, but there was little or no rainfall during the study period, thus low-humidity conditions which is unfavorable to the growth of the pathogen.
The descriptive statistics of quantitative traits revealed a high level of variation among the 32 studied common bean studied genotypes, as shown by the high coefficient of variation in the majority of the studied traits. This result likely reflects the genetic differences between genotypes and surely provides good material for breeders. The average number of days to 50% of plant flowering (40.65) and 50% of plants at physiological maturity (76.96) of the common bean genotypes was lower than those obtained by Loko et al. (2018) and is comparable to those obtained in similar studies of common bean (Stoilova et al., 2005; Meza et al., 2013; Ulukapi and Onus, 2014). The differences observed between these different studies could be explained by the fact that these phenological traits are largely influenced by environmental conditions, as was stated by Meza et al. (2013). The extent of genetic variation could also be better assessed through the estimation of GCV and PCV. A small difference between the two would indicate that the observed variation and expression of traits relies mostly on genetic factors, while a larger difference would indicate that there was a significant influence of the environment on the measured trait. However, it has been reported that high GCV and PCV, coupled with high heritability, are useful for predicting the selection result based on phenotypic performance. In the studied genotypes, plant height, the percentage of empty pods, and disease characteristics showed a high level of variance, which was coupled with high heritability. This indicates that these traits are likely exposed to an additive gene effect and that a simple selection method for the simple improvement of the traits, as stated by Rana et al. (2015), is required. Conversely, the number of days to 50% flowering, number of days to 50% maturity, collar diameter, leaf length, and leaf width, showed low variance and medium heritability, suggesting the presence of non-additive gene connections for the expression of these traits, which can be improved through hybridization, as reported by Sharma et al. (2012). Significant correlations were found between some important traits in common bean, as reported by previous studies (Okii et al., 2014; Loko et al., 2018). This allows the possibility of simultaneous selections and the use of the related traits interchangeably in crop selection. Miko (2008) reported that strongly correlated traits are possibly under the influence of the same genes or pleiotropic effects. For example, if two strongly correlated traits are desired during crop improvement, there is a possibility that they can both be selected simultaneously based on only one of the traits. For example, the positive correlations between seeds yield and plant height indicates that the height of the plant can be used to determine its seeds yield. In addition, the selection for 100-seed weight would lead to early-flowering and early-maturing plants, since both traits were negatively correlated with the 100-seed weight. The mass of 100 seeds was seen to influence the yield as Mac 55 having the highest 100-seed weight was also seen to have the highest yield. These results are similar to those observed by Lemessa and Tesfaye (2005).
The growth habit and seed size that were used in the present study were found to be diverse. These two important phenotypic traits were primarily considered during common bean domestication, as reported by Koinange et al. (1996). This domestication resulted in the production of Mesoamerican- and Andean-cultivated beans, which are reported to be morphologically distinct (Chacón et al., 2005; Durán et al., 2005). The grouping of a large number of the germplasm genotypes into a small number of clusters is important in plant breeding (Rana et al., 2015). It provides a detailed comparison between pairs of genotypes groups and assists in the selection of genetically dissimilar parents used in heterosis breeding (Birchler et al., 2006). The dendogram from the agglomerative hierarchical clustering (AHC) grouped the studied genotypes into three distinct clusters. This clustering pattern with three distinct groups could be connected to the two distinct gene pools (Andean and Mesoamerican) that resulted from domestication. The third group is a possible additional gene pool resulting from introgression between plants from the first two, since cross-pollination is known to occur in common bean (Wells et al., 1988). Our results are in agreement with the reports of Long et al. (2020) and Okii et al. (2014) in their respective studies on common bean. The selection of principal components to be considered for further analysis in multivariate analysis was based on the eigenvalues of the principal components, as suggested by Kaiser (1961). Mohammadi and Prasanna (2003) revealed that principal component with eigenvalues above unity are reliable principal component with significant weight. For both quantitative and qualitative traits, the first four PCs of PCA were reliable, and explained 73.88% and 76.66% of the total variation, respectively. Sofi et al. (2014) studied the variability in 300 common bean genotypes using quantitative analysis and reported similar results to those in the present study, with the first four principal components constituting 73.69% of the total variation, and the number of days to 50% flowering, number of days to 50% maturity, 100-seed weight, and seed yield being the most important traits identified through principal component analysis. A comparable observation was reported by Abdollahi et al. (2016) who evaluated 64 common bean genotypes in terms of their phenological and morphological descriptors and reported four important principal components that constituted 74% of the total variation and allowed the identification of similar important traits.
One of the constraints faced by many plant breeders is the narrow genetic base available within plant collections. Given this limiting constraint, breeders need genetically diverse germplasm not only for yield and its contributing traits, but also for disease resistance. The results obtained based on various phenotypic traits related to growth, phenological, yield, and disease characteristics showed a broad genetic diversity in bean genotypes from the IRAD gene bank. Common blight disease, angular leaf spot and floury leaf spot were observed at a high level, with differential severity across genotypes observed in this study. Rust disease was seen at a lower level and was revealed not to be a major constraint in the region. The identification of agronomically superior and disease-resistant genotypes from the present study will be useful in minimizing the connection effort breeders must usually make while transferring disease resistance in already available high-yielding and susceptible genotypes. This available collection represents a valued genetic patrimony with great potential for the future. As a further step, the subsequent analysis of genetic diversity using more valued markers such as molecular markers is recommended to clarify more information on the overall genetic diversity and the particular genes associated with the specific traits of agronomic interest in the present common bean collection.
The datasets presented in this study can be found in online repositories. The names of the repository/repositories and accession number(s) can be found below: The data will be made available on request.
EBK: Conceptualization, Formal Analysis, Software, Writing – original draft, Writing – review & editing. JD-F: Conceptualization, Writing – review & editing. SM: Data curation, Investigation, Methodology, Writing – review & editing. NA: Data curation, Methodology, Writing – review & editing. AM: Data curation, Methodology, Writing – review & editing. BB: Data curation, Methodology, Writing – review & editing. NN: Data curation, Methodology, Writing – review & editing. JG-Y: Writing – review & editing.
The author(s) declare that no financial support was received for the research, authorship, and/or publication of this article.
The authors declare that the research was conducted in the absence of any commercial or financial relationships that could be construed as a potential conflict of interest.
All claims expressed in this article are solely those of the authors and do not necessarily represent those of their affiliated organizations, or those of the publisher, the editors and the reviewers. Any product that may be evaluated in this article, or claim that may be made by its manufacturer, is not guaranteed or endorsed by the publisher.
The Supplementary Material for this article can be found online at: https://www.frontiersin.org/articles/10.3389/fhort.2023.1289646/full#supplementary-material
Abdelsalam N. R., Balbaa M. G., Osman H. T., Ghareeb R. Y., Desoky E. M., Elshehawi A. M., et al. (2022). Inheritance of resistance against northern leaf blight of maize using conventional breeding methods. Saudi J. Biol. Sci. 29, 1747–1759. doi: 10.1016/j.sjbs.2021.10.055
Abdollahi A., Tahmasebpou B., Dehghanian H. (2016). Factor analysis of phonological and morphological traits in common bean (Phaseolus vulgaris L.). BFIJ 8, 132–134.
Addinsoft (2016) XLSTAT 2016: data analysis and statistical solution for microsoft excel. Available at: https://www.xlstat.com/fr/.
Aggarwal V. D., Pastor-Corrales M. A., Chirwa R. M., Buruchara R. A. (2004). Andean beans (Phaseolus vulgaris L.) with resistance to the angular leaf spot pathogen (Phaeoisariopsis griseola) in southern and eastern Africa. Euphytica 136, 201–210. doi: 10.1023/B:EUPH.0000030678.12073.a9
Akwa T. E., Maingi J. M., Birgen J. (2020). Susceptibility of common bean (Phaseolus vulgaris L) cultivars grown in menoua division, west region of Cameroon to storage fungi pathogens. J. Hortic. Sci. Res. 3, 94–103. doi: 10.36959/745/404
Arumuganthan K., Earle E. (1991). Nuclear DNA content of some important plant species. Plant Mol. Biol. Rep. 9, 208–218. doi: 10.1007/BF02672069
Beebe S., Rao I., Blair M., Acosta J. (2013). Phenotyping common beans for adaptation to drought. Front. Physiol. 4. doi: 10.3389/fphys.2013.00035
Bennett M. D., Leitch I. J. (1995). Nuclear DNA amounts in angiosperms. Ann. Bot. 76, 113–116. doi: 10.1006/anbo.1995.1085
Bianco M. L., Grillo O., Cremonini R., Sarigu M., Venora G. (2015). Characterisation of Italian bean landraces (Phaseolus vulgaris L.) using seed image analysis and texture descriptors. Aust. J. Crop Sci. 9, 1022–1034.
Birchler J. A., Yao H., Chudalayandi S. (2006). Unraveling the genetic basis of hybrid vigor. Proc. Natl. Acad. Sci. USA 103, 12957–12958. doi: 10.1073/pnas.0605627103
Boros L., Wawer A., Borucka K. (2014). Morphological, phenological and agronomical characterisation of variability among common bean (Phaseolus Vulgaris L.) local populations from the National Centre For Plant Genetic Resources: Polish Genebank. J. Hortic. Res. 22, 123–130. doi: 10.2478/johr-2014-0029
Burton G. W. (1952). Quantitative inheritance in grasses. Proc. 6th Int. Grassland Congress 1, 277–283.
Chacón S. M. I., Pickersgill B., Debouck D. G. (2005). Domestication patterns in common bean (Phaseolus vulgaris L.) and the origin of the Mesoamerican and Andean cultivated races. Theor. Appl. Genet. 110, 432–344. doi: 10.1007/s00122-004-1842-2
Chen N. W. G., Ruh M., Darrasse A., Foucher J., Briand M., Costa J., et al. (2021). Common bacterial blight of bean: a model of seed transmission and pathological convergence. Mol. Plant Pathol. 22, 1464–1480. doi: 10.1111/mpp.13067
Delfini J., Moda-Cirino V., Ruas C. F., Dos Santos Neto J., Ruas P. M., Buratto J. S., et al. (2017). Distinctness of Brazilian common bean cultivars with carioca and black grain by means of morphoagronomic and molecular descriptors. PloS One 12, e0188798. doi: 10.1371/journal.pone.0188798
Djeugap F. J., Mefire M. H., Nguefack J., Ngueguim M., Fontem D. A. (2014). Effet variétal et du traitement fongicide sur la sévérité de la maladie des taches angulaires et le rendement du haricot commun (Phaseolus vulgaris L.) à l’Ouest-Cameroun. Int. J. Biol. Chem. Sci. 8, 1221–1233. doi: 10.4314/ijbcs.v8i3.33
Dobie P. (1981). ““The use of resistant varieties of cowpeas (Vigna unguiculata) to reduce losses due to post-harvest attack by callosobruchus maculatus”,” in The ecology of bruchids attacking legumes (Pulses). Series entomologica. Ed. Labeyrie V. (Dordrecht: Springer), 19. doi: 10.1007/978-94-017-3286-4_18
Durán L. A., Blair M. W., Giraldo M. C., Macchiavelli R., Prophete E., Nin J. C., et al. (2005). Morphological and molecular characterization of common bean landraces and cultivars from the caribbean. Crop Sci. 45, 1320–1328. doi: 10.2135/cropsci2004.0501
Eke P., Wakam L. N., Fokom R., Ekounda T. V., Bedine-Boat M. A., keumoe R., et al. (2020). Common bean (Phaseolus vulgaris L.) root rot in humid lowland: Occurrence, and assessment of biotic and agronomic factors for mitigation prospects. Rhizosphere 16, 100256. doi: 10.1016/j.rhisph.2020.100256
Fisseha Z., Tesfaye K., Dagne K., Blair M. W., Harvey J., Kyallo M., et al. (2016). Genetic diversity and population structure of common bean (Phaseolus vulgaris L) germplasm of Ethiopia as revealed by microsatellite markers. Afr. J. Biotechnol. 15, 2824–2847. doi: 10.5897/AJB2016.15464
Gepts P., Aragão F., Barros E. (2008). ““Genomics of Phaseolus beans, a major source of dietary protein and micronutrient”,” in Genomics of tropical crop plants. Eds. Moore P. H., Ming R. (Berlin: Springer), 113–143.
Gepts P., Osborn T. C., Rashka T., Bliss F. A. (1986). Phaseolin protein variability in wild forms and landraces of the common bean (Phaseolus vulgaris L.): Evidence for multiple centers of domestication. Econ. Bot. 40, 451–468. doi: 10.1007/BF02859659
Kaiser H. F. (1961). A note on guttman’s lower bound for the number of common factors. Br. J. Stat. Psychol. 14, 1–2. doi: 10.1111/j.2044-8317.1961.tb00061.x
Katungi E., Farrow A., Chianu J., Sperling L., Beebe S. (2009). Common bean in eastern and southern africa: A situation and outlook analysis. 61. Colombia, International Centre for Tropical Agriculture (CIAT)
Khaidizar M. I., Halıloglu K., Elkoca E., Aydın M., Kantar F. (2012). Genetic diversity of common bean (Phaseolus vulgaris L.) landraces grown in northeast anatolia of Turkey assessed with simple sequence repeat markers. Turkish J. Field Crop 17, 145–150.
Koenig R., Gepts P. (1989). Allozyme diversity in wild Phaseolus vulgaris: further evidence for two major centers of genetic diversity. Theoret. Appl. Genet. 78, 809–817. doi: 10.1007/BF00266663
Koinange E. M. K., Singh S. P., Gepts P. (1996). Genetic control of the domestication syndrome in common bean. Crop Sci. 36, 1037 –1045. doi: 10.2135/cropsci1996.0011183X003600040037x
Kouam E. B., Ndomou M., Gouado I., Pasquet R. S. (2017). Assessment of the genetic diversity of cultivated common beans (Phaseolus vulgaris L.) from Cameroon and Kenya using allozymes markers. J. Exp. Biol. Agric. Sci. 5, 87–97. doi: 10.18006/2017.5(1).087.097
Leakey C. L. A. (1988). ““Genotypic and phenotypic markers in common bean”,” in Genetic resources of Phaseolus beans. Ed. Gepts P. (Dordrecht, Netherlands: Kluwer), 245–327.
Lemessa F., Tesfaye A. (2005). Evaluation of bean (Phaseolus vulgaris) genotypes for multiple resistances to angular and floury leaf spot diseases. Trop. Sci. 45, 63–66. doi: 10.1002/ts.50
Lima M.S., Souza-Carneiro J. E., Souza-Carneiro P. C., Pereira C. S., Vieira R. F., Cecon P. R. (2012). Characterization of genetic variability among common bean genotypes by morphological descriptors. Crop Breed. Appl. Biotechnol. 12, 76–84. doi: 10.1590/s1984-70332012000100010
Loko L. E. Y., Orobiyi A., Adjatin A., Akpo J., Toffa J., Djedatin G., et al. (2018). Morphological characterization of common bean (Phaseolus vulgaris L.) landraces of Central region of Benin Republic. J. Plant Breed. Crop Sci. 10, 304–318. doi: 10.5897/JPBCS2018.0766
Long J., Zhang J., Zhang X., Wu J., Chen H., Wang P., et al. (2020). Genetic diversity of common bean (Phaseolus vulgaris L.) germplasm resources in chongqing, evidenced by morphological characterization. Front. Genet. 11. doi: 10.3389/fgene.2020.00697
Lupton F. G. H. (1968). The use of resistant varieties in crop protection, pest articles & News summaries. Section B. Plant Dis. Control. 14, 226–238. doi: 10.1080/05331846809432301
Mahalanobis P. C. (1936). On the generalized distance in statistics. Proc. Natl. Inst. Sci. India 2, 49–55.
Merrick L. F., Herr A. W., Sandhu K. S., Lozada D. N., Carter A. H. (2022). Optimizing plant breeding programs for genomic selection. Agronomy 12, 714. doi: 10.3390/agronomy12030714
Mershaab Z., Haub B. (2008). Effects of bean rust (Uromyces appendiculatus) epidemics on host dynamics of common bean (Phaseolus vulgaris). Plant Pathol. 57, 674–686. doi: 10.1111/j.1365-3059.2008.01827.x
Meza N., Rosas J. C., Martin J. P., Ortiz M. J. (2013). Biodiversity of common bean (Phaseolus vulgaris L.) in Honduras, evidenced by morphological characterization. Genet. Resour. Crop Evol. 60, 1329–1336. doi: 10.1007/s10722-012-9922-7
Mohammadi S. A., Prasanna B. M. (2003). Analysis of genetic diversity in crop plants-salient statistical tools and considerations. Crop Sci. 43, 1235–1248. doi: 10.2135/cropsci2003.1235
Nasar S., Shaheen H., Murtaza G., Tinghong T., Arfan M., Idrees M. (2023). Socioeconomic evaluation of common bean (Phaseolus vulgaris L.) cultivation in providing sustainable livelihood to the mountain populations of kashmir himalayas. Plants 12, 213. doi: 10.3390/plants12010213
Ngueguim M., Mekontchou T., Fobasso M., Nounamo L. (2011). Influence of time of planting on yield and grain quality of bean genotypes grown on an andosol in the western highlands of Cameroon. Afr. Crop Sci. J. 19, 247–254.
Okii D., Tukamuhabwa P., Odong T., Namayanja A., Mukabaranga J., Paparu P., et al. (2014). Morphological diversity of tropical common bean germplasm. Afr. Crop Sci. J. 22, 59–67.
Piergiovanni A. R., Lioi L. (2010). Italian common bean landraces: history, genetic diversity and seed quality. Diversity 2, 837–862. doi: 10.3390/d2060837
Rana J. C., Sharma T. R., Tyagi R. K., Chahota R. K., Gautam N. K., Singh M., et al. (2015). Characterisation of 4274 accessions of common bean (Phaseolus vulgaris L.) germplasm conserved in the Indian gene bank for phenological, morphological and agricultural traits. Euphytica 205, 441–457. doi: 10.1007/s10681-015-1406-3
Saba I., Sofi P. A., Zeerak N. A., Bhat M. A., Mir R. R. (2016). Characterisation of a core set of common bean (Phaseolus vulgaris L.) germplasm for seed quality traits. Sabrao J. Breed. Genet. 48, 359–376.
Sakhravi A., Dehdari M., Fahliani R. A. (2023). Genetic relationships among common bean (Phaseolus vulgaris L) genotypes using ISSR markers. Gene Rep. 32, 101797. doi: 10.1016/j.genrep.2023.101797
Santalla M., Rodiño P., De Ron M. (2002). Allozyme evidence supporting southwestern Europe as a secondary center of genetic diversity for the common bean. Theor. Appl. Genet. 104, 934–944. doi: 10.1007/s00122-001-0844-6
Sanyang S. F., Yaouba A., Kinge T. R., Tankou C. M. (2019). Survey of cultural practices and assessment of some foliar fungi diseases of common bean (Phaseolus vulgaris L.) in the western highlands of Cameroon. Journal of Advances in Biology & Biotechnology 22, 1–15. doi: 10.9734/jabb/2019/v22i130105
Schmutz J., McClean P. E., Mamidi S., Wu G. A., Cannon S. B., Grimwood J., et al. (2014). A reference genome for common bean and genome-wide analysis of dual domestications. Nat. Genet. 46, 707–713. doi: 10.1038/ng.3008
Schoonhoven A. V., Pastor-Corrales M. A. (1987). Standard system for the evaluation of bean germplasm (Cali, CO: Centro International Agricultural Tropical (CIAT), 56.
Serrato-Diaz L. M., Navarro-Monserrat E. D., Rosas J. C., Chilagane L. A., Bayman P., Porch T. G. (2020). Phylogeny of Pseudocercospora griseola from Puerto Rico, Central America and Tanzania confirms the existence of an Afro-Andean clade. Eur. J. Plant Pathol. 157, 533–547. doi: 10.1007/s10658-020-02015-8
Sharma J. R. (1988). Statistical and biometrical techniques in plant breeding (New Delhi, India: New Age International Limited Publishers), 432.
Sharma K. D., Kaushal R. P., Singh B. M. (1996). Relationship between different resistance parameters in french bean to floury leaf spot caused by Mycovellosiella phaseoli (Drummond) Deighton. Crop Prot. 15, 101–103. doi: 10.1016/0261-2194(95)00055-0
Sharma P. N., Banyal K., Rana J. C., Nag R., Sharma S. K., Pathania A. (2012). Screening of common bean germplasm against Colletotrichum lindemuthianum causing bean anthracnose. Indian Phytopathol. 65, 99–102.
Singh S. P. (1989). Patterns of variation in cultivated common bean (Phaseolus vulgaris, Fabaceae). Econ. Bot. 43, 39–57. doi: 10.1007/BF02859324
Singh S. P., Gepts P., Debouck D. G. (1991). Races of common bean (Phaseolus vulgaris, Fabaceae). Econ. Bot. 45, 379–396. doi: 10.1007/BF02887079
Siri B. N., Joyce B. E., Ambe T. E., Molua E. L. (2017). Understanding the production and sales determinants of haricot beans (Phaseolus vulgaris L.) in the Western Highlands of Cameroon. Int. J. Dev. Res. 7, 15126–15133.
Siri B. N., Nchanji E. B., Tchouamo I. R. (2020). A gender analysis on the participation and choice of improved and local haricot bean (Phaseolus vulgaris L.) by farmers in Cameroon. Agric. Sci. 11, 1199–1216. doi: 10.4236/as.2020.1112079
Sofi P. A., Wani S. A., Zargar M. Y., Sheikh F. A., Saba I., Shafi T. (2014). Genetic variability and factor analysis in common bean (Phaseolus vulgaris L.) germplasm collection for yield related traits. Electronic Journal of Plant Breeding 5, 254–259.
Stoilova T., Pereira G., Tavares-de-Sousa M. (2013). Morphological characterization of a small common bean (Phaseolus vulgaris L.) collection under different environments. J. Cent. Eur. Agric. 14, 1–11. doi: 10.5513/JCEA01/14.3.1277
Stoilova T., Pereira G., Tavares-de-Sousa M. M., Carnide V. (2005). Diversity in common bean landraces (Phaseolus vulgaris L.) from Bulgaria and Portugal. J. Cent. Eur. Agric. 6, 443–448.
Subramanian A., Subbaraman N. (2010). Hierarchical cluster analysis of genetic diversity in maize germplasm. Electronic Journal of Plant Breeding 1, 431–436.
Uebersax M. A., Cichy K. A., Gomez F. E., Porch T. G., Heitholt J., Osorno J. M., et al. (2023). Dry beans (Phaseolus vulgaris L.) as a vital component of sustainable agriculture and food security - A review. Legume Sci. 5, e155. doi: 10.1002/leg3.155
Ullah M. Z., Hasan M. J., Chowdhury A. Z. M. K. A., Saki A. I., Rahman A. H. M. A. (2012). Genetic variability and correlation in exotic cucumber (Cucumis sativus L.) varieties. Bangladesh Journal of Plant Breeding and Genetics 25, 17–23. doi: 10.3329/bjpbg.v25i1.17008
Ulukapi K., Onus A. N. (2014). Phenotypic evaluation of some Turkish green bean (Phaseolus Vulgaris L.) Genotypes. Pak. J. Bot. 46, 1415–1420.
Ward J. H. (1963). Hierarchical grouping to optimize an objective function. J. Am. Stat. Assoc. 58, 236–244. doi: 10.1080/01621459.1963.10500845
Wells W. C., Isom W. H., Waines J. G. (1988). Outcrossing rates of six common bean lines. Crop Sci. 28, 177–178. doi: 10.2135/cropsci1988.0011183X002800010038x
Zhang J., Sui C., Liu H., Chen J., Han Z., Yan Q., et al. (2021). Effect of chlorophyll biosynthesis-related genes on the leaf color in Hosta (Hosta plantaginea Aschers) and tobacco (Nicotiana tabacum L.). BMC Plant Biol. 21, 45. doi: 10.1186/s12870-020-02805-6
Keywords: Cameroon, common bean, morpho-agronomic characterization, genetic divergence, disease resistance, genetic improvement
Citation: Kouam EB, Djeugap-Fovo J, Meka-Sindje S, Afsah NMM, Meyia A, Babagnack BF, Nouteka NKJ and Galani-Yamdeu JH (2023) Genetic divergence in common bean genotypes from the IRAD gene bank: morpho-agronomic characteristics, fungal and bacterial disease resistance, and opportunities for genetic improvement. Front. Hortic. 2:1289646. doi: 10.3389/fhort.2023.1289646
Received: 06 September 2023; Accepted: 23 October 2023;
Published: 22 November 2023.
Edited by:
Ioannis Ganopoulos, Hellenic Agricultural Organization – ELGO, GreeceReviewed by:
Ifigeneia Mellidou, Hellenic Agricultural Organization – ELGO, GreeceCopyright © 2023 Kouam, Djeugap-Fovo, Meka-Sindje, Afsah, Meyia, Babagnack, Nouteka and Galani-Yamdeu. This is an open-access article distributed under the terms of the Creative Commons Attribution License (CC BY). The use, distribution or reproduction in other forums is permitted, provided the original author(s) and the copyright owner(s) are credited and that the original publication in this journal is cited, in accordance with accepted academic practice. No use, distribution or reproduction is permitted which does not comply with these terms.
*Correspondence: Eric Bertrand Kouam, ZXJpY2Jrb3VhbUB5YWhvby5jb20=; Joseph Djeugap-Fovo, amRqZXVnYXBmb3ZvQHlhaG9vLmZy
Disclaimer: All claims expressed in this article are solely those of the authors and do not necessarily represent those of their affiliated organizations, or those of the publisher, the editors and the reviewers. Any product that may be evaluated in this article or claim that may be made by its manufacturer is not guaranteed or endorsed by the publisher.
Research integrity at Frontiers
Learn more about the work of our research integrity team to safeguard the quality of each article we publish.