 Warren E. Copes
 Peter S. Ojiambo
- 1United States Department of Agriculture, Agricultural Research Service, Poplarville, MS, United States
- 2Center for Integrated Fungal Research, Department of Entomology and Plant Pathology, North Carolina State University, Raleigh, NC, United States
Introduction: A quantitative review was performed on the effectiveness of peroxygen products that contain hydrogen peroxide (HP), peracetic acid (PAA) and potassium peroxy-monosulfate (PPMS) to eliminate non-fungal plant pathogens in agricultural and horticultural cropping systems.
Methods: This quantitative analysis is a complementary follow-up to a previous study on efficacy of peroxygen against fungal plant pathogens. The meta-analysis evaluated the biocidal activity of peroxygen intervention treatments against 15 different non-fungal plant pathogens in 81 studies compared to independent non-treated controls that were conducted over the last 30 years.
Results: The overall summary effect size was a Hedges’ g () of 1.98 for the random effects model, which indicates that peroxgen treatments caused a moderate to high reduction in viable propagules or disease progression in most cases. The range in efficacy was defined by the 95% prediction intervals (-0.82 to 4.80) and indicated peroxygen applications would range from ineffective to very highly effective in 95% of similar populations. Peroxygen compounds provided similar control (P = 0.5655) against bacteria, oomycetes and viruses, while being more effective against zygomycetes (P = 0.0001) than other organism types. Differences were observed between peroxygen active ingredients (a.i.) (P = 0.0203), where PPMS was more effective than HP + PAA. Differences were also observed when peroxygen compounds were applied on different target materials (P = 0.0004). Peroxygen compounds were moderately effective against non-fungal plant pathogens when applied in solution and on metal surfaces but ineffective when applied on plants under crop production conditions. Differences between target materials explained 50% of the true variances in a meta-regression model with the length of time peroxygens were in contact with target materials (P = 0.0416).
Discussion: These results show that although the current recommended dose and contact time for commercial peroxygen products are expected to result in pathogen inactivation, their efficacy will likely be influenced by the organism and material being treated. This analysis serves as a base reference for considering efficacy performance of peroxygen compounds against non-fungal plant pathogens.
1 Introduction
Peroxygen compounds were discovered in the early 1800’s and have been used for a range of purposes, including fuel to power torpedoes. Hydrogen peroxide (HP) was first used as a disinfestant in a medical procedure in 1887 (Hugo, 1995) and to treat drinking water in Europe in the 1950’s (Luukkonen and Pehkonen, 2016). The initial registration of peroxygen compounds as pesticides in the United States was in 1968 for potassium peroxymonosulfate (PPMS), in 1977 for hydrogen peroxide (HP) and in 1985 for peracetic acid (PAA) (Anonymous, 1993; Block, 2001). To date, these three compounds are still the primary peroxygen active ingredients used in disinfestants registered for use in agricultural and horticultural settings. The earliest research on testing a peroxygen compound for inactivating a plant pathogen was reported in 1987 and 1991 (Brown, 1987; Brown and Schubert, 1987; Linfield, 1991). A majority of the literature on peroxygen activity against plant pathogens has been published only in the last two decades.
As a plant disease control strategy, disinfestants are used to eliminate or dramatically reduce the persistence of viable pathogen populations on surfaces of production areas, tools and equipment and crop products. The efficacy of peroxygen compounds, like that of other disinfestants, has been reported to vary when used to eliminate propagules of plant pathogens (Copes and Ojiambo, 2021a; Copes and Ojiambo, 2021b; Copes and Ojiambo, 2023a; Copes and Ojiambo, 2023b). This variability in efficacy appears to be evident for peroxygen compounds used to control non-fungal pathogens as well. For example, peroxygen compounds have been reported to control non-fungal plant pathogens over a range of doses (0.008 to 2.3% a.i.) and contact times (10 sec to 60 min) (Koponen et al., 1992; Afek et al., 1999; Lewandowski et al., 2010; Baysal-Gurel et al., 2015; Bernat et al., 2018; Darzi et al., 2020; Chanda et al., 2021). In contrast, a similar range of doses (0.08 to 1.19% a.i.) and contact times (2 sec to 60 min) provided poor to limited control of pathogen propagules in other studies (Koponen et al., 1992; Garton et al., 2008; Coutts et al., 2013; Warfield, 2013; Li et al., 2015; Darzi et al., 2020). Even in earlier studies, Brown (1987) and Brown and Schubert (1987) reported differences in the efficacy of peroxygen compounds, with better control against Xanthomonas campestris pv. vesicatoria than Penicillium digitatum and Phomopsis citri. Environmental conditions such as temperature, organic loads and water hardness, have been reported to reduce efficacy of peroxygen products against other micro-organisms (Merianos, 1991; Gerba, 2015). Demand load reactions of peroxygen products with substrate surfaces and differences in sensitivity to peroxygens can also influence the efficacy against plant pathogens (Nichols and Jodon, 1972; Koponen et al., 1992; Mebalds et al., 1997; Copes et al., 2020). However, these individual studies do not provide a broad evaluation of how different pathogen and application related factors could potentially influence product efficacy. Overall, peroxygen products have been reported to provide good control of plant pathogens but a better understanding of product strengths and limitations when used in agricultural and horticultural applications is still lacking.
Based on the above considerations, the objective of this research was to perform a systematic review and meta-analysis of the efficacy of peroxygen disinfestants to inactivate non-fungal plant pathogens. Systematic reviews are a structured approach to searching databases to find all available literature including negative results pertaining to the subject matter of interest (Borenstein et al., 2009; Li et al., 2012; Schmidt and Hunter, 2015). Meta-analysis is a quantitative statistical methodology to assess the consistency of treatment effects across different studies using an effect size and to determine overall trends (Borenstein et al., 2009; Madden and Paul, 2011; Ngugi et al., 2011a; Scherm et al., 2014). The effect size is a unitless measure that represents the magnitude and precision of each treatment effect compared to an independent control treatment. In this study, the meta-analysis was constructed on a broadly defined question; does peroxygen disinfestants provide consistent inactivation of non-fungal plant pathogens? This question assumes that peroxygen disinfestants have equal activity in all applications and against all taxonomic classifications of non-fungal plant pathogens. This question arises from the fact that product label instructions mainly specify rates based only on the targets of application, such as on nonporous surfaces, tools and plants, with limited reference to pathogen selectivity. If efficacy is not homogenous, then the influence of application-oriented factors such as disinfestant dose, contact time, sensitivity of taxonomic groups, type of substrate being treated, and type of peroxygen compound being applied may need further evaluation to better understand how and why these factors influence efficacy of peroxygen compounds.
2 Materials and methods
2.1 Systematic review
A systematic review of literature on use of peroxygen compounds against non-fungal plant pathogens was conducted in two phases. The first phase was a computerized literature search through the Navigator platform for DigiTop, USDA’s Digital Desktop library that consists of Agricola, AGRIS, Biological Abstracts, BIOSIS, CAB Abstracts, Environmental Complete, FSTA, Geobase, GeoRef, Medline, PubAg, Scopus and Web of Science; and through Google Scholar. The primary keywords used were various forms of the term ‘disinfest’, such as decontaminate, decontamination, disinfect, disinfectant, disinfection, disinfestant, disinfestation, sanitation, sanitize, and sterilant, as each word variation resulted in different search results. Additionally, relevant crops or plant tissues (e.g., apple, corm, crucifer, fruit, legume, potato, tuber), plant diseases (e.g., fire blight, bacterial wilt, black leg, olive knot, potato ring rot), non-fungal plant pathogens (e.g., Erwinia amylovora, E. carotovora, Ralstonia solanacearum, Xanthomonas campestris, Pythium, Phytophthora, Citrus exocortis virus, Potato virus Y, Potyvirus, Tobacco mosaic virus, Tobamovirus, Tomato chlorotic dwarf viroid), and tools and equipments (e.g., dump tank, foot bath, knife, pruning shear, seeder, transplanter) were used in combination with key search terms. In the second phase, additional relevant literature was obtained from the literature cited sections in each and subsequent manuscripts. To avoid selection bias, no attempts were made to distinguish search reports by publication type and hence ‘gray literature’ from non-peer reviewed sources were also considered (Pullin and Stewart, 2006). The systematic review process of the literature was atypical in that it was conducted over an extended period between October 2017 and January 2023. The quantitative analysis work started as a secondary activity that later developed into successional projects.
A total of 544 reports from the literature search were evaluated for inclusion in this study. To be included in this quantitative review, these reports were screened using a four-step process (Figure 1) involving five established criteria that are described in detail elsewhere (Copes and Ojiambo, 2021a; Copes and Ojiambo, 2021b; Copes and Ojiambo, 2023a; Copes and Ojiambo, 2023b). Product efficacy was evaluated based on a direct comparison between application of a peroxygen compound intervention and an independent non-treated control. More specifically, efficacy was assessed by either: i) inactivation of non-fungal plant pathogen propagules, ii) reduction in plant disease development or iii) postharvest decay caused by a non-fungal plant pathogen following disinfestation treatment. A workable description of the disinfestant application methodology was required. For most applications, the peroxygen compound needed to have had a contact time with the target material of no longer than 60 min. An exception was made for post-harvest applications where a contact time longer than 60 minutes was essential for efficacy. Preferably, pathogens were identified by the binomial name. Exceptions were made for Pythium spp. (Koponen et al., 1992; Ali, 2018) and Rhizopus spp. (Bernat et al., 2018) isolates, which were directly correlated with necrosis. Finally, data had to include a quantitative or qualitative numerical assessment from which an effect size and variance measurement could be generated.
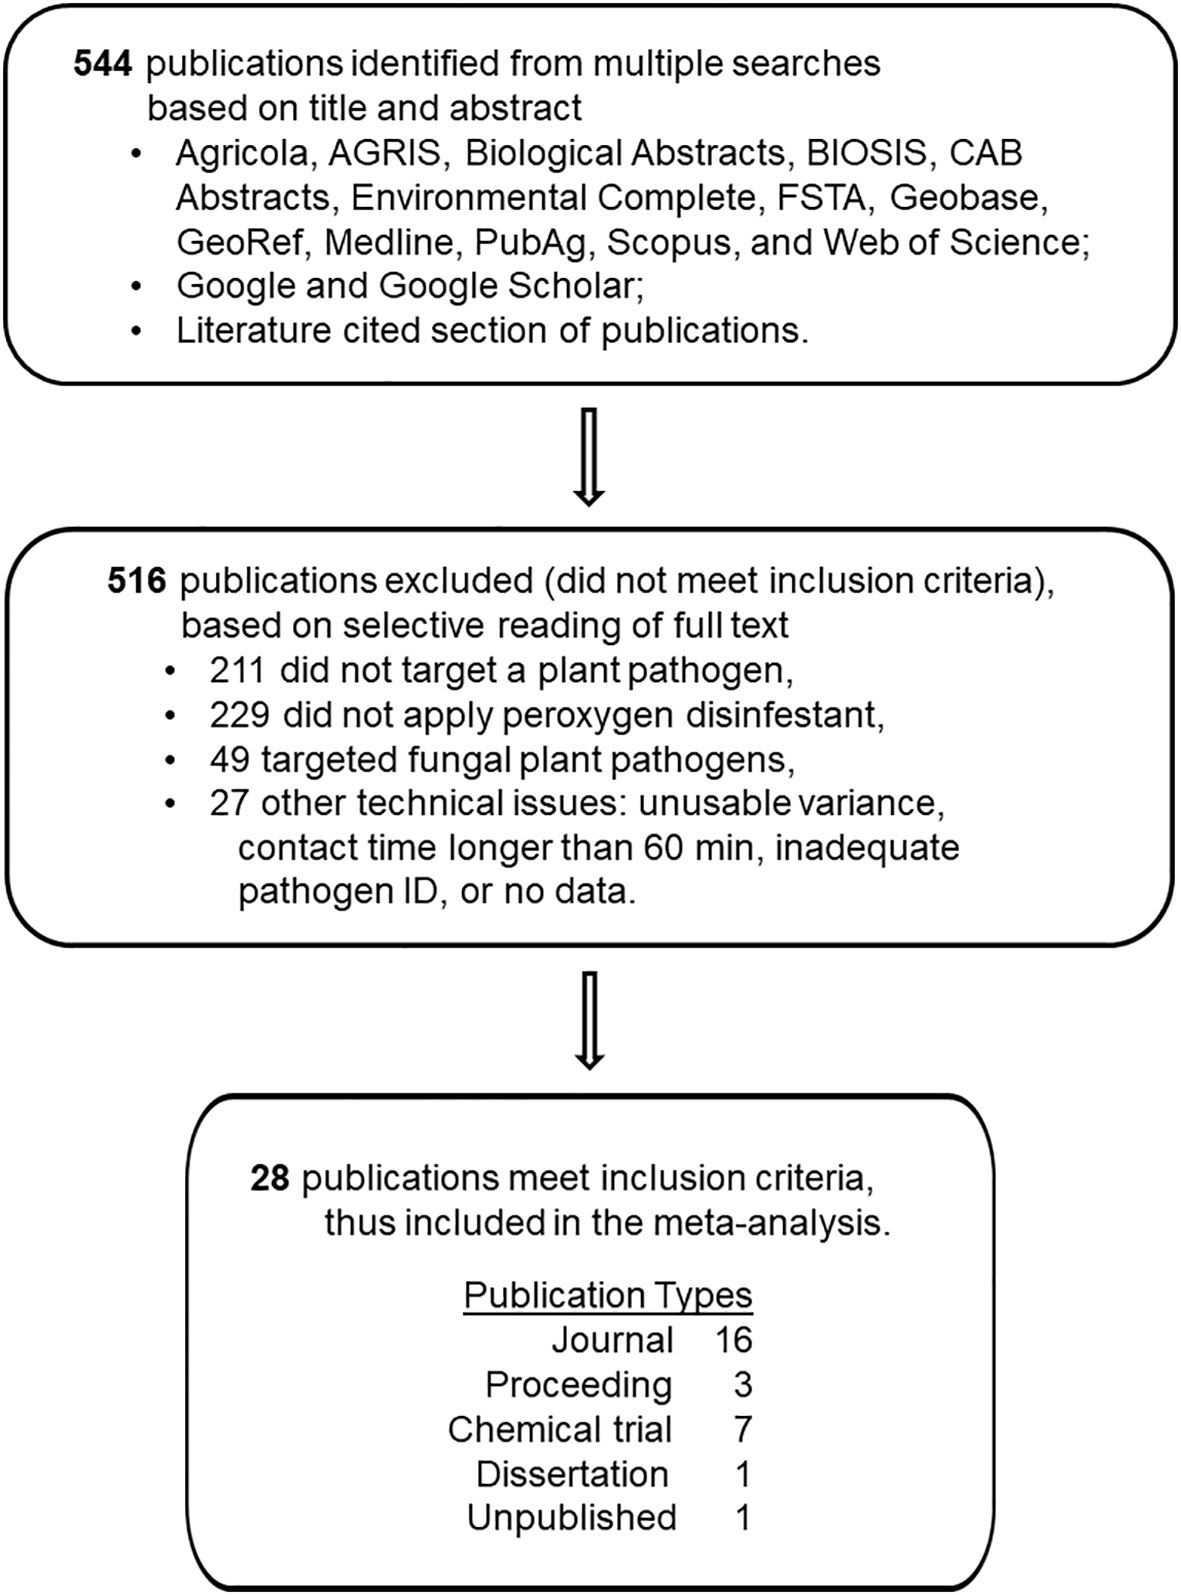
Figure 1 Schematic depiction of the number of studies reviewed, number of studies excluded, reasons for exclusion, and number of studies retained for use in the quantitative synthesis of the disinfestant efficacy of peroxygen compounds against non-fungal plant pathogens.
A total of 28 reports published between 1992 and 2021 met the above criteria (Figure 1; Supplementary Information.docx). The inclusion process identified 333 reports pertaining to control of plant pathogens with disinfestants, but then excluded 229 reports that involved application of other than a peroxygen compound, 49 reports that involved fungal pathogens and 27 reports that had other technical inconsistencies. From these reports, a total of 81 ‘studies’ (i.e., peroxygen treatment-study combinations) were compiled in the final database that comprised 18 studies on bacteria, 17 on oomycetes, 39 on viruses and 7 on zygomycetes (Supplementary Datafile.xlsx). Reports excluded from the final database for the meta-analysis either lacked sufficient statistical information or did not provide a direct independent comparison between a control and a peroxygen intervention treatment.
2.2 Peroxygen compounds tested
Eighteen different peroxygen products that contained HP, PAA, HP+PAA, or PPMS were evaluated in the meta-analysis (Table 1). Additionally, a Supplementary File (Supplementary Information.docx) contains a table listing select product label doses and relative categorical ratings of the doses by product (Supplementary Table 2).
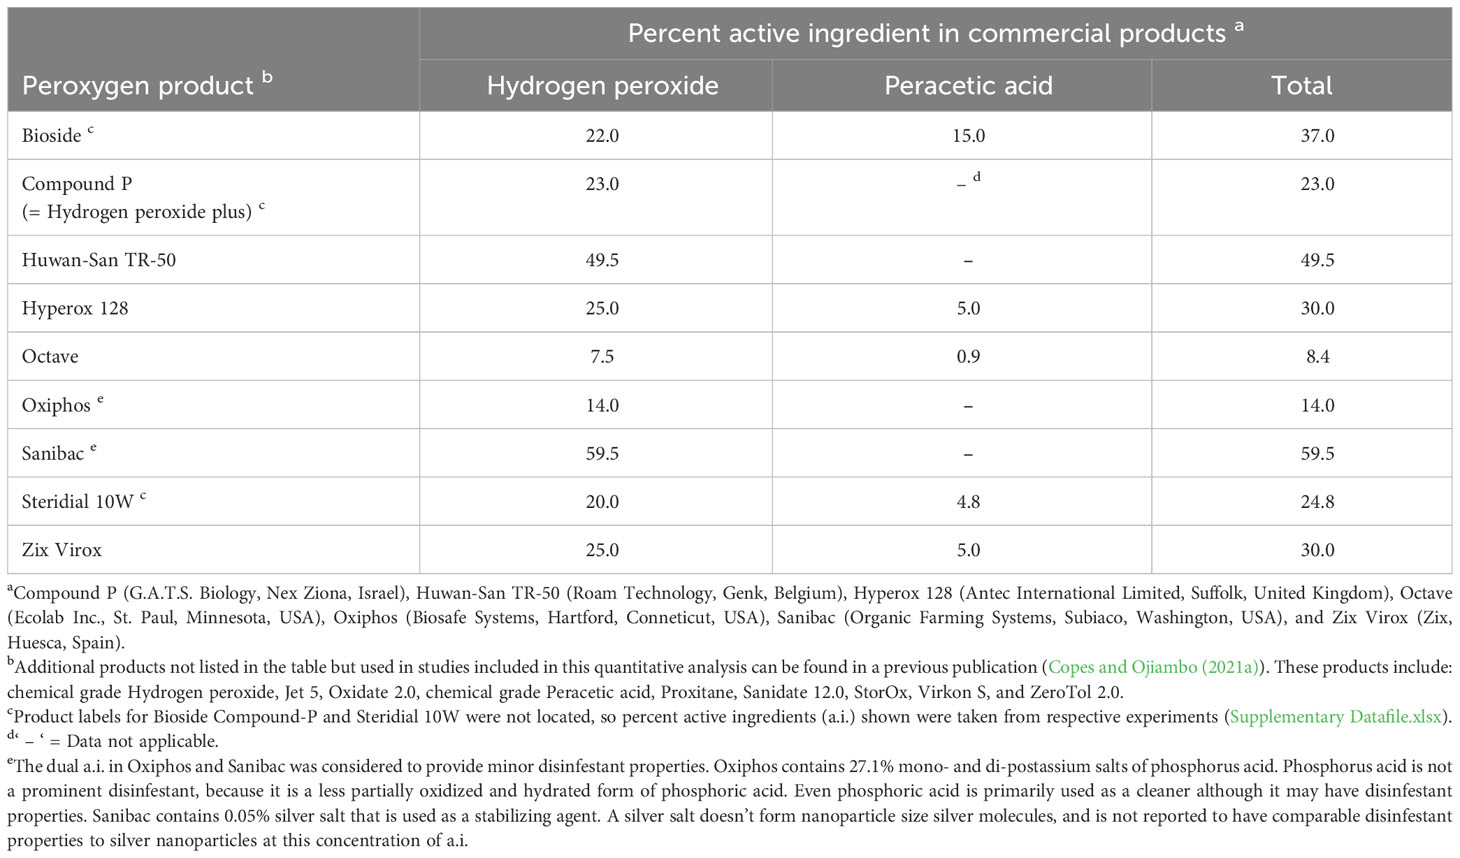
Table 1 Percent active ingredient composition of commercial peroxygen compounds used in the synthesis of studies on the use of these products as disinfestants of non-fungal plant pathogens.
2.3 Data acquisition
All efficacy results were data recorded at a single time point during or at the end of a trial as dictated by trial design. Multiple study characteristics were taken from a single report only when each had an independent control treatment. If multiple study characteristics provided the same difference in efficacy with an increase in dose or time, then only the lowest dose or shortest time treatment was selected to avoid putting more weight to results from a single experiment.
For a study reporting standard errors or least significant differences based on t-tests, variances were converted to standard deviation values (Cumming et al., 2007). Where the residual variance was not reported, it was calculated from Fisher’s least significant difference values reported in the study, as described by Ngugi et al. (2011b). For reports where means and variances were presented in graphs or bar charts, values were transcribed using digital calipers (Fisherbrand ISO 17025, Pittsburg, PA) (Copes and Ojiambo, 2021a; Copes and Ojiambo, 2021b). Intervention treatments with a mean of zero and a variance of zero had their means adjusted by adding a correction factor of 0.5 for percentage or count data and 0.005 for proportional data (Friedrich et al., 2007; Cheng et al., 2016). In such a case, the variance for the untreated control was used as the variance for the intervention treatment. For a report with zero variance, where the untreated control mean had a maximum value of a scale, such as 100 or 1, and the intervention treatment had a mean of zero, values were entered as binomial data of the number of viable or non-diseased outcomes.
2.4 Effect size and data synthesis
Hedges’ g, an unbiased standardized mean difference (Hedges, 1981), was the metric used to estimate effect size in this study. For studies with binomial data, an effect size was first computed as the log odds ratio and then converted to Hedges’ g (Borenstein et al., 2009). Hedges’ g was calculated as follows (Borenstein et al., 2009): , where and are the mean disease intensity or propagule viability for the treated and untreated experimental units, respectively. The parameter σpooled is the pooled standard deviation estimate and was estimated as described by Rosnow and Rosenthal (1996). The term J is a correction factor for bias due to a small sample size and was calculated as described by Hedges and Olkin (1985). A positive Hedges’ g value indicates a higher efficacy for the product treatment than the untreated control, with large values of g indicating a strong difference between the treated and untreated control. Values of Hedges’ g = 0.5, 1.0 and 2.0 represent a ‘small’, ‘medium’, and ‘large’ effect, respectively, while g > 4.0 represents a ‘very large’ effect (Durlak, 2009). Meta-analysis was performed using Comprehensive Meta-Analysis 3.0 software (CMA version 4.0, Biostat, Englewood, NJ, USA).
The overall mean effect size () was estimated using a random-effects (RE) model. The RE model was used since the population of studies evaluated in this synthesis represented a diverse population of plant pathogens, production systems, research conditions, experiment designs and data scales (Borenstein et al., 2009). Heterogeneity of effect sizes was characterized using Q-statistics, which include Q, I2 and τ2 (Higgins and Thompson, 2002), and the 95% prediction interval (Borenstein, 2019). Each of these statistics define complementary but unique measures of heterogeneity. The statistic Q provides a standardized measure of the observed variance in effect sizes but is not in the metric of the effect sizes. The statistic I2 is a ratio of the variance in true effect sizes attributable to heterogeneity across the total observed variance. Thus, I2 = 0% indicates the total variance is attributable to sampling error (the within-study variance), while I2 = 25, 50 and 75% indicate a low, moderate and high proportion of the total variance, respectively, attributable to true effects (Higgins et al., 2003). Finally, the statistic τ2 is the between-study variance of true effect sizes in the actual metric of the effect size and was interpreted as described by Durlak (2009). The 95% prediction interval, explained in the following section, is the measure of how much the effect size actually varies across populations, not I2 or τ2.
2.5 Subgroup analysis of categorical moderator variables
Four categorical moderator variables (organism type, genus, peroxygen a.i. and target material), were defined to determine if specific pathogen-related or application-oriented factors influenced peroxygen efficacy using subgroup analysis (Copes and Ojiambo, 2021b). The initial subgroup analysis was conducted on organism type, which consisted of four subgroups of plant pathogens, i.e., bacteria (k = 18), oomycetes (k = 17), viruses (k = 39) and zygomycetes (k = 7). All subsequent subgroup and meta-regression analyzes were conducted on datasets of treatment effects on the bacteria, oomycetes and viruses composite (= BacOoVir) and not on zygomycetes. Additionally, studies were re-evaluated for inclusion in each analysis to consider impact from influential data points from either excessively high doses, excessively high contact times or subgroups within a set of a categorical moderator having less than four studies. A small number of high doses and high contact times within a subgroup relative to the range of other data points provided too high of influence that affected accuracy of meta-regression analyzes. For the genera and peroxygen a.i. moderators of the BacOoVir composite, studies were removed due to either high dose (k = 4), high contact time (k = 5) or subgroups with less than four studies (k = 14). The BacOoVir genera examined were Clavibacter (k = 6), Pseudomonas (k = 4), Phytophthora (k = 5), Pythium (k = 6), Pospiviroid (k = 5) and Tobamovirus (k = 29). The BacOoVir peroxygen a.i. examined were HP (k = 4), HP+PAA (k = 24) and PPMS (k = 27). For analyzes on the BacOoVir target moderator, studies were removed due to high dose (k = 4), high contact time (k = 5) and subgroups with less than four studies (k = 19). Target subgroup materials examined for BacOoVir were metal (k = 16), plant (k = 4), and solution (k = 30). The solution subgroup was comprised of various water sources with plant pathogen propagules in suspension.
Subgroup analysis was performed individually on each categorical moderator variable to evaluate differences in subgroup effect sizes as described by Copes and Ojiambo (2021b). Briefly, the null hypothesis that all subgroups were equal was tested using the Q-test for heterogeneity (Borenstein et al., 2009), where the statistics I2 and τ2 test differences in heterogeneity between studies within subgroups. A pooled estimate of τ2 was used for all subgroup analyzes because some subgroups consisted of less than ten studies (Borenstein, 2019). Direct pairwise comparisons of subgroup means were made using a Z-test and comparisons were considered statistically different if the P-value was less than the Bonferroni correction for multiple pairwise comparisons (Borenstein, 2019). The 95% prediction interval for and subgroup was calculated using the RE model as described by Borenstein (2019).
2.6 Meta-regression of moderator variables
Meta-regression (Borenstein et al., 2009; Madden and Paul, 2011) was used to assess the effects of continuous and categorical moderators on peroxygen efficacy using a RE model as described by Copes and Ojiambo (2021a; 2021b). Briefly, a full meta-regression model consisted of an intercept (βo), a continuous moderator as the second term, a continuous or categorical (set of subgroups) moderator as the third term, an interaction between the two moderators as the fourth term only if significant, and the random effects term (Copes and Ojiambo, 2021a; Copes and Ojiambo, 2021b). Thus, with two continuous moderators and three categorical moderators, a total of seven meta-regression models with two explanatory variables were performed for each organism type to evaluate all combinations. Sample size for each meta-analysis was dependent on the categorical moderator due to exclusion of subgroups with a sample size less than four, as explained above in the subgroup analysis section. Additionally, for each subgroup within the categorical moderator was compared to the reference subgroup of the set. In this case, β0 in the RE meta-regression represents the reference subgroup and the coefficient equals the predictive for the reference subgroup. Further, an R2-analog was calculated with the incremental addition of each model term and each subgroup within the set of a categorical moderator. The R2-analog is the ratio of the between-study variance in true effect sizes explained by the model to the total variance in true effect sizes. This provides an evaluation of the proportion of true variance explained by moderator variables and subgroups in the model that was considered important for evaluating impact of the moderators (Borenstein et al., 2009). For simplicity, the R2-analog in this study is referred to as R2.
Continuous and categorical moderators were rescaled or re-coded, respectively, within each organism type and categorical moderator dataset. Continuous variables (dose and time) were rescaled to have a mean of zero, where zero represents a meaningful value within a balanced range of negative and positive values. This allows for substantive interpretation of interactions and reduces but does not eliminate correlation problems due to clustered data values (Aiken and West, 1991; Borenstein et al., 2009). Categorical moderators were re-coded for the entire set of subgroups affiliated with genus, peroxygen a.i. or target moderators, where a subgroup was dummy coded with a value of 1 for all relevant studies and 0 otherwise (Copes and Ojiambo, 2021a,b). Thus, interaction values were generated between continuous and categorical variables specifically for the studies with a dummy code of 1.
2.7 Small-study bias
Funnel plots and the Egger’s regression test (Egger et al., 1997; Borenstein et al., 2009) were used to evaluate reporting bias in this study. In the absence of reporting bias, a funnel plot will be symmetrical in shape, with the data points scattered in the shape of a funnel centrally around , while the plot will be asymmetrical in the presence of reporting bias. The null hypothesis for the Eggers’s test is that plot symmetry exists, with the alternative indicating asymmetry is present. In case of significant asymmetry, the trim and fill method (Duval and Tweedie, 2000) was used to calculate the number of studies assumed to be missing due to publication bias, to estimate their effect sizes and standard errors and to recompute an estimate of and its 95% confidence interval. The trim and fill method provides a simple, commonly used method to investigate asymmetry due to publication bias. However, this method does not address distribution asymmetry due to heterogeneity, thus it was used more as a form of sensitivity analysis. In this study, statistically more complex methods (Hedges and Vera, 2005; Koricheva et al., 2013; Shi and Lin, 2019) were not investigated to evaluate what factors affected any observed asymmetry.
3 Results
3.1 Product efficacy and standardized mean effect size
Values of g across the 81 studies that were examined ranged from -0.8 to 12.7 (Figure 2. Supplementary Datafile.xlsx) and the distribution of g was overall, symmetrical around the mean effect size (Figure 3). When peroxygen efficacy was expressed as the difference in suppression between an untreated control and a treatment intervention (for continuous data) or the difference in frequency of recovery between an untreated control and a treatment intervention (for binomial data), studies with a g <0.5 had a percent control <11%, studies with a g of 2 to 4 had a percent control >56%, while studies with a g >4 had a percent control >74% with one outlier value of 37% (Figure 4). Heterogeneity existed in these data sets (Tables 2–4) but only limited reference is made about heterogeneity in the results and discussion sections.
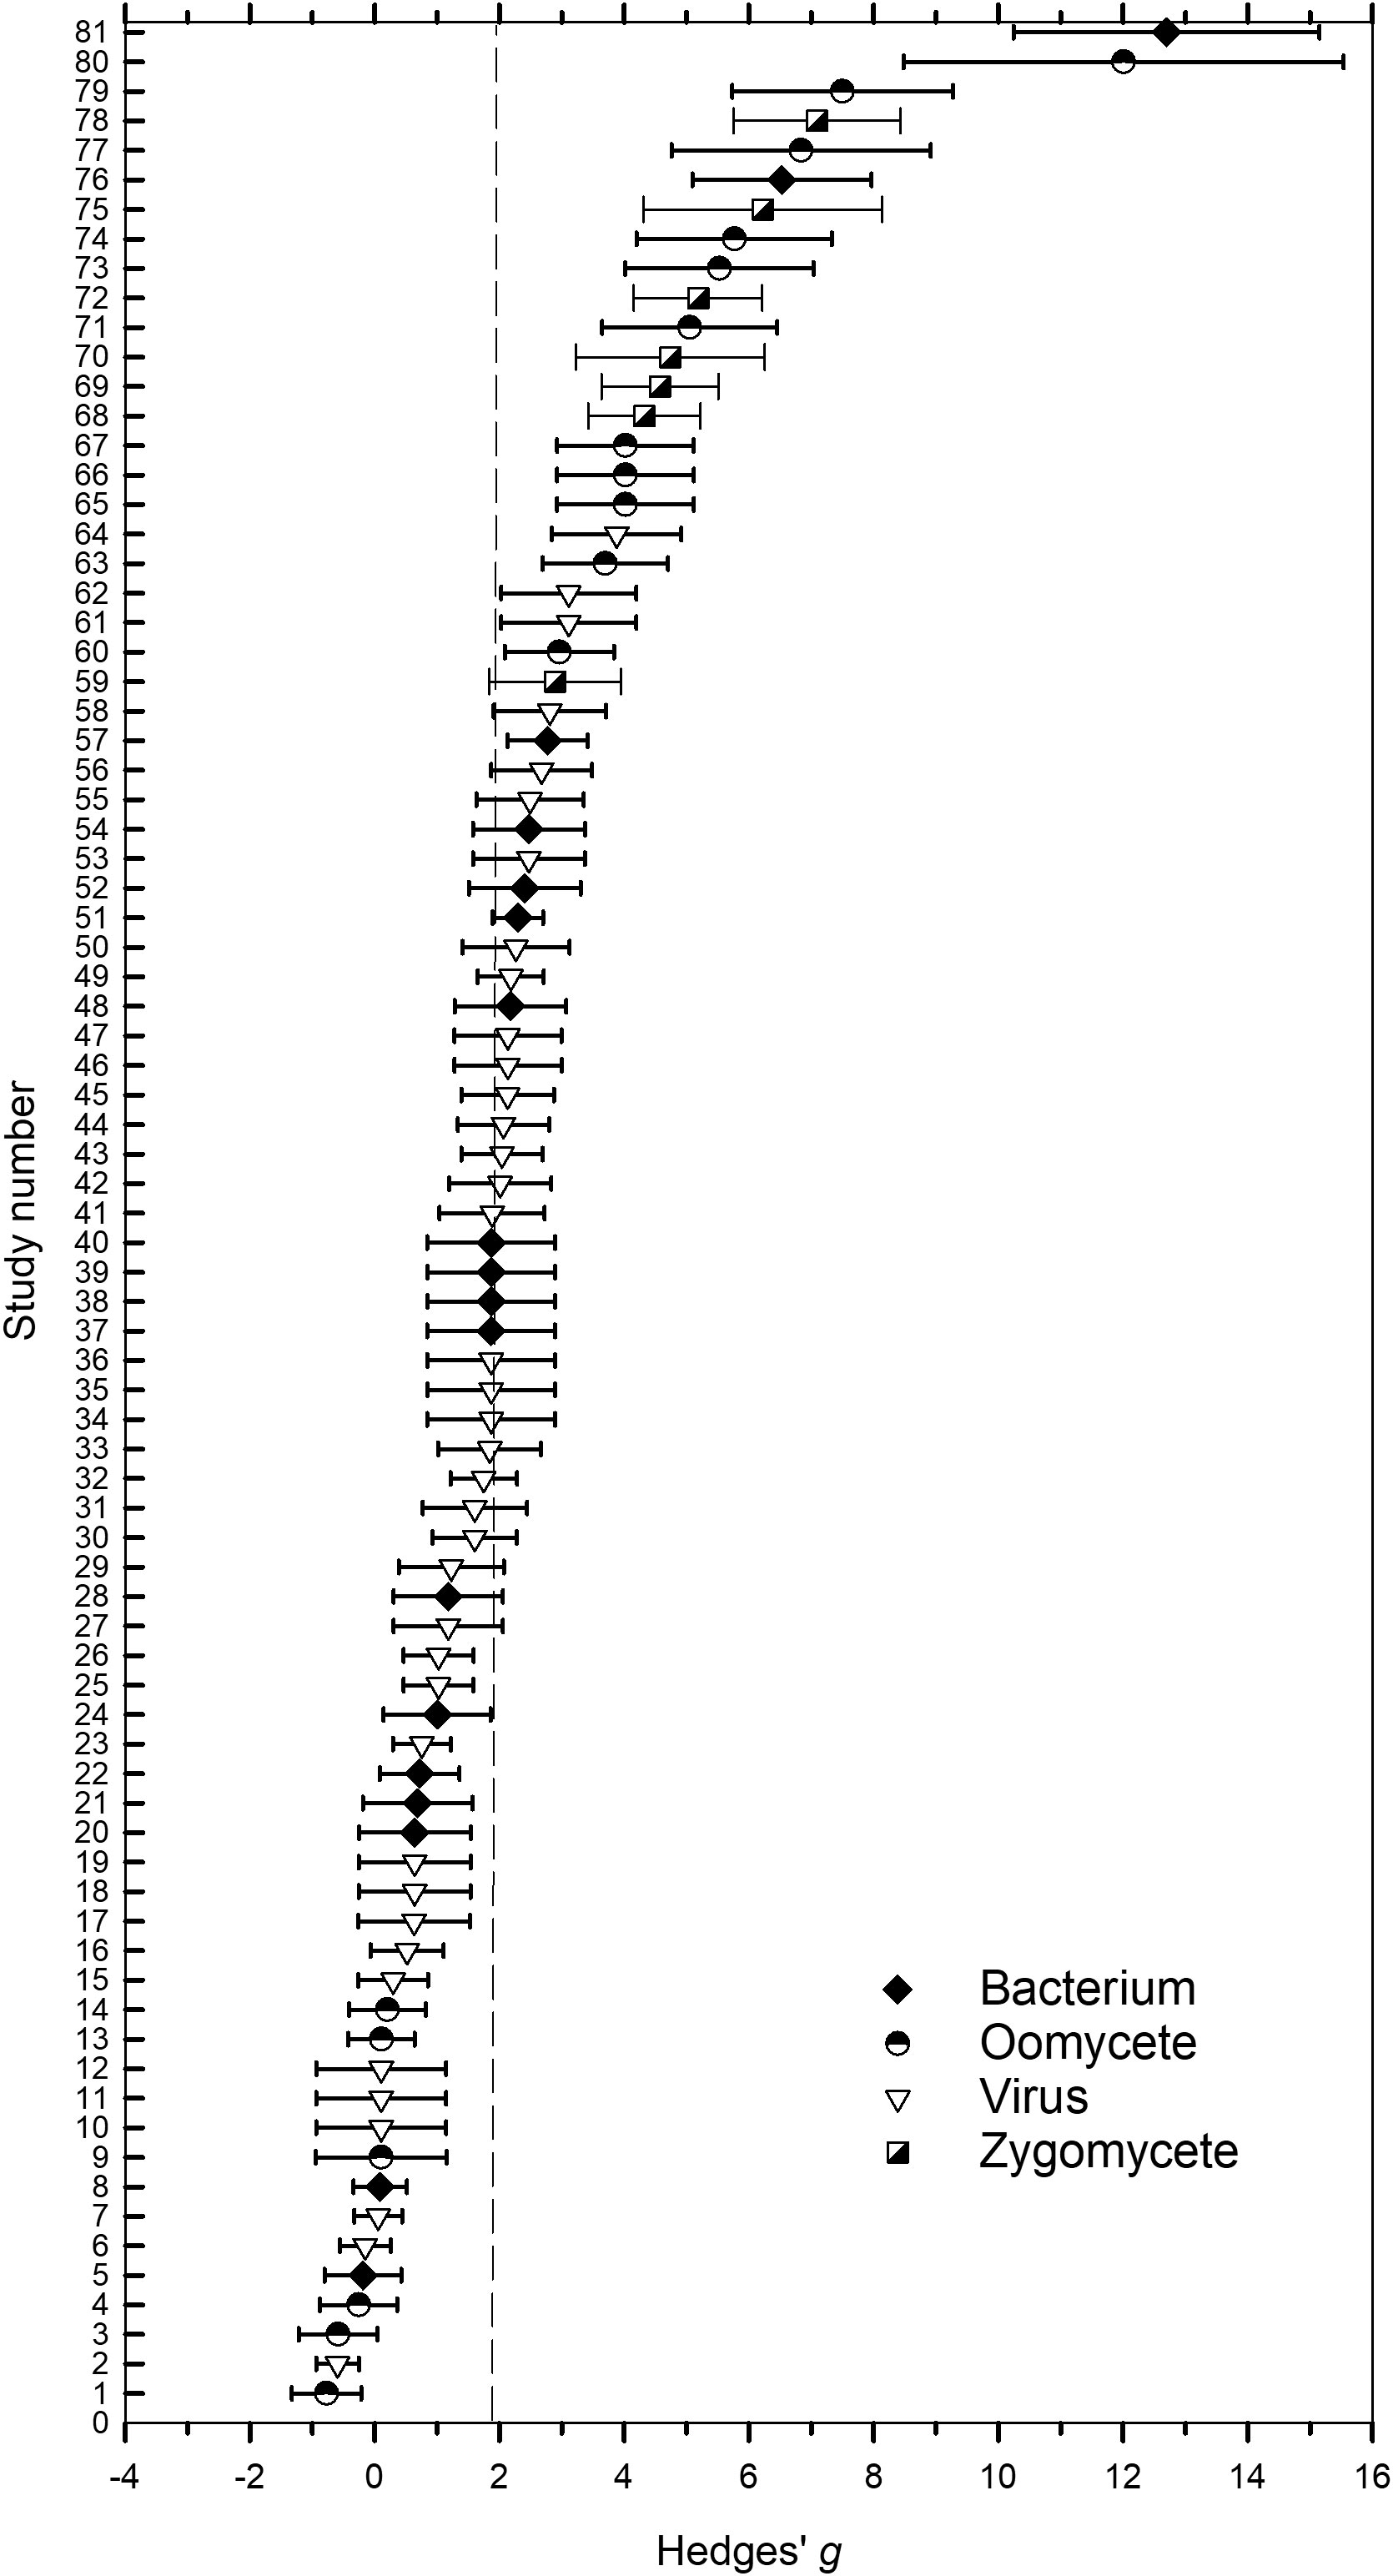
Figure 2 Forest plot of ordered magnitude of Hedges’ g standardized mean differences effect size for 81 studies conducted to assess the efficacy of peroxygen compounds as a disinfestant on fungi. An effect size provides a non-unit measurement of the effective reduction in the number of viable propagules or in disease development due to the application of a peroxygen compound compared to a non-treated control that has been standardized using study variances. Symbols refer to g for an individual study involving bacteria (closed diamond), oomycete (half-closed circle), virus (open triangle) and zygomycetes (half-closed square), while the whiskers represent the 95% confidence interval. The vertical dashed line represents the estimated overall mean effect size ( = 1.98) across all studies.
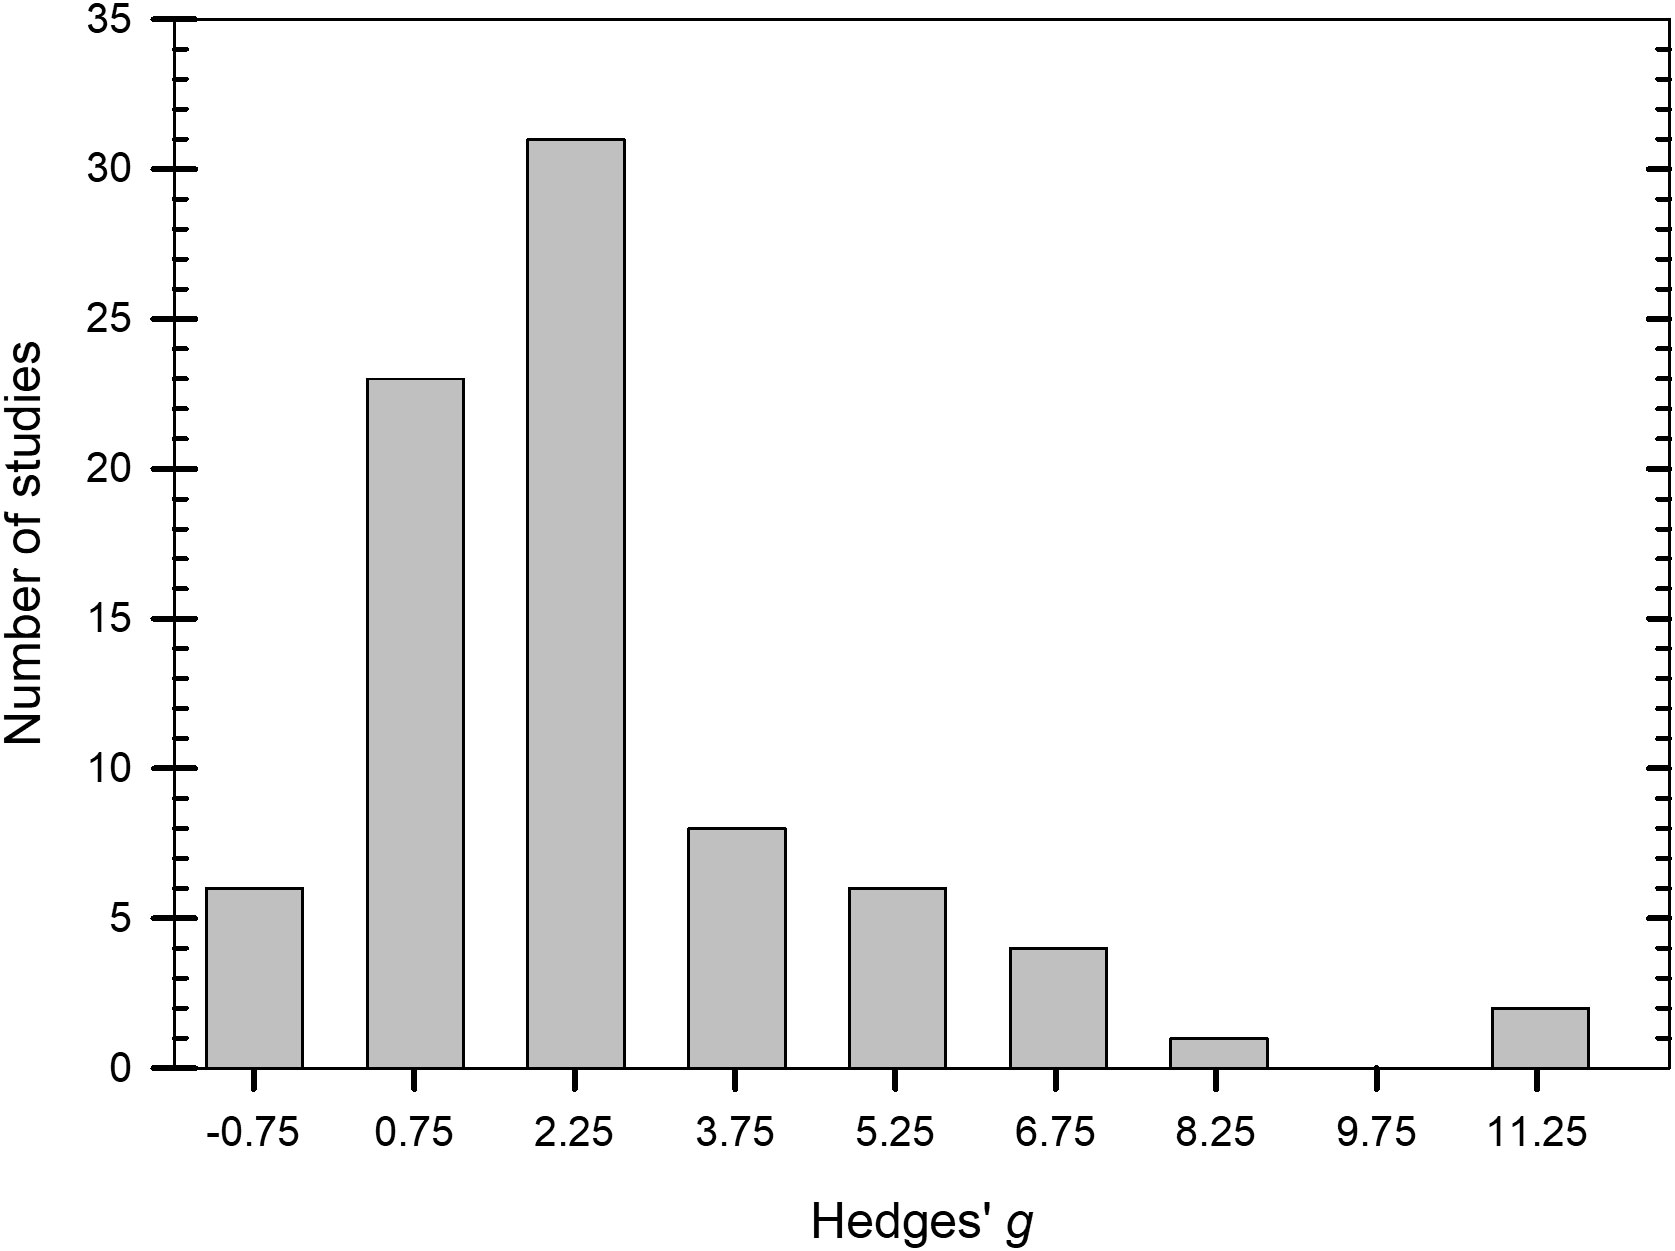
Figure 3 Number of studies in 1.5-integer categories of Hedges’ g for the standardized mean difference between treated and non-treated controls based on a synthesis of studies obtained in the literature on efficacy of peroxygen compounds (k = 81). Values of g = 0.5, 1.0, and 2.0 represent a ‘small’, ‘medium’, and ‘large’ effect, respectively, while g ≥ 4.0 represents a ‘very large’ effect.
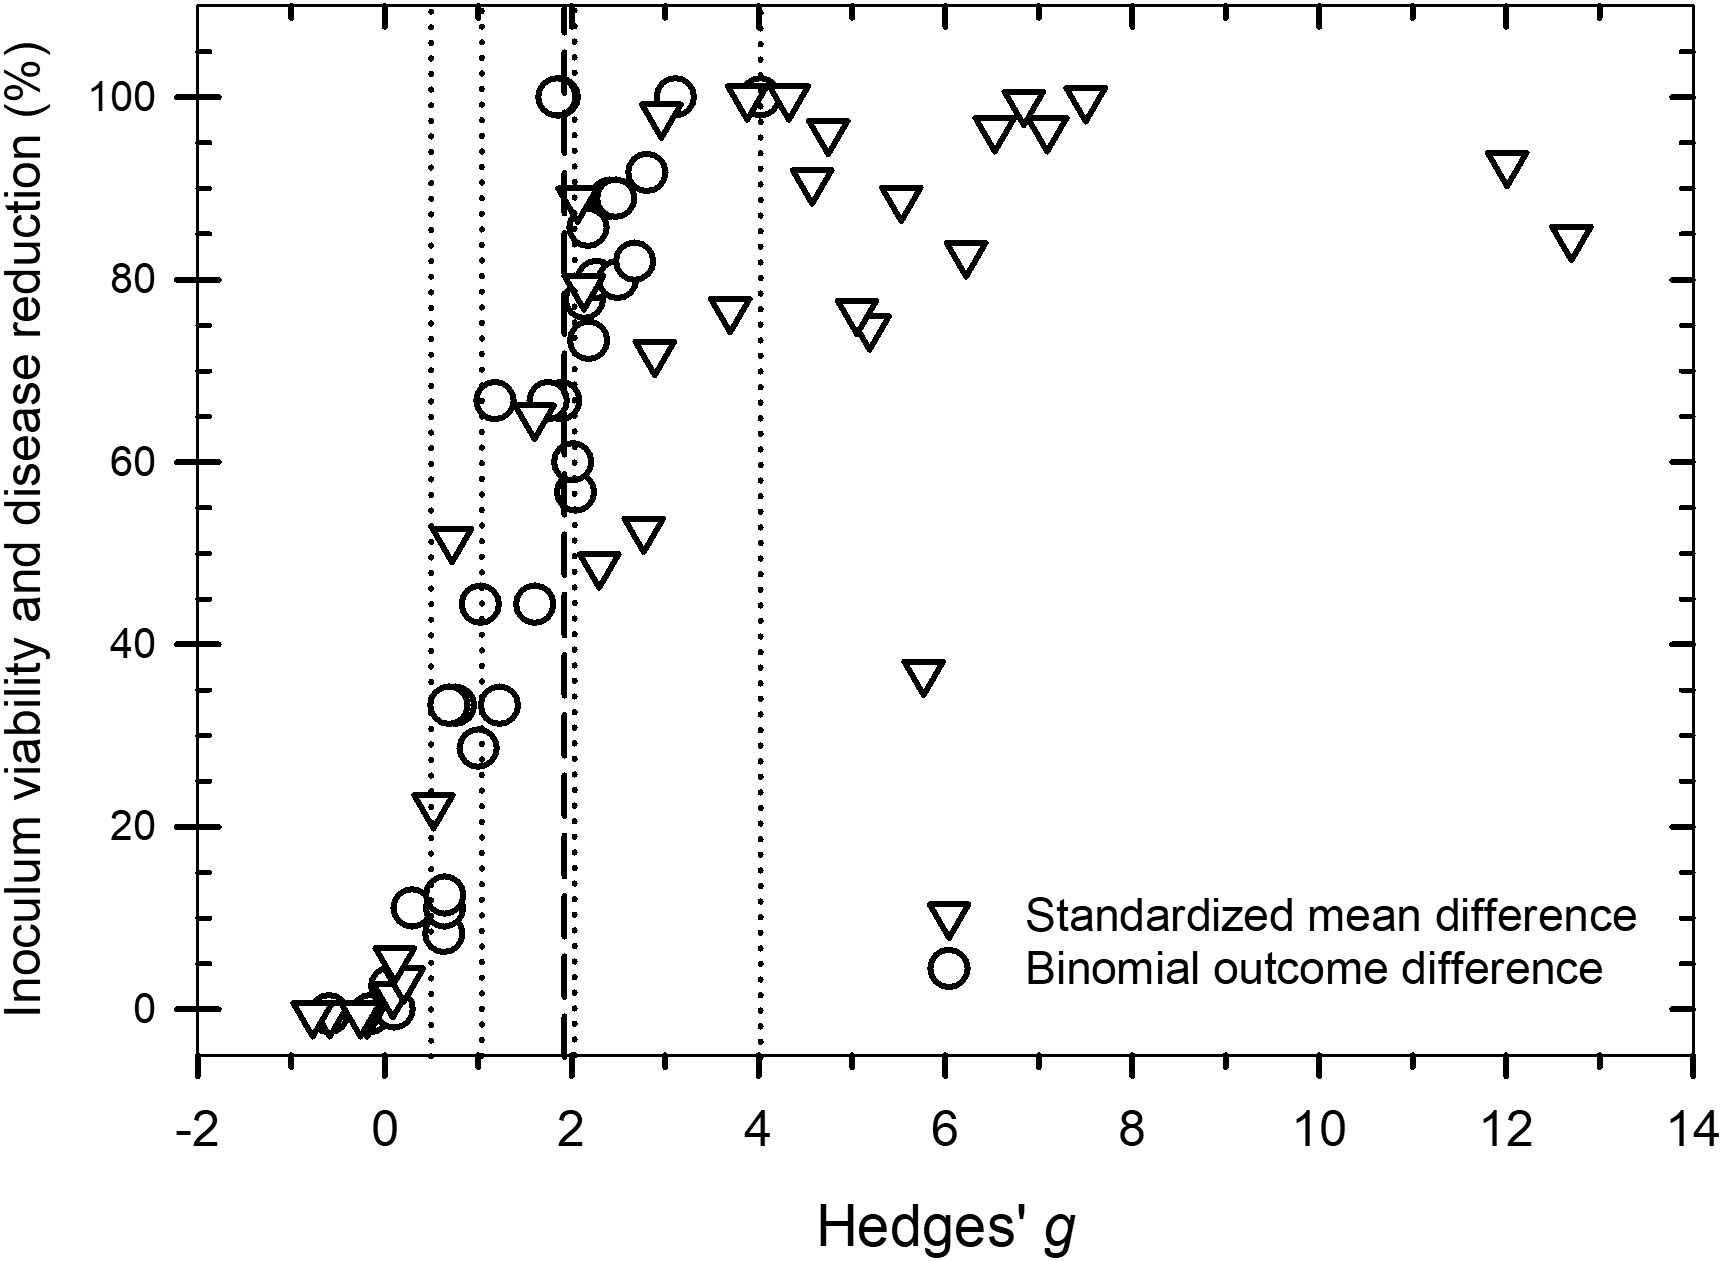
Figure 4 Scatter plot of Hedges’ g and the percent control associated with a peroxygen compound treatment intervention compared to an untreated control for data measured as a standardized mean difference (open triangle symbol) and a difference in the binomial outcome of pathogen viability or disease progression (open circle symbol). The vertical dotted lines are the values of g = 0.5, 1.0, 2.0 and 4.0 that represent a ‘small’, ‘medium’, ‘large’ and ‘very large’ effect, respectively. The vertical dashed line is the estimated overall mean effect size ( = 1.98) across all entries based on the random effects model.
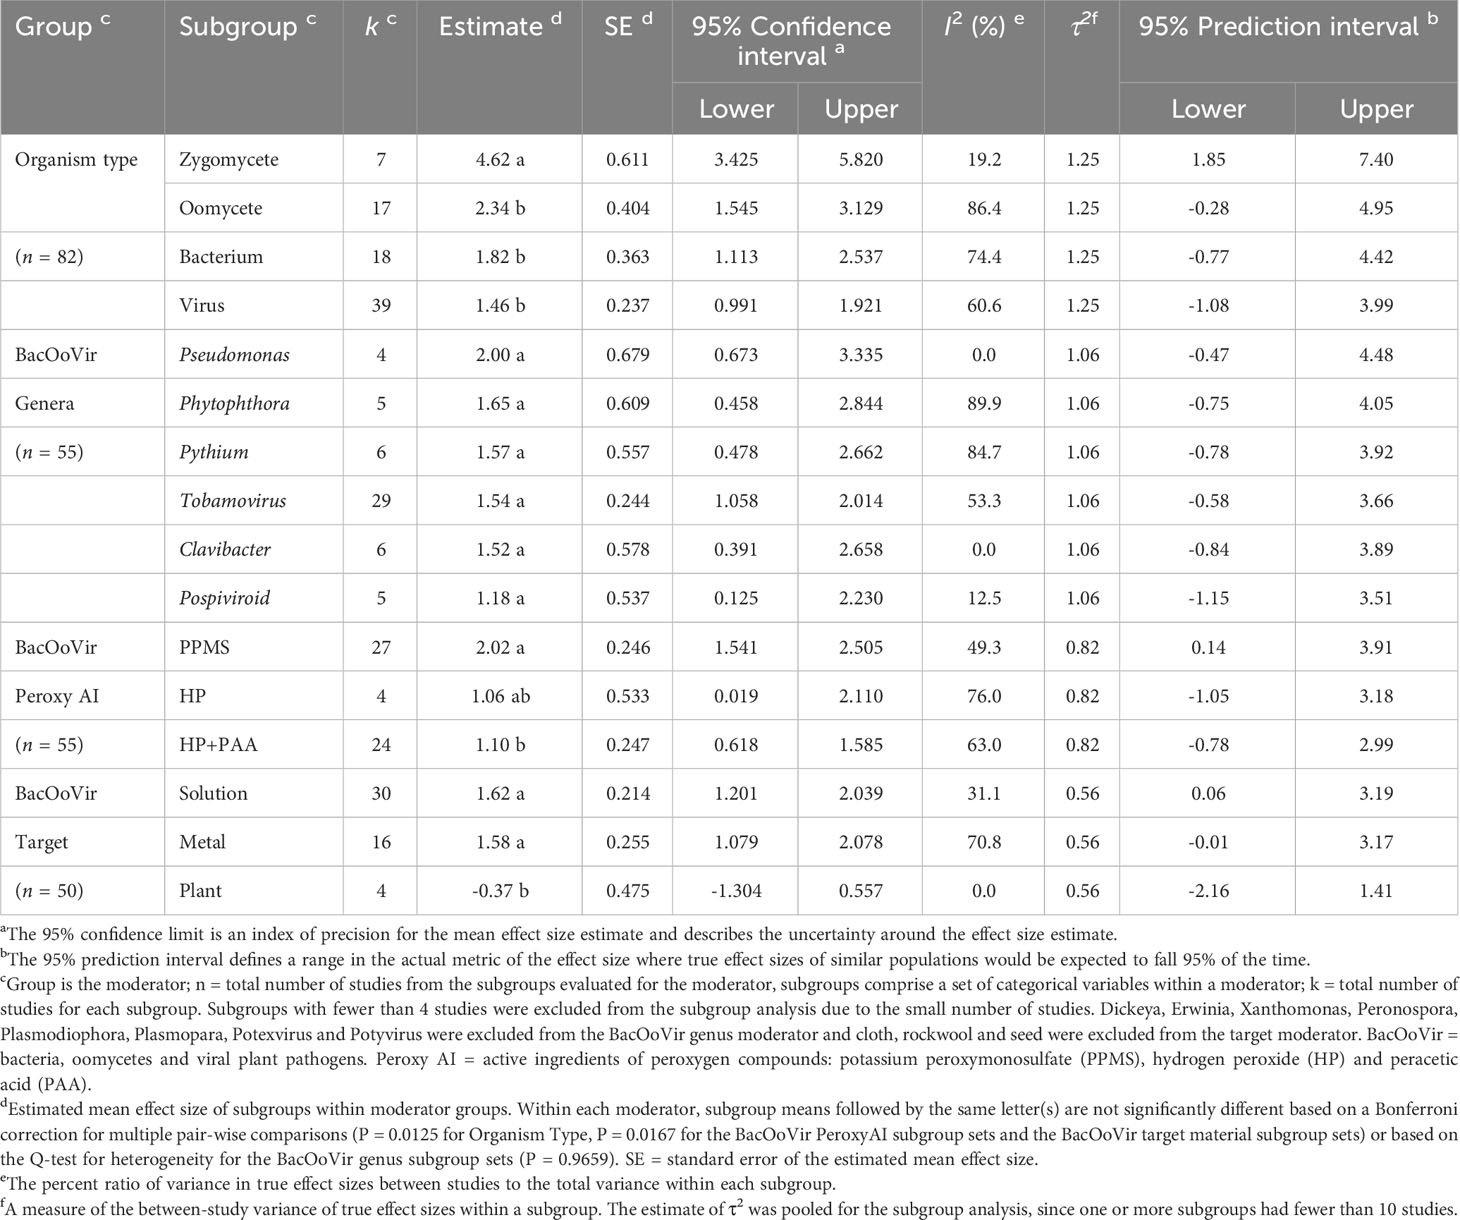
Table 2 Effect size estimates, summary statistics and prediction intervals from random-effects analyzes for categorical variables used to assess efficacy of quaternary ammonium compounds as a disinfestant against organism types of non-fungal plant pathogen.
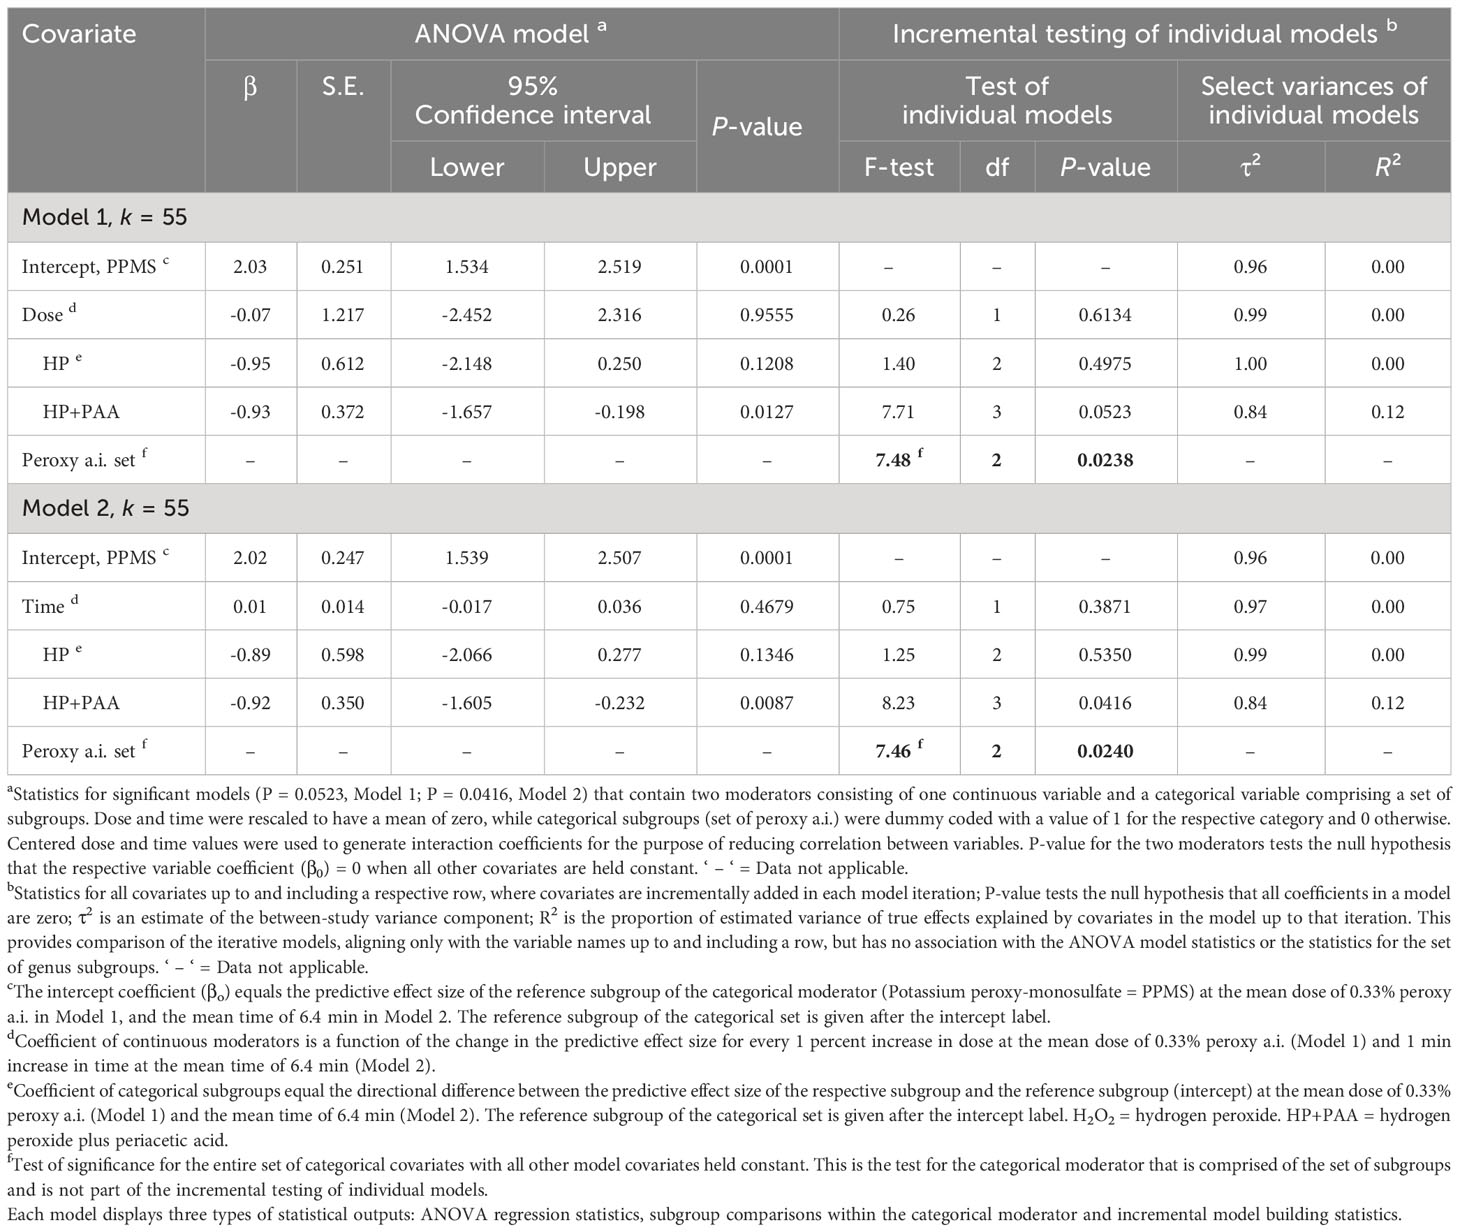
Table 3 Random-effects meta-regression analysis of the effect of a continuous moderator, dose (Model 1) or time (Model 2) with a set of categorical subgroups of the moderator peroxy active ingredient (= Peroxy a.i.) on the efficacy of peroxygen compounds in disinfesting plant pathogenic bacteria, oomycetes and viruses (BacOoVir).
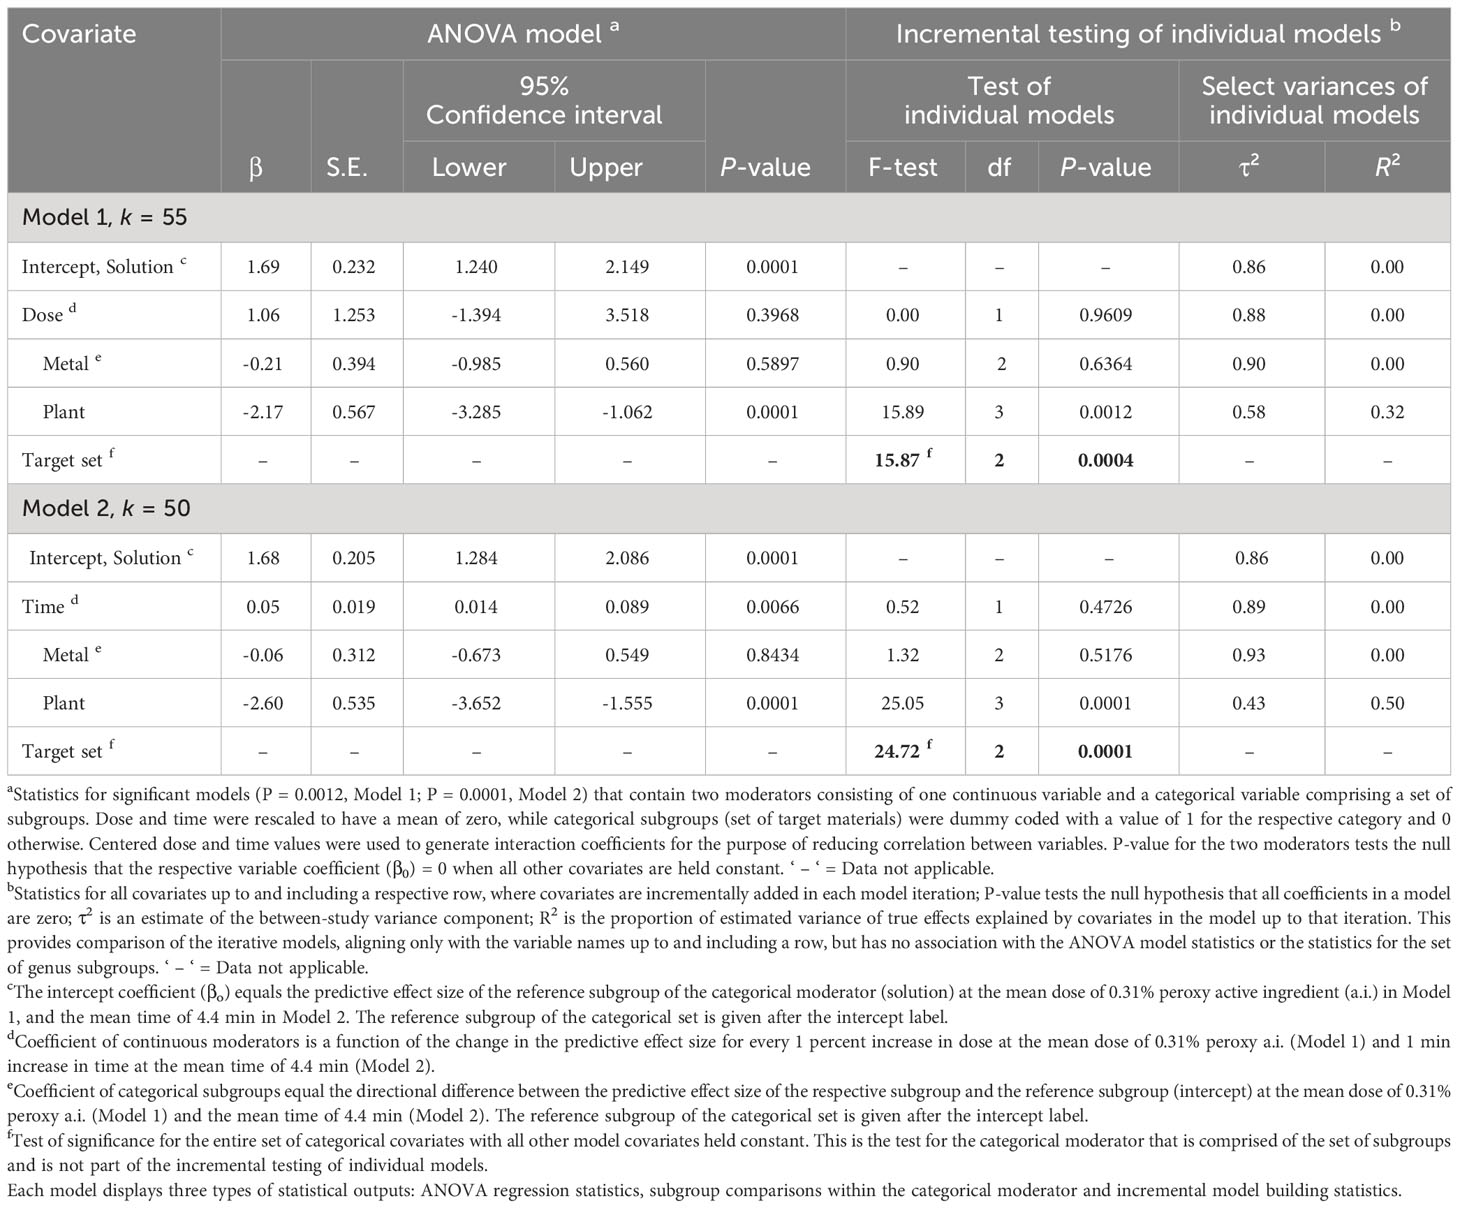
Table 4 Random-effects meta-regression analysis of the effect of a continuous moderator, dose (Model 1) or time (Model 2) with a set of categorical subgroups of the moderator target materials on the efficacy of peroxygen compounds in disinfesting plant pathogenic bacteria, oomycetes and viruses (BacOoVir).
3.2 Effect of peroxygen efficacy against all organism types
The overall across all studies (k = 81) was 1.98. The 95% confidence interval (CI) of (lower 95% CI = 1.610, upper 95% CI = 2.341) did not include zero, indicating that was significantly (P < 0.0001) greater than zero. For organism type, efficacy of peroxygens were higher (P = 0.0125, Bonferroni correction factor) when used against zygomycetes than against bacteria, oomycetes and viruses, with efficacy being similar for the latter three organism types (Table 2). Based on of organism subgroups, peroxygen compounds were highly effective against zygomycetes ( = 4.62) and moderately effective against bacteria ( = 1.82), oomycetes ( = 2.34) and viruses ( = 1.46) (Table 2). Based on comparisons between organism types in the subgroup analysis, bacteria, oomycetes and viruses were grouped as a composite organism type, i.e., BacOoVir, for subsequent data analysis. For zygomycetes (k = 7), sample sizes were too small per subgroup to perform further analyzes, with two peroxygen a.i. subgroups (HP+PAA, PPMS) and three target material subgroups (fruit, plastic, wood). Further, only one zygomycete genus, Rhizopus, was available.
3.3 Meta-regression of peroxygen efficacy due to dose and contact time, genus and peroxygen a.i. and subgroup analysis of genus and peroxygen a.i.
The overall across the BacOoVir studies (k = 55) treated with peroxygen compounds was 1.53. The meta-regression model that contained the two continuous moderators, dose and time, was not significant (P = 0.6766). Further, the meta-regression models with dose and genus (P = 0.9851) and time and genus (P = 0.8487) were not significant. Likewise, a subgroup analysis found no differences in between genus subgroups (P = 0.9659) (Table 2). The genus subgroups Dickeya (k = 1), Erwinia (k = 2), Xanthomonas (k = 3), Peronospora (k = 1), Plasmodiophora (k = 1), Plasmopara (k = 1), Potexvirus (k = 3) and Potyvirus (k = 2) were excluded from subgroup and meta-regression analyzes because sample size was less than four (Figure 5). The range of across all fifteen genus subgroups indicate differences between genera could exist if a larger number of studies was available (Figure 5).
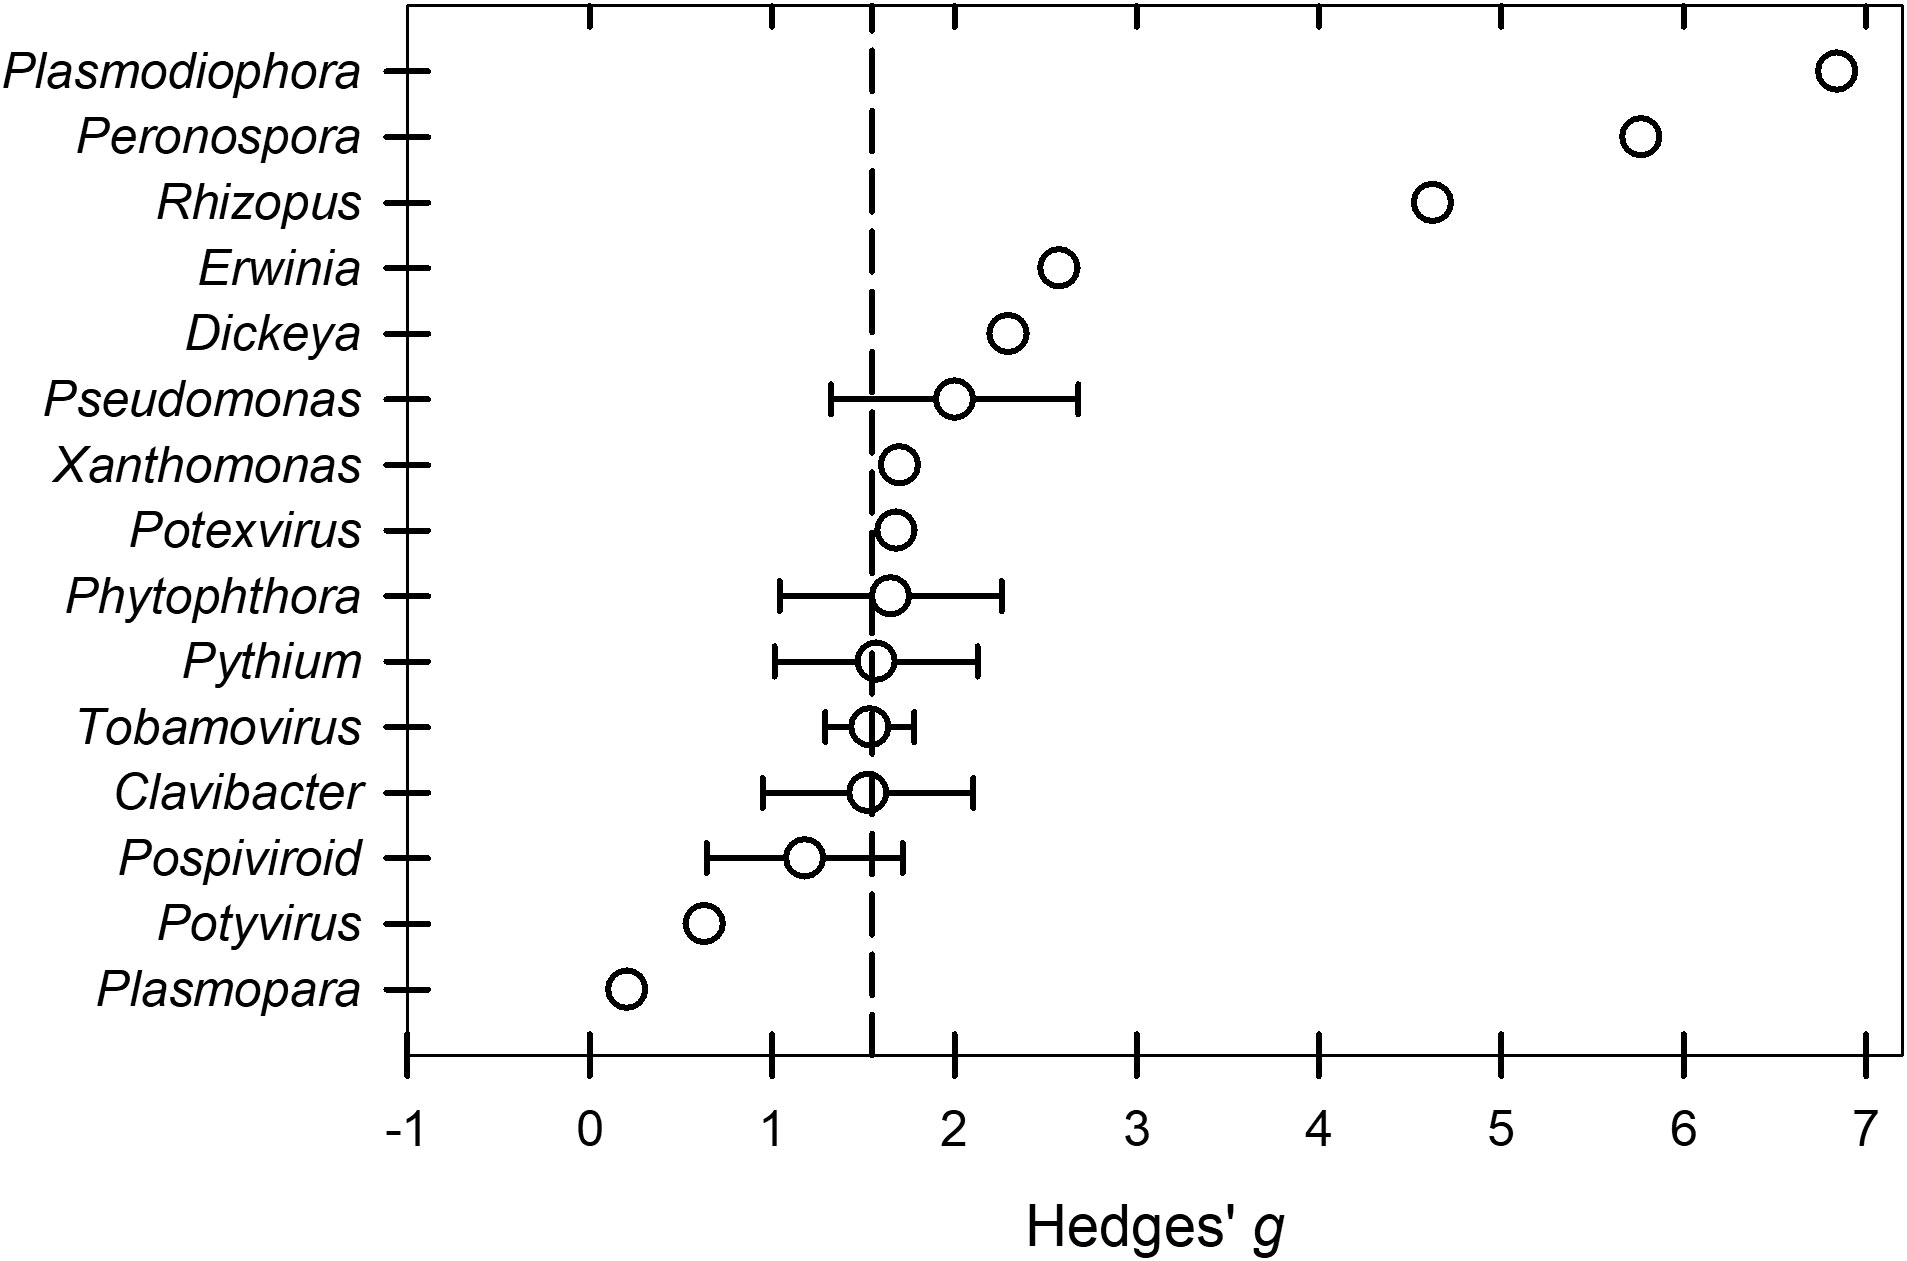
Figure 5 Effect of the moderator variable genus on the Hedges’ g standardized mean difference of disease reduction based on a synthesis of studies obtained in the literature on the efficacy of peroxygen compound disinfestant interventions (k = 55). Values of g = 0.5, 1.0, and 2.0 represent a ‘small’, ‘medium’, and ‘large’ effect, respectively, while g ≥ 4.0 represents a ‘very large’ effect. The vertical dashed line is the estimated overall mean effect size ( = 1.53) across all entries based on the random effects model. Open circles represent the mean g for each target material, while the horizontal line represents the 95% confidence interval of the mean g for each subgroup. Genus subgroups Dickeya, Erwinia, Xanthomonas, Peronospora, Plasmodiophora, Plasmopara, Potexvirus, and Potyvirus were represented by a mean g without the 95% confidence intervals because subgroups represented by fewer than 4 studies were excluded from subgroup analysis. Additionally, Rhizopus that was shown to have a higher subgroup in a separate analysis was included.
The efficacy of peroxygen compounds was higher (P = 0.0167, Bonferonni correction factor) for PPMS products ( = 2.02) than for HP+PAA products ( = 1.10), while neither were different from HP ( = 1.06) (Table 2). The 95% prediction intervals indicated that the efficacy of products from similar populations containing PPMS could range from low to high (lower 95% PI = 0.14, upper 95% PI = 3.91), while the efficacy of products with HP (lower 95% PI = -1.05, upper 95% PI = 3.18) and HP+PAA (lower 95% PI = -0.78, upper 95% PI = 2.99) could range from ineffective to highly effective (Table 2).
The RE meta-regression models showed similar response patterns between peroxygen a.i. subgroups when regressed with dose (P = 0.0523, Model 1) and time (P = 0.0416, Model 2) (Table 3). Neither dose (P = 0.9555, Model 1) or time (P = 0.4679, Model 2) were significant as moderators. However, the set of peroxygen a.i. subgroups was significant in both the dose (P = 0.0238, Model 1) and time (P = 0.0240, Model 2) models and each explained 12% of the true variance (R2 = 0.12) (Table 3). Within the peroxygen a.i. set of subgroups, the estimated of the HP+PAA subgroup was -0.93 and -0.92 lower than the reference subgroup PPMS in the dose (P = 0.0127, Model 1) and time (P = 0.0087, Model 2) models, respectively (Table 3). Despite the overall similarities, the P-value was slightly higher than 0.05 in the dose and peroxygen a.i. model (P = 0.0523) and lower than 0.05 in the time and peroxygen a.i. model (P = 0.0416) (Table 3).
3.4 Sub-group analysis of peroxygen efficacy on target materials and meta-regression with dose and time
Peroxygen products had a higher efficacy (P = 0.0167, Bonferroni correction factor) against BacOoVir plant pathogens when applied in solution ( = 1.62) and to metal ( = 1.58) than when applied to plants ( = -0.37) (Table 2, Figure 6). The 95% prediction intervals indicated efficacy of peroxygen products ranged from low or ineffective to moderate or high on the three target materials (Table 2).
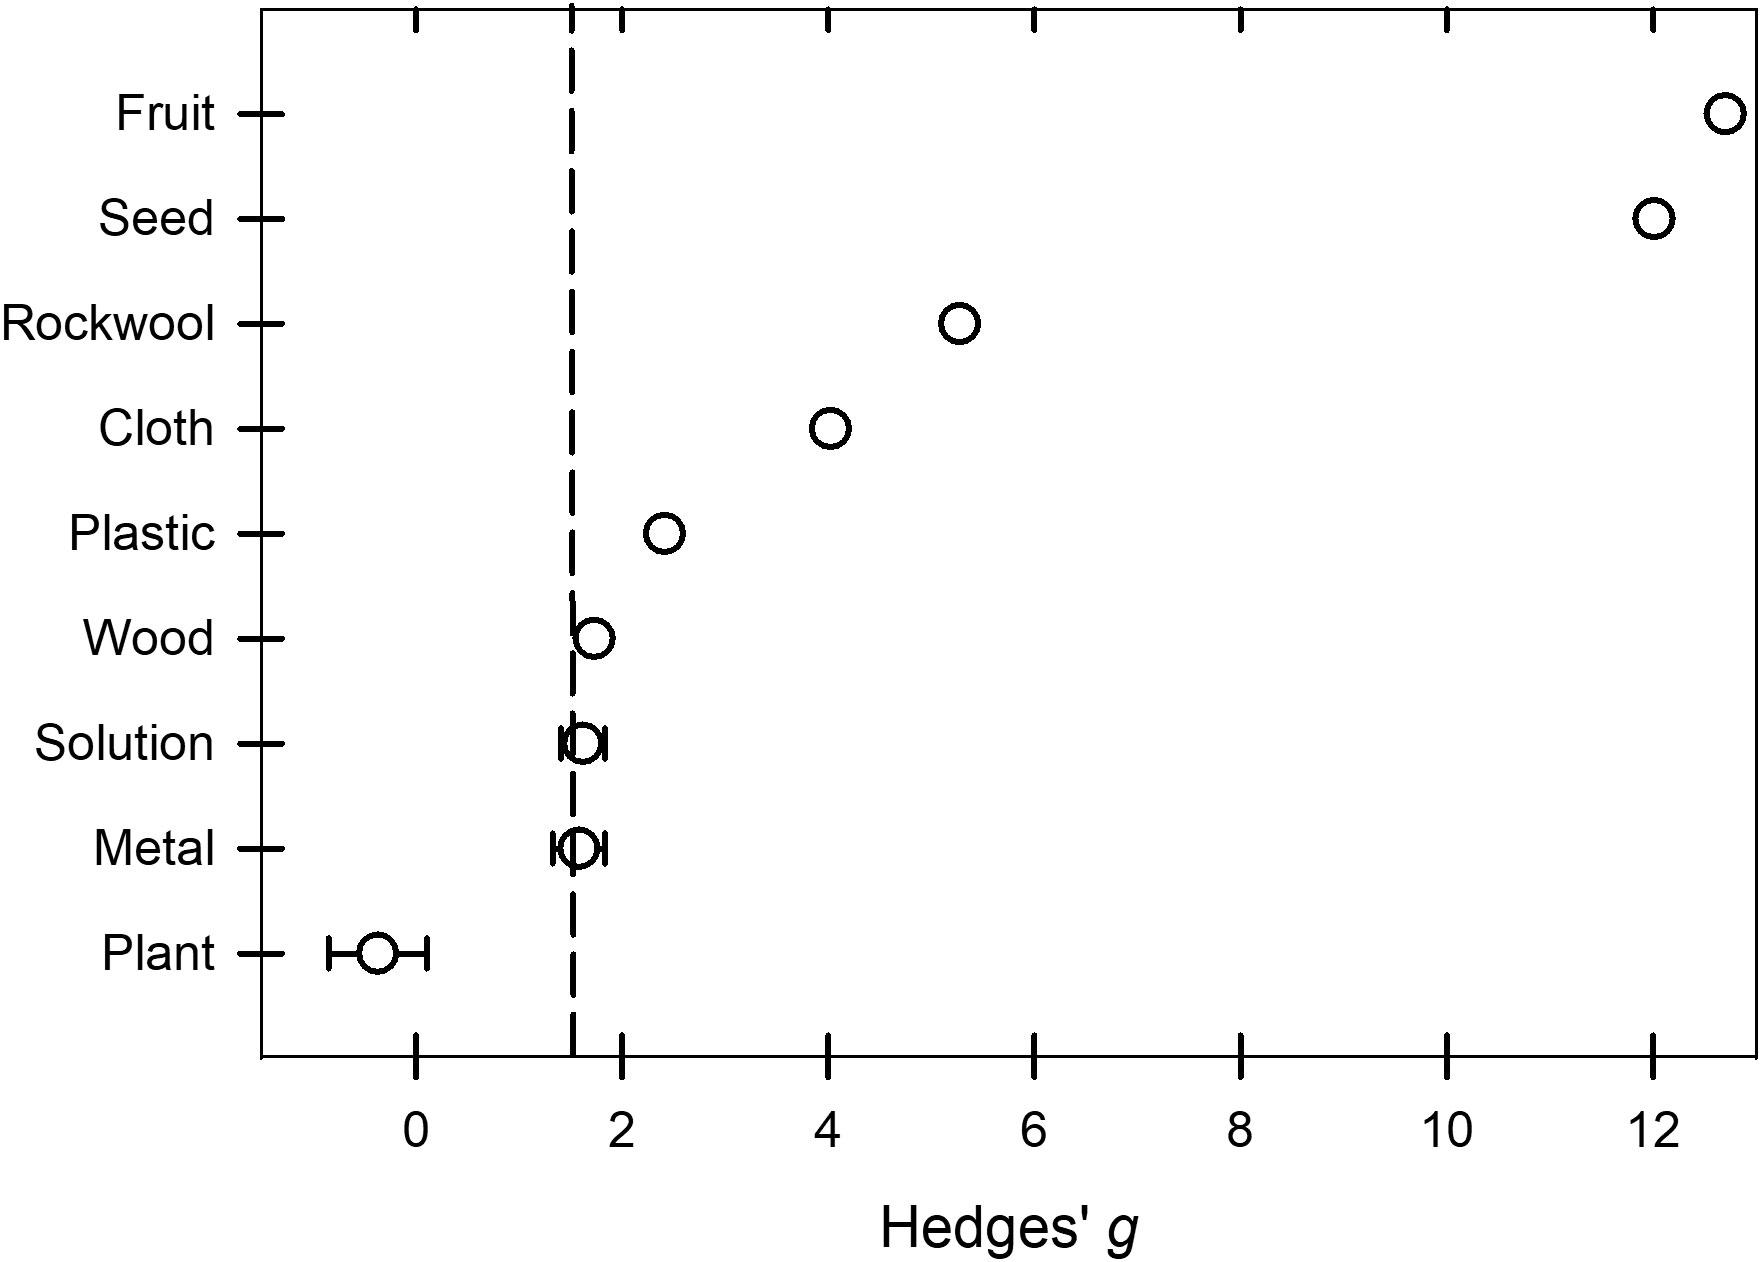
Figure 6 Effect of the moderator variable target material on the Hedges’ g standardized mean difference of disease reduction based on a synthesis of studies obtained in the literature on the efficacy of peroxygen compound disinfestant interventions (k = 50). Values of g = 0.5, 1.0, and 2.0 represent a ‘small’, ‘medium’, and ‘large’ effect, respectively, while g ≥ 4.0 represents a ‘very large’ effect. The vertical dashed line is the estimated overall mean effect size ( = 1.44) across all entries based on the random effects model. Open circles represent the mean g for each target material, while the horizontal line represents the 95% confidence interval of the mean g for each subgroup. Target subgroups cloth, fruit, plastic, rockwool, seed and wood were represented by a mean g without the 95% confidence intervals because subgroups represented by fewer than 4 studies were excluded from subgroup analysis.
The RE meta-regression models showed similar response patterns between target subgroups when regressed with dose (P = 0.0012, Model 1) and time (P = 0.0001, Model 2) (Table 4). Dose (P = 0.3968, Model 1) was not significant as a moderator but time (P = 0.0066, Model 2) was significant (Table 4), regardless time did not explain any of the true variance (R2 = 0.00) (Table 4). The set of target subgroups as a moderator was significant in both the dose (P = 0.0004, Model 1) and time (P = 0.0001, Model 2) models (Table 4). The plant subgroup was 2.17 and 2.60 lower than the solution subgroup in model 1 (P = 0.0001) and model 2 (P = 0.0001), respectively. A greater amount of true variance was explained with time and target (R2 = 0.50, Model 2) than with dose and target (R2 = 0.32, Model 1) (Table 4).
3.5 Small-study bias assessment
Estimated effect sizes for bacteria, oomycetes, viruses and zygomycetes (n = 81) were distributed within the top half of the funnel but some values with standard errors < 0.70 were spread outside the left side of the funnel and many with standard errors > 1.10 were spread outside of the right side of the funnel (Figure 7). This indicates plot asymmetry and potential bias that could influence interpretation of study findings. Both the Begg and Mazumdar rank correlation (Kendall’s Tau with continuity correction = 0.47, P < 0.0001) and Egger’s regression test (intercept = 4.06, SE = 0.43, P < 0.0001) were significant, indicating funnel plot asymmetry and presence of bias. The Duval and Tweedie’s trim and fill method estimated 21 missing values that when added to the dataset lowered the overall and 95% CIs from 1.98 (1.61 to 2.34) to 1.26 (0.88 to 1.65). While this lowered the overall to 1.26, peroxygen compounds still provided a moderate effect against non-fungal plant pathogens.
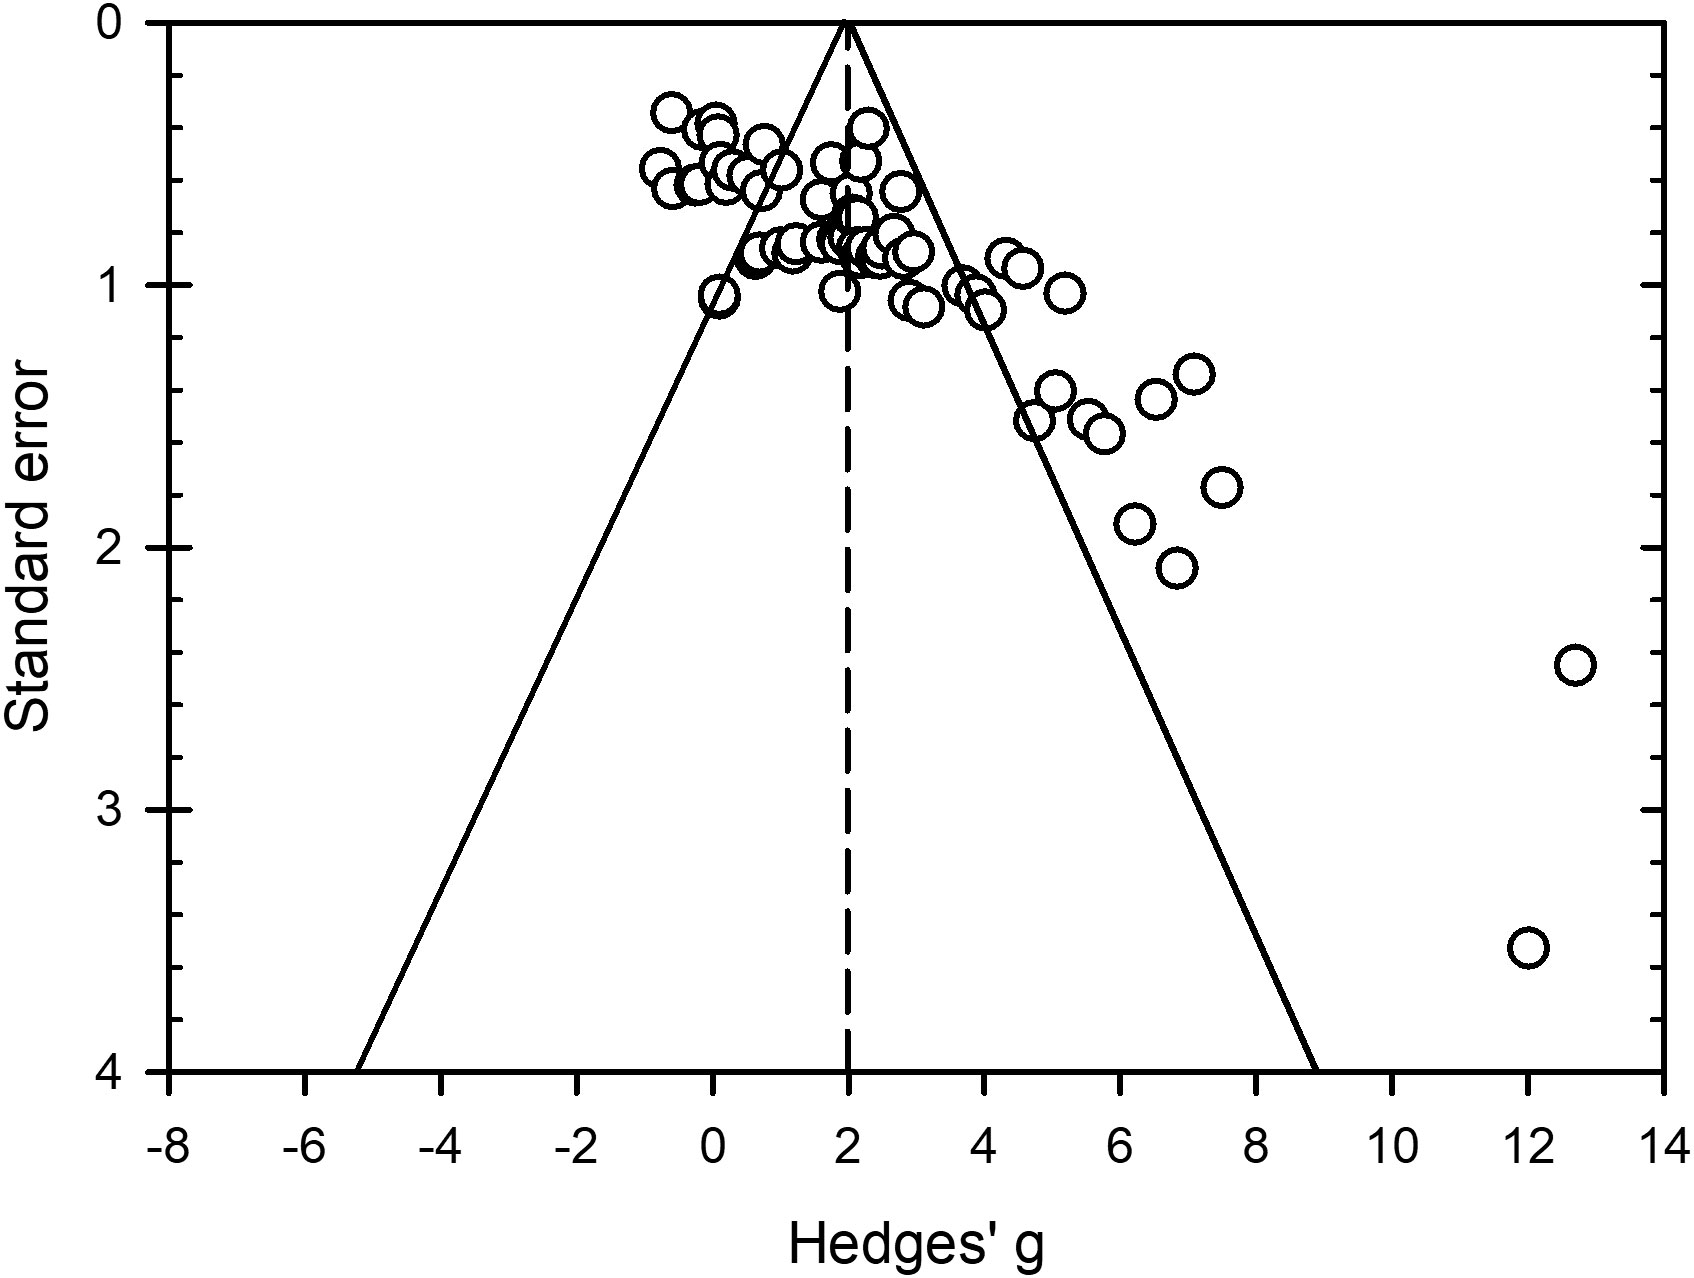
Figure 7 Funnel plot to assess publication bias in studies conducted to assess efficacy of peroxygen compounds as a disinfestant against non-fungal plant pathogens in agricultural and horticultural production. Open circles represent Hedges’ g standardized mean difference from all studies included in the meta-analysis (k = 81) with its corresponding standard error. The standard error is the within-study standard error for g. The vertical dashed line is the overall mean effect size ( = 1.98) across all entries based on a random effects model. The outer solid lines indicate the triangular region within which 95% of studies are expected to lie in the absence of both bias and heterogeneity. Funnel plot shows clear asymmetry (P < 0.0001 from Egger’s regression test for funnel plot asymmetry).
4 Discussion
Peroxygen compounds are one of the major classes of disinfestants commercially available to control plant pathogens in agricultural and horticultural production systems. The purpose of this quantitative synthesis was to evaluate the effectiveness of peroxygens as disinfestants against non-fungal plant pathogens and to better understand and/or improve their effectiveness in plant production settings. The overall mean of 1.98 indicates that peroxygen compounds are highly effective at reducing viability of non-fungal plant pathogen propagules or disease development. However, the efficacy of peroxygen compounds was variable and ranged from excellent to ineffective against some populations of non-fungal pathogens. Previous meta-analyzes on hypochlorites and quaternary ammonium compounds (QAC) have shown a similar range in efficacy against plant pathogens (Copes and Ojiambo, 2021a; Copes and Ojiambo, 2021b; Copes and Ojiambo, 2023a; Copes and Ojiambo, 2023b). Variability in efficacy could partly be explained by differences in responses of organism type, activity of peroxygen a.i. and interaction of target material. Of these factors, heterogeneity due to dose and contact time was primarily associated with target material. These moderators should be taken into account both when considering plant disease control and in the development of research to better improve efficacy of peroxygen compounds. From this and previous systematic reviews, it is evident there is need to more fully identify the moderators that influence not only the efficacy of peroxygen compounds but other disinfestants as well.
Peroxygen compounds were moderately to highly effective against most bacteria, oomycetes and viruses tested, but were even more effective against zygomycetes. This indicates differences exist in organism sensitivity to perxoygen compounds. However, we are unable to make overall recommendations due to the limited number of genera represented in the studies used in this synthesis. Further, a number of genus subgroups were excluded from subgroup and meta-regression analyzes because of having too few studies. This issue on a limited number of studies affects the robustness of the study outcomes. When excluded genera were graphed with the genera tested, a wider range in efficacy was observed, with peroxygens providing a level of control against some oomycetes comparable to that against zygomycetes and a low level of control against some oomycete and virus genus subgroups. Even in the case of zygomycetes, low to moderate doses and contact times were used against Rhizopus stolonifer further indicating zygomycetes have high sensitivity to peroxygen compounds (Mari et al., 2004; Bernat et al., 2018). A similar response pattern was observed for bacteria, oomycetes and viruses treated with quaternary ammonium compounds (QAC) (Copes and Ojiambo, 2023c). Hypochlorites resulted in overall higher levels of efficacy against bacteria, oomycetes and viruses than peroxygen compounds and QACs, but the response still ranged from low to high levels of control (Copes and Ojiambo, 2021b). More studies are needed to better identify genera that are consistently less or more sensitive to these disinfestants.
Plant pathogens can be present on many different target materials in agricultural and horticultural production systems. In this study, the analyzes were limited to three target materials, i.e., metal, plant and solution. Peroxygen compounds were equally effective against non-fungal plant pathogens present on metal surfaces and when suspended in solutions. Efficacy was similarly moderate to high on target materials, such as wood, plastic and rockwool, which were excluded from the subgroup analyzes due to a limited sample size. One major outcome from this study was the observation that peroxygen compounds were ineffective at disinfesting non-fungal pathogens on plant material. A possible reason may be that peroxygen disinfestants were sprayed once or at weekly intervals on plant material (O’Neill and Pye, 2000; Garton et al., 2008; Hausbeck and Harlan, 2008; Raid, 2016). These products are unlikely to provide week-long protection since the residual duration of peroxygen lasts less than an hour. This explanation is consistent with the reports that multiple applications per week of a HP controlled development of daylily rust, while weekly applications were ineffective (Copes, 2009). However, the rate recommendations on product labels are for weekly applications. Applications at closer intervals likely would require use of lower rates to avoid plant damage due to phtyotoxicity (Copes et al., 2003; Copes, 2009). Plant selections should always be tested for their sensitivity to a product prior to large scale application. QACs also provided a poor level of control against non-fungal plant pathogens when applied at weekly intervals to growing plants (Copes and Ojiambo, 2023b). However, under post-harvest conditions where continued inoculum introduction wasn’t occurring, HP provided high efficacy in controlling disease development on potato tubers and thyme seed (Afek et al., 1999; Ali, 2018).
The peroxygen a.i., HP, HP+PAA and PPMS, provided similar levels of efficacy against bacterium, oomycete and virus plant pathogens, despite ddifferences in efficacy between PPMS and HP+PAA. This was partly evident by the fact that only a small amount of true variances was accounted for in the heterogeneity in meta-regression models with dose and time. These results are similar to those reported by Copes and Ojiambo (2023a), where most peroxygen compounds provided similar levels of efficacy when treating fungal plant pathogens. The consistency between peroxygen products observed in the present study is in contrast to QAC disinfestants where differences between product generations played a more pronounced role in control of non-fungal plant pathogens (Copes and Ojiambo, 2023b).
Publication bias, also called small-study bias, was present in this study indicating the presence of bias in literature on the efficacy of peroxygen compounds in disinfesting non-fungal plant pathogens. A similar pattern of bias has also been reported in other quantitative analyzes of disinfestants where a thorough treatment, discussion and implications of the subject have been presented in detail (Copes and Ojiambo, 2021a; Copes and Ojiambo, 2021b; Copes and Ojiambo, 2023a; Copes and Ojiambo, 2023b). Heterogeneity was a consistent factor in these quantitative analyzes and is a factor that can affect asymmetry. The associations of moderators with efficacy reported in this meta-analysis are representative of the data available but because of the potential sources of biases, correlations and heterogeneity, caution should be taken in the interpretation of these results when assessing various control situations.
Recommendations for product usage given in many crop advisor education publications imply that disinfestants will generally eliminate many different plant pathogens from many different types of production surfaces. This quantitative review indicates that disinfestants generally accomplish that goal but multiple factors can influence their effectiveness and we don’t fully understand what factors are involved. Two key factors that affected efficacy of peroxygen compounds against non-fungal plant pathogens was the genus of the pathogen to be controlled and substrate being treated. Peroxygen compounds worked consistently well against zygomycetes, but that result was taken from a small number of studies, and generally worked against bacterial, oomycete and viral plant pathogens, while sometimes being less effective. Similarly, peroxygens had a moderate to high efficacy on most target materials, but were ineffective at controlling disease development when applied on crops. It was suggested that the use of weekly application intervals may not be adequate for controlling disease development on plants or plant organs during crop production stages.
The purpose of a meta-analysis is to assess population responses involving multiple studies and conclusions based on the studies available. In this synthesis as was also the case with previous meta-analyzes (Copes and Ojiambo, 2021a; Copes and Ojiambo, 2021b; Copes and Ojiambo, 2023a; Copes and Ojiambo, 2023b), the number of studies available were less than optimal. However, the results of the present study still provide a summary of what is currently documented about the efficacy of peroxygen compounds against non-fungal plant pathogens. Ultimately, the goal is to understand the strengths and weakness of peroxygen disinfestants to maximize the utility of these products. This meta-analysis demonstrates that peroxygen disinfestants are good products for controlling plant pathogens but also demonstrates that the products are not consistently effective. Variable activity in disease control is well developed with other agricultural pesticides (e.g. fungicides). These meta-analyzes indicate a similar approach may be relevant to the application of disinfestants as well. Additional research will be needed to develop comprehensively defined disinfestant application strategies that control plant pathogens in diverse agricultural and horticultural settings.
Data availability statement
The original contributions presented in the study are included in the article/Supplementary Material. Further inquiries can be directed to the corresponding author.
Author contributions
WC: Conceptualization, Data Curation, Methodology, Analysis, Writing – Original Draft; PO: Methodology, Writing – Review & Editing. All authors contributed to the article and approved the submitted version.
Funding
The author(s) declare financial support was received for the research, authorship, and/or publication of this article. This research was supported by the US Department of Agriculture, Agricultural Research Service, Thad Cochran Southern Horticultural Laboratory, Southern Horticultural Research Unit project number 6404-21430-001-00D. PO was supported from Hatch Funds from North Carolina Experiment Station for Project NC02693.
Conflict of interest
The authors declare that the research was conducted in the absence of any commercial or financial relationships that could be construed as a potential conflict of interest.
The author PO declared that they were an editorial board member of Frontiers, at the time of submission. This had no impact on the peer review process and the final decision.
Publisher’s note
All claims expressed in this article are solely those of the authors and do not necessarily represent those of their affiliated organizations, or those of the publisher, the editors and the reviewers. Any product that may be evaluated in this article, or claim that may be made by its manufacturer, is not guaranteed or endorsed by the publisher.
Author disclaimer
Mention of trade names or commercial products in this manuscript is solely for the purpose of providing specific information and does not imply recommendation or endorsement by the US Department of Agriculture.
Supplementary material
The Supplementary Material for this article can be found online at: https://www.frontiersin.org/articles/10.3389/fhort.2023.1228494/full#supplementary-material
References
Afek U., Orenstein J., Nuriel E. (1999). Fogging disinfectants inside storage rooms against pathogens of potatoes and sweet potatoes. Crop Prot. 18, 111–114. doi: 10.1016/S0261-2194(98)00100-8
Aiken L. S., West S. G. (1991). Multiple Regression: Testing and Interpreting Interactions (Thousand Oaks, CA, USA: SAGE Publications, Inc.).
Ali A. A. M. (2018). Role of hydrogen peroxide in management of root rot and wilt disease of thyme plant. J. Pathol. Pest Manage. 5, 1–13.
Anonymous (1993) Fact Sheet Reregistration Eligibility Decision (RED) Peroxy Compounds (United States Environmental Protection Agency). Available at: https://www3.epa.gov/pesticides/chem_search/reg_actions/reregistration/red_G-67_1-Dec-93.pdf (Accessed 14 September 2022). EPA-738-F-93-026.
Baysal-Gurel F., Kurowski C. J., Li R., Ling K.-S., Miller S. A. (2015). Developing hygiene protocols against mechanically transmitted pathogens in greenhouse tomato production systems. Acta Hortic. 1069, 275–280. doi: 10.17660/ActaHortic.2015.1069.39
Bernat M., Casals C., Teixidò N., Torres R., Carballo B. C., Usallet J. (2018). Efficacy of environmental friendly disinfectants against the major postharvest pathogens of stone fruits on plastic and wood surfaces. Food Sci. Tech. Intl. 25, 109–119. doi: 10.1177/1082013218800193
Block S. S. (2001). “Peroxygen compounds,” in Disinfection, Sterilization and Preservation, Fifth edition. Ed. Block S. S. (Philadelphia, PA: Lippincott Williams & Wilkins), 185–204.
Borenstein M. (2019). Common Mistakes in Meta-Analysis And How To Avoid Them (Englewood, NJ: Biostat, Inc.).
Borenstein M., Hedges L. V., Higgins J. P. T., Rothstein H. R. (2009). Introduction to Meta-Analysis (United Kingdom: John Wiley & Sons, Ltd.).
Brown G. E. (1987). Effect of experimental bacterial disinfectants applied to oranges on postharvest decay. Proc. Fla. State Hortic. Soc 100, 20–22.
Brown G. E., Schubert T. S. (1987). Use of Xanthomonas campestris pv. vesicatoria to evaluate surface disinfectants for canker quarantine treatment of citrus fruit. Plant Dis. 71, 319–323. doi: 10.1094/PD-71-0319
Chanda B., Shamimuzzaman Md., Gilliard A., Ling K.-S. (2021). Effectiveness of disinfectants against the spread of tobamoviruses: Tomato brown rugose fruit virus and Cucumber green mottle mosaic virus. Virol. J. 18, 7. doi: 10.1186/s12985-020-01479-8
Cheng J., Pullenayegum E., Marshall J. K., Iorio A., Thabane L. (2016). Impact of including or excluding both-armed zero-event studies on using standard meta-analysis methods for rare event outcome: a simulation study. BMJ Open 6, e010983. doi: 10.1136/bmjopen-2015-010983
Copes W. E. (2009). Concentration and intervals of hydrogen dioxide applications to control Puccinia hemerocallidis on daylily. Crop Prot. 28, 24–29. doi: 10.1016/j.cropro.2008.08.003
Copes W. E., Chastaganer G. A., Hummel R. L. (2003). Toxicity responses of herbaceous and woody ornamental crops to chlorine and hydrogen dioxides. Plant Health Prog 4 (1). doi: 10.1094/PHP-2003-0311-01-RS
Copes W. E., Mavrodi O. V., Mavrodi D. V. (2020). Control of Pseudomonas amygdali pv. loropetali on metal, wood, and Loropetalum chinense stem surfaces. Plant Health Prog. 20, 270–277. doi: 10.1094/PHP-09-19-0068-RS
Copes W. E., Ojiambo P. S. (2021a). Efficacy of hypochlorite as a disinfestant against fungal pathogens in agricultural and horticultural plant production: A systematic review and meta-analysis. Phytopathology 111, 1369–1379. doi: 10.1094/PHYTO-05-20-0201-R
Copes W. E., Ojiambo P. S. (2021b). Efficacy of hypochlorite as a disinfestant against non-fungal pathogens in agricultural and horticultural plant production: A meta-analysis. Plant Dis. 105, 4084–4094. doi: 10.1094/PDIS-09-20-2046-RE
Copes W. E., Ojiambo P. S. (2023a). Efficacy of peroxygen disinfestants against fungal plant pathogens. A systemic review and meta-analysis. Crop Prot. 164, 106143. doi: 10.1016/j.cropro.2022.106143
Copes W. E., Ojiambo P. S. (2023b). A systematic review and quantitative synthesis of the efficacy of quaternary ammonium compounds disinfestants against fungal plant pathogens. Plant Dis 107, 480–492. doi: 10.1094/PDIS-09-21-2018-RE
Copes W. E., Ojiambo P. S. (2023c). A systematic review and quantitative synthesis of the efficacy of quaternary ammonium compounds in disinfesting non-fungal plant pathogens. Plant Dis. 107, 3176–3187. doi: 10.1094/PDIS-12-21-2751-RE
Coutts B. A., Kehoe M. A., Jones R. A. C. (2013). Zucchini yellow mosaic virus: Contact transmission, stability on surfaces, and inactivation with disinfectants. Plant Dis. 97, 765–771. doi: 10.1094/PDIS-08-12-0769-RE
Cumming G., Fidler F., Vaux D. L. (2007). Error bars in experimental biology. J. Cell Biol. 177, 7–11. doi: 10.1083/jcb.200611141
Darzi E., Lachman O., Smith E., Koren A., Klein E., Pass N., et al. (2020). Paths of cucumber green mottle mosaic virus disease spread and disinfectant-based management. Ann. Appl. Biol. 177, 374–384. doi: 10.1111/aab.12629
Durlak J. A. (2009). How to select, calculate and interpret effect sizes. J. Pediatr. Psychol. 34, 917–928. doi: 10.1093/jpepsy/jsp004
Duval S., Tweedie R. (2000). Trim and fill: A simple funnel-plot-based method of testing and adjusting for publication bias in meta-analysis. Biometrics 56, 455–463. doi: 10.1111/j.0006-341X.2000.00455.x
Egger M., Smith G. D., Schneider M., Minder C. (1997). Bias in meta-analysis detected by a simple, graphical test. BMJ 315, 629–634. doi: 10.1136/bmj.315.7109.629
Friedrich I. O., Adhikari N. K. J., Beyene J. (2007). Inclusion of zero total event trials in meta-analysis maintains analytic consistency and incorporates all available data. BMC Med. Res. Method. 7, 5. doi: 10.1186/1471-2288-7-5
Garton J. E. Jr., Langston D. B. Jr., Sanders ,. F. H. Jr. (2008). Evaluation of fungicides for bacterial spot control on bell pepper transplants in the greenhous. Plant Dis. Manage. Rep. 2, V160.
Gerba C. P. (2015). Quaternary ammonium biocides: Efficacy in application. Appl. Environ. Microbiol. 81, 464–469. doi: 10.1128/AEM.02633-14
Hausbeck M. K., Harlan B. R. (2008). Evaluation of registered and nonregistered fungicides in managing Phytophthora root rot of poinsetti. Plant Dis. Manage. Rep. 3, OT012.
Hedges L. V. (1981). Distribution theory for Glass’s estimator of effect size and related estimators. J. Educ. Stat. 6, 107–128. doi: 10.3102/10769986006002107
Hedges L. V., Vera J. L. (2005). Selection model approaches” in: Publication Bias in Meta-Analysis. Eds. Orhstein H. R., Sutton A. J., Borenstein. M. (Chichester, UK: John Wiley and Sons), 145–174.
Higgins J. P. T., Thompson S. G. (2002). Quantifying heterogeneity in a meta-analysis. Stat. Med. 21, 1539–1558. doi: 10.1002/sim.1186
Higgins J. P. T., Thompson S. G., Deeks J. J., Altman D. G. (2003). Measuring inconsistency in meta-analyses. BMJ 327, 557–560. doi: 10.1136/bmj.327.7414.557
Hugo W. B. (1995). A brief history of heat, chemical and radiation preservation and disinfection. Int. Biodeterior. Biodegrad. 36, 197–217. doi: 10.1016/0964-8305(95)00055-0
Koponen H., Avikainen H., Tahvonen R. (1992). The effect of disinfectants on fungi in pure culture and surface materials. Agric. Sci. Finland 1, 587–596. doi: 10.23986/afsci.72471
Koricheva J., Gurevitch J., Mengersen K. (2013). Handbook of Meta-Analysis in Ecology and Evolution (Princeton, New Jersey, USA: Princeton Univ. Press).
Lewandowski D. J., Hayes A. J., Adkins S. (2010). Surprising results from a search for effective disinfectants for Tobacco mosaic virus-contaminated tools. Plant Dis. 94, 542–550. doi: 10.1094/PDIS-94-5-0542
Li R., Baysal-Gurel F., Abdo Z., Miller S. A., Ling K.-S. (2015). Evaluation of disinfectants to prevent mechanical transmission of viruses and a viroid in greenhouse tomato production. Virol. J. 12, 5. doi: 10.1186/s12985-014-0237-5
Li T., Vedula S. S., Scherer R., Dickersin K. (2012). What comparative effectiveness research is needed? A framework for using guidelines and systematic reviews to identify evidence gaps and research priorities. Ann. Intern. Med. 156, 367–377. doi: 10.7326/0003-4819-156-5-201203060-00009
Linfield C. A. (1991). A comparative study of the effects of five chemicals on the survival of chlamydospores of Fusarium oxysporum f. sp. narcissi. J. Phytopathol. 131, 297–304. doi: 10.1111/j.1439-0434.1991.tb01200.x
Luukkonen T., Pehkonen S. O. (2016). Peracids in water treatment: A critical review. Crit. Rev. Environ. Sci. Technol 47 (1), 1–39. doi: 10.1080/10643389.2016.1272343
Madden L. V., Paul P. A. (2011). Meta-analysis for evidence synthesis in plant pathology: An overview. Phytopathology 101, 16–30. doi: 10.1094/PHYTO-03-10-0069
Mari M., Gregori R., Donati I. (2004). Postharvest control of Monilinia laxa and Rhizopus stolonifer in stone fruit by peracetic acid. Postharv. Biol. Tech. 33, 319–325. doi: 10.1016/j.postharvbio.2004.02.011
Mebalds M., Tragea W., van der Linden A. (1997). Disinfestation protocols for equipment used in the nursery industry (Gordon, NSW, Australia: Horticultural Research & Development Corp.). Publication No. NY612.
Merianos J. J. (1991). “Quaternary ammonium antimicrobial compounds,” in Disinfection, Sterilization, and Preservation. Ed. Block S. S. (Philadelphia, PA: Lippincott Williams & Wilkins), 225–255.
Ngugi H. K., Esker P. D., Scherm H. (2011a). Meta-Analysis to determine the effects of plant disease management measures: Review and case studies on soybean and apple. Phytopathology 101, 31–41. doi: 10.1094/PHYTO-03-10-0068
Ngugi H. K., Lehman B. L., Madden L. V. (2011b). Multiple treatment meta-analysis of products evaluated for control of fire blight in the eastern United States. Phytopathology 101, 512–522. doi: 10.1094/PHYTO-08-10-0221
Nichols L. P., Jodon M. H. (1972). Chemical soaks for prevention of growth of pathogenic organisms on clay and plastic pots. Penn. Flower Growers Bull. 250, 6–8.
O’Neill T. M., Pye D. (2000). Chemical disinfection of a sandbed for control of Phytophthora nicotianae. Acta Hortic. 532, 211–215. doi: 10.17660/ActaHortic.2000.532.28
Pullin A. S., Stewart G. B. (2006). Guidelines for systematic review in conservation and environmental management. Conserv. Biol. 20, 1647–1656. doi: 10.1111/j.1523-1739.2006.00485.x
Raid R. N. (2016). Evaluation of foliar fungicides in combination with Orondis seedling drench application for management of downy mildew on sweet basil, Spring 2015. Plant Dis. Manage. Rep. 9, V115.
Rosnow R. L., Rosenthal R. (1996). Computing contrasts, effect sizes, and counter-nulls on other people’s published data: General procedures for research consumers. Psychol. Methods 1, 331–340. doi: 10.1037/1082-989X.1.4.331
Scherm H., Thomas C. S., Garrett K. A., Olsen J. M. (2014). Meta-Analysis and other approaches for synthesizing structured and unstructured data in plant pathology. Annu. Rev. Phytopathol. 52, 453–476. doi: 10.1146/annurev-phyto-102313-050214
Schmidt F. L., Hunter J. E. (2015). Methods of Meta-Analysis. Correcting Error and Bias in Research Findings, Third edition (Thousand Oaks, CA: SAGA Publications, Inc.).
Shi L., Lin L. (2019). The trim-and-fill method for publication bias: practical guidelines and recommendations based on a large database of meta-analyses. Medicine 98, e23. doi: 10.1097/MD.0000000000015987
Keywords: disinfectant, hydrogen dioxide, peracetic acid, peroxyacetic acid, potassium peroxy-monosulfate, sanitizer
Citation: Copes WE and Ojiambo PS (2024) Efficacy of peroxygen disinfestants against non-fungal plant pathogens in agricultural and horticultural production: a systematic review and meta-analysis. Front. Hortic. 2:1228494. doi: 10.3389/fhort.2023.1228494
Received: 24 May 2023; Accepted: 18 December 2023;
Published: 10 January 2024.
Edited by:
Isabel Gomez, National Autonomous University of Mexico, MexicoReviewed by:
Carmen Bartolome, Michoacana University of San Nicolás de Hidalgo, MexicoGabriele Bellotti, Catholic University of the Sacred Heart, Italy
Copyright © 2024 Copes and Ojiambo. This is an open-access article distributed under the terms of the Creative Commons Attribution License (CC BY). The use, distribution or reproduction in other forums is permitted, provided the original author(s) and the copyright owner(s) are credited and that the original publication in this journal is cited, in accordance with accepted academic practice. No use, distribution or reproduction is permitted which does not comply with these terms.
*Correspondence: Warren E. Copes, d2FycmVuLmNvcGVzQHVzZGEuZ292