 Alexa M. Barber1,2
 Nicole B. Kingsley3,4
 Sichong Peng3
 Elena Giulotto5†
 Rebecca R. Bellone3,4†
 Carrie J. Finno3†
 Ted Kalbfleisch6†
 Jessica L. Petersen2*
- 1University of Nebraska Medical Center, Eppley Institute for Research in Cancer and Allied Diseases, Omaha, NE, United States
- 2Department of Animal Science, University of Nebraska-Lincoln, Lincoln, NE, United States
- 3Department of Population Health and Reproduction, School of Veterinary Medicine, University of California-Davis, Davis, CA, United States
- 4Veterinary Genetics Laboratory, Department of Population Health and Reproduction, School of Veterinary Medicine, University of California-Davis, Davis, CA, United States
- 5Department of Biology and Biotechnology, University of Pavia, Pavia, Italy
- 6Department of Veterinary Science, University of Kentucky, Lexington, KY, United States
The Functional Annotation of Animal Genomes (FAANG) consortium aims to annotate animal genomes across species, and work in the horse has substantially contributed to that goal. As part of this initiative, chromatin immunoprecipitation with sequencing (ChIP-seq) was performed to identify histone modifications corresponding to enhancers (H3K4me1), promoters (H3K4me3), activators (H3K27ac), and repressors (H3K27me3) in eight tissues from two Thoroughbred stallions: adipose, parietal cortex, heart, lamina, liver, lung, skeletal muscle, and testis. The average genome coverage of peaks identified by MACS2 for H3K4me1, H3K4me3, and H3K27ac was 6.2%, 2.2%, and 4.1%, respectively. Peaks were called for H3K27me3, a broad mark, using both MACS2 and SICERpy, with MACS2 identifying a greater average number of peaks (158K; 10.4% genome coverage) than SICERpy (32K; 24.3% genome coverage). Tissue-unique peaks were identified with BEDTools, and 1%–47% of peaks were unique to a tissue for a given histone modification. However, correlations among usable reads, total peak number, and unique peak number ranged from 0.01 to 0.92, indicating additional data collection is necessary to parse technical from true biological differences. These publicly available data expand a growing resource available for identifying regulatory regions within the equine genome, and they serve as a reference for genome regulation across healthy tissues of the adult Thoroughbred stallion.
1 Introduction
One of the fundamental goals of genetic research in agricultural species is to associate genomic variation with phenotypic traits of interest. The generation of reference genomes for many species was critical in facilitating genome-wide association studies; however, genomic annotation primarily based on transcriptomic data limits the success of these studies. With protein coding sequences comprising less than 3% of the genome, it is unsurprising that nearly 90% of human trait-associated variants fall outside protein coding sequence (Hindorff et al., 2009; The ENCODE Project Consortium, 2012; Maurano et al., 2012). To address these shortcomings in the annotation of the human reference genome, the Encyclopedia of DNA Elements (ENCODE) project was established with the goal of identifying all functional elements in the human genome.
In the past two decades, the ENCODE project has attributed function to over 80% of the human genome, indicating a large presence of functional elements outside of coding DNA. Cis-regulatory elements aid in maintaining transcriptional programming and include promoters, enhancers, and silencers. In contrast to the roughly 20,000 annotated protein coding genes, the ENCODE project identified nearly 400,000 enhancer and 70,000 promoter regions in the human genome (The ENCODE Project Consortium, 2012). The functional annotation resulting from the ENCODE project and other epigenomic studies has empowered subsequent research that has elucidated the impact of non-coding variants on diseases. Single nucleotide variants (SNVs) and differential methylation within enhancers and promoters have been associated with disorders, such as Alzheimer’s disease, multiple sclerosis, diabetes, congenital heart disease, and other complex diseases (reviewed by van der Lee et al., 2020; Claringbould and Zaugg, 2021). Furthermore, structural variants in cis-regulatory regions can result in enhancer hijacking and disruption of topologically associated domains (TADs) which are frequently implicated in cancer development (Adkemir et al., 2020; Zhang et al., 2022). These studies demonstrate the importance of examining non-coding regions of the genome and annotation of cis-regulatory regions.
With inspiration from the landmark discoveries of the ENCODE project, the Functional Annotation of Animal Genomes (FAANG) initiative was established to functionally annotate the genomes of domesticated animal species and improve the understanding of the genotype-to-phenotype link (The FAANG Consortium, 2015; Tuggle et al., 2016). Part of this effort includes annotating cis-regulatory associated elements using chromatin immunoprecipitation and sequencing (ChIP-seq). ChIP-seq captures the location of histone protein modifications involved in gene regulation, such as methylation (me) and acetylation (ac) of lysine residues on the H3 protein (H3K). The FAANG initiative prioritized ChIP-seq of four histone modifications associated with enhancers (H3K4me1), promotors (H3K4me3), active genomic regions (H3K27ac), and repressed genomic regions (H3K27me3) as core assays (Giuffra et al., 2019). The equine FAANG project previously characterized these four histone modifications in 11 tissues from two Thoroughbred mares (Kingsley et al., 2020; Kingsley et al., 2021). Hundreds of thousands of cis-regulatory associated elements were identified, with 4%–32% of peaks in a given tissue being unique to that tissue (Kingsley et al., 2020). With many genes being differentially expressed between sexes (Lopes-Ramos et al., 2020), the activity of regulatory elements is likely to also differ between sexes. Indeed, differences in histone modifications have been observed between sexes in other species demonstrating the need for annotation of regulatory elements in both sexes (Shen et al., 2015; Keiser and Wood, 2019; Kfoury et al., 2021). Given the detailed analysis performed in mares and no such efforts to focus solely on stallions, this project aimed to characterize histone modifications in the tissues of two adult Thoroughbred stallions to complement the extensive analysis and annotation of cis-regulatory elements in Thoroughbred mares previously published by Kingsley et al. (2020), Kingsley et al. (2021). The incorporation of these data into analyses within and between sexes was included in Peng et al. (2023); the methods of analysis of the cis-regulatory elements in the stallions, and the characterization of ubiquitous and tissue-specific peaks, however, was not previously described. These data continue to contribute to studies of sex-specific and cross-species evaluation of genome function.
2 Materials and methods
2.1 Chromatin extraction and immunoprecipitation
Tissues from two Thoroughbred stallions (ECA_UCD_AH3 [AH3] and ECA_UCD_AH4 [AH4]), were obtained from the equine FAANG Biobank. Complete veterinary reports are available for both stallions in Donnelly et al. (2021). Stallions AH3 and AH4 were aged three and four, respectively, at the time of donation. Stallion AH3 suffered a career-ending musculoskeletal injury in race training prior to donation. Stallion AH4 was not race trained and was the son of the reference genome donor, Twilight. Tissue samples that were prioritized for chromatin immunoprecipitation and sequencing (ChIP-seq) included abdominal adipose, parietal cortex (brain), left ventricle (heart), lamina, liver, lung, longissimus dorsi (muscle), and testis. Collected tissues were flash frozen in liquid nitrogen and stored at −80°C (Donnelly et al., 2021). ChIP preparation and sequencing was performed by Diagenode using their ChIP-seq Profiling Service (Diagenode, Cat# G02010000, Liège, Belgium). Chromatin was extracted and prepared using the iDeal ChIP-seq kit for Histones (Diagenode Cat# C01010059). Tissue samples were first homogenized using a Tissue Lyser II (Qiagen, Germany) and fixed in 1% formaldehyde to crosslink histone proteins with DNA. Chromatin was sheared using a Bioruptor Pico (Diagenode, Cat# B01060001, Liège, Belgium) in 30 s burst to achieve a targeted fragment size of 200 bp. A temperature of 4°C (10°C for adipose) was maintained during shearing (Bioruptor water cooler). The optimization of these parameters had been previously completed at Diagenode for equine adipose, parietal cortex, left ventricle (heart), lamina, liver, lung, and skeletal muscle as part of the equine FAANG project published by Kingsley et al. (2020). Optimization of chromatin extraction, ChIP, and library preparation for testis was performed for this study. Information regarding the homogenization, fixation, and shearing of each sample is reported in Supplementary Table 1. After crosslink reversal and DNA purification, shearing was assessed using the High Sensitivity NGS Fragment Analysis Kit (DNF-474) on an Agilent Fragment Analyzer (Santa Clara, CA, United States).
Immunoprecipitation (IP) of H3K27ac, H3K27me3, H3K4me1, and H3K4me3 histone marks was performed using the IP-Star Compact Automated System (Diagenode, Cat# B03000002, Liège, Belgium) in all samples except muscle, which was done manually due to low chromatin retrieval. IP of IgG served as a negative control across samples, and 1% of chromatin from each sample was set aside prior to IP for an input sample that serves to correct for background noise in downstream analysis. The amount of antibody used to precipitate each histone mark and IgG differed across tissues and was previously optimized (Kingsley et al., 2020) (Supplementary Table 2).
2.2 Library preparation and sequencing
Libraries for the input and ChIP samples for each of the four histone marks were prepared using the MicroPlex Library Preparation Kit v3 (Diagenode Cat# C05010001). Seven to thirteen PCR cycles were used to amplify libraries and achieve appropriate concentrations for sequencing. Libraries were double size-selected for fragments with insert sizes of ∼200 bp using Agencourt® AMPure® XP (Beckman Coulter, Brea, CA, United States) and quantified with the Qubit dsDNA HS Assay Kit (Thermo Fisher Scientific, Q32854, Waltham, MA, United States). Libraries were sequenced as 50bp, paired-end reads on an Illumina HiSeq 4,000 platform (San Diego, CA, United States) to a target depth of 100 million raw reads for H3K27me3 (broad mark) and 50 million raw reads for H3K327ac, H3K4me1, and H3K4me3 (narrow marks) and input samples as determined by the data presented by Kingsley et al. (2020), Kingsley et al. (2021).
2.3 Library mapping and read filtering
Adapters were removed and reads trimmed using Trim-Galore/0.6.5 (Krueger, 2019). Reads were mapped to EquCab3.0 with BWA-mem/0.7.17 (Li, 2013). Samtools/1.9 (Li et al., 2009) was employed to mark PCR duplicates and remove read pairs that were unmapped, non-primary alignments, optical duplicates, or had a mapping alignment quality score (MAPQ) of less than 30 prior to peak calling. The targeted usable fragment counts were 45 million for H3K27me3 and 20 million for the remaining marks and input samples as outlined in the ENCODE project (https://www.encodeproject.org/chip-seq/histone/). The H3K27ac adipose sample from ECA_UCD_AH3 had less than half of the targeted usable fragments, so an additional library was prepared and sequenced. The filtered reads from both rounds of sequencing were merged for downstream analysis.
2.4 Peak calling and signal tracks
Peaks, representing regions of read pileup, were identified using the pipeline established by Kingsley et al. (https://faang.org/ebi/ftp.ebi.ac.uk/faang/ftp/protocols/analyses/UCD_SOP_processing_and_analyzing_equine_PE_ChIP_data_20201230.pdf). MACS2/2.1.1 (Zhang et al., 2008) was used to call peaks across all four histone marks with a false discovery rate (FDR) cutoff of 0.01 for H3K4me3 and H3K27ac and an FDR cutoff of 0.05 for H3K4me1 and H3K27me3. The “--broad” flag and a broad cutoff of 0.1 were employed for calling H3K27me3 peaks in MACS2. Fold-enrichment (FE) over the input control was determined for each sample in MACS2 with a p-value threshold of
2.5 Generating replicate-validated peak sets
Peak sets from each sample with an FE over input of greater than 2.0 for narrow marks, H3K27ac, H3K4me1, and H3K4me3, and 1.5 for broad marks, H3K27me3, were generated in Python/3.8. These FE-filtered peaks from one replicate were intersected with all called peaks from the other replicate using BEDTools/2.27.1 (Quinlan and Hall, 2010). The replicate-validated peaks from both replicates were merged to generate a combined peak set where all peaks achieved an FDR of less than 0.01 or 0.05, respective of histone mark, in both replicates and an FE of over 2.0 (or 1.5 for broad marks) in at least one replicate. These combined peak sets were used for tissue comparison in downstream analyses. The quality of the combined peak dataset was assessed by determining the Fraction of Reads in Peaks (FRiP) for each replicate in the corresponding peak file. FRiP scores were calculated using BEDTools/2.27.1 intersect by comparing the number of reads overlapping peaks to the total number of reads used for peak calling. BEDTools/2.27.1 was also employed to identify peaks unique to each tissue for a given histone mark. Microsoft Excel (Microsoft Corporation, 2018) was used to calculate Pearson’s correlations (r) between usable reads and total peak number, where usable reads is defined as the minimum number of filtered reads available for peak calling across biological replicates. Pearson’s correlations between total peak number and tissue-unique peak number were also assessed.
2.6 Feature annotation of combined peaks
Histone modification peaks were assigned to genomic features using the R package ChIPseeker/3.2 (Yu et al., 2015; Wang et al., 2022). A txdb annotation file was created from Ensembl’s EquCab3.0.113 using the R package txdbmaker/1.2.1 (Pagès et al., 2024). The annotatePeak function was employed with promoter region defined as ± 1000bp from the transcription start site (TSS).
3 Results
3.1 Sequencing depth and read filtration of paired-end libraries
On average, each stallion sample had 52 million (M) raw read pairs for H3K27ac and H3K4me1, 55 M for H3K4me3, and 134 M raw read pairs for H3K27me3. Filtering removed PCR duplicates, unmapped, and low-quality reads to create a set of read pairs used for peak calling, termed usable reads. The average number of usable reads was 28 M for H3K27ac, 32 M for H3K4me1, 30 M for H3K4me3, and 68 M for H3K27me3. Each tissue sample had an input sample with an average of 34 M reads used to remove background noise during peak calling for all marks. Despite generating over 215 M raw read pairs between the two H3K27ac_Adipose_AH3 libraries, less than 12 M usable reads were available for peak calling. Additionally, seven other sample/tissue combinations fell short of the targeted usable read counts; however, all were retained for analysis in the study regardless of read counts (Supplementary Table 4).
3.2 Quantifying peaks across tissues
On average, each tissue had 76,778 H3K27ac peaks, 120,309 H3K4me1 peaks, and 33,969 H3K4me3 peaks (Figure 1A). Similar peak widths were observed across the narrow marks, with average peak widths of 1,360 bp, 1,219 bp, and 1,535 bp for H3K27ac, H3K4me1, and H3K4me3, respectively, yet peak width ranged considerably (Supplementary Figure 1). The number of peaks called for H3K27me3 varied based on the software used for peak calling. MACS2 identified an average of 158,480 H3K27me3 peaks while SICERpy called an average of 32,315 H3K27me3 peaks across tissues (Figure 1B). The average peak width of MACS2 H3K27me3 peaks was 1,650 bp while the average peak width of SICERpy H3K27me3 peaks was 18,466 bp (Supplementary Figure 1). The replicate-combined peaks captured read enrichment well with median FRiP scores of 0.46, 0.32, and 0.65 for H3K27ac, H3K4me1, and H3K4me3 peaks, respectively. The median FRiP scores for H3K27me3 peaks varied by peak caller with median FRiPs scores of 0.30 for MACS2 peaks and 0.47 for SICERpy peaks (Figure 1C). Although large difference in FRiP scores are observed between H3K27me3 peaks called by MACS2 and SICERpy, the difference in FriP scores and the difference in genome coverage are highly correlated (r = 0.94, data not shown).
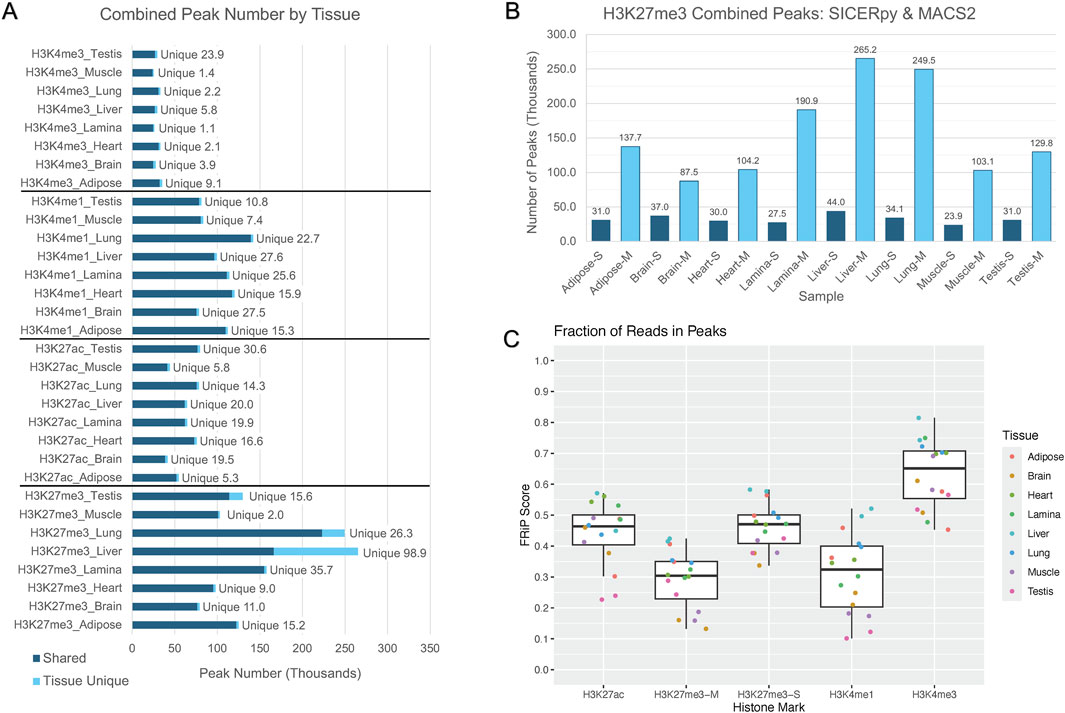
Figure 1. Peaks corresponding to histone modifications across the genome. (A) The bar plot depicts the number of peaks in thousands called by MACS2 corresponding to the signal from the denoted histone modifications: H3K4me3, H3K4me1, H3K27ac, and H3K27me3. The peaks identified to be unique to a given tissue for a given mark are discerned from shared peaks in light blue. (B) The peak calling software, MACS2 or SICERpy, results in a drastically different number of peaks being identified despite using the same input reads. Peaks called by SICERpy are in dark blue and labelled with an “-S,” while peaks called by MACS2 are light blue and labelled with “-M.” (C) The Fraction of Reads in Peaks (FRiP) score represents the number of read pairs from each replicate that fall within the combined peaks reported for a given tissue and mark. FRiP scores are separated by histone mark and peak calling software, if applicable. “-M” corresponds to MACS2 peaks and “-S” corresponds to SICERpy peaks. Each data point is colored to represent the tissue of origin for the given sample.
H3K4me3 had the lowest genome coverage across tissues, averaging 2.2%. H3K27ac peaks covered an average of 4.1% of the genome across tissues, and H3K4me1 covered approximately 6.2% of the genome in each tissue. H3K27me3 peaks called by MACS2 covered an average of 10.4% of the genome, while H3K27me3 peaks called by SICERpy covered 24.3% of the genome in each tissue (Table 1). Despite the nearly two-fold greater genome coverage identified for H3K27me3 by SICERpy compared to MACS2, the peaks called by both software frequently overlapped. As a result of the smoothing effect of SICERpy, one large peak called by SICERpy often contained many smaller, consecutive peaks called by MACS2. In fact, 74%–94% of the peaks called by MACS2 overlapped those called by SICERpy (Supplementary Table 5).
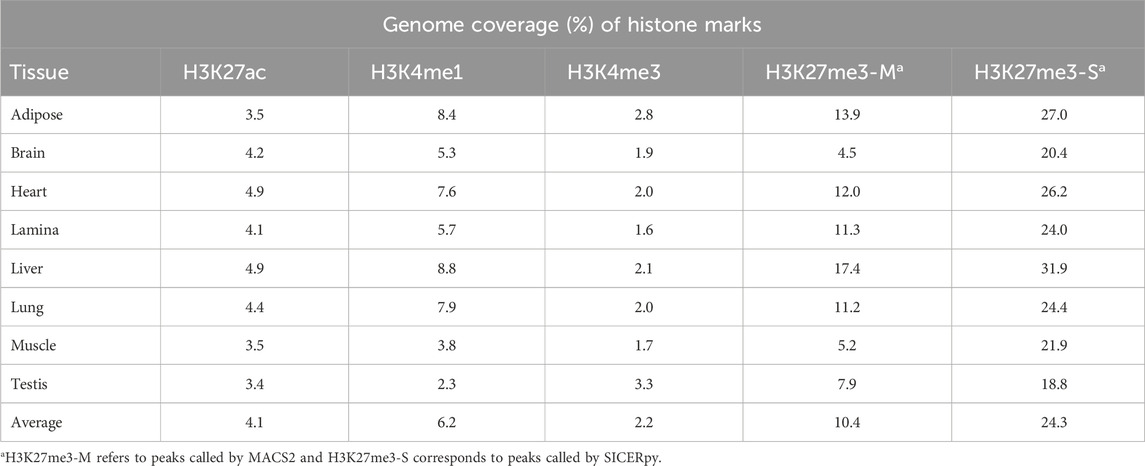
Table 1. Percentage of the equine genome covered by histone marks in thoroughbred stallions.
3.3 Genomic annotation of combined peaks
The combined MACS2 peaks for each tissue and histone mark combination were assigned to genomic features annotated in Ensembl’s 113 release of EquCab3.0. Due to the drastically increased peak widths of H3K27me3 peaks identified with SICERpy, averaging over 18kb, SICERpy H3K27me3 peaks were not annotated for genomic feature. H3K4me3 had the greatest number of peaks assigned to promoters ranging from approximately 35% in testis to 60% in muscle (Figure 2A). H3K27me3 had the fewest peaks assigned to promoters with over 40% of peaks identified as distal intergenic in all eight tissues. The distance between genomic features for a given transcript can vary dramatically based on heterogeneity in total transcript, exon, and intron lengths; therefore, distribution of peaks around the TSS is also reported (Figure 1B). Histone modifications commonly associated with gene activation (H3K4me3 and H3K27ac) are distributed more tightly around the TSS than the repressive mark, H3K27me3 (Figure 2B).
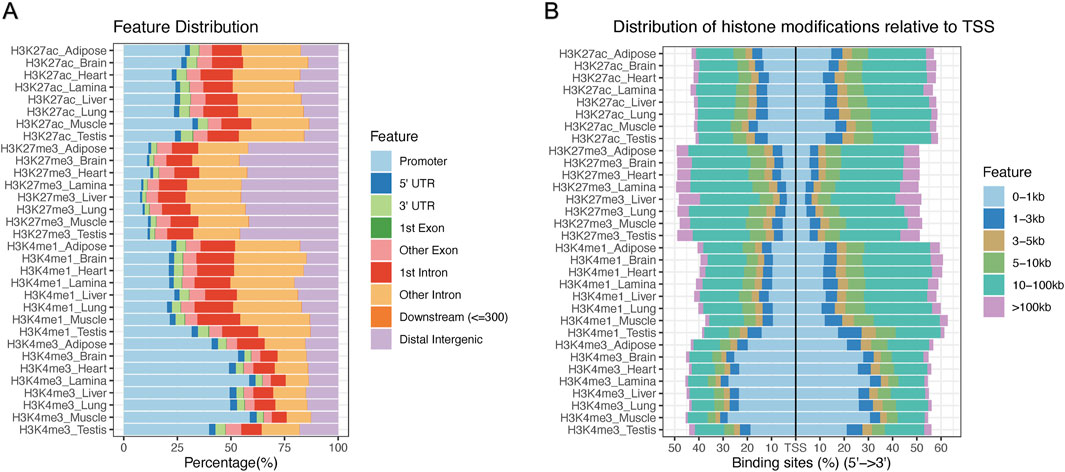
Figure 2. Distribution of histone modifications across the equine genome (A) The percentage of combined peaks assigned to gene features across samples. The promoter region is defined as ± 1000bp from the transcription start site (TSS), while downstream represents peaks within 300bp of the 3′ UTR of a given transcript. (B) The percentage of peaks falling within given distances of the TSS are presented. Known activating marks (H3K27ac and H3K4me3) fall closer to the TSS than the repressive mark, H3K27me3.
3.4 Tissue-unique peaks and correlations of usable reads and peak number
On average, 84% of peaks called for a histone mark were identified in more than one tissue, yet some tissues had a large percentage of unique peaks. The brain had the largest proportion of unique peaks for H3K4me1 and H3K27ac, with 27,532 peaks or 27% of H3K4me1 and 19,494 peaks or 33% of H3K27ac peaks identified as tissue-unique (Figure 1A; Table 2). Nearly 50% of H3K4me3 peaks in the testis were unique. The liver displayed the greatest proportion of unique peaks for H3K27me3 regardless of peak caller. Muscle consistently demonstrated low uniqueness across all four marks (Table 2). However, positive correlations existed between the number of reads used for peak calling and the number of peaks called. Correlation coefficients (r) between the minimum usable reads and total peaks called ranged from 0 to 0.86 across marks, with the smallest correlation observed in the H3K4me1 and the greatest correlation observed in H3K27me3 (Table 3). The number of unique peaks in a tissue was also highly correlated (0.52–0.92) with the total peaks called for that tissue (Table 2).
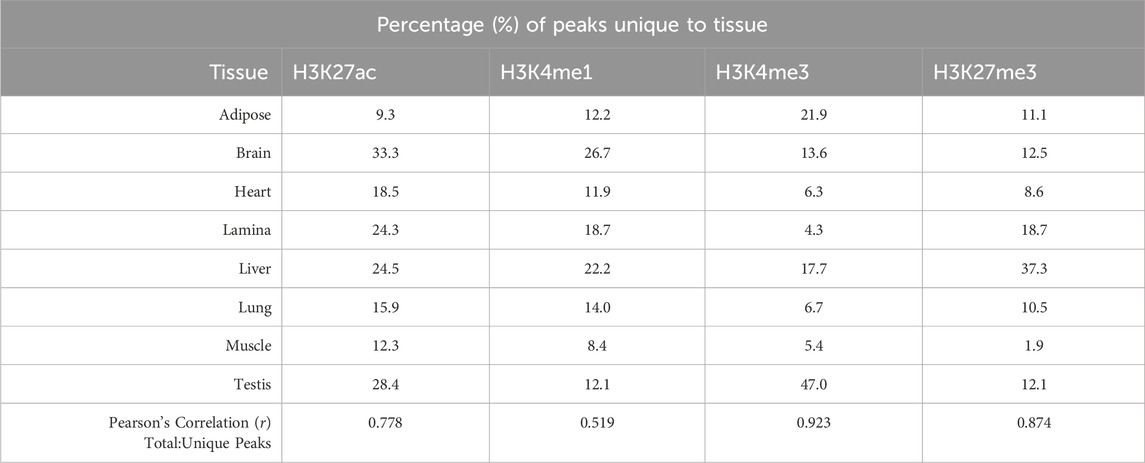
Table 2. Tissue-unique peaks and Pearson’s correlations of total and tissue-unique peak numbers.
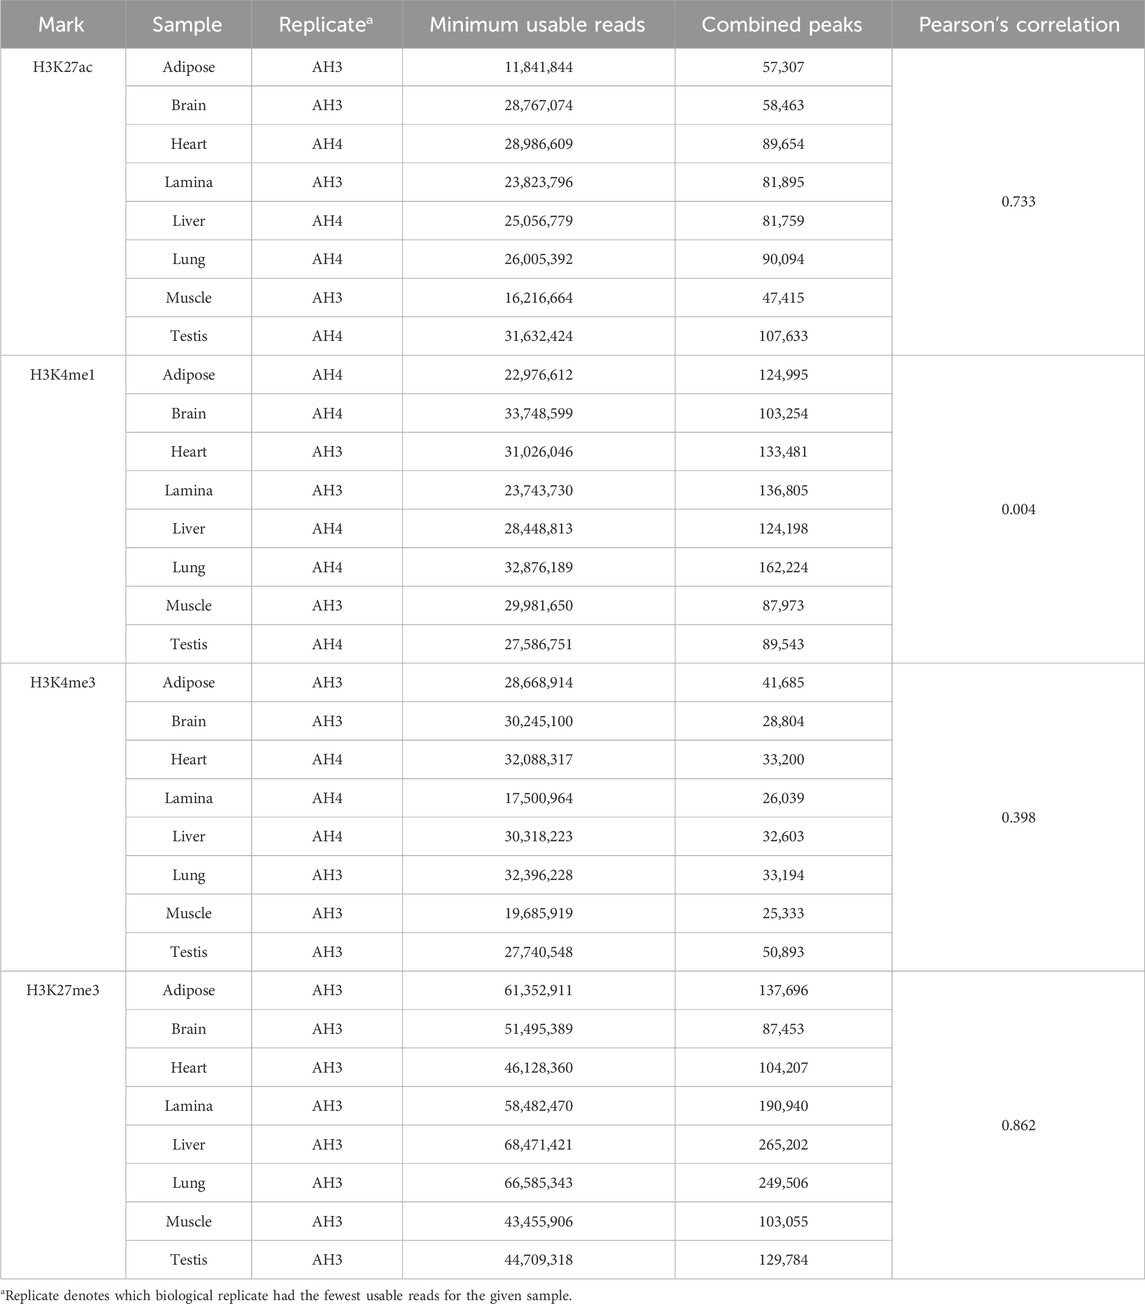
Table 3. Pearson’s correlations of minimum usable reads and replicate-validated combined peak number.
3.5 Validation of tissue-specific epigenetic regulation
To assess how well tissue-unique peaks correspond to known tissue function, genes with unique active promoters, defined as having both H3K4me3 and H3K27ac peaks in their promoters, were identified. Examples for tissue-specific active promoters are provided in lamina at the Collagen 17A1 (COL17A1) gene (Figure 3A) and in heart at the Myozenin 2 (MYOZ2) gene (Figure 3B). The signal tracks present in Figure 3 demonstrate how the stallion ChIP-seq data can be integrated with mare ChIP-seq data (Kingsley et al., 2020) and the equine FAANG RNA-seq data to better assess tissue-specific epigenetic regulation.
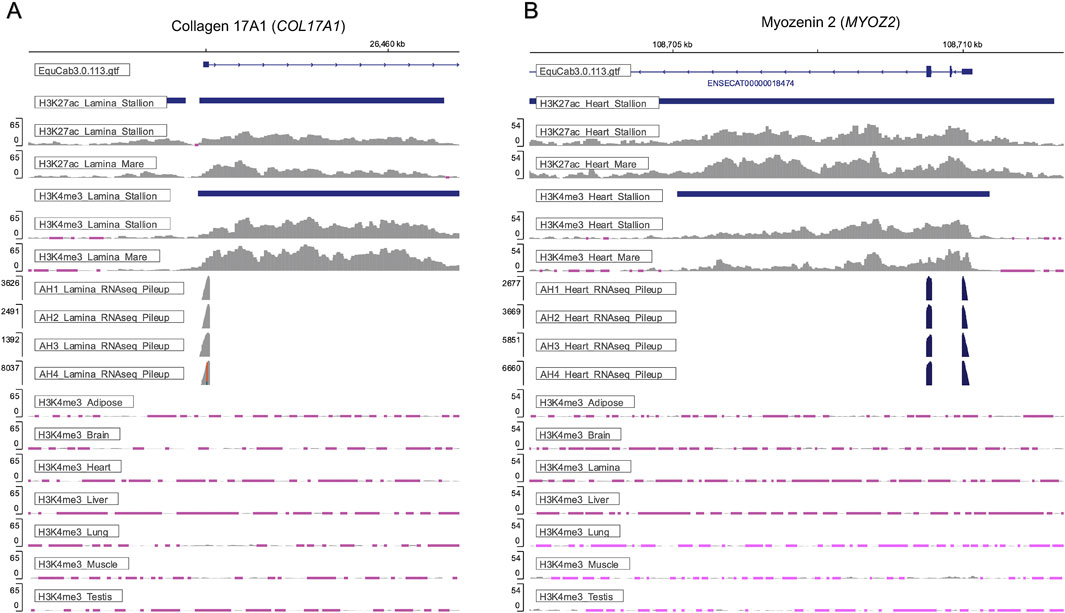
Figure 3. Tissue-specific active promoters are present across tissues and supported by gene expression data. (A) H3K4me3 and H3K27ac peaks within the promoter of the Collagen 17A1 (COL17A1) gene were uniquely identified in lamina from stallions. Enrichment of H3K4me3 under these peaks is only observed in lamina from the stallion tissues. Similar enrichment of H3K27ac and H3K4me3 are observed in lamina from mares (Kingsley et al., 2020), and the expression of COL17A1 can be confirmed by the RNA-seq data corresponding to lamina from the stallions in this study, as well as the lamina from the mares in Kingsley et al. (2020). (B) Enrichment of H3K4me3 and H3K27ac at the promoter of Myozenin 2 (MYOZ2) was uniquely observed in the heart tissue of stallions. Enrichment of these histone modifications is supported by the mare data from Kingsley et al. (2020), and gene expression of MYOZ2 is observed in the corresponding RNA-seq data from these tissues. All signal tracks depicted are available at https://equinegenomics.uky.edu. *Note: Pink regions of signal denote loci where the input signal is greater than the sample signal.
4 Discussion
On average, each tissue in the stallions had over 250,000 peaks called across the four histone marks. The most common cis-regulatory associated histone modifications were H3K27me3, which play a role in repressing gene expression. This broad peak covered the greatest percentage of the genome, with some tissues having evidence of this repressive mark covering as much as 32% of the genome. This result differs from what was reported for mares with the greatest proportion of the genome covered (4.9%) in adipose as determined using SICERpy (Kingsley et al., 2020). On average, four times as many usable reads were available for H3K27me3 peak calling in stallion tissues compared to the mare tissues examined by Kingsley et al. (2020). A high correlation (r = 0.86) between usable reads and H3K27me3 peak number exists in the stallion tissues, suggesting the difference in genome coverage observed between sexes may be an artifact of sequencing depth. The H3K27me3 genome coverage of assessed stallion tissues is similar to other published data demonstrating that H3K27me3, and corresponding facultative heterochromatin, can stretch across 20%–30% of the genome under various circumstances (Hosogane et al., 2016; reviewed by Peng and Karpen, 2008). The enzymes that are involved in trimethylation of H3K27 often follow a positive feedback loop in which the presence of H3K27me3 increases trimethylation of nearby histones, which may explain the expansive genome coverage of H3K27me3 peaks in this study and others (Schmitges et al., 2011; Oksuz et al., 2018). Despite known biological variability of H3K27me3 across tissues, both the number and width of the H3K27me3 peaks identified in this study varied considerably based on the peak calling software. MACS2 identified nearly five times as many H3K27me3 peaks as SICERpy, yet the average width of the peaks called by SICERpy was over ten times larger than those called by MACS2. FRiP scores for H3K27me3 were high for both MACS2 and SICERpy peaks ranging from 0.10 to 0.58. These FRiP scores fall well above the ENCODE FRiP score threshold of 1% (Landt et al., 2012). Although SICERpy consistently produce greater FRiP scores than MACS2, the difference can almost exclusively be attributed to the difference in genome coverage between the peak calling software.
Steinhauser et al. (2016) also assessed peak calling software for broad peaks, including H3K27me3, in which SICER called considerably wider peaks than peak calling software based on MACS2. A gold standard method for peak calling has yet to be established, thus simulated ChIP-seq datasets are required to examine the sensitivity and specificity of peak calling software. On simulated datasets, SICER outperformed 10 different peak-calling tools for both identifying true peaks and limiting false positives when examining a broad-peaked histone modification (Steinhauser et al., 2016). SICER was designed to better capture broad and diffuse peaks, such as those of H3K27me3; therefore, peaks called by SICERpy may better represent the proportion of the genome repressed due to H3K27me3 (Xu et al., 2014). MACS2 is most often used to identify narrow peaks suggesting that H3K27me3 peaks called by MACS2 may represent regions of the genome with the strongest H3K27me3 signals.
The number of peaks called for each mark varied by tissue, yet muscle samples consistently had fewer peaks than other tissues across all histone marks possibly due to the lesser amount of chromatin retrieved for library preparation. However, the same amount of chromatin was used in the ChIP-seq analysis of mare tissue (Kingsley et al., 2020) with no reduction in peak number observed across skeletal muscle samples in that report. The muscle sample from one of the stallions (AH3) failed to produce the targeted number of usable reads for H3K27ac, H3K27me3, H3K4me3, and the input sample, yet in all cases, the number of usable reads was within 20% of the target. Even so, moderate positive correlations between the number of reads used for peak calling and the number of peaks called suggest that additional ChIP and/or sequencing may improve the identification of regulatory elements in muscle.
The strong positive correlation between the number of usable reads and peaks called for H3K27ac and H3K27me3 suggests that the ideal sequencing depth had not been reached in many of the samples. Although data from most tissues produced enough usable reads to achieve the thresholds established by ENCODE (https://www.encodeproject.org/chip-seq/histone/); 20 M for narrow marks and 45 M for broad marks), our data suggest that these thresholds may not be sufficient in all tissue types. This is well demonstrated by the broad mark, H3K27me3, when considering the shared tissues between mares and stallions. When increasing the average number of usable reads from 27 M in mares to 72 M in stallions, the average genome coverage of H3K27me3 peaks called by SICERpy increased from 3.8% to 25.1% (Kingsley et al., 2020). The need for additional sequencing beyond the guidelines set by ENCODE has also been echoed in other studies (Chen et al., 2012). Further work is necessary to determine at which point additional reads no longer enhance the ability to call peaks, which may differ across tissue types or due to tissue quality. It is important, however, that even if all regulatory elements in the assayed tissues were not captured, those that were served to annotate hundreds of thousands of cis-regulatory associated histone modifications, lending valuable information into the genome function of those tissues.
In addition to a moderate correlation between usable reads and peaks called, a strong positive correlation was identified between the number of peaks called in a tissue and those identified as unique to that tissue. This correlation makes it difficult to determine if these uniquely identified peaks represent biological differences in the regulatory elements of tissues or if they are an artifact of the total number of histone modifications captured across tissues. Yet, in the case of the H3K27ac and H3K4me1, the highest percentage of uniqueness is observed in the brain despite having fewer peaks than five of the other tissues. Similarly, the highest percentage of unique peaks occurred for H3K27ac in brain of mares as previously reported by Kingsley et al. (2020). Inevitably, the tissue-unique peaks identified will vary as additional tissues are examined; however, many identified tissue-unique histone modifications marked genes with known, tissue-specific functions. Examples in which unique activating marks are found include collagen 17A1 (COL17A1) in the lamina and Myozenin 2 (MYOZ2) in the heart. COL17A1 is enriched in skin in humans and functions in maintaining the epidermal-dermal junction (NIH GeneID: 1,308). MYOZ2 was shown to have tissue-specificity in human cardiac myocytes (NIH GeneID: 51,778). The H3K27ac and H3K4me3 signals in these genes in lamina and heart, respectively, are well supported by the ChIP-seq data in mares (Kingsley et al., 2020), and further supported by high expression of COL17A1in lamina and MYOZ2 in the left ventricle of the heart in corresponding RNA-seq data. Although further work to validate tissue-unique peaks will need to involve additional tissue analysis and corresponding transcriptomics data, preliminary analysis confirms that many tissue-specific histone modifications identified in this manuscript are supported by previously published data.
The annotation of regulatory elements has proven beneficial in characterizing the function of the genome and associating genomic variation with disease in humans (The ENCODE Project Consortium, 2012; Adkemir et al., 2020; van der Lee et al., 2020; Claringbould and Zaugg, 2021; Zhang et al., 2022). In this study, hundreds of thousands of cis-regulatory associated histone modifications were identified across tissues in the Thoroughbred stallion, providing foundational information into the function of the equine genome. The data from the previously published ChIP-seq analyses in the mares has already aided in the identification of variants associated with distichiasis and the characterization of centromere sliding in horses (Kingsley et al., 2020; Hisey et al., 2020; Cappelletti et al., 2023). The ChIP-seq analyses in the stallion provide additional support for the annotation of regulatory elements present in the tissues of adult horses and may be valuable in determining differences in epigenomic regulation across sex in horses. Although peaks unique to tissues in this study cannot entirely be attributed to true biological differences, they provide a basis for hypothesis generation and testing. These analyses demonstrate some of the shortcomings in the current methodology and standards used for identifying cis-regulatory elements. As previously suggested, chromatin extraction, library preparation, sequencing methods, and peak calling software have large impacts on the interpretation of ChIP-seq experimental data (Steinhauser et al., 2016; Zhang et al., 2016; Nakato and Shirahige, 2017; Xiang et al., 2020). These artifacts of data processing can impair the ability to accurately identify biological differences across datasets. While much progress has been made in our understanding of genome function with the annotation of cis-regulatory associated histone modifications, technological advancements will be necessary for enhanced comparative studies of genome regulation across sexes and species.
Data availability statement
The datasets presented in this study can be found in online repositories. The names of the repository/repositories and accession number(s) can be found below: https://www.ncbi.nlm.nih.gov/bioproject/PRJEB57637/; https://equinegenomics.uky.edu. Processed data, including individual narrow Peak files and annotated replicate-verified BED files, are available on Open Science Framework at osf.io/ghvp9 (Barber, 2025).
Ethics statement
The animal study was approved by University of California-Davis, IACUC. The study was conducted in accordance with the local legislation and institutional requirements.
Author contributions
AB: Data curation, Formal Analysis, Investigation, Methodology, Validation, Visualization, Writing–original draft. NK: Formal Analysis, Methodology, Writing–review and editing. SP: Formal Analysis, Methodology, Writing–review and editing. EG: Conceptualization, Funding acquisition, Writing–review and editing. RB: Conceptualization, Funding acquisition, Investigation, Supervision, Writing–review and editing. CF: Conceptualization, Data curation, Funding acquisition, Investigation, Resources, Supervision, Writing–review and editing. TK: Data curation, Funding acquisition, Writing–review and editing. JP: Conceptualization, Data curation, Funding acquisition, Investigation, Project administration, Supervision, Writing–review and editing.
Funding
The author(s) declare that financial support was received for the research, authorship, and/or publication of this article. This work was supported by the Animal Health and Production and Animal Products: Animal Breeding, Genetics, and Genomics Grant 2019-67015-29340/Project Accession 1018854, from the U.S. Department of Agriculture's National Institute of Food and Agriculture (NIFA). Funding was also provided by USDA NRSP8 Species Coordinator funds and the University of California-Davis Center for Equine Health (CEH).
Acknowledgments
This work was completed utilizing the Holland Computing Center of the University of Nebraska which receives support from the Nebraska Research Initiative.
Conflict of interest
The authors declare that the research was conducted in the absence of any commercial or financial relationships that could be construed as a potential conflict of interest.
Generative AI statement
The author(s) declare that no Generative AI was used in the creation of this manuscript.
Publisher’s note
All claims expressed in this article are solely those of the authors and do not necessarily represent those of their affiliated organizations, or those of the publisher, the editors and the reviewers. Any product that may be evaluated in this article, or claim that may be made by its manufacturer, is not guaranteed or endorsed by the publisher.
Supplementary material
The Supplementary Material for this article can be found online at: https://www.frontiersin.org/articles/10.3389/fgene.2025.1534461/full#supplementary-material
References
Adkemir, K. C., Le, V. T., Chandran, S., Li, Y., Verhaak, R. G., Beroukhim, R., et al. (2020). Disruption of chromatin folding domains by somatic genomic rearrangements in human cancer. Nat. Genet. 52 (3), 294–305. doi:10.1038/s41588-019-0564-y
Barber, A. (2025). Stallion FAANG histone ChIP-seq analyzed data. Available at: http://osf.io/ghvp9.
Cappelletti, E., Piras, F. M., Sola, L., Petersen, J. L., Bellone, R. R., Finno, C. J., et al. (2023). The localization of centromere protein A is conserved among tissues. Commun. Biol. 6, 963. doi:10.1038/s42003-023-05335-7
Chen, Y., Negre, N., Li, Q., Mieczkowska, J. O., Slattery, M., Liu, T., et al. (2012). Systematic evaluation of factors influencing ChIP-seq fidelity. Nat. Methods 9, 609–614. doi:10.1038/nmeth.1985
Claringbould, A., and Zaugg, J. B. (2021). Enhancers in disease: molecular basis and emerging treatment strategies. Trends Mol. Med. 27 (11), 1060–1073. doi:10.1016/j.molmed.2021.07.012
Diaz, A., Park, K., Lim, D. A., and Song, J. S. (2012). Normalization, bias correction, and peak calling for ChIP-seq. Stat. Appl. Genet. Mol. Biol. 11 (3), 9. doi:10.1515/1544-6115.1750
Donnelly, C. G., Bellone, R. R., Hales, E. N., Nguyen, A., Katzman, S. A., Dujovne, G. A., et al. (2021). Generation of a biobank from two adult thoroughbred stallions for the functional annotation of animal genomes initiative. Front. Genet. 12, 650305. doi:10.3389/fgene.2021.650305
Giuffra, E., and Tuggle, C. K.the FAANG Consortium (2019). Functional annotation of animal genomes (FAANG): current achievements and roadmap. Annu. Rev. Anim. Biosci. 7, 65–88. doi:10.1146/annurev-animal-020518-114913
Hindorff, L. A., Sethupathy, P., Junkins, H. A., Ramos, E. M., Mehta, J. P., Collins, F. S., et al. (2009). Potential etiologic and functional implications of genome-wide association loci for human diseases and traits. PNAS 106 (23), 9362–9367. doi:10.1073/pnas.0903103106
Hisey, E. A., Hermans, H., Lounsberry, Z. T., Avila, F., Grahn, R. A., Knickelbein, K. E., et al. (2020). Whole genome sequencing identified a 16 kilobase deletion on ECA13 associated with distichiasis in Friesian horses. BMC Genomics 21 (1), 848. doi:10.1186/s12864-020-07265-8
Hosogane, M., Funayama, R., Shirota, M., and Nakayama, K. (2016). Lack of transcription triggers H3K27me3 accumulation in the gene body. Cell Rep. 16 (3), 696–706. doi:10.1016/j.celrep.2016.06.034
Keiser, A. A., and Woods, M. A. (2019). Examining the contribution of histone modification to sex differences in learning and memory. Learn. and Mem. 26, 318–331. doi:10.1101/lm.048850.118
Kfoury, N., Qi, Z., Prager, B. C., Rubin, J. B., Broestl, L., Berrett, K. C., et al. (2021). Brd4-bound enhancers drive cell-intrinsic sex differences in glioblastoma. PNAS 118 (16), e2017148118. doi:10.1073/pnas.2017148118
Kingsley, N. B., Hamilton, N. A., Lindgren, G., Orlando, L., Bailey, E., Brooks, S., et al. (2021). “Adopt-a-Tissue” initiative advances efforts to identify tissue-specific histone marks in the mare. Front. Genet. 12, 649959. doi:10.3389/fgene.2021.649959
Kingsley, N. B., Kern, C., Creppe, C., Hales, E. N., Zhou, H., Kalbfleisch, T. S., et al. (2020). Functionally annotating regulatory elements in the equine genome using histone mark ChIP-seq. Genes 11 (1), 3. doi:10.3390/genes11010003
Krueger, F. (2019). Trim galore! (version 0.6.5). Available at: https://www.bioinformatics.babraham.ac.uk/projects/trim_galore/.
Landt, S. G., Marinov, G. K., Kundaje, A., Kheradpour, P., Pauli, F., Batzoglou, S., et al. (2012). ChIP-seq guidelines and practices of the ENCODE and modENCODE consortia. Genome Res. 22 (9), 1813–1831. doi:10.1101/gr.136184.111
Li, H. (2013). Aligning sequence reads, clone sequences and assembly contigs with BWA-MEM. arXiv Genomics. doi:10.48550/arXiv.1303.3997
Li, H., Handsaker, B., Wysoker, A., Fennell, T., Ruan, J., Homer, N., et al. (2009). The sequence alignment/map format and SAMtools. Bioinf 25 (16), 2078–2079. doi:10.1093/bioinformatics/btp352
Lopes-Ramos, C. M., Chen, C. Y., Kuijer, M. L., Paulson, J. N., Sonawane, A. R., Fagny, M., et al. (2020). Sex differences in gene expression and regulatory networks across 29 human tissues. Cell Rep. 31 (12), 107795. doi:10.1016/j.celrep.2020.107795
Maurano, M. T., Humbert, R., Rynes, E., Thurman, R. E., Haugen, E., Wang, H., et al. (2012). Systematic localization of common disease-associated variation in regulatory DNA. Science 337 (6099), 1190–1195. doi:10.1126/science.1222794
Microsoft Corporation (2018). Microsoft excel. Available at: https://office.microsoft.com/excel.
Nakato, R., and Shirahige, K. (2017). Recent advances in ChIP-seq analysis: from quality management to whole-genome annotation. Briefings Bioinf 18 (2), 279–290. doi:10.1093/bib/bbw023
Oksuz, O., Narendra, V., Lee, C. H., Descostes, N., LeRoy, G., Raviram, R., et al. (2018). Capturing the onset of PRC2-mediated repressive domain formation. Mol. Cell 70 (6), 1149–1162. doi:10.1016/j.molcel.2018.05.023
Pagès, H., Carlson, M., Aboyoun, P., Falcon, S., and Morgan, M. (2024). txdbmaker: tools for making TxDb objects from genomic annotations. R. package version 1.2.1. Available at: https://bioconductor.org/packages/txdbmaker. doi:10.18129/B9.bioc.txdbmaker
Peng, J. C., and Karpen, G. H. (2008). Epigenetic regulation of heterochromatic DNA stability. Curr. Opin. Genet. Dev. 18 (2), 204–211. doi:10.1016/j.gde.2008.01.021
Peng, S., Dahlgren, A. R., Donnelly, C. G., Hales, E. N., Petersen, J. L., Bellone, R. R., et al. (2023). Functional annotation of the animal genomes: an integrated annotation resource for the horse. PLoS Genet. 19 (3), e1010468. doi:10.1371/journal.pgen.1010468
Quinlan, A. R., and Hall, I. M. (2010). BEDTools: a flexible suite of utilities for comparing genomic features. Bioinf 26 (6), 841–842. doi:10.1093/bioinformatics/btq033
Ramírez, F., Dündar, F., Diehl, S., Grüning, B. A., and Manke, T. (2014). deepTools: a flexible platform for exploring deep-sequencing data. Nucleic Acids Res. 42, W187–W191. doi:10.1093/nar/gku365
Schmitges, F. W., Prusty, A. B., Faty, M., Stützer, A., Lingaraju, G. M., Aiwazian, J., et al. (2011). Histone methylation by PRC2 is inhibited by active chromatin marks. Mol. Cell 42 (3), 330–341. doi:10.1016/j.molcel.2011.03.025
Shen, E. Y., Ahern, T. H., Cheung, I., Straubhaar, J., Dincer, A., Houston, I., et al. (2015). Epigenetics and sex differences in the brain: a genome-wide comparison of histone-3 lysine-4 trimethylation (H3K4me3) in male and female mice. Exp. Neurol. 268, 21–29. doi:10.1016/j.expneurol.2014.08.006
Steinhauser, S., Kurzawa, N., Eils, R., and Herrmann, C. (2016). A comprehensive comparison of tools for differential ChIP-seq analysis. Briefings Bioinf 17 (6), 953–966. doi:10.1093/bib/bbv110
The ENCODE Project Consortium (2012). An integrated encyclopedia of DNA elements in the human genome. Nature 489 (7414), 57–74. doi:10.1038/nature11247
The FAANG Consortium. Andersson, L., Archibald, A. L., Bottema, C. D., Brauning, R., Burgess, S. C., Zhou, H., et al. (2015). Coordinated international action to accelerate genome-to-phenome with FAANG, the Functional Annotation of Animal Genomes project. Genome Biol. 16, 57. doi:10.1186/s13059-015-0622-4
Tuggle, C. K., Giuffra, E., White, S. N., Clarke, L., Zhou, H., Ross, P. J., et al. (2016). GO-FAANG meeting: a gathering on functional annotation of animal genomes. Anim. Genet. 47 (5), 528–533. doi:10.1111/age.12466
van der Lee, R., Correard, S., and Wasserman, W. W. (2020). Deregulated regulators: disease-causing cis variants in transcription factor genes. Trends Genet. 36 (7), P523–P539. doi:10.1016/j.tig.2020.04.006
Wang, Q., Li, M., Wu, T., Zhan, L., Li, L., Chen, M., et al. (2022). Exploring epigenomic datasets by ChIPseeker. Curr. Protoc. 2 (10), e585. doi:10.1002/cpz1.585
Xiang, G., Keller, C. A., Giardine, B., An, L., Li, Q., Zhang, Y., et al. (2020). S3norm: simultaneous normalization of sequencing depth and signal-to-noise ratio in epigenomic data. Nucleic Acids Res. 48 (8), e43. doi:10.1093/nar/gkaa105
Xu, S., Grullon, S., Ge, K., and Peng, W. (2014). Spatial clustering for identification of ChIP-enriched regions (SICER) to map regions of histone methylation patterns in embryonic stem cells. Methods Mol. Biol. 1150, 97–111. doi:10.1007/978-1-4939-0512-6_5
Yu, G., Wang, L., and He, Q. (2015). ChIPseeker: an R/Bioconductor package for ChIP peak annotation, comparison and visualization. Bioinformatics 31 (14), 2382–2383. doi:10.1093/bioinformatics/btv145
Zang, C., Schones, D. E., Zeng, C., Cui, K., Zhao, K., and Peng, W. (2009). A clustering approach for identification of enriched domains from histone modification ChIP-Seq data. Bioinf 25 (15), 1952–1958. doi:10.1093/bioinformatics/btp340
Zhang, Q., Zeng, X., Younkin, S., Kawli, T., Snyder, M. P., and Keleş, S. (2016). Systematic evaluation of the impact of ChIP-seq read designs on genome coverage, peak identification, and allele-specific binding detection. BMC Bioinf. 17 (1), 96. doi:10.1186/s12859-016-0957-1
Zhang, T., Xia, W., Song, X., Mao, Q., Huang, X., Chen, B., et al. (2022). Super-enhancer hijacking LINC01977 promotes malignancy of early-stage lung adenocarcinoma addicted to the canonical TGF-b/SMAD3 pathway. J. Hematol. Oncol. 15, 114. doi:10.1186/s13045-022-01331-2
Keywords: horse, ChIP-seq, FAANG, functional annotation, histone modifications
Citation: Barber AM, Kingsley NB, Peng S, Giulotto E, Bellone RR, Finno CJ, Kalbfleisch T and Petersen JL (2025) Annotation of cis-regulatory-associated histone modifications in the genomes of two Thoroughbred stallions. Front. Genet. 16:1534461. doi: 10.3389/fgene.2025.1534461
Received: 26 November 2024; Accepted: 31 January 2025;
Published: 27 February 2025.
Edited by:
Göran Andersson, Swedish University of Agricultural Sciences, SwedenReviewed by:
Jilong Han, Shihezi University, ChinaOla Wallerman, Uppsala University, Sweden
Maulik Upadhyay, LMU Munich, Germany
Copyright © 2025 Barber, Kingsley, Peng, Giulotto, Bellone, Finno, Kalbfleisch and Petersen. This is an open-access article distributed under the terms of the Creative Commons Attribution License (CC BY). The use, distribution or reproduction in other forums is permitted, provided the original author(s) and the copyright owner(s) are credited and that the original publication in this journal is cited, in accordance with accepted academic practice. No use, distribution or reproduction is permitted which does not comply with these terms.
*Correspondence: Jessica L. Petersen, amVzc2ljYS5wZXRlcnNlbkB1bmwuZWR1
†ORCID: Elena Giulotto, orcid.org/0000-0002-4705-2049; Rebecca R. Bellone, orcid.org/0000-0001-8838-7227; Carrie J. Finno, orcid.org/0000-0001-5924-0234; Ted Kalbfleisch, orcid.org/0000-0002-2370-8189