 Fan Liu
 Fang Wang
 Zaiqi Zhang1†
 Jinran Wu
- 1Hunan Provincial Key Laboratory of Dong Medicine, Hunan University of Medicine, Huaihua, China
- 2Key Laboratory of Intelligent Computing and Information Processing of Ministry of Education and Hunan Key Laboratory for Computation and Simulation in Science and Engineering, Xiangtan University, Xiangtan, China
- 3School of Mathematics and Physics, The University of Queensland, Brisbane, QLD, Australia
Introduction: Due to its favorable traits-such as lower lignin content, higher oil concentration, and increased protein levels-the genetic improvement of yellow-seeded rapeseed has attracted more attention than other rapeseed color variations. Traditionally, yellow-seeded rapeseed has been identified visually, but the complex variability in the seed coat color of Brassica napus has made manual identification challenging and often inaccurate. Another method, using the RGB color system, is frequently employed but is sensitive to photographic conditions, including lighting and camera settings.
Methods: We present four data-driven models to identify yellow-seeded B. napus using hyperspectral features combined with simple yet intelligent techniques. One model employs partial least squares regression (PLSR) to predict the R, G, and B color channels, effectively distinguishing yellow-seeded varieties from others according to globally accepted yellow-seed classification protocols. Another model uses logistic regression (Logit-R) to produce a probability-based assessment of yellow-seeded status. Additionally, we implement two intelligent models, random forest and support vector classifier to evaluate features selected through lasso-penalized logistic regression.
Results and Discussion: Our findings indicate significant recognition accuracies of 96.55% and 98% for the PLSR and Logit-R models, respectively, aligning closely with the accuracy of previous methods. This approach represents a meaningful advancement in identifying yellow-seeded rapeseed, with high recognition accuracy demonstrating the practical applicability of these models.
1 Introduction
The quality of life and wellbeing of individuals are deeply influenced by the quality of rapeseed. The global adoption of cultivating “double high and double low” rapeseed-characterized by high oleic acid and oil content, along with low erucic acid and sulfur glycosides-underscores its vital significance.
During development, rapeseed contains chlorophyll, giving it a green hue. As the seeds mature, they exhibit colors ranging from black and reddish-brown to yellow. The seed coats of black and reddish-brown seeds accumulate pigments, while the transparent seed coats of yellow-seeded varieties reveal the embryo’s color. Studies indicate that yellow-seeded rapeseed has a shorter dormancy period, simpler germination, and higher oil content than black-seeded varieties, highlighting the breeding of yellow-seeded rapeseed as a valuable method to enhance oil content (Yang et al., 2021). Identifying yellow-seeded varieties of Brassica juncea and Brassica campestris is relatively straightforward, as the pure yellow phenotype is genetically stable (Li et al., 2012; Chen et al., 2015). However, stable, pure-yellow progeny have yet to be achieved in Brassica napus due to the complexity of seed coat color variations, including hetero-yellow patterns, such as yellow with black spots, patches, or brown rings. Additionally, the seed coat color of segregated progeny shows continuous variation (Liu, 1992; Auger et al., 2010; Qu et al., 2013). Consequently, accurately and efficiently determining the seed coat color of B. napus remains a critical and challenging task. Numerous studies address the identification of rapeseed color (Li et al., 2001; Somers et al., 2001; Zhang et al., 2006; Baetzel et al., 2003; Tańska et al., 2005; Li et al., 2012; Liu et al., 2005; Ye et al., 2018). For example, Li et al. (2001) estimated the yellow-seeded degree of B. napus through visual observation, a straightforward method but heavily reliant on the observer, leading to potentially inaccurate recognition. Somers et al. (2001) utilized light reflection to assess yellow-seeded color grade by measuring reflectance values and calculating the grain color index or light reflection values. While this method is more objective, it captures only single-dimensional color data, such as brightness, omitting rich information in the original material. To address this limitation, many scholars have focused on digital image analysis through the RGB color system (Zhang et al., 2006; Baetzel et al., 2003; Tańska et al., 2005; Li et al., 2012; Liu et al., 2005; Ye et al., 2018). However, the complex and similar coloration of the rapeseed epidermis makes precise color identification challenging, and the available techniques lack reliability and standardization. Accurate and efficient color measurement of yellow-seeded B. napus thus remains essential.
Recent advancements in chemometrics and computer technology have led to the development of near-infrared spectroscopy (NIRS), a technique combining both image and spectral data of the object. NIRS, known for its speed, non-destructive nature, and high efficiency, is widely used for the rapid, non-destructive analysis of agricultural products. Several studies have demonstrated its utility (Guo et al., 2019; Bu et al., 2023; Liang et al., 2023; Liu et al., 2021; Petisco et al., 2010; Sen et al., 2018; Liu et al., 2022; Zhang et al., 2020; Wei et al., 2020; Zhang et al., 2018; Jiang et al., 2017; Li et al., 2022; Jiang et al., 2018; He et al., 2022). For instance, Guo et al. (2019) used an NIRS imaging system (380–1,000 nm) to accurately quantify adulterated rice, while Bu et al. (2023) combined hyperspectral imaging with convolutional neural networks to create an intelligent model for sorghum variety recognition, surpassing existing models in accuracy. This technology has also been applied in rapeseed growth diagnostics. For example, Liu et al. (2021) developed a hyperspectral technique-based detection algorithm to predict the oleic acid content in B. napus. Petisco et al. (2010) examined visible and near-infrared spectra of B. napus and B. juncea with different oil levels, and Liu et al. (2022) developed an intelligent model that identified eleven B. napus varieties by integrating hyperspectral and spectral data, achieving a recognition accuracy of 93.71%. In another study, Wei et al. (2020) achieved 99.2% accuracy in classifying 15 soybean varieties through hyperspectral imaging, while Li et al. (2022) improved oleic acid content inversion in B. napus seeds by reducing hyperspectral redundancy.
As noted, identifying yellow-seeded B. napus is challenging due to the small seed size and complex seed coat color. Inconsistent RGB standards and labor-intensive calibration further complicate the task. The successful integration of hyperspectral technology in agriculture has paved the way for advancements in digital farming, inspiring us to apply it for yellow-seed identification. Furthermore, combining hyperspectral features with machine learning enhances remote sensing applications in smart agriculture, with hyperspectral analysis proving effective for modeling rapeseed aliphatic acid content. Hyperspectral sensing, a form of near-Earth remote sensing, provides a foundation for satellite- or drone-based agricultural monitoring. This technology facilitates tasks such as classification and inversion of land object parameters, which are challenging for traditional vision-based systems. Thus, our early-stage near-Earth remote sensing experiments are pivotal for advancing agricultural monitoring techniques.
In this study, we propose a novel approach to identifying yellow-seeded B. napus using hyperspectral imaging technology. We combine trilateral parameters derived from hyperspectral rapeseed imaging with spectral indices, applying partial least squares regression, logistic regression, random forest, and support vector classifiers. Importantly, the simplicity of spectral data collection addresses RGB calibration limitations. These intelligent models exhibit a commendable level of recognition accuracy. This study represents an initial exploration into rapeseed color classification through hyperspectral technology and machine learning, underscoring the significant potential of hyperspectral technology in tasks traditionally reliant on human vision systems.
2 Methods and materials
2.1 Materials
For this study, we used two high oleic acid rapeseed varieties, namely, Xiangyou 708 and Xiangyou 710 (B. napus. L). These varieties were cultivated in the paddy fields of Yunyuan Experimental Base (28°23′N, 112°93′E, as illustrated in Figures 1A, B) located in Changsha City, Hunan Province, China. The region is situated in a subtropical monsoon climate, characterized by warm winters, hot summers, abundant rainfall primarily concentrated in the summer months, and distinct four seasons with relatively balanced seasonal distribution. In Changsha, the seasonal pattern features longer summers and winters, while spring and autumn are relatively shorter. And the average annual temperature is 17.2°C, the accumulated annual temperature is approximately 5,457°C, and the average yearly precipitation is 1361.6 mm. The crop rotation scheme involved black loam soil with rice as the preceding crop. Planting occurred in September 2020, with harvesting in April 2021.
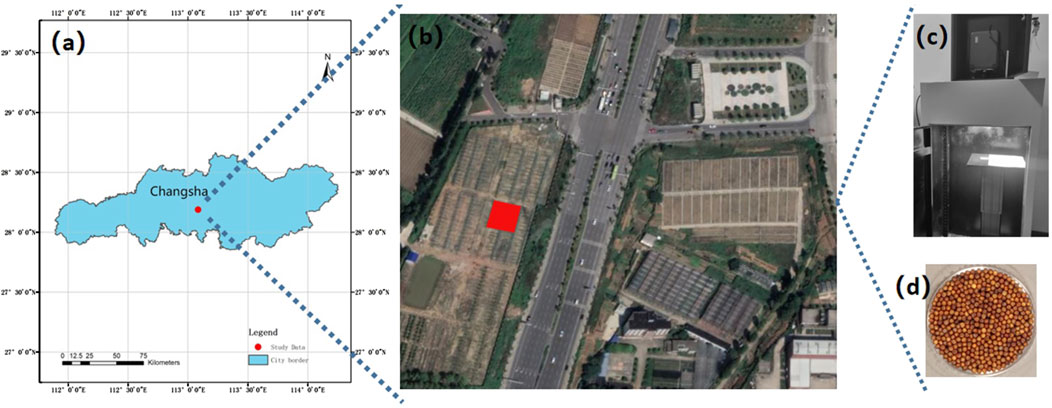
Figure 1. Location of the study area and hyperspectral collection environment. (A) Study area location in Changsha City, China; (B) Satellite map of Yunyuan Experimental Base (highlighted in red); (C) Hyperspectral data acquisition setup; (D) Region of Interest (ROI) for rapeseed sample.
Remark 1: This study represents a preliminary exploration into color classification of rapeseed seeds through integrating hyperspectral technology and machine learning methods. Recognizing the attributes of yellow-seeded varieties-such as high oil content, elevated polyphenol levels, enhanced nutritional value, and precise harvest time determination-we aim to employ the proposed model for identifying yellow-seeded rapeseed. Accordingly, we focus on the established varieties Xiangyou 708 and Xiangyou 710, which have been widely cultivated and promoted in Hunan Province, China.
2.2 Data collection
We utilized the SOC710 portable hyperspectral imager (wavelength range: 380–1,091 nm; resolution: 4.9458 nm) along with its darkroom system, manufactured by Surface Optics Corporation, United States, to collect spectral data. The optical obscura, as shown in Figure 1C, was maintained in dark conditions. Measuring
2.3 Methods and indicators
Feature selection and modeling method are the key components of our seed identification model. First, the spectral index is commonly used as a reliable indicator in crop remote sensing for seed quality assessment. It enhances crop spectral information while effectively reducing noise and environmental interference by combining two or more spectral reflectances. Spectral indices provide rich data on rapeseed (Zhang et al., 2017; Hong et al., 2019; Bai et al., 2022). In this study, we employ three indices-ratio spectral index (RSI), difference spectral index (DSI), and normalized spectral index (NDSI), calculated for wavelengths 400–1,000 nm:
and
We also consider trilateral parameters-covering blue (490–530 nm), yellow (560–640 nm), and red (680–760 nm) edges-as additional hyperspectral features containing vital rapeseed information. Our study includes 23 representative parameters (see Table 1) encompassing characteristics such as location, amplitude, area, normalization, ratios, and numerical attributes (Peng et al., 2020; Sibanda et al., 2019).
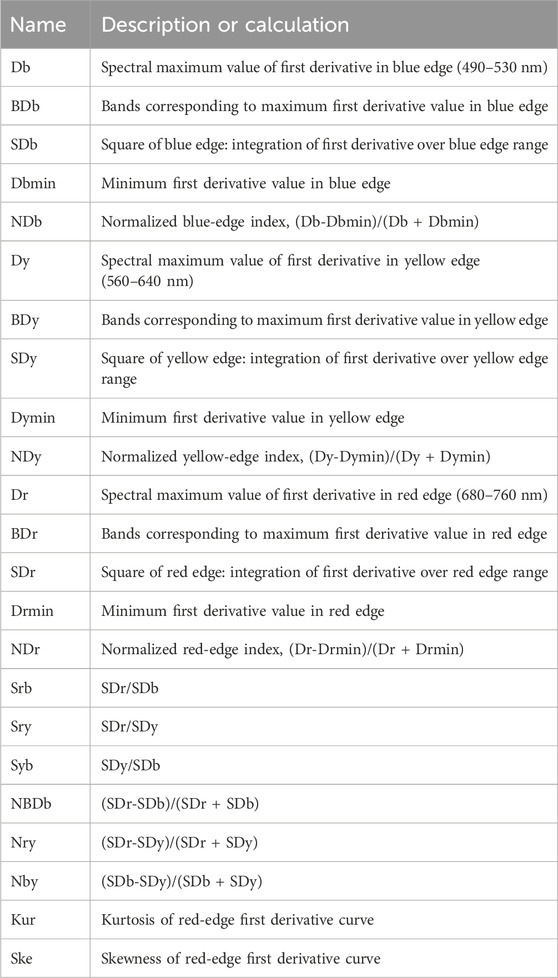
Table 1. Hyperspectral trilateral characteristic parameter calculation formulas.
These spectral indicators provide crucial information for characterizing seed color and are thus used in feature combinations for modeling.
To enable effective yellow-seeded rapeseed identification, we employ two well-established mathematical models. First, partial least squares regression (PLSR) (Meacham-Hensold et al., 2019) combines advantages of multiple linear regression, principal component analysis, and conventional correlation analysis and is commonly applied in spectral research. PLSR creates a linear regression model by projecting independent and response variables into a new space. Here, we use PLSR to predict the values of the three color channels [red (R), green (G), and blue (B)] for differentiating yellow-seeded from non-yellow-seeded rapeseeds.
Additionally, since generalized linear regression is suited for dichotomous classification, we apply logistic regression (Logit-R) to distinguish yellow from non-yellow-seeded rapeseed. The Logit-R model, a widely used machine learning technique, derives prediction parameters from training data and uses these to calculate a data segmentation hyperplane for classification (Broeckx et al., 2018; Lin et al., 2014; Munshi et al., 2014).
3 Results and discussion
3.1 Model preparation
3.1.1 Labeling of yellow-seeded rapeseed samples
To classify the yellow and non-yellow rapeseed samples, we first labeled the 300 seed samples as yellow or non-yellow. This classification was based on internationally recognized guidelines using R, G, and B color channel thresholds (Zhang et al., 2006; Baetzel et al., 2003; Tańska et al., 2005), defined as follows:
and
Here,
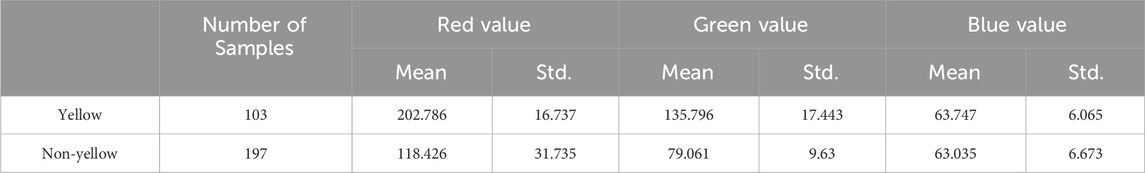
Table 2. Statistical characteristics of R/G/B values.
3.1.2 Spectral index feature extraction
The spectral indices in Equations 1–3 capture various aspects of hyperspectral information. Selecting optimal band combinations is critical to obtaining the three spectral indices that best represent the red, green, and blue color information. A correlation analysis was conducted between the spectral indices and RGB values, with half of the samples used to distinguish between training and test sets, with 100 independent repetitions to minimize random noise effects. The highest average correlation coefficients for each spectral index, along with corresponding band combinations, are shown in Table 3. Figure 2 illustrates one of the implementations.
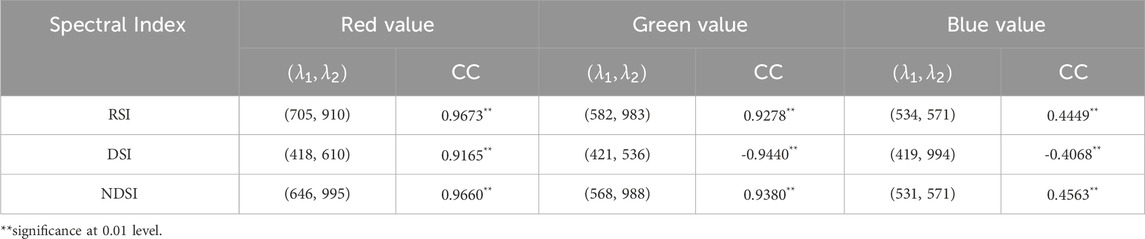
Table 3. Most correlated bands for spectral index.

Figure 2. Correlation analysis between spectral indices and RGB values. Each heatmap highlights the highest correlation coefficient with an arrow. The top panels (label 1), middle panels (label 2) and bottom panels (label 3) denote R-value; 2 G-value; 3 B-value, respectively. (A) RSI; (B) DSI; (C) NDSI.
3.1.3 Trilateral parameter feature extraction
We also performed a correlation analysis between trilateral parameters and RGB color channels. A random selection of 150 samples with 100 repetitions was used. Figure 3 displays the absolute average correlation coefficients of the 23 trilateral parameters with red, green, and blue channels. For the red channel, the top three parameters are Nrb, Srb, and SDb, which are identical to those for the green channel. For the blue channel, the top three are Sry, Nry, and Dr, with lower correlation coefficients than the red and green channels but significant at the 0.01 level.

Figure 3. Absolute correlation coefficients between trilateral parameters and color channels. (A) Red channel, (B) Green channel, (C) Blue channel. Error bars represent standard deviations from 100 repetitions. * and ** denote significance at the 0.05 and 0.01 levels, respectively.
Based on the above correlation analysis, we identified optimal feature parameters for each channel. We subsequently combined the three spectral indices with the top three trilateral parameters to create feature sets for predicting the RGB values of test samples.
3.2 Modeling of rapeseed yellow-seeded identification
In this subsection, we establish four yellow-seed identification models by using PLSR, Logistic regression (Logit-R), and two machine learning methods, i.e., support vector classifier (SVC) and random forest. In each model, the 300 samples are randomly divided into two groups, namely,
3.2.1 Predication modeling based on PLSR
According to the corn idea of PLSR, the arguments can be input into the model directly regardless of whether multi-collinearity or not. Therefore, we use the six parameters (the three spectral indexes and the top three trilateral parameters) of training samples and the corresponding R/G/B values to train the PLSR model first (constructing regression model to estimate the values of red, green, and blue, denoted by
Remark 2. Here, we approached false positives and false negatives with equal consideration. It is indeed accurate to acknowledge that lower error rates can also bring significant losses due to distinct economic implications associated with false negatives and false positives. Moving forward, we plan to enhance our color identification model by incorporating the economic impact of oil content.
Next, the same arguments of the 150 test samples are input into Equation 8 to inverse the R, G, and B values respectively. The predicted values and the labeled results are shown in Figure 4. The blue values locate a relatively narrow range compared to the red and green values, but they are all around the theoretical line of
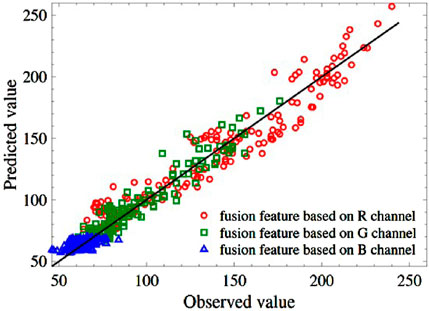
Figure 4. Comparison of predicted value and observed value of R, G, and B. The black solid line denotes the theoretical
Then, using the predicted values of R/G/B, the test samples can be classified into yellow-seeded and non-yellow-seeded according to Equations 4–7. Table 4 shows the confusion matrix for two different numbers of training samples,
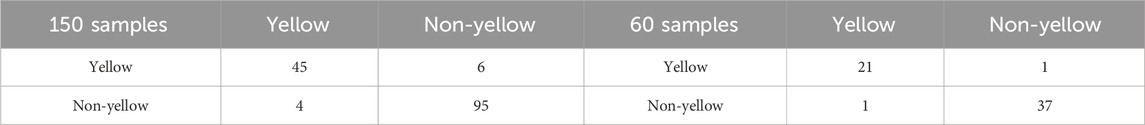
Table 4. The identification results on the test set based on PLSR.
Varying
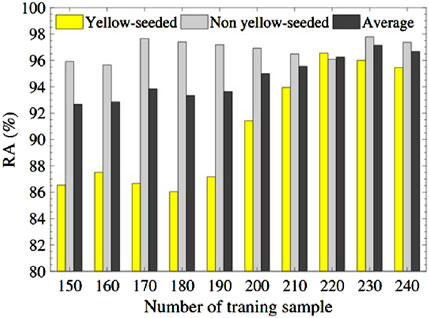
Figure 5. Recognition accuracy based on the PLSR model.
3.2.2 Recognition modeling based on Logit-R
Similar to the PLSR model, we first use the fusion feature and the corresponding labeled seed attribute of training samples to train the Logit-R model. Then, the fusion feature of the test samples is input into the trained model to predict the discriminant probability and further calculate the classification accuracy. What’s different from the PLSR model is the label of seed attribute is a Boolean variable of
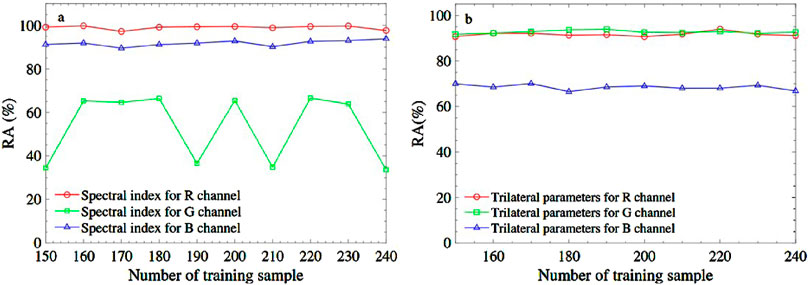
Figure 6. The recognition accuracy brought from R, G, and B channels based on different fusion features. (A) is spectral index combination and (B) is trilateral parameters combination.
Following, let’s show how the Logit-R model using three-spectral indexes combination
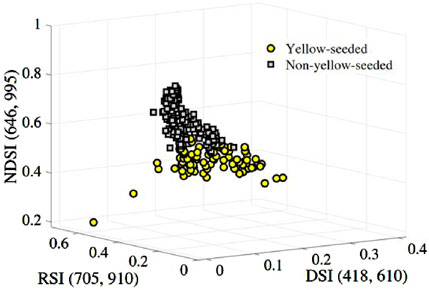
Figure 7. Two-classification of the yellow and non-yellow-seeded samples based on the feature combination
Now, we hope to find a segmentation hyperplane to separate the above two types of samples. To do so, firstly, we input the remaining 150 samples including the spectral index combination and the corresponding labeled Y = 0/1 to train the Logit-R model. The trained discriminant function is
Then, inputting the three-spectral indexes combination of the 150 remaining samples into the trained model. Figure 7 depicts the sample distribution of four categories: yellow-seeded (yellow dots), non-yellow-seeded (grey squares), misclassified yellow-seeded samples (red dots), and misclassified non-yellow-seeded (red squares). As seen in Figure 8, there are only one yellow sample is misclassified and 9 non-yellow samples are misclassified. The RA of yellow-seeded and non-yellow-seeded is 97.78% and 91.43%, respectively, and the average RA is 93.33%.
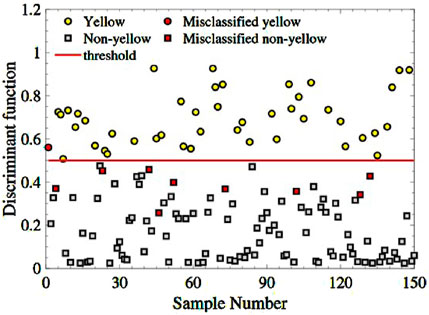
Figure 8. The classification of the yellow and non-yellow-seeded samples based on the feature combination
3.2.3 Predication results with machine learning methods
In this section, we employ two machine learning techniques: random forest Breiman (2001) and support vector classifier (SVC) Pisner and Schnyer (2020) to perform a classification task aimed at identifying the yellow seed. Differing from the preceding feature selection methods, we enhance our feature pool by integrating the original hyperspectral reflectances, consisting of nine spectral indexes calculated according to Table 3, and 23 trilateral parameters. This augmentation results in a total of 633 features.
To extract pivotal attributes and eliminate redundant data, we employ lasso-penalized logistic regression with the R package ‘glmnet’ (Friedman et al., 2010). The parameter
According to these selected ten features, we conduct random forest and support vector classifier algorithms via R packages ‘rpart’ (Therneau et al., 2015) and ‘e1071’ (Meyer et al., 2024), respectively, by default settings with different training sizes (M: 150–240). The prediction results in test sets for the recognition task are reported in Table 5.
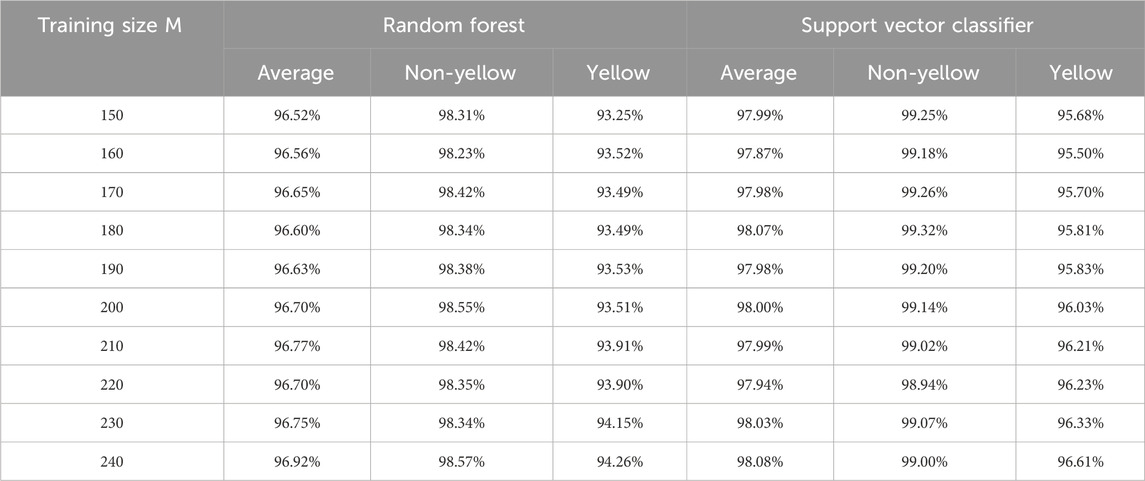
Table 5. Results of recognition accuracies with machine learning methods.
In comparing the recognition accuracies achieved by random forest and SVC methods, several key observations emerge. Regarding average accuracy, random forest demonstrates results ranging from approximately 96.52%–96.92%, while SVC exhibits a slightly higher range of around 97.87%–98.08%. Both methods exhibit an increase in accuracy with larger training sizes, with random forest’s accuracy gradually ascending and SVC’s accuracy following a similar trend, albeit with minor fluctuations.
In terms of category-specific accuracies, random forest achieves accuracy rates between approximately 93.25% and 94.26% in the yellow category, whereas SVC yields higher accuracy within the range of 95.68%–96.61%. For the non-yellow category, random forest consistently attains commendable accuracy, hovering between roughly 98.23% and 98.57%, whereas SVC shows even greater accuracy, ranging from approximately 98.94%–99.32%, generally surpassing random forest.
The consistency of performance across training sizes and categories is notable in the random forest’s case, where stability is observed. On the other hand, SVC displays slight performance variations, particularly noticeable within the yellow category. In the broader context of comparison, SVC emerges as the more favorable option, showcasing superior performance across most categories and training sizes. While random forest performs admirably in the non-yellow category, it falls short of SVC’s accuracy levels in the yellow category. This analysis underscores the nuanced strengths of each method and the importance of considering the specific problem context when selecting an appropriate machine learning approach.
3.3 Discussion of the proposed recognition methods
Up to this point, the task of recognizing yellow-seeded varieties has been effectively accomplished through the application of hyperspectral technology. Now, we would like to delve into the details of the four proposed models.
Beginning with the PLSR-based model, our approach involves identifying yellow-seeded varieties by predicting the RGB values through three essential trilateral parameters obtained from hyperspectral imaging of rapeseed, along with three significant spectral indices. During the process of predicting each R/G/B channel, we extract several noteworthy spectral features that contribute to enhancing the model’s interpretability. It’s important to note that the success of this method relies heavily on the accuracy of RGB calibration. Moving on to the Logit-R model, our strategy revolves around determining yellow-seeded or non-yellow-seeded categorization based on generating probabilities. However, one potential challenge of this model lies in dealing with imbalanced sample data. To address this, when data imbalance is encountered, it’s essential to consider adjusting classification thresholds to ensure accurate results. The optimal hyperspectral feature chosen for both the aforementioned models is determined through a thorough correlation analysis between the R/G/B values and the 23 trilateral parameters and spectral indices derived from a complete band combination. It’s worth mentioning that this approach might potentially omit some information from the original spectral reflectance data. Diverging from the two aforementioned methods, the machine learning models operate differently. In this case, we initially conduct feature dimensionality reduction from a total of 633 features, encompassing all 23 trilateral parameters, 9 spectral indices, and reflectance data from 601 original bands. Subsequently, we select ten key features to input into the random forest and SVC models.
All four models demonstrate high average accuracy rates, showcasing relatively similar performance differences ranging from 93% to 98%. This consistency highlights the feasibility of the framework that combines spectral features with intelligent models for accurately identifying yellow-seeded B. napus varieties. Considering factors like ease of operation and comprehensive utilization of information, the SVC model is recommended as an optimal choice for the task of identifying yellow-seeded varieties.
4 Discussions and conclusion
Remote sensing technology, recognized as an essential national strategy, finds extensive application across both military and civilian domains. It facilitates the efficient acquisition of spectral data, enabling tasks like land classification and parameter inversion that are challenging for vision-based systems. Hyperspectral imaging technology, a near-Earth remote sensing tool, forms the basis for this advancement. As an innovative method of photoelectric detection and recognition, it integrates spectroscopy with optical imaging, offering a non-destructive and highly efficient alternative to traditional empirical and lab-based approaches for discerning the color of rapeseed seeds. Leveraging the rich spectral and image data inherent to rapeseed samples, this technology holds great promise for agricultural applications.
Comparing yellow seeds with black and brown seeds in Brassica napus reveals that yellow seeds have a thinner seed coat, higher oil content, and better quality. They also have higher protein content in the cake, lower cellulose and polyphenol levels, and higher economic value. Breeding yellow-seed varieties has become a key goal in rapeseed breeding worldwide. However, the complex seed color and inconsistent standards in current identification methods pose challenges. Most researchers use the naked eye or RGB color systems for seed color identification. However, the inconsistent phenotypic color and environmental influences make RGB methods unstable. In contrast, hyperspectral technology, which detects internal seed quality, is less affected by surface color, providing more stable results.
In this study, we introduce four intelligent models carefully designed to distinguish yellow-seeded rapeseed, as depicted in the model flowchart in Figure 9. The first two models, PLSR and Logit-R, synergize spectral indices with hyperspectral trilateral parameters. This process begins with extracting three spectral indices and 23 trilateral parameters. Through correlation analyses across the R, G, and B color channels of rapeseed seeds, we determine the optimal combinations of these spectral indices and trilateral parameters.
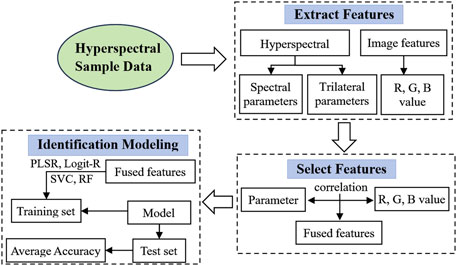
Figure 9. Flowchart of identification modeling.
The PLSR model leverages six features derived from three spectral indices and three trilateral parameters, achieving an impressive recognition accuracy (RA) between 92.32% and 96.55% in differentiating yellow from non-yellow seeds. The Logit-R model, which prioritizes the three spectral indices combined with the R channel, achieves a remarkable RA of 98%.
Additionally, we employ two machine learning models-random forest and SVC-to tackle the identification task. Beyond the 23 trilateral parameters and nine optimal spectral indices, we include the original 601 spectral reflectance values in the feature set. Using lasso-penalized logistic regression, we identify ten key features, which serve as input for the random forest and SVC models, achieving an average RA of approximately 98%, with SVC slightly outperforming random forest.
We emphasize that the proposed identification framework for yellow-seeded rapeseed, which integrates classical statistical methods and advanced machine learning tools, demonstrates robust generalizability. This framework is not limited to rapeseed classification but holds significant potential for application to seed classification and identification tasks across a wide range of other crops. By combining hyperspectral feature extraction with predictive modeling techniques, it provides a versatile approach that can adapt to various seed types, accommodating their unique physical and spectral characteristics. This generalizability makes it a valuable tool for advancing precision agriculture and improving the efficiency of crop breeding programs. Additionally, the framework’s ability to extract internal quality information and analyze large-scale data through machine learning models makes it adaptable for various agricultural tasks, including crop variety identification, stress detection, and quality assessment across different agricultural production systems. By customizing the spectral features and models for specific crops, this framework can be effectively extended to other agricultural systems, enhancing precision farming and crop management in diverse contexts.
This study identifies several limitations and proposes future research directions. It suggests integrating machine vision with machine learning for rapeseed color recognition as a cost-effective alternative to hyperspectral feature fusion, which remains expensive. Machine vision, efficient for non-destructive small-target color recognition, contrasts with hyperspectral remote sensing, which excels in large-area identification. A promising approach involves combining hyperspectral remote sensing with intelligent models, establishing a key paradigm for agricultural monitoring. Future work will focus on integrating machine vision and hyperspectral remote sensing to enhance rapeseed color recognition across broader areas.
Second, this study is limited by the small sample size and narrow color range, based on two B. napus varieties from a single field trial in Changsha (2020–2021). As an initial exploration of hyperspectral technology and machine learning for yellow-seeded rapeseed identification, it provides valuable insights but requires expansion. Future research will include more rapeseed varieties and account for environmental factors like temperature, humidity, light, and altitude by incorporating multi-year, multi-location data for a comprehensive analysis of seed color variability.
Data availability statement
The raw data supporting the conclusions of this article will be made available by the authors, without undue reservation.
Author contributions
FL: Conceptualization, Formal Analysis, Methodology, Writing–original draft. FW: Funding acquisition, Methodology, Supervision, Writing–review and editing. ZZ: Validation, Writing–review and editing. LC: Software, Visualization, Writing–review and editing. JW: Formal Analysis, Software, Supervision, Writing–review and editing. Y-GW: Formal Analysis, Software, Writing–review and editing.
Funding
The author(s) declare that financial support was received for the research, authorship, and/or publication of this article. This research was supported partially by the National Natural Science Foundation of China (Grant No. 12471489), the Key Research Project of the Department of Education of Hunan Province (CN) (Grant No. 22A0135), the Excellent Young Research Project of the Department of Education of Hunan Province (CN) (Grant No. 24B1085), the “Chunhui” Program Collaborative Scientific Research Project (202202004), and the Australian Research Council project (DP160104292).
Acknowledgments
We would like to thank the Oil Institute of Hunan Agricultural University for providing two experimental rapeseed varieties of Xiangyou 708 and Xiangyou 710. The author wishes to thank the reviewers and the handling editor for their constructive comments and suggestions, which led to a great improvement in the presentation of this work.
Conflict of interest
The authors declare that the research was conducted in the absence of any commercial or financial relationships that could be construed as a potential conflict of interest.
Generative AI statement
The author(s) declare that no Generative AI was used in the creation of this manuscript.
Publisher’s note
All claims expressed in this article are solely those of the authors and do not necessarily represent those of their affiliated organizations, or those of the publisher, the editors and the reviewers. Any product that may be evaluated in this article, or claim that may be made by its manufacturer, is not guaranteed or endorsed by the publisher.
References
Auger, B., Marnet, N., Gautier, V., Maia-Grondard, A., Leprince, F., Renard, M., et al. (2010). A detailed survey of seed coat flavonoids in developing seeds of brassica napus l. J. Agric. Food Chem. 58, 6246–6256. doi:10.1021/jf903619v
Baetzel, R., Lühs, W., Badani, A.-G., and Friedt, W. (2003). Development of segregating populations in the breeding of yellow-seeded winter rapeseed (brassica napus l.). Proc. 11th Int. Rapeseed Congr. 1, 238–242.
Bai, Z., Tian, J., Hu, X., Sun, T., Luo, H., and Huang, D. (2022). A back-propagation neural network model using hyperspectral imaging applied to variety nondestructive detection of cereal. J. Food Process Eng. 45, e13973. doi:10.1111/jfpe.13973
Broeckx, J., Vanmaercke, M., Duchateau, R., and Poesen, J. (2018). A data-based landslide susceptibility map of africa. Earth-Science Rev. 185, 102–121. doi:10.1016/j.earscirev.2018.05.002
Bu, Y., Jiang, X., Tian, J., Hu, X., Han, L., Huang, D., et al. (2023). Rapid nondestructive detecting of sorghum varieties based on hyperspectral imaging and convolutional neural network. J. Sci. Food Agric. 103, 3970–3983. doi:10.1002/jsfa.12344
Chen, C., Xiao, L., Zhao, Z., and Du, D. (2015). Research progress in seed coat color of yellow-seeded rapeseed. J. Henan Agric. Sci. 44, 1–6. doi:10.15933/j.cnki.1004-3268.2015.09.001
Friedman, J., Hastie, T., and Tibshirani, R. (2010). Regularization paths for generalized linear models via coordinate descent. J. Stat. Softw. 33 (1), 1–22. doi:10.18637/jss.v033.i01
Guo, L., Yu, Y., Yu, H., Tang, Y., Li, J., Du, Y., et al. (2019). Rapid quantitative analysis of adulterated rice with partial least squares regression using hyperspectral imaging system. J. Sci. Food Agric. 99, 5558–5564. doi:10.1002/jsfa.9824
He, S.-F., Zhou, Q., and Wang, F. (2022). Local wavelet packet decomposition of soil hyperspectral for som estimation. Infrared Phys. & Technol. 125, 104285. doi:10.1016/j.infrared.2022.104285
Hong, Y., Liu, Y., Chen, Y., Liu, Y., Yu, L., Liu, Y., et al. (2019). Application of fractional-order derivative in the quantitative estimation of soil organic matter content through visible and near-infrared spectroscopy. Geoderma 337, 758–769. doi:10.1016/j.geoderma.2018.10.025
Jiang, S., Wang, F., Shen, L., and Liao, G. (2018). Local detrended fluctuation analysis for spectral red-edge parameters extraction. Nonlinear Dyn. 93, 995–1008. doi:10.1007/s11071-018-4241-y
Jiang, S., Wang, F., Shen, L., Liao, G., and Wang, L. (2017). Extracting sensitive spectrum bands of rapeseed using multiscale multifractal detrended fluctuation analysis. J. Appl. Phys. 121. doi:10.1063/1.4978308
Liu, H. (1992). Studies on the inheritance of yellow-seeded brassica napus l. Acta Agron. Sin. (China). doi:10.3321/j.issn:0496-3490.1992.04.001
Li, J., Chen, L., Tang, Z., Zhang, X., and Yan, S. (2001). “Genetic study and commercial application of the yellow-seeded rapeseed (brassica napus l.),” in Proceedings of the international symposium on rapeseed science (New York: Science Press), 19–23.
Li, J., Li, Q., Wang, F., and Liu, F. (2022). Hyperspectral redundancy detection and modeling with local hurst exponent. Phys. A Stat. Mech. its Appl. 592, 126830. doi:10.1016/j.physa.2021.126830
Li, X., Chen, L., Hong, M., Zhang, Y., Zu, F., Wen, J., et al. (2012). A large insertion in bhlh transcription factor brtt8 resulting in yellow seed coat in brassica rapa. PLoS One 7, e44145. doi:10.1371/journal.pone.0044145
Li, Y., Liu, X. L., Li, J., Yin, J., and Xu, X. (2012). Construction of near-infrared reflectance spectroscopy model for seed color of rapeseed. Chin. J. Oil Crop Sci. 34.
Liang, J., Wang, Y., Shi, Y., Huang, X., Li, Z., Zhang, X., et al. (2023). Non-destructive discrimination of homochromatic foreign materials in cut tobacco based on vis-nir hyperspectral imaging. J. Sci. Food Agric. 103, 4545–4552. doi:10.1002/jsfa.12528
Lin, Y., Deng, X., Li, X., and Ma, E. (2014). Comparison of multinomial logistic regression and logistic regression: which is more efficient in allocating land use? Front. Earth Sci. 8, 512–523. doi:10.1007/s11707-014-0426-y
Liu, F., Wang, F., Liao, G., Lu, X., and Yang, J. (2021). Prediction of oleic acid content of rapeseed using hyperspectral technique. Appl. Sci. 11, 5726. doi:10.3390/app11125726
Liu, F., Wang, F., Wang, X., Liao, G., Zhang, Z., Yang, Y., et al. (2022). Rapeseed variety recognition based on hyperspectral feature fusion. Agronomy 12, 2350. doi:10.3390/agronomy12102350
Liu, X., Tu, J., Chen, B., and Fu, T. (2005). Identification and inheritance of a partially dominant gene for yellow seed colour in brassica napus. Plant Breed. 124, 9–12. doi:10.1111/j.1439-0523.2004.01051.x
Meacham-Hensold, K., Montes, C. M., Wu, J., Guan, K., Fu, P., Ainsworth, E. A., et al. (2019). High-throughput field phenotyping using hyperspectral reflectance and partial least squares regression (plsr) reveals genetic modifications to photosynthetic capacity. Remote Sens. Environ. 231, 111176. doi:10.1016/j.rse.2019.04.029
Meyer, D., Dimitriadou, E., Hornik, K., Weingessel, A., Leisch, F., and Chang, C.-C. (2024). Misc functions of the department of statistics (e1071), tu wien. R. Package 1, 7–16. doi:10.32614/CRAN.package.e1071
Munshi, T., Zuidgeest, M., Brussel, M., and van Maarseveen, M. (2014). Logistic regression and cellular automata-based modelling of retail, commercial and residential development in the city of ahmedabad, India. Cities 39, 68–86. doi:10.1016/j.cities.2014.02.007
Peng, Z., Lin, S., Zhang, B., Wei, Z., Liu, L., Han, N., et al. (2020). Winter wheat canopy water content monitoring based on spectral transforms and “three-edge”’ parameters. Agric. Water Manag. 240, 106306. doi:10.1016/j.agwat.2020.106306
Petisco, C., García-Criado, B., Vázquez-de Aldana, B. R., De Haro, A., and García-Ciudad, A. (2010). Measurement of quality parameters in intact seeds of brassica species using visible and near-infrared spectroscopy. Industrial Crops Prod. 32, 139–146. doi:10.1016/j.indcrop.2010.04.003
Pisner, D. A., and Schnyer, D. M. (2020). “Support vector machine,” in Machine learning (Elsevier), 101–121.
Qu, C., Fu, F., Lu, K., Zhang, K., Wang, R., Xu, X., et al. (2013). Differential accumulation of phenolic compounds and expression of related genes in black-and yellow-seeded brassica napus. J. Exp. Bot. 64, 2885–2898. doi:10.1093/jxb/ert148
Sen, R., Sharma, S., Kaur, G., and Banga, S. S. (2018). Near-infrared reflectance spectroscopy calibrations for assessment of oil, phenols, glucosinolates and fatty acid content in the intact seeds of oilseed brassica species. J. Sci. Food Agric. 98, 4050–4057. doi:10.1002/jsfa.8919
Sibanda, M., Mutanga, O., Dube, T., Odindi, J., and Mafongoya, P. L. (2019). The utility of the upcoming HyspIRI’s simulated spectral settings in detecting maize gray leafy spot in relation to sentinel-2 MSI, VENµS, and landsat 8 OLI sensors. Agronomy 9, 846. doi:10.3390/agronomy9120846
Somers, D. J., Rakow, G., Prabhu, V. K., and Friesen, K. R. (2001). Identification of a major gene and rapd markers for yellow seed coat colour in brassica napus. Genome 44, 1077–1082. doi:10.1139/g01-097
Tańska, M., Rotkiewicz, D., Kozirok, W., and Konopka, I. (2005). Measurement of the geometrical features and surface color of rapeseeds using digital image analysis. Food Res. Int. 38, 741–750. doi:10.1016/j.foodres.2005.01.008
Therneau, T., Atkinson, B., Ripley, B., and Ripley, M. B. (2015). Package-rpartâ. Available at: https://cran.ma.ic.ac.uk/web/packages/rpart/rpart. pdf(accessed on 20 April 2016)
Wei, Y., Li, X., Pan, X., and Li, L. (2020). Nondestructive classification of soybean seed varieties by hyperspectral imaging and ensemble machine learning algorithms. Sensors 20, 6980. doi:10.3390/s20236980
Yang, F., Ye, S., Ma, X., Chen, Y., Yi, B., Ma, C., et al. (2021). Resynthesis of yellow-seeded brassica napus and comparative metabonomic analysis of differently colored seed coats. Mol. Plant Breed., 1–14. doi:10.13271/j.mpb.022.003979
Ye, Q., Wang, Y., Zhou, S., Cheng, X., and Jia, J. (2018). Color discrimination based on hyperspectral imaging method. Spectrosc. Spectr. Analysis 38, 3310–3314. doi:10.3964/j.issn.1000-0593(2018)10-3310-05
Zhang, J., Huang, Y., Li, Z., Liu, P., and Yuan, L. (2017). Noise-resistant spectral features for retrieving foliar chemical parameters. IEEE J. Sel. Top. Appl. Earth Observations Remote Sens. 10, 5369–5380. doi:10.1109/jstars.2017.2713039
Zhang, L., Sun, H., Rao, Z., and Ji, H. (2020). Hyperspectral imaging technology combined with deep forest model to identify frost-damaged rice seeds. Spectrochimica Acta Part A Mol. Biomol. Spectrosc. 229, 117973. doi:10.1016/j.saa.2019.117973
Zhang, T., Wei, W., Zhao, B., Wang, R., Li, M., Yang, L., et al. (2018). A reliable methodology for determining seed viability by using hyperspectral data from two sides of wheat seeds. Sensors 18, 813. doi:10.3390/s18030813
Keywords: rapeseed (Brassica napus), yellow-seeded, hyperspectral feature, logistic regression, partial least squares regression, machine learning
Citation: Liu F, Wang F, Zhang Z, Cao L, Wu J and Wang Y-G (2025) Classical and machine learning tools for identifying yellow-seeded Brassica napus by fusion of hyperspectral features. Front. Genet. 15:1518205. doi: 10.3389/fgene.2024.1518205
Received: 28 October 2024; Accepted: 26 December 2024;
Published: 15 January 2025.
Edited by:
Zhiqiang Wang, Chengdu Agriculture College, ChinaReviewed by:
Hong Bo, Lushan Botanical Garden (CAS), ChinaMengzhuo Luo, Guilin University of Technology, China
Liang Li, Hunan Institute of Agricultural Information and Engineering, China
Copyright © 2025 Liu, Wang, Zhang, Cao, Wu and Wang. This is an open-access article distributed under the terms of the Creative Commons Attribution License (CC BY). The use, distribution or reproduction in other forums is permitted, provided the original author(s) and the copyright owner(s) are credited and that the original publication in this journal is cited, in accordance with accepted academic practice. No use, distribution or reproduction is permitted which does not comply with these terms.
*Correspondence: Fang Wang, Zndhbmc0QHh0dS5lZHUuY24=
†ORCID: ; Fan Liu, orcid.org/0009-0005-8356-5588; Fang Wang, orcid.org/0000-0002-4756-719X; Zaiqi Zhang, orcid.org/0009-0009-8200-8674; Liang Cao, orcid.org/0009-0005-8300-6428; Jinran Wu, orcid.org/0000-0002-2388-3614; You-Gan Wang, orcid.org/0000-0003-0901-4671