- 1Department of Gastroenterology, Shengli Clinical Medical College of Fujian Medical University, Fujian Provincial Hospital, Fuzhou University Affiliated Provincial Hospital, Fuzhou, Fujian, China
- 2Emergency Internal Medicine, Affiliated Fuzhou First Hospital of Fujian Medical University, Fuzhou, Fujian, China
- 3Department of Endoscopy, Shengli Clinical Medical College of Fujian Medical University, Fujian Provincial Hospital, Fuzhou University Affiliated Provincial Hospital, Fuzhou, Fujian, China
Background: There is limited research on cholesterol metabolism-related genes (CM-RGs) in non-alcoholic fatty liver disease (NAFLD), despite hypercholesterolemia being a recognized risk factor. The role of CM-RGs in NAFLD remains unclear.
Methods: The differentially expressed genes (DEGs) between NAFLD and control were acquired by differential expression analysis. The differentially expressed genes associated with cholesterol metabolism (DE-CM-RGs) were identified and functional enrichment analyses were performed. Protein-protein interaction network analysis and a two-sample Mendelian randomization study were utilized for identifying hub genes. Nomogram model, competing endogenous RNA and messenger RNA-drug networks were established. In addition, immunoinfiltration analysis was performed.
Results: We identified four hub genes (MVK, HMGCS1, TM7SF2, and FDPS) linked to NAFLD risk. MVK and TM7SF2 were protective factors, HMGCS1 and FDPS were risk factors for NAFLD. The area under the curve values of nomograms in GSE135251 and GSE126848 were 0.79 and 0.848, respectively. The gene set enrichment analysis indicated that hub genes participated in calcium signaling pathways and biosynthesis of unsaturated fatty acids. NAFLD patients showed increased CD56dim NK cells and Th17. Tretinoin, alendronate, zoledronic acid, and quercetin are potential target agents in NAFLD.
Conclusion: Our study has linked cholesterol metabolism genes (MVK, HMGCS1, TM7SF2, and FDPS) to NAFLD, providing a promising diagnostic framework, identifying treatment targets, and offering novel perspectives into its mechanisms.
1 Introduction
Non-alcoholic fatty liver disease (NAFLD) is the prevailing type of chronic hepatic disorders globally. The incidence of NAFLD is continuously increasing, leading to higher mortality rates and financial burden. The analysis from 1990 to 2019 found that NAFLD prevalence globally was 30.1% in 2023 (Younossi et al., 2023), higher than the reported rate of 25% in 2016 (Younossi et al., 2016). Prompt identification and understanding of its pathogenesis are crucial to prevent irreversible damage, as there is currently a shortage of approved pharmaceutical interventions for managing NAFLD.
Metabolic syndrome, obesity, insulin resistance, type 2 diabetes mellitus, and dyslipidemia are established risk factors for hepatic steatosis (Rinella et al., 2023). The precise etiology of NAFLD remains elusive. The current “multiple parallel hits” theory mechanism mainly includes dyslipidemia, mitochondrial oxidative damage, endoplasmic reticulum stress, genetic differences, changes in immune response and intestinal microbiota imbalance (Rinella et al., 2023). Lipotoxicity refers to the disruption of lipid homeostasis and/or alteration in intracellular lipid composition, resulting in the accumulation of deleterious lipids that may potentially contribute to cellular dysfunction, injury, or demise of cells and organelles. NAFLD is characterized by the accumulation of triglyceride-containing lipid droplets in hepatocytes, which are currently considered as a defensive response to lipotoxicity (Papazyan et al., 2016). The accumulation of lipotoxic lipids, such as cholesterol, free fatty acids, and ceramides, is believed to cause cellular dysfunction and contribute to NAFLD progression (Marra and Svegliati-Baroni, 2018).
Cholesterol metabolism is crucial for maintaining liver health as it impacts the structural integrity and fluidity of cell membranes, and participates in vital biochemical processes. In NAFLD, there is a pervasive dysregulation of cholesterol homeostasis, leading to augmented cholesterol synthesis and uptake, as well as impaired clearance, resulting in elevated hepatic cholesterol levels. Hepatic accumulation of cholesterol can lead to the development of steatosis, oxidative stress, and inflammatory responses (Ioannou, 2016), thereby promoting the advancement of NAFLD. Long-term consumption of a high-cholesterol diet in mice has been linked to hepatocellular carcinoma (HCC) development, possibly due to gut microbiota dysbiosis and reactive oxygen species accumulation caused by a high-fat diet (Zhang et al., 2021).
The application of bioinformatics approaches has facilitated the discovery of biomarkers and possible targets for various diseases. In this study, we leveraged NAFLD-related public datasets from the Gene Expression Omnibus (GEO) database to identify differentially expressed genes (DEGs) through differential expression analysis. The differentially expressed genes related to cholesterol metabolism (DE-CM-RGs) were identified, protein-protein interaction (PPI) networks were constructed to identify important gene clusters and modules. The study used two samples to identify hub genes through Mendelian randomization (MR) analysis. The impact of hub genes on clinical diagnosis was assessed using receiver operating characteristic (ROC) curve and nomogram, while the correlation between hub genes and immune cells was investigated through single-set gene set enrichment analysis (ssGSEA). The primary aim of this investigation was to uncover potential DE-CM-RGs that hold diagnostic significance for individuals with NAFLD. Additionally, we established competing endogenous RNA networks and messenger RNA (mRNA)-drug regulatory network, thereby presenting a potential therapeutic strategy for the management of NAFLD.
2 Materials and Methods
2.1 Data download
The GSE135251 and GSE126848 datasets were acquired from the GEO database, containing clinical features and gene expression data from liver tissue of NAFLD patients and healthy controls. The GSE135251 dataset included ten control cases and 206 NAFLD patients, while GSE126848 consisted of 14 control cases and 31 NAFLD patients. Detailed information on the datasets was provided in Supplementary Table S1. A total of 140 cholesterol metabolism-related genes (CM-RGs) were obtained from the Molecular Signatures Database (MSigDB, https://www.gsea-msigdb.org/gsea/msigdb/index.jsp) (Tang et al., 2022). Genome-wide association study (GWAS) summary data for NAFLD was available at https://gwas.mrcieu.ac.uk/datasets/finn-b-NAFLD/, generating 16,380,466 single nucleotide polymorphisms (SNPs) from 894 European patients with NAFLD and 217,898 healthy European controls. Peripheral blood expression quantitative trait loci (eQTL) GWAS data for exposure factors were obtained from the IEU-OPCOSnGWAS database, and eQTL summary level statistics were obtained from the cap analysis of gene expression (CAGE) study, which included peripheral blood gene expression data in 2,765 individuals (Lloyd-Jones et al., 2017).
2.2 Differential expression analysis
The DEGs were identified using “DESeq2” R package (Love et al., 2014) with the threshold of |log2FC| > 0.5 and adjusted p < 0.05 in the NAFLD and healthy controls of GSE135251 and GSE126848 datasets. Subsequently, volcano plots and heatmaps were constructed to visually represent the DEGs in NAFLD. The “VennDiagram” package was used to obtain DE-CM-RGs by intersecting DEGs with CM-RGs.
2.3 Functional enrichment analysis, correlation analysis, and PPI network of DE-CM-RGs
Chromosome location information is essential for the precise positioning of genes in the genome and their upstream and downstream regions, which is beneficial for the in-depth understanding of gene functions and their regulatory mechanisms. The location of DE-CM-RGs on chromosomes was visualised using the “OmicCircos” package (Hu et al., 2014) in this study. To explore the role of DE-CM-RGs in specific biological processes and changes in the activity of specific signalling pathways, Gene Ontology (GO) and Kyoto Encyclopedia of Genes and Genomes (KEGG) enrichment analyses for DE-CM-RGs were conducted using the “clusterProfiler” package (Wu et al., 2021) in R software (adjusted p < 0.05). Subsequently, Spearman correlation analysis of DE-CM-RGs in GSE135251 was performed using the “corrplot” package with a 95% confidence interval (CI). The PPI network of 20 DE-CM-RGs was developed using the Search Tool for the Retrieval of Interacting Genes database (STRING, http://string-db.org) with a medium confidence level above 0.4 and visualized in Cytoscape V3.8.2 software after removing isolated targets. The molecular complex detection (MCODE) plugin integrated within Cytoscape was employed to detect Cluster1 gene based on filter criteria including a minimum degree threshold of 2, a node score threshold of 0.2, a k-core value set at 2, and a maximum depth limited to 100. These module genes were deemed as potential hub genes.
2.4 Mendelian randomization (MR)
In the current study, two-sample MR analysis was used to explore the causal association between potential hub genes and NAFLD. We used potential hub genes (Supplementary Table S2) as exposure variables and NAFLD as the outcome measure. The “TwoSampleMR” package (Hemani et al., 2018) was used for the MR analysis. The instrumental variables (IVs) selected for MR analysis must meet three key assumptions: Assumption 1, there should be a strong correlation between the IVs and exposure factors; Assumption 2, the IVs are independent of confounding variables that may affect both exposure factors and the outcomes; Assumption 3, the affect of the IVs on the outcomes is solely mediated by their influence on the exposure factors, excluding any other mechanisms. SNPs related to hub genes and were not linked to NAFLD were selected by reading exposure factors and filtering IVs through the “extract_instruments” function in R package TwoSampleMR with p < 5 × 10⁻⁸. The SNPs in linkage disequilibrium were eliminated with clump = TRUE, r2 = 0.001, and kb = 20. kb = 20 was used to increase the number of SNPs available for analysis. MR analysis was performed using five algorithms, including MR Egger (Bowden et al., 2015), weighted median (Bowden et al., 2016), simple mode (Hemani et al., 2018), inverse variance weighted (IVW) method (Burgess et al., 2015), and weighted mode (Hartwig et al., 2017). The impact estimates were mainly computed using the IVW method. According to the IVW method, if the corresponding p-values of hub genes were less than 0.05 and their odds ratio (OR) was greater than 1, these genes would be considered risk factors for NAFLD, and if the OR values were less than 1, they would be considered protective factors for NAFLD. Hub genes with p-values greater than 0.05 were considered to have no causal association with NAFLD. As the MR results, they were presented using scatter plots, forest plots, and funnel plots.
2.5 Sensitivity analyses
Sensitivity analyses, comprising heterogeneity test, horizontal pleiotropy test, and leave-one-out (LOO) analysis, were conducted to assess the validity and generalisability of the MR findings. We detected heterogeneity among the causal effects through the mr_heterogeneity function, using the Cochran’s Q statistic from the IVW methodology. A p-value of greater than 0.05 for the Cochran’s Q test indicated the presence of heterogeneity (Xu et al., 2023). Horizontal heterogeneity test was supported by the “mr_pleiotropy_test” function, respectively (Qin et al., 2023). The p-value of MR-Egger exceeded 0.05 manifested the absence of horizontal pleiotropy in MR study. We utilized “mr_leaveoneout” function for LOO analysis (Cui et al., 2021), which evaluated the effect of the remaining SNPs on the outcome variable by progressively eliminating each SNP through IVW method.
2.6 Evaluating the diagnostic accuracy of hub genes
The “pROC” package (Robin et al., 2011) was used to evaluate ROC on datasets GSE135251 and GSE126848. The genes used for diagnosis have an area under the curve (AUC) value of 0.7 or higher. The accuracy of a diagnostic nomogram, constructed based on gene markers, was evaluated using a calibration curve.
2.7 Gene set enrichment analysis (GSEA)
The “clusterProfiler” package (Yu et al., 2012) was used for GSEA, which identified significant functional and pathway differences among groups with varying expression levels of hub genes in the GSE135251 dataset. We selected the reference KEGG gene set and GO gene sets from the MSigDB. The significance level for GSEA was set at a threshold of less than 0.05, considering the adjusted p-value.
2.8 Immune analysis
The ssGSEA algorithm from the “GSVA” package (Hänzelmann et al., 2013) was used to evaluate the infiltration of 28 immune cells in the GSE135251 dataset between the NAFLD and control groups. Heat maps were generated to show differences in immune infiltration. The Wilcoxon test was employed to evaluate the disparity in immune infiltrating cells between NAFLD and control groups (p < 0.05). A boxplot was used to display the differential immune infiltrating cells. The “corrplot” package was used to analyze the correlations between differential immune cells. The Spearman correlation analysis was utilized to identify significant correlations and a scatter plot was created to visually represent the relationships between hub genes and immune cells.
2.9 Construction of regulatory networks
According to the NetworkAnalyst platform (https://www.networkanalyst.ca/), the encyclopedia of DNA elements (ENCODE) database was utilized for the prediction of transcription factors (TFs) linked to hub genes. The TarBase and miRTarBase databases were utilized to predict the microRNA (miRNA)-mRNA interactions based on these hub genes. Additionally, evidence for direct interaction between the predicted miRNAs and long non-coding RNAs (lncRNAs) was integrated using the StarBase database (http://starbase.sysu.edu.cn/starbase2/index.php). A comprehensive network comprising mRNA, miRNA and lncRNA was constructed and represented using Cytoscape software (version 3.8.2). The Comparative Toxicogenomics Database (https://ctdbase.org/) was employed to predict drugs targeting hub genes. The investigation examined the correlation between hub genes and drugs, only retaining drugs with a “Reference Count” greater than 1. The mRNA-drug regulatory network was visualized using the Cytoscape software.
2.10 Statistical analysis
Statistical analysis was conducted utilizing R software (version 4.1.0). A level of significance lower than 0.05 indicated the presence of a significant difference. The Wilcoxon test was employed to compare groups.
3 Results
3.1 Totally 20 DE-CM-RGs and 9 potential central genes were identified
In the GSE135251 dataset, totally 5,460 DEGs were obtained between NAFLD patients and healthy controls, with 2,717 upregulated genes and 2,743 downregulated genes. The dataset GSE126848 identified 4,473 DEGs, with 2,512 upregulated genes and 1,961 downregulated genes. The volcano plot and heatmap of the two databases were shown in Figures 1A,B. The up- or downregulated DEGs in GSE135251 and GSE126848 were intersected separately, resulting in 455 upregulated and 279 downregulated genes. Taking the intersection of the upregulated DEGs (2,717) in GSE135251 and the upregulated DEGs (2,743) in GSE126848, 455 shared upregulated DEGs were obtained. Taking the intersection of the downregulated DEGs (2,512) in GSE135251 and the downregulated DEGs (1961) in GSE126848, 279 shared downregulated DEGs were obtained. Shared upregulated DEGs and shared downregulated DEGs were combined to obtain 734 shared DEGs. Twenty DE-CM-RGs were identified by crossing 140 CM-RGs with 734 DEGs (Figure 1C). The loop graph illustrated the chromosomal positions of the 20 DE-CM-RGs (Figure 1D). Chromosomal localisation showed that four of the 20 DE-CM-RGs were located on chromosome 8, two genes were located on chromosomes 5, 10, 11 and 16, respectively, and there was only one gene on each of chromosomes 1, 4, 6, 12, 14, 15, 19 and the Y chromosome. Subsequently, 20 DE-CM-RGs were analyzed using GO and KEGG to identify their underlying functions. The DE-CM-RGs were functionally enriched in cholesterol metabolic process, cholesterol biosynthetic process, sterol biosynthetic process, and fatty acid synthase activity based on GO annotations for cellular components, biological processes, and molecular functions. Figure 2A displayed the top ten GO terms for each classification. The KEGG pathways enriched by these DE-CM-RGs included glycerolipid metabolism, cholesterol metabolism, fatty acid metabolism, PPAR signaling pathway, biosynthesis of unsaturated fatty acids, and steroid biosynthesis pathways (Figure 2B). The correlation among the twenty DE-CM-RGs was strong, with SQLE and HMGCS1 showing the highest level of strength, as evidenced by a robust correlation coefficient of 0.9508 (Figure 2C). The high correlation between SQLE and HMGCS1 reveals a tight synergistic regulation of the cholesterol synthesis pathway in specific cells or tissues. As key enzymes of this pathway, changes in their expression may affect hepatic cholesterol homeostasis and thus have a role in the progression of NAFLD.
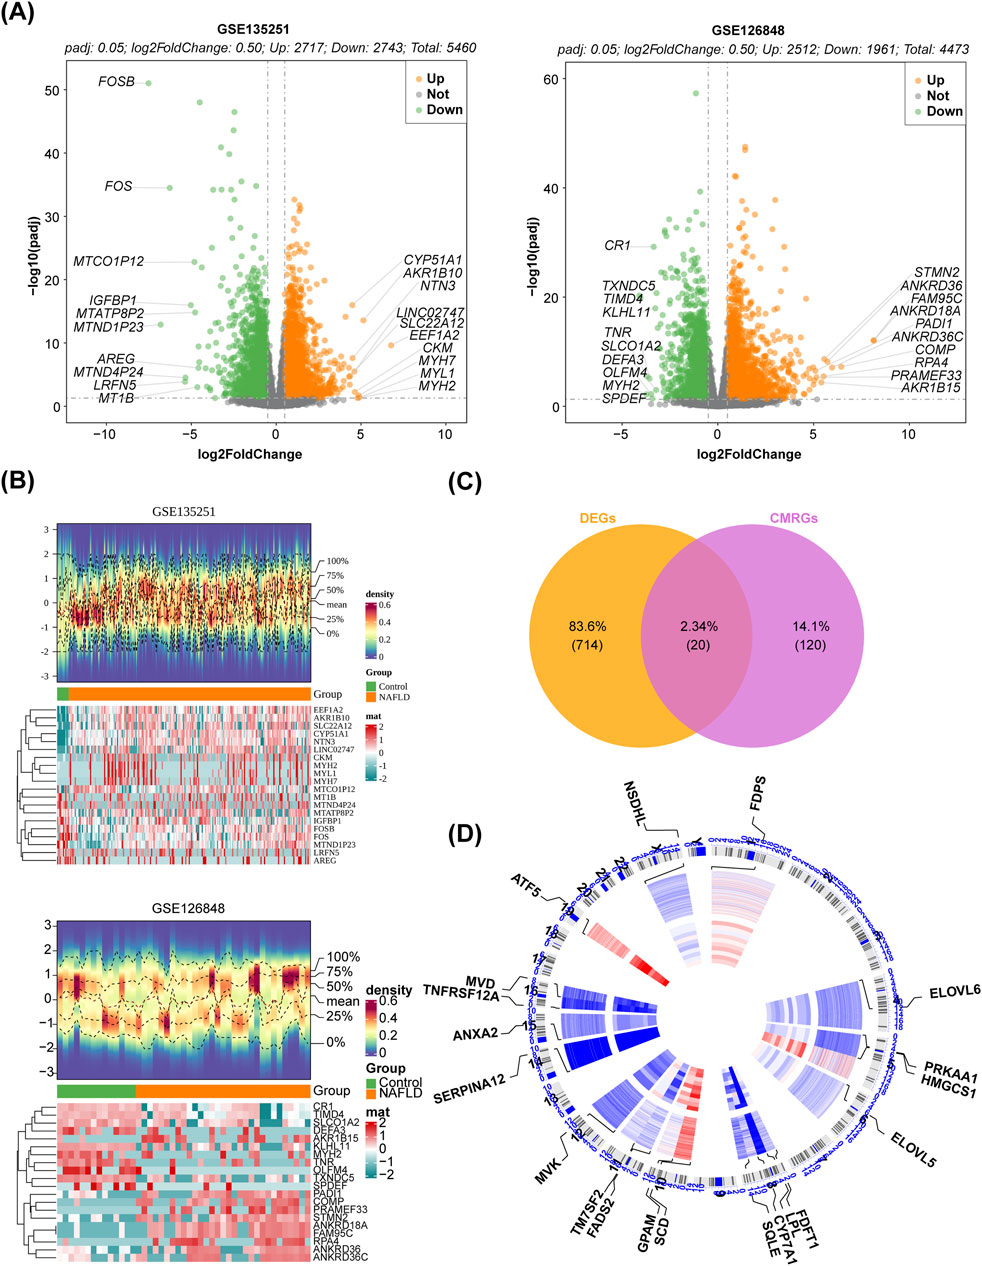
Figure 1. Identification of DE-CM-RGs. (A) Volcano plot of DEGs between the NAFLD and control groups in two GEO datasets (p < 0.05). (B) Heatmap of DEGs between the NAFLD and control groups (p < 0.05). (C) The venn diagram illustrating the intersection of DEGs and CM-RGs. (D) The locations of the 20 DE-CM-RGs on 23 chromosomes. CM-RGs, cholesterol metabolism-related genes; DE-CM-RGs, the differentially expressed genes associated with cholesterol metabolism; DEGs, the differentially expressed genes; GEO, Gene Expression Omnibus.
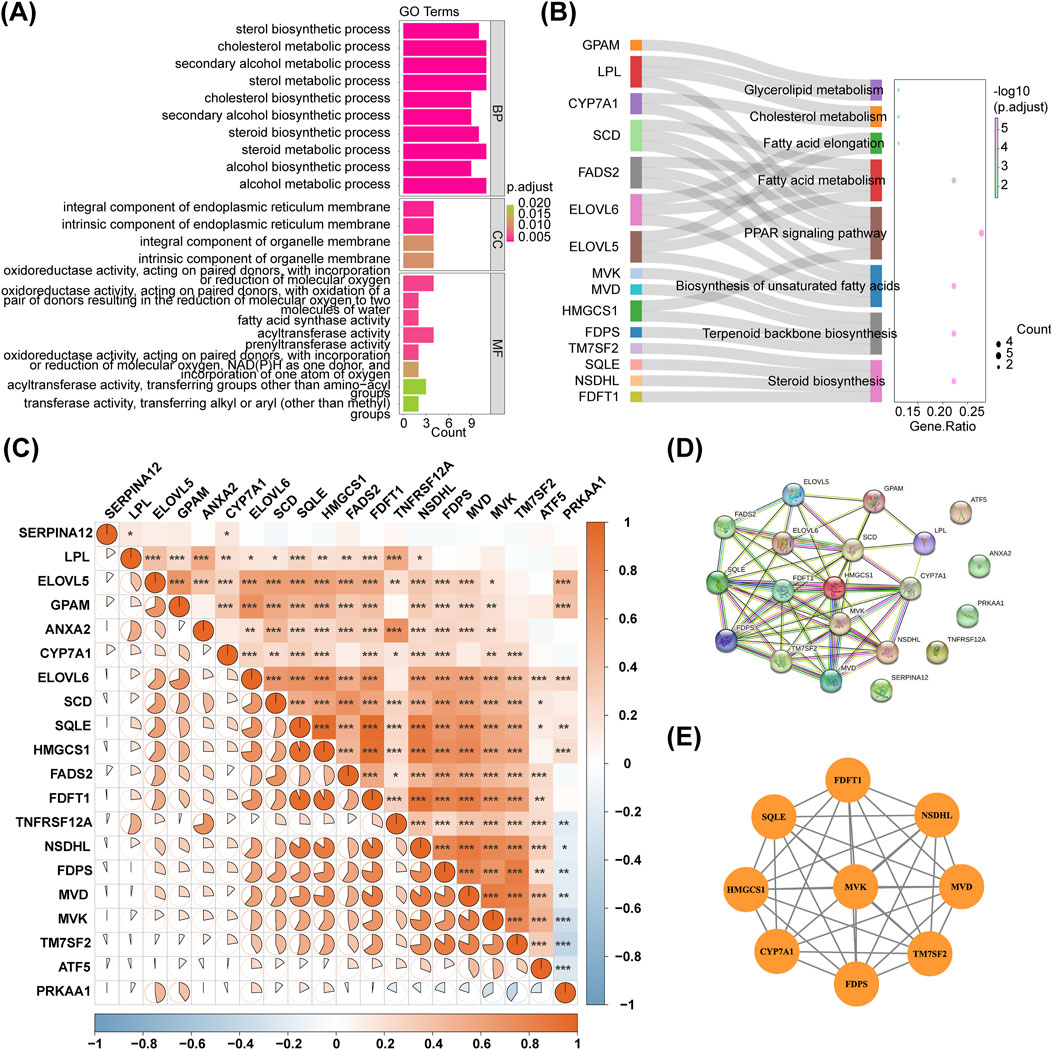
Figure 2. PPI network construction for DE-CM-RGs. (A,B) GO terms and KEGG pathways enriched by DE-CM-RGs. (C) Correlation analysis of 20 DE-CM-RGs. (D) The PPI network of DE-CM-RGs. (E) The most significant module identified by MCODE. PPI, protein-protein interaction; DE-CM-RGs, the differentially expressed genes associated with cholesterol metabolism; GO, Gene ontology; KEGG, Kyoto Encyclopedia of Genes and Genomes; BP, biological progress; CC, cellular component; MF, molecular function; MCODE, molecular complex detection.
A PPI network of 20 DE-CM-RGs was constructed, and a significant gene cluster module was identified, including 9 potential hub genes: MVK, FDPS, MVD, TM7SF2, FDFT1, SQLE, CYP7A1, HMGCS1, and NSDHL (Figures 2D,E).
3.2 MVK and TM7SF2 were protective factors, HMGCS1 and FDPS were risk factors for NAFLD
Nine potential hub genes were used as exposure factors and NAFLD as an outcome variable to explore the causal relationship between genes and NAFLD. Since there were too few SNPs corresponding to CYP7A1 and NSDHL to support the following analyses, both were excluded. The IVW found no evidence linking FDFT1, SQLE, and MVD to NAFLD. Of note, The IVW analysis provided suggestive evidence for the association between MVK (OR = 0.674, 95% CI = 0.524–0.868, p = 0.002), HMGCS1 (OR = 2.163, 95% CI = 1.182–3.955, p = 0.012), TM7SF2 (OR = 0.895, 95% CI = 0.826–0.970, p = 0.007), and FDPS (OR = 1.477, 95% CI = 1.239–1.761, p < 0.001) and the risk of NAFLD (Table 1). Specifically, MVK and TM7SF2 were protective factors, while HMGCS1 and FDPS were risk factors for NAFLD. These findings were visually represented using scatter plots, where the slopes of MVK and TM7SF2 were negative, while the slopes of HMGCS1 and FDPS were positive (Figures 3A–D). The approximately symmetric distribution of points in the funnel plots showed that the causality between MVK, TM7SF2, HMGCS1, FDPS and NAFLD followed Mendel’s second law of randomisation (Figures 3E–H). Forest plots illustrating the association between MVK,TM7SF2, HMGCS1 and FDPS with NAFLD are presented in Figures 4A,C,E,G respectively. The MR effect sizes for HMGCS1 and FDPS on NAFLD exceeded 0 in the forest plots, manifesting that they might increase the risk of NAFLD. However, the outcomes of MVK and TM7SF2 on NAFLD were opposite. The Cochran’s Q test did not detect any heterogeneity (Q_p > 0.05) (Supplementary Table S3). The MR-Egger regression analysis showed no significant overall horizontal pleiotropy based on the intercept value (p > 0.05) (Supplementary Table S3). The LOO analysis indicated that the overall estimate was not influenced by any individual SNP (Figures 4B,D,F,H). In conclusion, sensitivity analyses proved the reliability and robustness of MR outcomes. FDPS, HMGCS1, MVK, TM7SF2 identified as hub genes in this study by MR analysis.
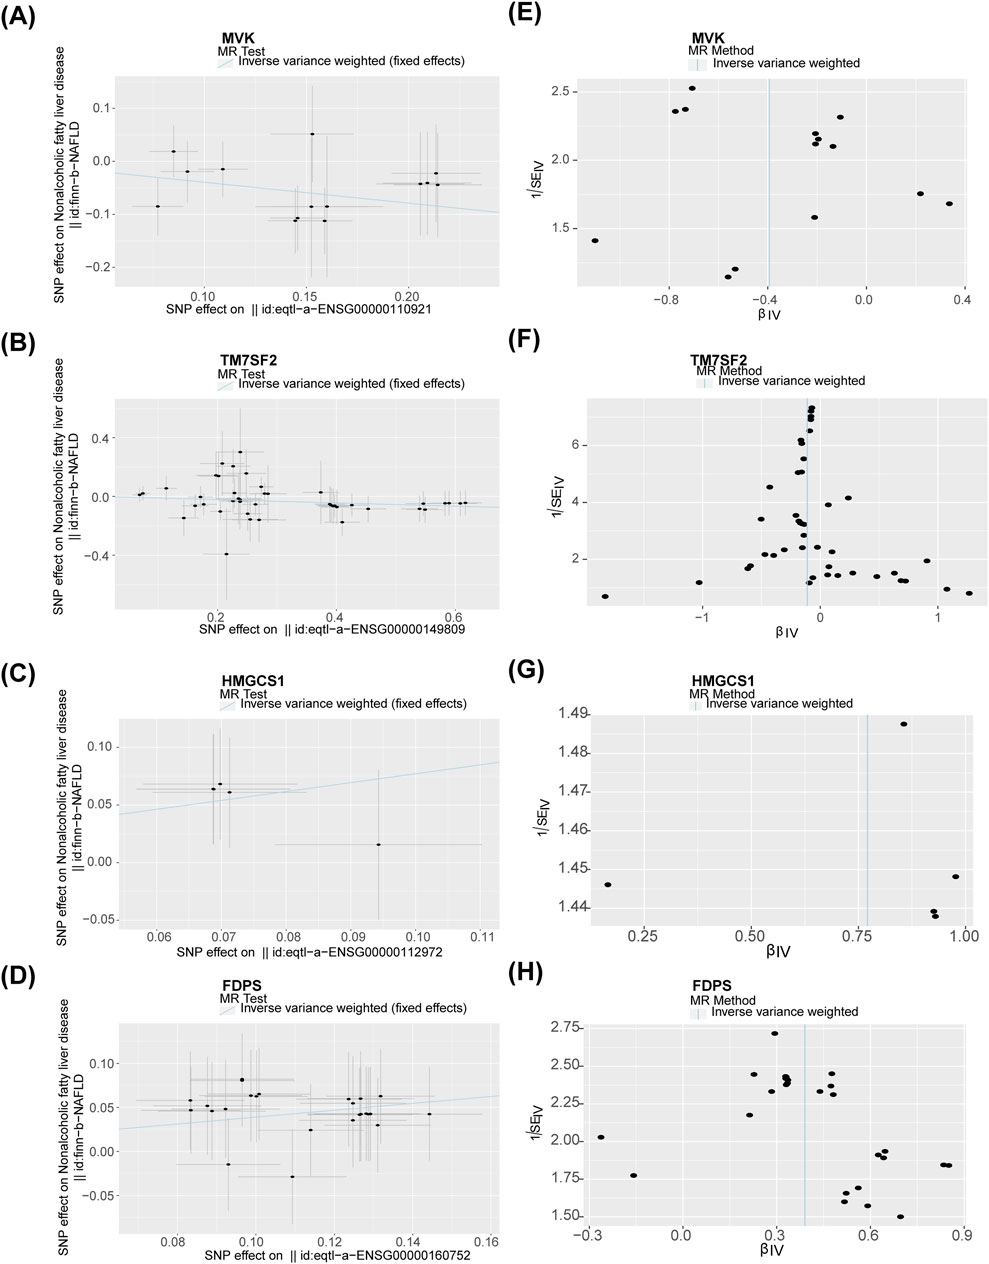
Figure 3. (A–D) Association of MVK, TM7SF2, HMGCS1, and FDPS with NAFLD visualized by scatter plots. (E–H) Funnel plots of the association of MVK,TM7SF2, HMGCS1, and FDPS with NAFLD. NAFLD, non-alcoholic fatty liver disease.
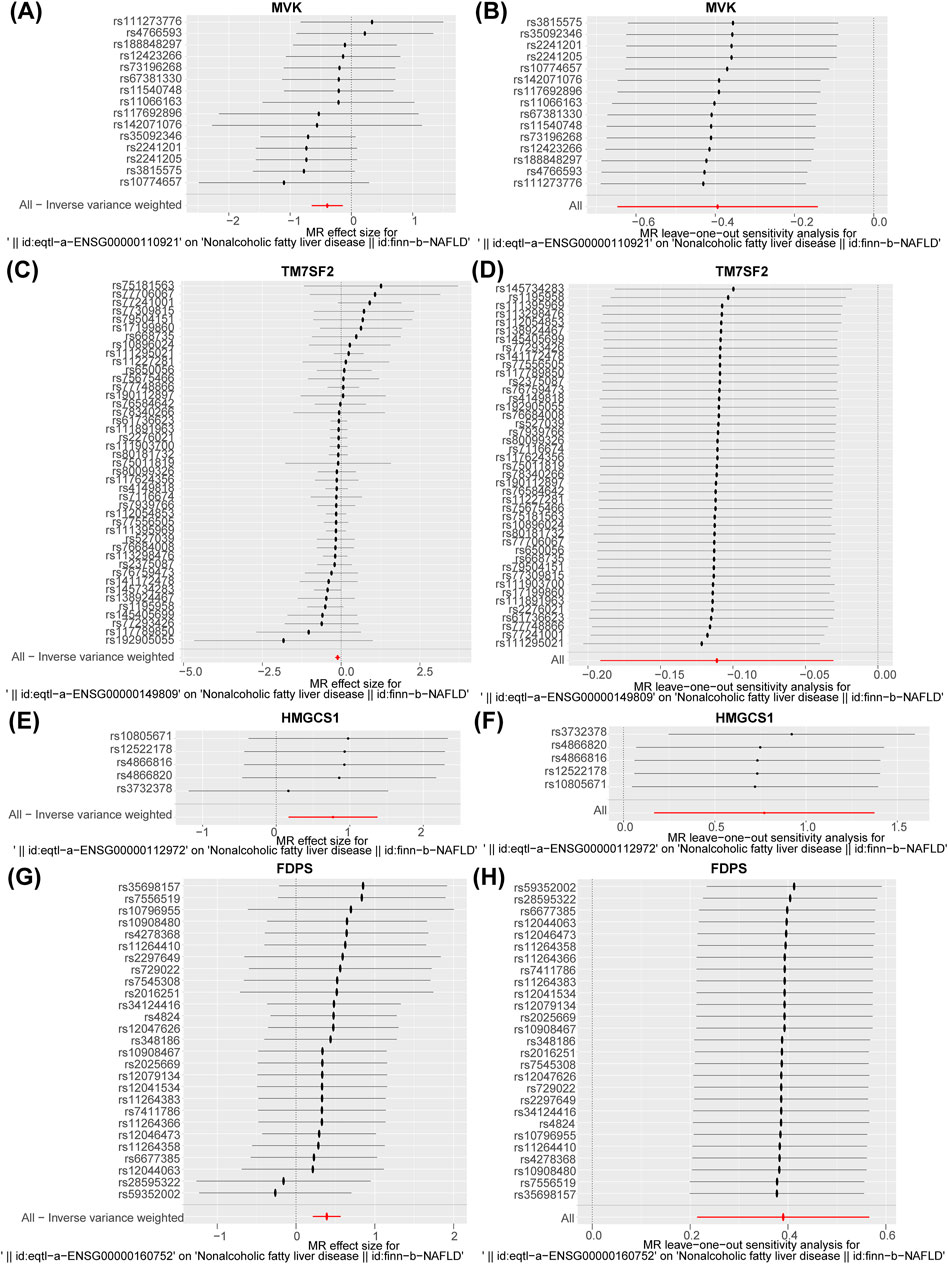
Figure 4. (A, C, E, and G) Forest plot of the association of MVK, TM7SF2, HMGCS1, and FDPS with NAFLD. (B, D, F, and H) Leave-one-out analysis of the causal association of MVK, TM7SF2, HMGCS1, and FDPS with NAFLD. The black dots and bars indicated the causal estimate and 95% CI when a SNP was removed in turn. The red dot and bar indicated the overall estimate and 95% CI using inverse variance weighted method. NAFLD, non-alcoholic fatty liver disease; CI, confidence interval; SNP, single-nucleotide polymorphism.
3.3 The hub gene-based nomogram could assess NAFLD risk accurately
The diagnostic accuracy of MVK, HMGCS1, TM7SF2, and FDPS for NAFLD was confirmed by ROC analysis, as the AUC values for FDPS, MVK, and TM7SF2 genes exceeded 0.7 in the datasets GSE135251 and GSE126848 datasets (Figures 5A,B). Nomograms containing these four hub genes were constructed based on GSE135251 and GSE126848 datasets (Figures 5C,D). The AUC of the nomogram was 0.79 in GSE135251 and 0.848 in GSE126848 (Figures 5E,F), demonstrating its strong predictive ability for NAFLD. The calibration curve demonstrated excellent concordance between the predictions derived from the nomogram and the actual observations (Figures 5G,H).
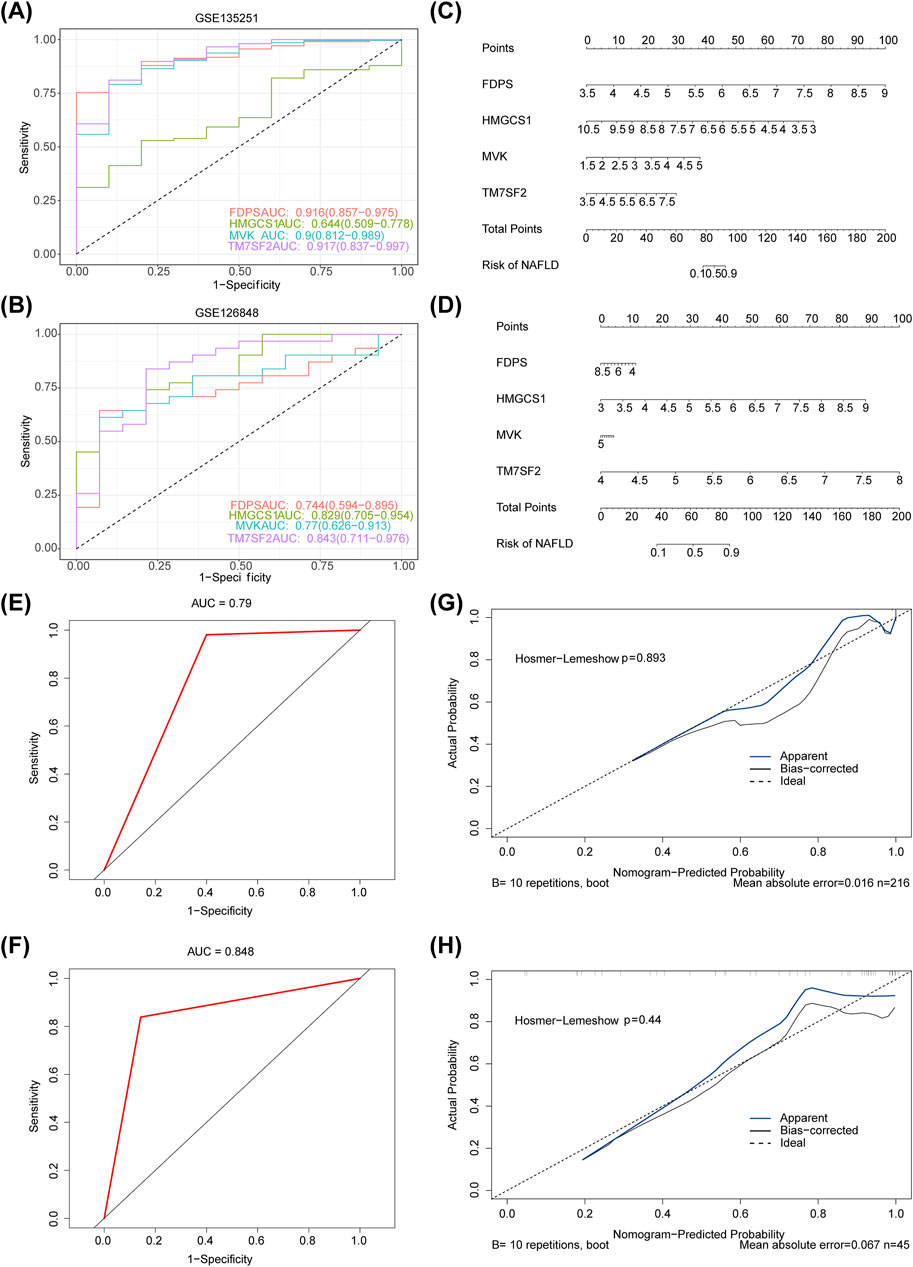
Figure 5. (A,B) ROC analysis of four hub genes (MVK, HMGCS1, TM7SF2 and FDPS) for diagnostic performance in GSE135251 and GSE126848 datasets. (C,D) Diagnostic nomogram for NAFLD using four hub genes (MVK, HMGCS1, TM7SF2 and FDPS) in the GSE135251 and GSE126848 datasets. (E,F) ROC curve of nomogram in GSE135251 and GSE126848. (G,H) Calibration curves of the nomogram in GSE135251 and GSE126848. ROC, receiver operating characteristic; AUC, area under the curve; NAFLD, non-alcoholic fatty liver disease.
3.4 The latent functions of hub genes
We conducted GSEA for the identification of key signaling pathways at a single-gene level. HMGCS1 was significantly enriched in thioester and sterol metabolic processes, steroid biosynthesis, calcium signaling pathway, and unsaturated fatty acid biosynthesis (Figure 6A). FDPS showed significant enrichment in secondary alcohol metabolism, steroid biosynthesis, calcium signaling pathway, and biosynthesis of unsaturated fatty acids (Figure 6B). MVK exhibited significant enrichment in secondary alcohol metabolism, sterol metabolic processes, regulation of monoatomic ion transport, steroid biosynthesis, and calcium signaling pathways (Figure 6C). TM7SF2 demonstrated significant enrichment in myeloid leukocyte migration functions, cell chemotaxis, leukocyte cell adhesion, leukocyte migration, and steroid biosynthesis (Figure 6D).
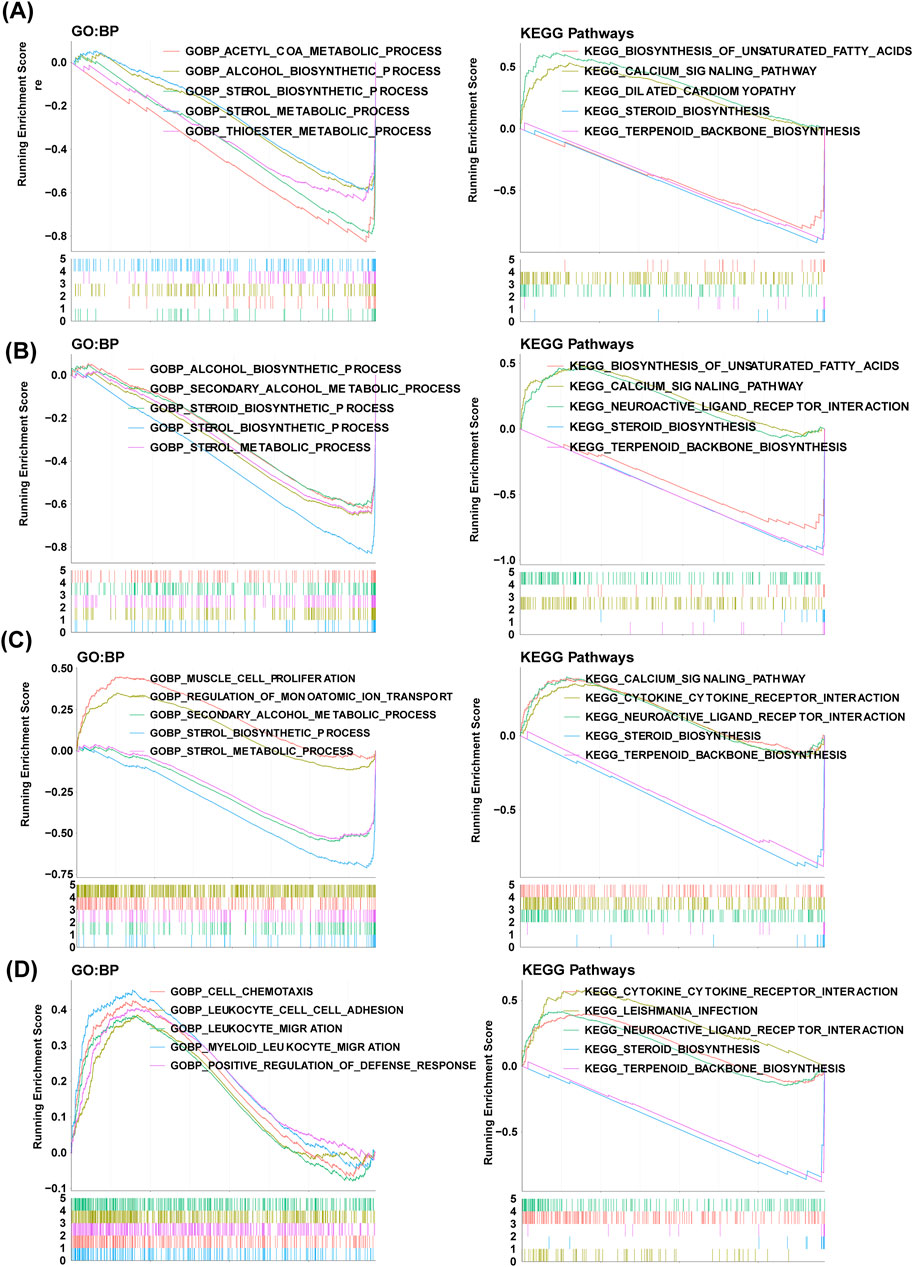
Figure 6. GSEA revealing GO-BP and KEGG items enriched by hub genes. The GSEA results of HMGCS1 (A), FDPS (B), MVK (C) and (D) TM7SF2. GO, Gene ontology; KEGG, Kyoto Encyclopedia of Genes and Genomes; BP, biological progress; GSEA, gene set enrichment analysis.
3.5 There were 8 differential immune cells in NAFLD and controls
The ssGSEA algorithm was used to analyze the enrichment scores of 28 immune cell types, and a heat map was generated to visualize immune infiltration in NAFLD (Figure 7A). Wilcoxon test revealed significant differences in activated CD4 T cells, CD56bright natural killer (NK) cells, T helper Type 1 (Th1) cells, activated B cells, CD56dim NK cells, Th17 cells, eosinophils, and Th2 cells between NAFLD and control groups (p < 0.05). Compared to controls, NAFLD patients had higher levels of CD56dim NK cells and Th17 cells but lower levels of activated CD4 T cells, CD56bright NK cells, Th1 cells, activated B cells, eosinophils and Th2 cells (Figure 7B). Th2 cells and activated CD4 T cells exhibited the strongest correlation with a coefficient of 0.7492 (Figure 7C). The correlation between the four hub genes (FDPS, HMGCS1, MVK, and TM7SF2) and eight differential immune infiltrating cells was analyzed, a negative association was observed between Th2 cells and both MVK and TM7SF2 (Figure 7D).
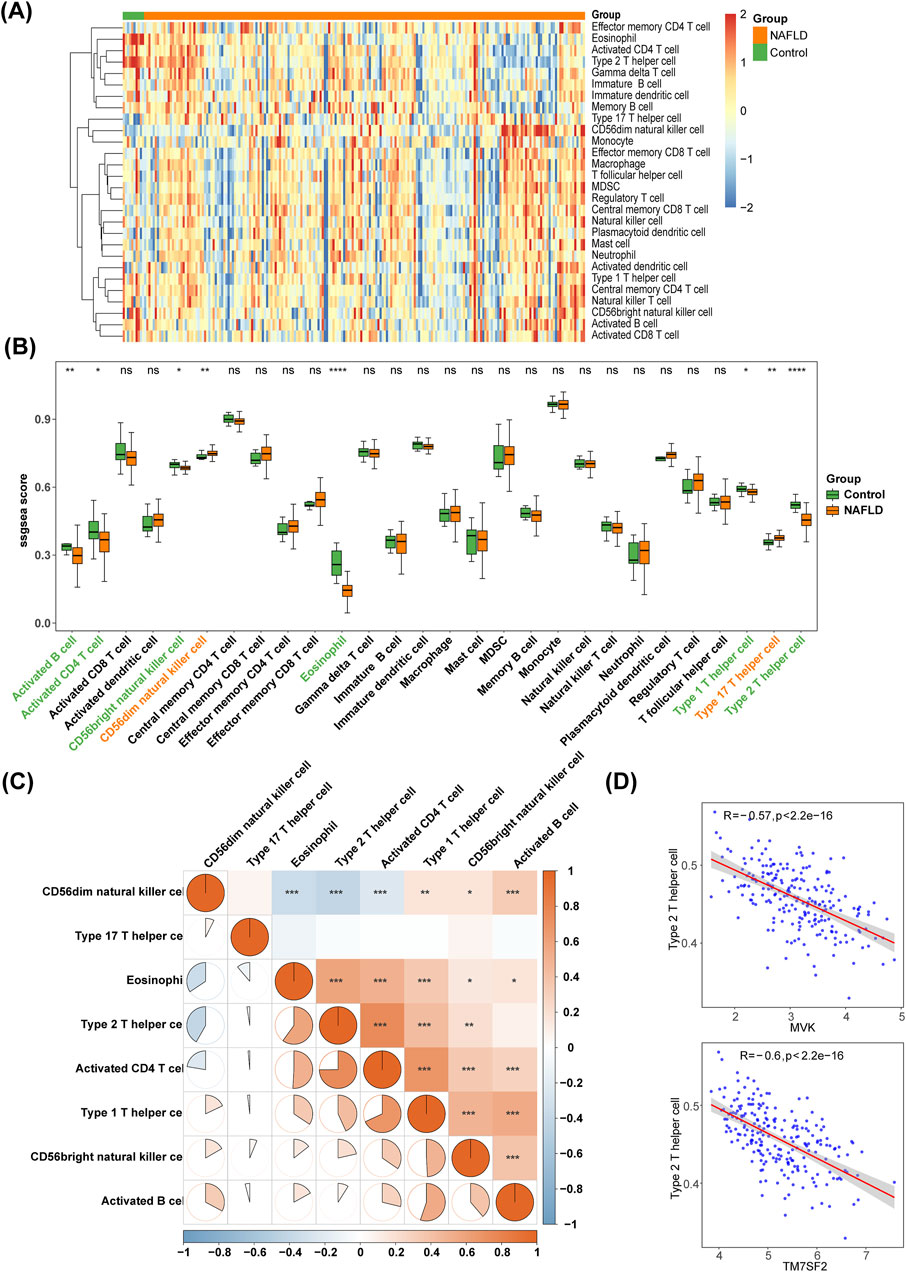
Figure 7. Immune infiltration analysis. (A) The heat map showing the distribution of 28 immune cells in NAFLD and controls. (B) Box plots comparing differences in enrichment scores of 28 immune infiltrating cells between NAFLD and controls. *p < 0.05, **p < 0.01, ***p < 0.001, ns: p > 0.05. (C) Heat map displaying correlations among different immune cells. (D) Scatter plot of correlation between hub genes (MVK and TM7SF2) and differential immune cells in NAFLD. NAFLD, non-alcoholic fatty liver disease.
3.6 Comprehensive regulatory network analysis revealed key regulatory factors and potential therapeutic agents of hub genes
The mRNA-TF regulatory network included 153 nodes (3 hub genes, 150 TFs), and 206 edges (Figure 8A). The lncRNA-miRNA-mRNA regulatory network consisted of three genes, 47 nodes and 158 edges (Figure 8B). The findings revealed that the manifestation of HMGCS1 might be regulated in a competitive manner by fastening with hsa-let-7b-5p, hsa-miR-155-5p, hsa-miR-186-5p, hsa-miR-192-5p, hsa-miR-23a-3p, hsa-miR-210-3p, hsa-miR-335-p and hsa-miR-23b-3p to 134 lncRNAs. 24 lncRNAs could competitively bind both hsa-miR-335-5p and hsa-miR-193b-3p to regulate TM7SF2. Thirteen lncRNAs competitively bind to hsa-miR-124-3p, regulating the expression of MVK. The mRNA-drug regulatory network identified four key hub genes and 62 drugs or compounds, including tretinoin, entinostat, alendronate, zoledronic acid and quercetin as potential targeted drugs for regulating cholesterol metabolism genes in NAFLD (Figure 8C).
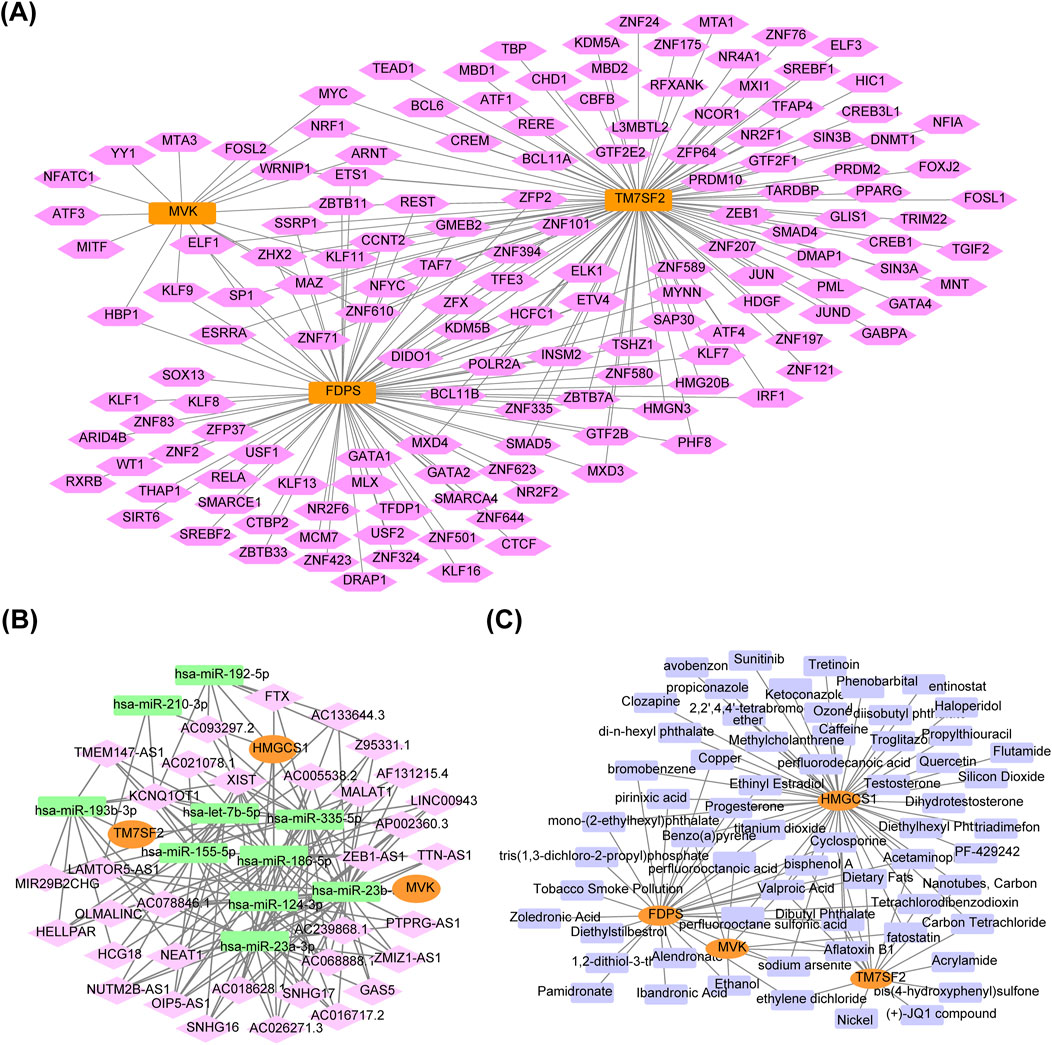
Figure 8. Regulatory network of hub genes. (A) mRNA-TF regulatory network. Orange for hub genes, pink for TFs. (B) lncRNA-miRNA-mRNA regulatory network. Orange represents hub genes, green represents miRNAs, pink represents lncRNAs. (C) mRNA-drug regulatory network. Orange for hub genes, purple for drugs. TFs, transcription factors; mRNA, messenger RNA; lncRNA, long non-coding RNA; miRNA, microRNA.
4 Discussion
NAFLD is a prevalent hepatic disorder affecting millions of individuals worldwide. NAFLD not only affects patients’ wellbeing and health, but also increases the risk of developing cirrhosis and HCC. Consequently, effective prevention and control strategies are imperative for curtailing the onset and progression of this condition. However, the current therapeutic approaches for NAFLD remain unsatisfactory due to the intricate nature of its pathogenesis. A previous study demonstrated that hepatic accumulation of free cholesterol induces cytotoxicity, thereby facilitating the transition from steatosis to non-alcoholic steatohepatitis (NASH) (Van Rooyen et al., 2011). The exact role of cholesterol metabolism in NAFLD is not fully understood. To our understanding, this research is the initial attempt to recognize and examine the involvement of CM-RGs in NAFLD.
In the present investigation, we demonstrated the significant impact of four genes (MVK, HMGCS1, TM7SF2, and FDPS) on NAFLD risk. Both datasets showed AUC values exceeding 0.7 for FDPS, MVK, and TM7SF2. Additionally, we constructed a nomogram model incorporating MVK, HMGCS1, TM7SF2, and FDPS. The nomogram achieved AUCs of 0.79 in GSE135251 and 0.848 in GSE126848 datasets respectively, indicating its reliability as a biomarker for predicting NAFLD diagnosis.
Our study identified four key DE-CM-RGs (MVK, HMGCS1, TM7SF2, and FDPS) with the strongest association to NAFLD. FDPS, a key enzyme in the mevalonate pathway, produces farnesyl pyrophosphate and geranyl pyrophosphate, which are involved in cholesterol synthesis. The presence of FDPS in various neoplasms and its association with cardiovascular diseases has been previously reported (Seshacharyulu et al., 2019; Wang et al., 2021). Excessive FDPS expression leads to heightened disease severity in NASH by increasing farnesyl pyrophosphate levels, which enhance CD36 expression and accelerate the development of NASH through lipid accumulation, inflammation, and fibrosis (Liu et al., 2023). Based on our MR analysis and nomogram model, we identified FDPS as a risk factor for NAFLD. Our findings suggested that increased FDPS expression was associated with an elevated risk of NAFLD, consistent with previous research (Liu et al., 2023). HMGCS1 is a key enzyme in the cholesterol biosynthesis pathway. Ursolic acid inhibits HMGCS1 activity, reducing cholesterol-related metabolite production and may explaining its therapeutic effects against hyperlipidemia and atherosclerosis and related disorders (Ma et al., 2022). Additionally, dysregulation of mevalonate on the CSN6-HMGCS1-YAP1 axis has been found to specifically promote NAFLD-related liver cancer progression in HCC development (Li et al., 2024). However, the exact involvement of HMGCS1 in NAFLD remains unclear. The TM7SF2 gene encodes a pivotal enzyme involved in cholesterol biosynthesis and plays a critical role in diverse biological processes, encompassing liver regeneration (Bartoli et al., 2016) and regulation of inflammatory response (Gatticchi et al., 2015). The investigation revealed that a deficiency in TM7SF2 leads to delayed cell cycle progression and disrupted lipid metabolism during liver regeneration (Bartoli et al., 2016). Leonardo Gatticchi et al. have confirmed that the deletion of TM7SF2 disrupts adipogenesis in mouse embryonic fibroblasts by modulating early and late regulators, leading to decreased insulin sensitivity and upregulation of the anti-adipogenic factor matrix metalloproteinase 3 (Gatticchi et al., 2021). Dysregulation of TM7SF2 function may contribute to metabolic abnormalities and diseases, including dyslipidemia, insulin resistance and obesity. However, the role of TM7SF2 in NAFLD remains to be elucidated. The MVK gene encodes the enzyme mevalonate kinase, which plays a vital role in the early stages of cholesterol biosynthesis. Mutations in the MVK gene can lead to hyperimmunoglobulinemia D syndrome and mevalonic aciduria (Brennenstuhl et al., 2021; Haas and Hoffmann, 2006). The upregulation of MVK was observed in NAFLD patients in this study; however, further investigation is required to elucidate its involvement in disease mechanisms.
The activity of HMGCS1 can influence the rate of cholesterol biosynthesis in the liver. Ligustilide forms an irreversible bond with the Cys129 site of HMGCS1 through its metabolic intermediate, leading to a significant reduction in HMGCS1 enzyme activity and thus effectively ameliorating dyslipidemia induced by a high-fat diet in mice (Zhang et al., 2023). HMGCS1 also serves as a crucial molecular connection between obesity, inflammation, type 2 diabetes, and coronary artery calcification (Ding et al., 2015). Furthermore, TM7SF2, a novel factor, is implicated in the differentiation of fat cells and the development of adipose tissue along with metabolic wellbeing (Gatticchi et al., 2021). Depletion of TM7SF2 may lead to various unfavorable metabolic outcomes including weight gain, decreased insulin sensitivity, and reduced Akt kinase activity (Gatticchi et al., 2020), potentially affecting hepatic lipid metabolism homeostasis due to differences in its expression or function (Huang et al., 2021). Additionally, Mireia Junyent et al. suggested that genetic variations in the MVK gene influence levels of high-density lipoprotein cholesterol, potentially affecting blood lipid levels (Junyent et al., 2009). In nephrotic rats, the upregulation of the FDPS gene significantly promotes cholesterol biosynthesis, providing a crucial insight into the pathogenesis of hypercholesterolemia associated with nephrotic syndrome (Zhou et al., 2008). Our review indicates that the four hub genes are closely linked to cholesterol synthesis and lipid metabolism, playing pivotal roles in metabolic disorders like hyperlipidemia, insulin resistance, diabetes, and obesity. Considering the known correlation between these conditions and NAFLD progression (Rinella et al., 2024), it is plausible that these hub genes are strongly associated with NAFLD progression.
Immune dysregulation plays an essential part in NAFLD pathogenesis. We studied immune infiltration in NAFLD and found elevated levels of CD56dim NK cells and Th17 cells compared to control liver samples. Th17 cells significantly impact immune defense against pathogens that exist outside of cells. The population of Th17 cells is increased in both the hepatic and peripheral blood of NAFLD mice (He et al., 2017). Similarly, patients with NASH exhibit increased hepatic TH17 cell population (Rau et al., 2016). NK cells are classified into CD56dim and CD56bright types based on surface density, with the former exerting cytotoxicity and the latter regulating immunity through cytokine secretion (Stabile et al., 2017). Previous research has shown a decrease in CD56bright NK cells in individuals with NAFLD compared to the control group, while an elevated frequency of CD56dim NK cells has been observed, consistent with our own findings (Diedrich et al., 2020). In our investigation, Th2 cell levels decreased in NAFLD and were associated with MVK and TM7SF2, but their role in the pathogenesis of NAFLD remains unclear. Th2 cells can have anti-inflammatory effects through cytokine secretion. The frequency of Th2 cells was elevated in peripheral blood of individuals with NAFLD compared to controls (Rau et al., 2016), but no statistically significant disparities were noted between NASH patients and both NAFLD individuals and controls (Inzaugarat et al., 2011). IL-33 stimulates Th2 cells to produce cytokines, inducing liver fibrosis while reducing liver damage in a murine model of NASH (Gao et al., 2016). Hence, additional research is required to elucidate the precise involvement of Th2 cells in NAFLD.
GSEA showed that FDPS, HMGCS1 and MVK were significantly enriched in calcium signaling pathways. The dysregulation of calcium signaling is crucial in metabolism and has been linked to cancer development (Liang et al., 2018). RYR1 gene mutations are frequently found in both mouse and human NASH-HCC, indicating dysregulation of calcium signaling in cholesterol-related NASH-HCC and NASH rather than steatosis (Liang et al., 2018). PAR2 impairs glucose uptake and insulin sensitivity in NAFLD by decreasing GLUT2 expression through the Gq-MAPK-FoxA3 pathway, and inhibiting insulin-Akt signaling via the Gq-calcium-CaMKK2 pathways (Shearer et al., 2022). Unsaturated fatty acid involves FDPS and HMGCS1. The unsaturated fatty acids can inhibit lipolysis and mitigate hepatic fat accumulation (Rosqvist et al., 2019). Musa-Veloso et al. discovered that supplementation with ω3-polyunsaturated fatty acids effectively reduced liver fat content and steatosis score in NAFLD patients (Musa-Veloso et al., 2018). The previous study proposed that n-3 polyunsaturated fatty acids have the potential to modulate molecular pathways related to lipogenesis, endoplasmic reticulum function, and mitochondrial function, leading to improvements in NASH (Okada et al., 2018).
Considering the limited availability of effective treatments for NAFLD, this study explored gene-targeted medications that specifically focus on four hub genes. Tretinoin is a vitamin A-derived retinoid drug commonly used to treat acne and acute promyelocytic leukemia. Individuals with NAFLD exhibit decreased levels of circulating retinoic acid, which plays a crucial role in hepatic lipid metabolism and insulin resistance (Liu et al., 2015). Retinoic acid protected against high-fat diet-induced hepatosteatosis by downregulating Srebp-1c expression and enhancing antioxidant capacity through a Sirt1-mediated mechanism (Geng et al., 2017). Alendronate, a pharmacological inhibitor of FDPS used clinically to treat glucocorticoid-induced osteoporosis, improved inflammation, steatosis and fibrosis in mice with NASH(27). Zoledronic acid, an inhibitor of FDPS, mitigated hepatic steatosis by suppressing de novo lipogenesis in NAFLD mice (Mohamed et al., 2019). Quercetin ameliorates NAFLD in db/db mice by attenuating inflammation, oxidative stress, and modulating lipid metabolism via the farnesoid X receptor 1/Takeda G-protein-coupled receptor 5 signaling pathways (Yang et al., 2019). Pharmaceutical interventions targeting these four genes present a novel prospective strategy for managing NAFLD.
However, our study has several limitations. First, the limited availability of information in the public datasets necessitates the inclusion of additional data to increase the validity of the findings. Second, further validation through mouse experiments and additional clinical samples is imperative to corroborate the findings and elucidate the underlying mechanisms of CM-RGs in NAFLD.
5 Conclusion
In the current study, we have successfully identified four hub genes (MVK, HMGCS1, TM7SF2, and FDPS) associated with cholesterol metabolism in NAFLD. Based on these hub genes, we developed a nomogram to accurately diagnose patients with NAFLD. Our findings offer potential molecular targets for elucidating the pathogenesis of NAFLD and guiding the development of drug therapies. However, the specific mechanisms involved in disease development and the exact molecular targets require additional verification.
Data availability statement
Publicly available datasets were analyzed in this study. This data can be found here: The datasets supporting the conclusions of this article are available in the GEO repository, unique persistent identifier and hyperlink to dataset(s) in https://www.ncbi.nlm.nih.gov/gds/?term=GSE135251 and https://www.ncbi.nlm.nih.gov/gds/?term=GSE126848.
Author contributions
JC: Writing–original draft. HR: Data curation, Writing–review and editing. XZ: Conceptualization, Writing–review and editing.
Funding
The author(s) declare that financial support was received for the research, authorship, and/or publication of this article. This work was supported by Startup Fund for scientific research, Fujian Medical University (Grant number: 2020QH1153, 2022QH1346).
Conflict of interest
The authors declare that the research was conducted in the absence of any commercial or financial relationships that could be construed as a potential conflict of interest.
Publisher’s note
All claims expressed in this article are solely those of the authors and do not necessarily represent those of their affiliated organizations, or those of the publisher, the editors and the reviewers. Any product that may be evaluated in this article, or claim that may be made by its manufacturer, is not guaranteed or endorsed by the publisher.
Supplementary material
The Supplementary Material for this article can be found online at: https://www.frontiersin.org/articles/10.3389/fgene.2024.1464865/full#supplementary-material
References
Bartoli, D., Piobbico, D., Bellet, M. M., Bennati, A. M., Roberti, R., Della Fazia, M. A., et al. (2016). Impaired cell proliferation in regenerating liver of 3 β-hydroxysterol Δ14-reductase (TM7SF2) knock-out mice. Cell Cycle 15 (16), 2164–2173. doi:10.1080/15384101.2016.1195939
Bowden, J., Davey Smith, G., and Burgess, S. (2015). Mendelian randomization with invalid instruments: effect estimation and bias detection through Egger regression. Int. J. Epidemiol. 44 (2), 512–525. doi:10.1093/ije/dyv080
Bowden, J., Davey Smith, G., Haycock, P. C., and Burgess, S. (2016). Consistent estimation in mendelian randomization with some invalid instruments using a weighted median estimator. Genet. Epidemiol. 40 (4), 304–314. doi:10.1002/gepi.21965
Brennenstuhl, H., Nashawi, M., Schröter, J., Baronio, F., Beedgen, L., Gleich, F., et al. (2021). Phenotypic diversity, disease progression, and pathogenicity of MVK missense variants in mevalonic aciduria. J. Inherit. Metab. Dis. 44 (5), 1272–1287. doi:10.1002/jimd.12412
Burgess, S., Scott, R. A., Timpson, N. J., Davey Smith, G., and Thompson, S. G.EPIC- InterAct Consortium (2015). Using published data in Mendelian randomization: a blueprint for efficient identification of causal risk factors. Eur. J. Epidemiol. 30 (7), 543–552. doi:10.1007/s10654-015-0011-z
Cui, Z., Feng, H., He, B., He, J., and Tian, Y. (2021). Relationship between serum amino acid levels and bone mineral density: a mendelian randomization study. Front. Endocrinol. 12, 763538. doi:10.3389/fendo.2021.763538
Diedrich, T., Kummer, S., Galante, A., Drolz, A., Schlicker, V., Lohse, A. W., et al. (2020). Characterization of the immune cell landscape of patients with NAFLD. PloS one 15 (3), e0230307. doi:10.1371/journal.pone.0230307
Ding, J., Reynolds, L. M., Zeller, T., Müller, C., Lohman, K., Nicklas, B. J., et al. (2015). Alterations of a cellular cholesterol metabolism network are a molecular feature of obesity-related type 2 diabetes and cardiovascular disease. Diabetes 64 (10), 3464–3474. doi:10.2337/db14-1314
Gao, Y., Liu, Y., Yang, M., Guo, X., Zhang, M., Li, H., et al. (2016). IL-33 treatment attenuated diet-induced hepatic steatosis but aggravated hepatic fibrosis. Oncotarget 7 (23), 33649–33661. doi:10.18632/oncotarget.9259
Gatticchi, L., Bellezza, I., Del Sordo, R., Peirce, M. J., Sidoni, A., Roberti, R., et al. (2015). The Tm7sf2 gene deficiency protects mice against endotoxin-induced acute kidney injury. PloS one 10 (11), e0141885. doi:10.1371/journal.pone.0141885
Gatticchi, L., de Las Heras, J. I., Sivakumar, A., Zuleger, N., Roberti, R., and Schirmer, E. C. (2020). Tm7sf2 disruption alters radial gene positioning in mouse liver leading to metabolic defects and diabetes characteristics. Front. Cell Dev. Biol. 8, 592573. doi:10.3389/fcell.2020.592573
Gatticchi, L., Petricciuolo, M., Scarpelli, P., Macchioni, L., Corazzi, L., and Roberti, R. (2021). Tm7sf2 gene promotes adipocyte differentiation of mouse embryonic fibroblasts and improves insulin sensitivity. Biochim. Biophys. Acta Mol. Cell Res. 1868 (1), 118897. doi:10.1016/j.bbamcr.2020.118897
Geng, C., Xu, H., Zhang, Y., Gao, Y., Li, M., Liu, X., et al. (2017). Retinoic acid ameliorates high-fat diet-induced liver steatosis through sirt1. Sci. China Life Sci. 60 (11), 1234–1241. doi:10.1007/s11427-016-9027-6
Haas, D., and Hoffmann, G. F. (2006). Mevalonate kinase deficiencies: from mevalonic aciduria to hyperimmunoglobulinemia D syndrome. Orphanet J. Rare Dis. 1, 13. doi:10.1186/1750-1172-1-13
Hänzelmann, S., Castelo, R., and Guinney, J. (2013). GSVA: gene set variation analysis for microarray and RNA-seq data. BMC Bioinforma. 14, 7. doi:10.1186/1471-2105-14-7
Hartwig, F. P., Davey Smith, G., and Bowden, J. (2017). Robust inference in summary data Mendelian randomization via the zero modal pleiotropy assumption. Int. J. Epidemiol. 46 (6), 1985–1998. doi:10.1093/ije/dyx102
He, B., Wu, L., Xie, W., Shao, Y., Jiang, J., Zhao, Z., et al. (2017). The imbalance of Th17/Treg cells is involved in the progression of nonalcoholic fatty liver disease in mice. BMC Immunol. 18 (1), 33. doi:10.1186/s12865-017-0215-y
Hemani, G., Zheng, J., Elsworth, B., Wade, K. H., Haberland, V., Baird, D., et al. (2018). The MR-Base platform supports systematic causal inference across the human phenome. eLife 7, e34408. doi:10.7554/eLife.34408
Hu, Y., Yan, C., Hsu, C. H., Chen, Q. R., Niu, K., Komatsoulis, G. A., et al. (2014). OmicCircos: a simple-to-use R package for the circular visualization of multidimensional omics data. Cancer Inf. 13, 13–20. doi:10.4137/CIN.S13495
Huang, T., Yu, L., Pan, H., Ma, Z., Wu, T., Zhang, L., et al. (2021). Integrated transcriptomic and translatomic inquiry of the role of betaine on lipid metabolic dysregulation induced by a high-fat diet. Front. Nutr. 8, 751436. doi:10.3389/fnut.2021.751436
Inzaugarat, M. E., Ferreyra Solari, N. E., Billordo, L. A., Abecasis, R., Gadano, A. C., and Cherñavsky, A. C. (2011). Altered phenotype and functionality of circulating immune cells characterize adult patients with nonalcoholic steatohepatitis. J. Clin. Immunol. 31 (6), 1120–1130. doi:10.1007/s10875-011-9571-1
Ioannou, G. N. (2016). The role of cholesterol in the pathogenesis of NASH. Trends Endocrinol. Metab. 27 (2), 84–95. doi:10.1016/j.tem.2015.11.008
Junyent, M., Parnell, L. D., Lai, C. Q., Lee, Y. C., Smith, C. E., Arnett, D. K., et al. (2009). Novel variants at KCTD10, MVK, and MMAB genes interact with dietary carbohydrates to modulate HDL-cholesterol concentrations in the genetics of lipid lowering drugs and diet network study. Am. J. Clin. Nutr. 90 (3), 686–694. doi:10.3945/ajcn.2009.27738
Li, K., Zhang, J., Lyu, H., Yang, J., Wei, W., Wang, Y., et al. (2024). CSN6-SPOP-HMGCS1 Axis promotes hepatocellular carcinoma progression via YAP1 activation. Adv. Sci. (Weinh) 11, e2306827. doi:10.1002/advs.202306827
Liang, J. Q., Teoh, N., Xu, L., Pok, S., Li, X., Chu, E. S. H., et al. (2018). Dietary cholesterol promotes steatohepatitis related hepatocellular carcinoma through dysregulated metabolism and calcium signaling. Nat. Commun. 9 (1), 4490. doi:10.1038/s41467-018-06931-6
Liu, J., Zhang, X., Zhang, Y., Qian, M., Yang, M., Yang, S., et al. (2023). Farnesyl diphosphate synthase exacerbates nonalcoholic steatohepatitis via the activation of AHR-CD36 axis. FASEB J. 37 (7), e23035. doi:10.1096/fj.202300433RR
Liu, Y., Chen, H., Wang, J., Zhou, W., Sun, R., and Xia, M. (2015). Association of serum retinoic acid with hepatic steatosis and liver injury in nonalcoholic fatty liver disease. Am. J. Clin. Nutr. 102 (1), 130–137. doi:10.3945/ajcn.114.105155
Lloyd-Jones, L. R., Holloway, A., McRae, A., Yang, J., Small, K., Zhao, J., et al. (2017). The genetic architecture of gene expression in peripheral blood. Am. J. Hum. Genet. 100 (2), 371. doi:10.1016/j.ajhg.2017.01.026
Love, M. I., Huber, W., and Anders, S. (2014). Moderated estimation of fold change and dispersion for RNA-seq data with DESeq2. Genome Biol. 15 (12), 550. doi:10.1186/s13059-014-0550-8
Ma, X., Bai, Y., Liu, K., Han, Y., Zhang, J., Liu, Y., et al. (2022). Ursolic acid inhibits the cholesterol biosynthesis and alleviates high fat diet-induced hypercholesterolemia via irreversible inhibition of HMGCS1 in vivo. Phytomedicine 103, 154233. doi:10.1016/j.phymed.2022.154233
Marra, F., and Svegliati-Baroni, G. (2018). Lipotoxicity and the gut-liver axis in NASH pathogenesis. J. Hepatology 68 (2), 280–295. doi:10.1016/j.jhep.2017.11.014
Mohamed, R. H., Tarek, M., Hamam, G. G., and Ezzat, S. F. (2019). Zoledronic acid prevents the hepatic changes associated with high fat diet in rats; the potential role of mevalonic acid pathway in nonalcoholic steatohepatitis. Eur. J. Pharmacol. 858, 172469. doi:10.1016/j.ejphar.2019.172469
Musa-Veloso, K., Venditti, C., Lee, H. Y., Darch, M., Floyd, S., West, S., et al. (2018). Systematic review and meta-analysis of controlled intervention studies on the effectiveness of long-chain omega-3 fatty acids in patients with nonalcoholic fatty liver disease. Nutr. Rev. 76 (8), 581–602. doi:10.1093/nutrit/nuy022
Okada, L., Oliveira, C. P., Stefano, J. T., Nogueira, M. A., Silva, I., Cordeiro, F. B., et al. (2018). Omega-3 PUFA modulate lipogenesis, ER stress, and mitochondrial dysfunction markers in NASH - proteomic and lipidomic insight. Clin. Nutr. 37 (5), 1474–1484. doi:10.1016/j.clnu.2017.08.031
Papazyan, R., Sun, Z., Kim, Y. H., Titchenell, P. M., Hill, D. A., Lu, W., et al. (2016). Physiological suppression of lipotoxic liver damage by complementary actions of HDAC3 and SCAP/SREBP. Cell Metab. 24 (6), 863–874. doi:10.1016/j.cmet.2016.10.012
Qin, Q., Zhao, L., Ren, A., Li, W., Ma, R., Peng, Q., et al. (2023). Systemic lupus erythematosus is causally associated with hypothyroidism, but not hyperthyroidism: a Mendelian randomization study. Front. Immunol. 14, 1125415. doi:10.3389/fimmu.2023.1125415
Rau, M., Schilling, A. K., Meertens, J., Hering, I., Weiss, J., Jurowich, C., et al. (2016). Progression from nonalcoholic fatty liver to nonalcoholic steatohepatitis is marked by a higher frequency of Th17 cells in the liver and an increased Th17/resting regulatory T cell ratio in peripheral blood and in the liver. J. Immunol. 196 (1), 97–105. doi:10.4049/jimmunol.1501175
Rinella, M. E., Lazarus, J. V., Ratziu, V., Francque, S. M., Sanyal, A. J., Kanwal, F., et al. (2024). A multisociety Delphi consensus statement on new fatty liver disease nomenclature. Ann. hepatology 29 (1), 101133. doi:10.1016/j.aohep.2023.101133
Rinella, M. E., Neuschwander-Tetri, B. A., Siddiqui, M. S., Abdelmalek, M. F., Caldwell, S., Barb, D., et al. (2023). AASLD Practice Guidance on the clinical assessment and management of nonalcoholic fatty liver disease. Hepatology 77 (5), 1797–1835. doi:10.1097/HEP.0000000000000323
Robin, X., Turck, N., Hainard, A., Tiberti, N., Lisacek, F., Sanchez, J. C., et al. (2011). pROC: an open-source package for R and S+ to analyze and compare ROC curves. BMC Bioinforma. 12, 77. doi:10.1186/1471-2105-12-77
Rosqvist, F., Kullberg, J., Ståhlman, M., Cedernaes, J., Heurling, K., Johansson, H. E., et al. (2019). Overeating saturated fat promotes fatty liver and ceramides compared with polyunsaturated fat: a randomized trial. J. Clin. Endocrinol. metabolism 104 (12), 6207–6219. doi:10.1210/jc.2019-00160
Seshacharyulu, P., Rachagani, S., Muniyan, S., Siddiqui, J. A., Cruz, E., Sharma, S., et al. (2019). FDPS cooperates with PTEN loss to promote prostate cancer progression through modulation of small GTPases/AKT axis. Oncogene 38 (26), 5265–5280. doi:10.1038/s41388-019-0791-9
Shearer, A. M., Wang, Y., Fletcher, E. K., Rana, R., Michael, E. S., Nguyen, N., et al. (2022). PAR2 promotes impaired glucose uptake and insulin resistance in NAFLD through GLUT2 and Akt interference. Hepatology 76 (6), 1778–1793. doi:10.1002/hep.32589
Stabile, H., Fionda, C., Gismondi, A., and Santoni, A. (2017). Role of distinct natural killer cell subsets in anticancer response. Front. Immunol. 8, 293. doi:10.3389/fimmu.2017.00293
Tang, L., Wei, R., Chen, R., Fan, G., Zhou, J., Qi, Z., et al. (2022). Establishment and validation of a cholesterol metabolism-related prognostic signature for hepatocellular carcinoma. Comput. Struct. Biotechnol. J. 20, 4402–4414. doi:10.1016/j.csbj.2022.07.030
Van Rooyen, D. M., Larter, C. Z., Haigh, W. G., Yeh, M. M., Ioannou, G., Kuver, R., et al. (2011). Hepatic free cholesterol accumulates in obese, diabetic mice and causes nonalcoholic steatohepatitis. Gastroenterology 141 (4), 1393–1403. doi:10.1053/j.gastro.2011.06.040
Wang, X., Zhang, X., Chen, Y., Zhao, C., Zhou, W., Chen, W., et al. (2021). Cardiac-specific deletion of FDPS induces cardiac remodeling and dysfunction by enhancing the activity of small GTP-binding proteins. J. Pathology 255 (4), 438–450. doi:10.1002/path.5789
Wu, T., Hu, E., Xu, S., Chen, M., Guo, P., Dai, Z., et al. (2021). clusterProfiler 4.0: a universal enrichment tool for interpreting omics data. Innov. Camb. (Mass) 2 (3), 100141. doi:10.1016/j.xinn.2021.100141
Xu, S., Li, X., Zhang, S., Qi, C., Zhang, Z., Ma, R., et al. (2023). Oxidative stress gene expression, DNA methylation, and gut microbiota interaction trigger Crohn's disease: a multi-omics Mendelian randomization study. BMC Med. 21 (1), 179. doi:10.1186/s12916-023-02878-8
Yang, H., Yang, T., Heng, C., Zhou, Y., Jiang, Z., Qian, X., et al. (2019). Quercetin improves nonalcoholic fatty liver by ameliorating inflammation, oxidative stress, and lipid metabolism in db/db mice. Phytother. Res. 33 (12), 3140–3152. doi:10.1002/ptr.6486
Younossi, Z., Koenig, A., Abdelatif, D., Fazel, Y., Henry, L., and Wymer, M. (2016). Global epidemiology of nonalcoholic fatty liver disease-Meta-analytic assessment of prevalence, incidence, and outcomes. Hepatol. Baltim. Md 64 (1), 73–84. doi:10.1002/hep.28431
Younossi, Z. M., Golabi, P., Paik, J. M., Henry, A., Van Dongen, C., and Henry, L. (2023). The global epidemiology of nonalcoholic fatty liver disease (NAFLD) and nonalcoholic steatohepatitis (NASH): a systematic review. Hepatology 77 (4), 1335–1347. doi:10.1097/HEP.0000000000000004
Yu, G., Wang, L. G., Han, Y., and He, Q. Y. (2012). clusterProfiler: an R package for comparing biological themes among gene clusters. Omics a J. Integr. Biol. 16 (5), 284–287. doi:10.1089/omi.2011.0118
Zhang, K., Shen, F., Lei, W., Han, Y., Ma, X., Lu, Y., et al. (2023). Ligustilide covalently binds to Cys129 of HMGCS1 to ameliorate dyslipidemia. Biomed. and Pharmacother. = Biomedecine and Pharmacother. 166, 115323. doi:10.1016/j.biopha.2023.115323
Zhang, X., Coker, O. O., Chu, E. S., Fu, K., Lau, H. C. H., Wang, Y. X., et al. (2021). Dietary cholesterol drives fatty liver-associated liver cancer by modulating gut microbiota and metabolites. Gut 70 (4), 761–774. doi:10.1136/gutjnl-2019-319664
Keywords: NAFLD, cholesterol metabolism, prognosis, bioinformatic analysis, Mendelian randomization
Citation: Chen J, Rao H and Zheng X (2024) Identification of novel targets associated with cholesterol metabolism in nonalcoholic fatty liver disease: a comprehensive study using Mendelian randomization combined with transcriptome analysis. Front. Genet. 15:1464865. doi: 10.3389/fgene.2024.1464865
Received: 18 July 2024; Accepted: 06 September 2024;
Published: 18 September 2024.
Edited by:
Sheng Liu, Indiana University Bloomington, United StatesReviewed by:
Aaron Balasingam Koenig, INOVA Health System, United StatesLi Tian, Georgia State University, United States
Zhuangzhuang Geng, Children’s Hospital of Philadelphia, United States
Copyright © 2024 Chen, Rao and Zheng. This is an open-access article distributed under the terms of the Creative Commons Attribution License (CC BY). The use, distribution or reproduction in other forums is permitted, provided the original author(s) and the copyright owner(s) are credited and that the original publication in this journal is cited, in accordance with accepted academic practice. No use, distribution or reproduction is permitted which does not comply with these terms.
*Correspondence: Xiaoling Zheng, eGlhb2xpbmd6aGVuZzc4OUAxNjMuY29t
†These authors have contributed equally to this work and share first authorship
 Juan Chen
 Huajing Rao
 Xiaoling Zheng