
94% of researchers rate our articles as excellent or good
Learn more about the work of our research integrity team to safeguard the quality of each article we publish.
Find out more
ORIGINAL RESEARCH article
Front. Genet., 25 July 2022
Sec. Evolutionary and Genomic Microbiology
Volume 13 - 2022 | https://doi.org/10.3389/fgene.2022.931017
This article is part of the Research TopicLinkage Between Membrane Composition, Cellular Functions and Membrane- Mediated StressView all 5 articles
 Gayatri Jagirdar1Matthias Elsner2
 Christian Scharf3
 Stefan Simm4
 Katrin Borucki5Daniela Peter5
 Michael Lalk6
 Karen Methling6
 Michael Linnebacher7Mathias Krohn7Carmen Wolke1
 Uwe Lendeckel1*
Tafazzin—an acyltransferase—is involved in cardiolipin (CL) remodeling. CL is associated with mitochondrial function, structure and more recently with cell proliferation. Various tafazzin isoforms exist in humans. The role of these isoforms in cardiolipin remodeling is unknown. Aim of this study was to investigate if specific isoforms like Δ5 can restore the wild type phenotype with respect to CL composition, cellular proliferation and gene expression profile. In addition, we aimed to determine the molecular mechanism by which tafazzin can modulate gene expression by applying promoter analysis and (Ingenuity Pathway Analyis) IPA to genes regulated by TAZ-deficiency. Expression of Δ5 and rat full length TAZ in C6-TAZ- cells could fully restore CL composition and—as proven for Δ5—this is naturally associated with restoration of mitochondrial respiration. A similar restoration of CL-composition could not be observed after re-expression of an enzymatically dead full-length rat TAZ (H69L; TAZMut). Re-expression of only rat full length TAZ could restore proliferation rate. Surprisingly, the Δ5 variant failed to restore wild-type proliferation. Further, as expected, re-expression of the TAZMut variant completely failed to reverse the gene expression changes, whereas re-expression of the TAZ-FL variant largely did so and the Δ5 variant to somewhat less extent. Very likely TAZ-deficiency provokes substantial long-lasting changes in cellular lipid metabolism which contribute to changes in proliferation and gene expression, and are not or only very slowly reversible.
The mitochondrial phospholipid cardiolipin (CL) has been linked to mitochondrial and cellular functions and to mitochondrial energy metabolism in particular. Accumulating evidence points to the existence of an association of the composition of CL with cellular proliferation (Schild et al., 2012; Murke et al., 2016; Ohlig et al., 2018; Gurtler et al., 2019). Although such a correlation could be demonstrated for several cell types, evidence for a causal relationship remains obscure.
CL composition shows a high degree of tissue and organ specificity (Schlame and Greenberg, 2017) and has been linked with a broad variety of cellular characteristics and, in particular, with mitochondrial structure and properties like mitochondrial membrane fluidity and cellular elasticity (Gurtler et al., 2019), oxidative phosphorylation (Raja and Greenberg, 2014), electron flow along respiratory chain complexes and electron leakage (Pfeiffer et al., 2003), regulation of the intrinsic pathway of apoptosis (McMillin and Dowhan, 2002), and mitochondrial fission and fusion (Frohman, 2015).
Recently, substantial alterations in CL composition could be forced by either supplementation of fatty acids or knock-out of the phospholipid remodeling enzyme, tafazzin (TAZ), respectively (Schild et al., 2020). Most notably, under the conditions applied, the effects on proliferation of C6 glioma cells appeared to be independent of CL composition (Gurtler et al., 2019).
The composition of molecular lipid species including CL is subject of change and constantly requires adaptation in response to physiological stimuli or pathophysiological conditions to meet metabolic and other cellular requirements (Kimura et al., 2016). The availability of fatty acids, whether free or bound in other cellular phospholipids, for CL de novo biosynthesis has been recognized as the most important factor for establishing CL composition in recent years (Oemer et al., 2020; Oemer et al., 2021; Oemer et al., 2022).
Tafazzin is an acyltransferase with key function in CL remodeling. Indeed, it is the most efficient remodeling system for CL (Ye et al., 2016). It mediates the exchange of fatty acids between cellular phospholipids and mono-lyso-phospholipids that may result from oxidative stress (Ye et al., 2016). However, it is not known if remodeling is the only function of tafazzin (Schlame, 2013). The tafazzin gene is mutated in patients with Barth syndrome, a genetic disorder associated with changes in CL composition and in the mono-lyso-CL/CL ratio, cardiomyopathy, skeletal muscle weakness, impaired mitochondrial structure and function, and neutropenia (Clarke et al., 2013). A tafazzin knock-out mouse model developed a heart and muscle phenotype similar to what is typically observed in Barth patients (Wang et al., 2020). Furthermore, knock-down and knock-out of tafazzin in rat C6 provoked similar changes in CL composition, mitochondrial respiration (oxidative phosphorylation, OXPHOS), mitochondrial morphology and ultrastructure, and is associated with decreased cell proliferation (Murke et al., 2016; Ohlig et al., 2018; Gurtler et al., 2019; Schild et al., 2020) as observed in Barth patients. Knock-down of tafazzin has been shown to affect cell cycle progression in neonatal ventricular fibroblasts (He et al., 2013). This mechanism very likely contributes to myopathy in Barth syndrome (Clarke et al., 2013). Recently, the overexpression or knock-down of TAZ, respectively, has been associated with alterations in proliferation of cervical cancer cells (Chen et al., 2017).
In addition to the full length human tafazzin gene comprising 11 exons four alternatively spliced transcripts variants are known to be expressed (Vaz et al., 2003). Until now, it is not established if these variants have redundant functionality in CL remodelling or contain additional differing functionalities. At least human full length (FL) tafazzin and the TAZ principle variant lacking exon 5 (Δ5) exhibit transacylase activity and, thus, have been shown to restore cardiolipin composition, mitochondrial respiration in tafazzin-deficient D. melanogaster (Xu et al., 2009).
Tafazzin-deficient C6 cells, C6-TAZ, have been extensively characterized before (Ohlig et al., 2018; Gürtler et al., 2019; Schild et al., 2020) with respect to CL composition, mitochondrial respiration, structure and membrane fluidity, and cell proliferation. Extending these findings, the results of this study additionally show massive changes in gene expression that occur in C6 cells in response to knock-out of tafazzin. Differential gene expression was verified and regulated genes were subjected to promoter and IPA analyses to identify possible underlying mechanisms. To what extent the different tafazzin isoforms are capable of reversing the effects of tafazzin knock-out in rat C6 glioma cells is not known and should be investigated in the present study. To this end, we (re-)expressed in tafazzin-deficient C6 cells the originally contained and deleted in C6 cells rat full length tafazzin, the human isoform lacking exon 5 (Δ5) and an enzymatically dead mutant (H69L) full length tafazzin and subsequently studied their impact on CL-composition, cell proliferation, and differential gene expression.
Rat C6 glioma cells (hereafter referred to as C6) were obtained from DSMZ (Braunschweig, Germany). Tafazzin (TAZ) was knocked out in C6 cells (C6 TAZ) using the CRISPR-Cas9 system as previously described (Gürtler et al., 2019).
Human tafazzin gene lacking exon 5 (Δ5) was kindly provided by Prof. Michael Schlame, NYU Medical center. The pCDNA 3.1 vector was linearized with restriction enzyme BglII (New England Biolab, United States) and the TAZ-gene containing fragment (6,217 bp) was used to transfect C6 and C6 TAZ cells using lipofectamine 2000 (Thermo Fisher Scientific, Waltham, United States).
cDNA encoding for rat wild-type tafazzin (accession #NM_001025748) and an enzymatically inactive variant of rat full-length tafazzin (H69L) were synthesized and cloned into XhoI/XbaI sites of the lentiviral transfer plasmid pLVX-IRES-Neo (Takara Bio Europe, Saint-Germain-en-Laye, France) as part of the gene synthesis service of BioCat (Heidelberg, Germany). Plasmid was cut using restriction enzymes NheI and EcoNI (New England Biolab, United States). Later, the fragment of plasmid with tafazzin gene (5,365 bp) was transfected in C6 and C6 TAZ cells using lipofectamine 2000. Stably transfected cells were selected with 1 mg/ml G 418 Geneticin (PAN Biotech, GmbH, Aidenbach, Germany) over a period of 14 days. All cells were maintained in DMEM medium supplemented with 3% fetal calf serum (FCS), 1% penicillin and streptomycin (cell culture medium) at 37°C with 5% CO2, and passaged every 2–3 days.
Extraction of lipids and CL analysis was performed as recently described (Ohlig et al., 2018; Gurtler et al., 2019). Similar to our previous study, we analysed (C18:2)3-CL as the representative of mono-lyso-CL (MLCL) and (C18:2)3-hydroxy-linolyl CL as indication for CL oxidation.
Cell lysis and extraction of lipid mediators was performed as previously described (Schultz et al., 2020). In brief, internal standards were added and the cells were lysed using FastPrepTM lysing matrix D and a FastPrepTM homogenizer. Lysing cycle was repeated after a washing step. Combined supernatants were used for an alkaline hydrolysis followed by a solid-phase extraction.
Samples were measured with an Agilent® HPLC system (1200), coupled to an Agilent® 6460 Triple quadrupole mass spectrometer with a Jetstream ionization source using a dynamic multiple reaction monitoring (dMRM) method. Chromatographic and MS parameters are referred to in (Schultz et al., 2020). Data analysis was performed with Agilent Mass Hunter Qualitative and Quantitative Analysis software (version B.08.00 for both). For all detected oxylipins, a relative quantification was done by normalizing the area of the metabolite signal to the area of the signal of the internal standard compound (relative amount). 12-HETE-d8 was the internal standard for HETEs, EETs, HEPEs and HDHAs, and 13-HODE-d4 for HODEs, and 13-HOTrE. All relative amounts of the oxylipins were normalized to the cell number (106 cells per sample).
Transcriptome analyses were performed using the Affymetrix GeneTitan Multi-Channel platform with Clarion S rat microarray and GeneChip WT Plus kit (Affymetrix Inc., Santa Clara, VA, United States). Expression profiling was done with pooled RNA from three independent biological replicates each of wild type C6 and tafazzin-deficient C6-TAZ cells. Total cellular RNA was isolated according to manufacturer’s protocol (Analytikjena RNA isolation kit, Jena, Germany) 1 µg RNA input was taken for gene expression analysis. Data were analysed as described (Bukowska et al., 2012). Significant differences in gene expression were identified using the following cut-off criteria: one-way analysis of variance with subsequent Benjamini and Hochberg false discovery rate multiple-testing correction on pair-wise comparisons, (ANOVA, p 0.05), signal correction statistics (ratio builder, p < 0.05), and fold-change 1.5-fold (for a complete list of significantly regulated genes, see Online Supplementary Table S1).
For the TF binding site analysis we used the tool Ciiider (Gearing et al., 2019) to identify common TF binding sites in the detected up- and/or down-regulated genes from the Microarray expression analysis. Furthermore, we used the tool to search for common TF binding profiles in the specific Cholesterol pathway as well as for PPARG solely. Therefore, we downloaded the reference fasta and gtf files of Rattus norvegicus from the Ensembl database (Yates et al., 2020) and the JASPAR2020_CORE_vertebrates database (Castro-Mondragon et al., 2022) of TF binding profiles. For the analysis we used 1,500 nt cut-off for upstream and 500 nt cut-off for downstream sequences. The deficit cut-off was set to 0.15 for all analyses. To exclude unspecific TF binding profiles in the up- and downregulated gene lists we used a background gene list consisting of the non-affected genes in the microarray expression analysis (foldchange between 1 and +1). The performed enrichment analysis used a coverage p-value below 0.05 and a site p-value of 1.0 (for a complete list of significantly regulated genes, see Online Supplementary Table S1).
In-silico-pathway- and functional analysis of differentially expressed genes was carried out using the commercial systems biology-oriented package Ingenuity Pathways Analysis (QIAGEN Inc., https://digitalinsights.qiagen.com/IPA) using the annotation details provided by Couture et al. (Couture et al., 2009) with their corresponding gene identifiers and expression values.
PCR Reverse transcription quantitative PCR (RT-qPCR) was applied to validate selected candidate genes that were identified as differently expressed in the microarray analyses C6 vs. C6-TAZ). Reactions were performed as previously described (Chilukoti et al., 2013; Chilukoti et al., 2015). Quantities of RPL13a mRNA were used to normalize cDNA contents. The specific primers applied are listed in Table 1.
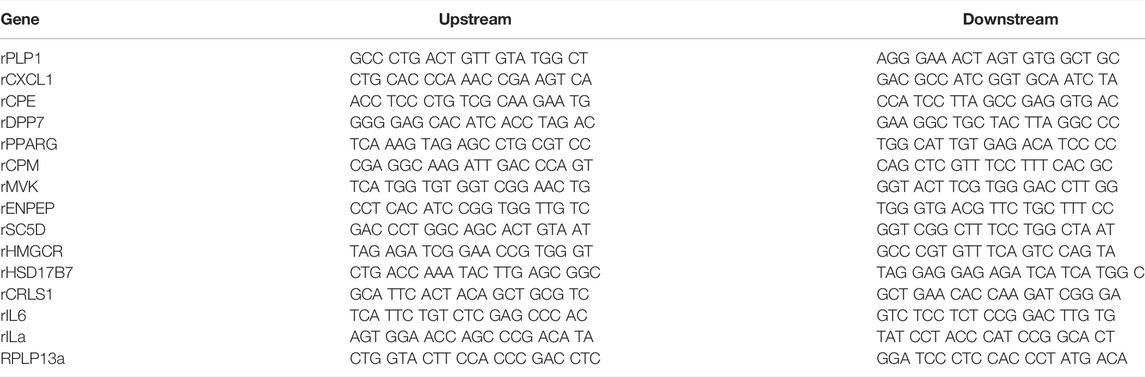
TABLE 1. List of primers used in the study.
C6 (w/o Δ5 or FL or Mut) and C6 TAZ (w/o Δ5 or FL or Mut) cells were lysed in RIPA lysis buffer (50 mM Tris HCl pH 7.5, 5 mM EDTA, 100 mM NaCl, 0.5% Triton, 10% glycerol, 10 mM K2HPO4 0.5% NP-40) 0.5% pre-warmed DOC (deoxycholic acid), 1 mM NaVO3, 20 mM NaF, 0.1 mM PMSF, 20 mM glycerol-2-phosphate, 0.5% Tween 20, and 0.5% SDS) supplemented with a 1x protease-inhibitor cocktail (Roche Diagnostics GmbH, Mannheim, Germany) on ice for 45–60 min. After centrifugation for 30 min at 17,000 g at 4°C, the protein concentration in the lysates was determined by Bradford method. 40 μg of protein lysate was then separated by SDS-PAGE and transferred to a nitrocellulose membrane, followed by blocking with 1x non-protein solution, Roti (Carl Roth GmbH Karlsruhe, Germany) for 1 h, at RT. After washing three times with Tris-buffered saline with 0.1% Tween 20 (TBST), the membrane was incubated with primary mouse anti-tafazzin antibody (Santa Cruz Biotechnology, 1:1000 in TBST, 5% BSA, and 0.03% NaN3) at 4°C overnight, followed by secondary anti-mouse antibody conjugated with horseradish peroxidase (Cell Signaling technology, 1: 10,000 in non-protein blocking solution, 1 h, 20°C). RPLP0 was used as a loading control (1:2000 in TBST, 5% BSA at 4°C overnight; Lifespan Biosciences) conjugated with horse radish peroxidase anti rabbit secondary antibody (1:10000 in1x non-protein solution, 1 h, RT; Cell signalling). The chemiluminescence signal was detected by West Dura substrate (Pierce, Rockford, United States).
Proliferation of cells was performed by DAPI staining as described by (Ligasova and Koberna, 2019). Briefly, 800 C6 (w/o Δ5 or FL or Mut) and 800 C6 TAZ (w/o Δ5 or FL or Mut) cells were seeded per well of a 96 well plate. After incubation at 37°C and 5% CO2 for 96 h, the medium was aspirated, cells were fixed with 70% ethanol for 10 min at RT, and air-dried for 30 min. Cells were then incubated with 100 µl of 7.5 μM DAPI (Roth, Karlsruhe, Germany) in 150 mm NaCl and 20 mm Tris HCl pH 7.0 with constant shaking at 300 rpm for 30 min. Afterwards, cells were washed three times with 200 μl of washing buffer (2 mM CuSO4, 0.5 M NaCl, 20 mm citrate buffer pH 5.0, and 0.2% Tween 20) for 2 min each followed by rinsing with 100 μl of stabilization buffer (20 mm Tris HCl and 150 mm NaCl) to maintain the pH at 7.0, approximately. The stabilization buffer was then replaced by 120 μl of elution buffer (20 mm Tris HCl pH 7.0 and 2% SDS) and the plate was incubated at RT with constant shaking (300 rpm) for 15 min. Finally, 100 μl of the elution lysate were transferred to a clean black 96 well plate (Greiner Bio-one GmbH, Germany), and fluorescence intensity (RFI) was measured at 470/570 nm wavelength using a plate reader (Infinite F200 Microplate reader, Tecan).
Senescent cells were determined using Senescence β-galactosidase staining kit according to manufacturer protocol (Cell signalling Technology). Briefly, C6 and C6 TAZ cells were seeded in a 6 well plate at a density of 0.3 and 0.6 M cells. After incubation at 37°C and 5% CO2 the growth media was aspirated and rinsed one time with 1× PBS. Later, cells were fixed with 1 ml of 1× fixative solution (dilute 10× fixative solution in distilled water). After fixation rinse again 2 times with 1× PBS. Further, stain the cells with 1 ml of β galactosidase staining solution pH 6.0 (930 µl of 1× staining solution, 10 µl of 100 × solution A, 10 µl of 100 × solution B, 10 µl 20 mg/ml X-gal stock solution) and incubate overnight at 37°C. Finally, after 24 h β-gal positive cells were seen under the microscope.
The cholesterol content of the different C6 cell populations has been determined by means of the Cholesterol/Cholesteryl Ester Assay-Kit (ab102515, abcam) exactly following the recommended protocol.
Statistical analysis was performed using Graph Pad Prism 8 (GraphPad Inc., La Jolla United States). Data is shown as box plot with median, quartile and interquartile range. Comparison of two groups was performed using unpaired t test. p < 0.05 is considered to show significant changes.
It is well established that tafazzin-deficiency alters cardiolipin composition in patients and various experimental models (Joshi et al., 2009; Lu et al., 2016; Pu, 2022). This applies also to C6 rat glioma cells where the knock-out of tafazzin has been shown previously to alter CL composition and, consequently, to compromise mitochondrial respiration, and cellular proliferation (Murke et al., 2016; Ohlig et al., 2018; Gurtler et al., 2019; Schild et al., 2020). Alterations of the cellular lipid profile that arise from tafazzin-deficiency are not limited to the cardiolipin composition, but also relate to fatty acids, for example, be they free or bound, e.g., to other phospholipids. We show here, that the knock-out of tafazzin in C6 cells is associated with the dysregulation of another class of cellular lipids, namely the oxylipins. In C6-TAZ cells we measured higher amounts of 15-HETE [C6-TAZ: 1.52 (1.40; 1.88) vs. C6: 1.00 (0.96; 1.28); p = 0.0076], 5-HETE [C6-TAZ: 1.28 (1.18; 1.61) vs. C6: 1.00 (0.79; 1.04); p = 0.0175], 8,9 EET [C6-TAZ: 2,14 (1,80; 2.35) vs. C6: 1.00 (0.85; 1.22); p = 0.0006], 14,15 EET [C6-TAZ: 1.92 (1.60; 1.92) vs. C6: 1.00 (0.99; 1.23); p = 0.0023], and 5,6 EET [C6-TAZ: 2.63 (1.98; 2.96) vs. C6: 1.00 (0.84; 1.24); p = 0.0012] (Figure 1).
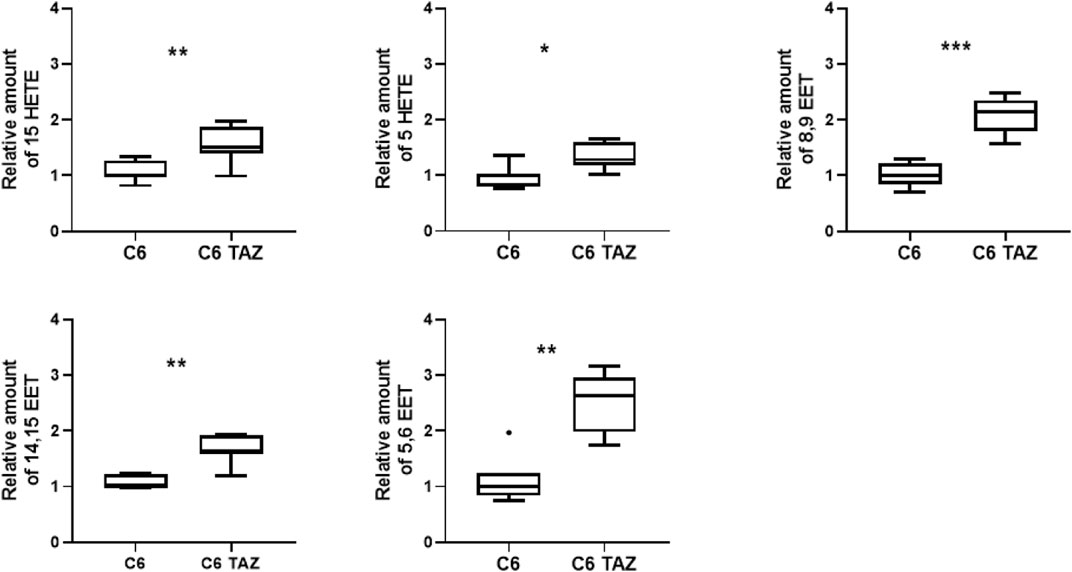
FIGURE 1. Tafazzin deficiency alters oxylipin levels in C6 cells: Effect of tafazzin knockout on cellular lipids, oxylipinswas determined by HPLC-MS/MS. The Data analysis was performed with Agilent Mass Hunter Qualitative and Quantitative Analysis software (version B.08.00 for both). For all detected oxylipins, a relative quantification was done by normalizing the area of the metabolite signal to the area of the signal of the internal standard compound (relative amount). Data is represented as median,quartile and interquartile range for n = 4.
In this study, the unexpected finding is reported that TAZ deficiency also provokes substantial alterations in gene expression in rat glioma C6 cells. By applying RNA microarray analysis, gene expression of wild-type and tafazzin-deficient C6 cells was compared.
Microarray-based mRNA profiling revealed that in response to the knock-out of tafazzin, there are substantial (≥2fold) changes in transcript levels in rat C6 glioma cells (C6-TAZ vs. C6: 542 genes up-regulated, 484 down-regulated; a total of 1,026 genes differentially expressed). A ≥4fold change in expression levels in C6-TAZ cells could be observed for 73 genes compared to C6: 42 genes were up-regulated, 31 genes down-regulated. In Table 2 the top 15 up- and down-regulated genes are summarized. A complete list of the microarray results is given in Online Supplementary Table S1.
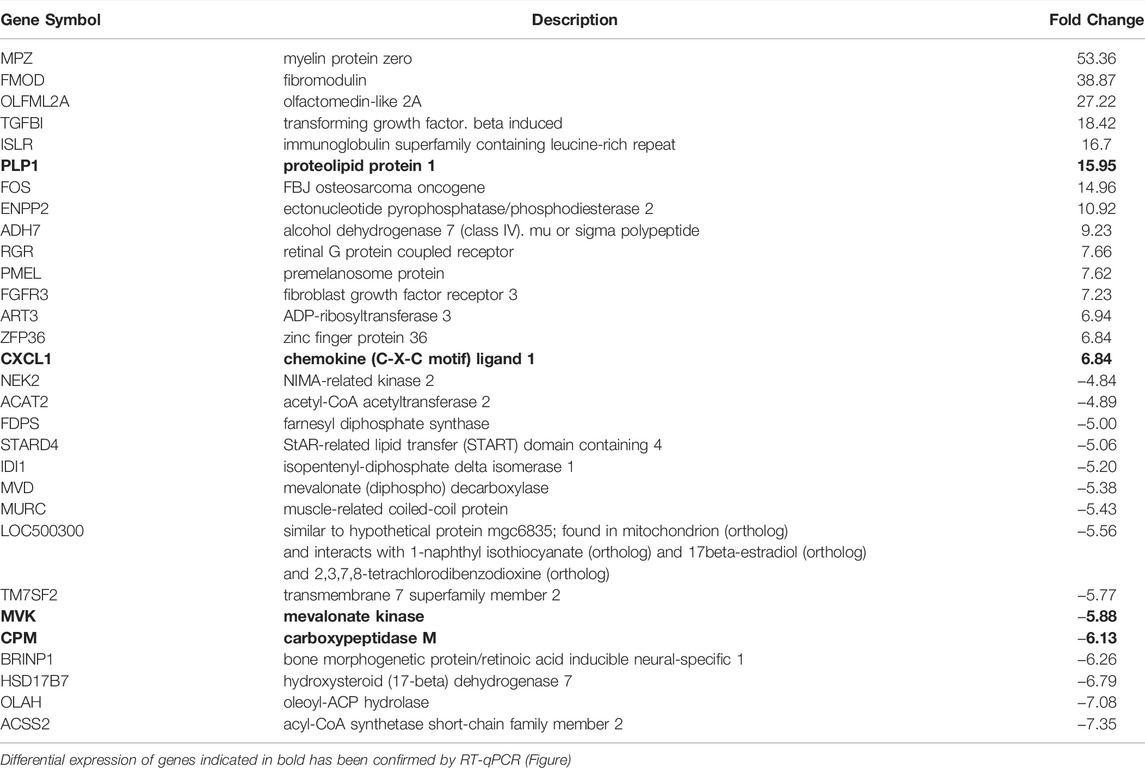
TABLE 2. Differentially expressed genes in taffazin-deficient C6 rat glioma cells (15 top up-regulated and 15 Top down-regulated genes)
Microarray-based gene expression data were subsequently confirmed by RT-qPCR for selected targets. As shown in Figure 2, validation experiments fully confirmed the differential gene expression of TAZ-regulated genes in C6 glioma cells. In detail, tafazzin-deficient C6-TAZ cells contain higher amounts of the mRNAs for PLP1 [2.44 (2.00; 3.81)] vs. [1.00 (0.66; 1.20); p = 0.0006], CXCL1 [1.97 (1.50; 3.00)] vs. [1.00 (0.72; 1.18); p = 0.0012], which were among the 15 up-regulated genes in the microarray analysis (Figure 2). In addition, higher expression levels of further selected genes that showed ≥2-fold expression changes in the microarray analysis could be verified by RT-qPCR: mRNA amounts for CPE [5.55 (2.67; 8.54)] vs. [1.00 (0.87; 1.39); p = 0.0002)], DPP7 [1.44 (1.16; 1.73) vs. [1.00 (0.79; 1.26); p = 0.0281], and PPARG [69.74 (9.21; 162.5)] vs. [1.00 (0.61; 1.39); p = 0.0019] were increased in tafazzin-deficient C6-TAZ cells. Results of transcriptome analysis identified CPM and MVK among the top-regulated genes showing decreased expression in TAZ-deficient cells. This finding could be validated by RT-qPCR for the top-regulated genes, CPM [0.065 (0.026; 0.162)] vs. [1.00 (0.84; 1.15); p = 0.0002] and MVK [0.45 (0.36; 0.50)] vs. [1.00 (0.89; 1.12); p = 0.0002], as well as for selected examples of genes the expression of which showed a ≥2-fold decrease: ENPEP [0.24 (0.095; 0.50)] vs. [1.00 (0.61; 1.10); p = 0.0121], SC5D [0.57 (0.31; 0.81)] vs. [1.00 (0.83; 1.19); p = 0.0104], HMGCR [0.54 (0.37; 0.67)] vs. [1.00 (0.88; 1.11); p = 0.0006], HSD17B7 [0.24 (0.09; 0.28)] vs. [1.00 (0.93; 1.16); p = 0.0002], and CRLS1 [0.72 (0.69; 0.90)] vs. [1.00 (0.92; 1.11); p = 0.0281] (Figure 2).
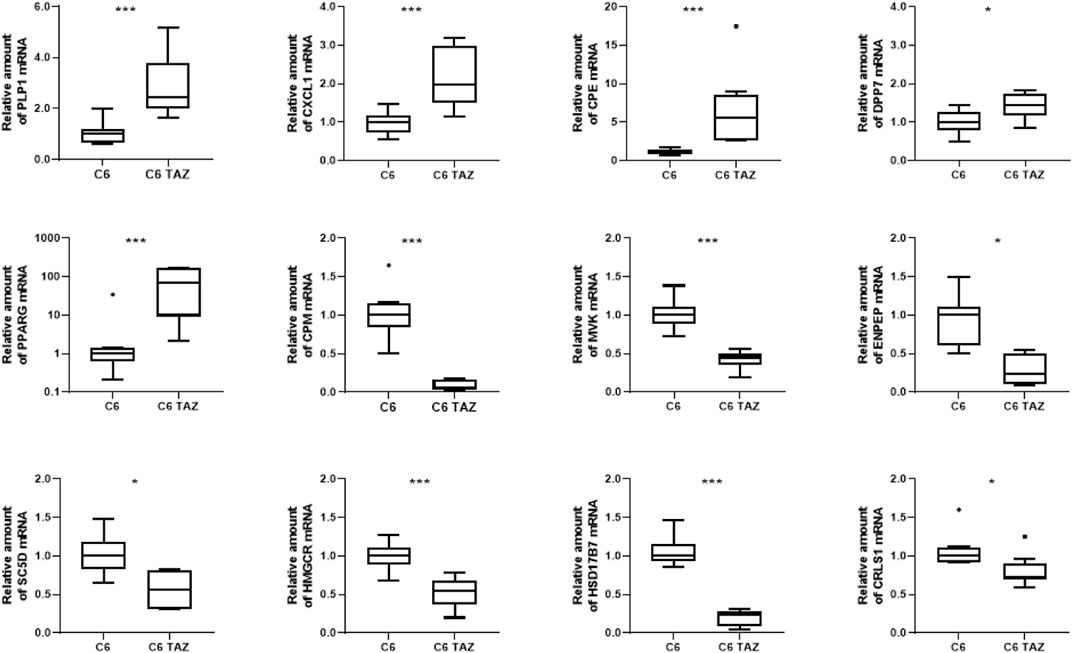
FIGURE 2. Tafazzin deficiency alters gene expression in C6 cells: Quantification levels of indicated genes in C6 and C6 TAZ cells was preformed and the amount of mRNA was determined by using RT-qPCR and normalized to RPL13a. Data is given as boxplot with median, quartile, and interquartile range (*p < 0.05; **p < 0.01; ***p < 0.001). Outliers are indicated using Tukey method. n = 8.
Oxylipins are considered as ligands for PPARs (Cowart et al., 2002; Flores et al., 2005; Liu et al., 2005; Oh et al., 2009; Korbecki et al., 2019; Basilotta et al., 2022) and, thus, it was hypothesized that elevated concentrations of distinct lipoxins observed after knock-out of tafazzin contribute to TAZ-dependent changes in gene expression in C6 cells. Therefore, C6 cells were exposed to 8,9 EET, which showed the greatest increase in concentration under tafazzin knock-out in C6 TAZ cells, at 3 µM concentration for 24 h and then expression of selected genes was determined by RT-qPCR. Consistent with both the results of the transcriptome analysis and its verification, increased concentrations of 8,9 EET were associated with decreased expression of CPM [0.71 (0.53; 0.83) vs. 1.00 (0.87; 1.10); p = 0.0286] but elevated mRNA amounts of DPP7 [1.56 (1.20; 1.59) vs. 1.00 (0.91; 1.02); p = 0.0286] (Figure 3). However, 8,9 EET at this concentration also reduced the mRNA amounts of CPE [0.72 (0.63; 0.81) vs. 1.00 (0.86; 1.15); p = 0.0286], which was found induced by TAZ-knock-out and the concomitant increase in 8,9 EET levels (Figure 3). Expression levels of PLP1, CXCL1, PPARG, MVK, SC5D, HMGCR, ENPEP, CRLS1, and HSD17B7 were not affected under the conditions applied.
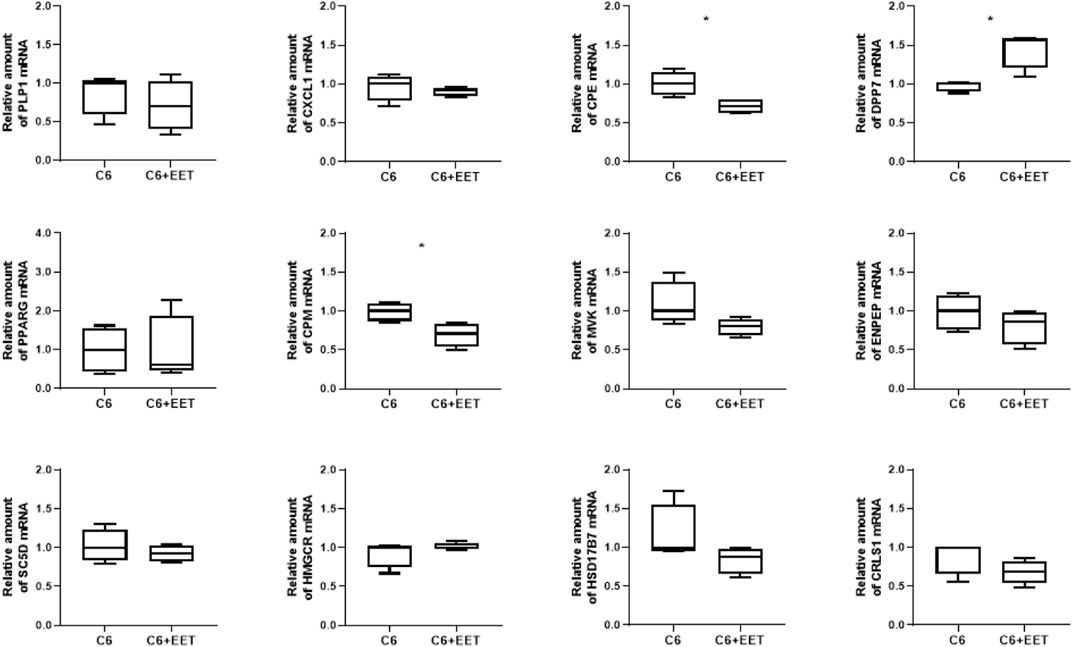
FIGURE 3. Oxylipins regulates TAZ dependent gene expression in C6 cells: Relative gene expression of C6 cells treated with ethanol (control) and C6 cells with 3 µM EET incubated at 37°C for 24 h. The amount of Mrna is determined by qpcr that is normalized to RPL13a. Data is represented as boxplot with median, quartile and interquartile range. Asterisks represent significant change.
Oxylipins, including HETEs and EETs, have been described as endogenous ligands of PPARs (Cowart et al., 2002; Flores et al., 2005; Liu et al., 2005; Oh et al., 2009; Korbecki et al., 2019; Basilotta et al., 2022). Furthermore, 12 out of the 12 genes that were differentially expressed in C6 TAZ cells as confirmed by RT-qPCR (shown in Figure 2), according to the eukaryotic promoter database (EPD) (Dreos et al., 2013) contained at least one putative PPARG or PPARA: RXRA binding site in their promoters (Online Supplementary Table S2; p < 0.001). Therefore, we hypothesized, that the dysregulation of lipid metabolism in general and that of oxylipins in particular, could contribute to TAZ-dependent changes in changes in gene expression via PPARs. Nevertheless, many different potential TF binding sites have been predicted for the datasets suggesting that no specific TF binding profile based solely on PPARs is present. From the microarray dataset we included 995 genes between a foldchange of 1 and −1 as background and used the 2-fold and 4-fold up- (2fold: 544 genes; 4fold: 41 genes) and down-regulated (2fold: 496 genes; 4fold: 31 genes) datasets as input for a TF binding site enrichment analysis. After removing not identified genes from the database by Ciiider we used our approach to compare the qualitative TF binding site occurrence with the quantitative TF binding site enrichment. For the 2-fold down- and upregulated list of genes the enriched TF binding profiles after removing the enriched background TF binding profiles were from HOXA5 and Pax2, which were occurring in ∼100% of all genes. Interestingly, in the 4-fold down- and upregulated list of genes only Pax2 was still enriched. In contrast, the binding profiles for FOS:JUN(var.2), Lhx4, NHLH1, RHOXF1, Sox5, TBX20 and ZNF354C were exclusively enriched in the 4fold downregulated list of genes (Supplementary Figure S1). For the upregulated genes the exclusively enriched TF binding profiles were FOS::JUN(var.2) (∼31% of sequences), JUN::JUNB (∼86% of sequences), LEF1 (∼9% of sequences), NR1H4 (∼51% of sequences) and SOHLH2 (∼37% of sequences) (Supplementary Figure S2).
Ingenuity pathway analysis (IPA) identified Diseases and Functions affected by tafazzin knock-out. As shown in Supplementary Table S3, the top-regulated Diseases and Functions include [Carbohydrate Metabolism, Lipid Metabolism, Molecular Transport] and [Lipid Metabolism, Small Molecule Biochemistry, Vitamin and Mineral Metabolism]. For all the identified pathways indicated above, selected members could be verified by RT-qPCR. This is shown e.g., for the cholesterol biosynthesis pathway (Supplementary Figure S3) where four out of the 20 differentially expressed genes (MVK, HSD17B7, SC5D, and HMGCR; Table 3) have been validated (Figure 2).
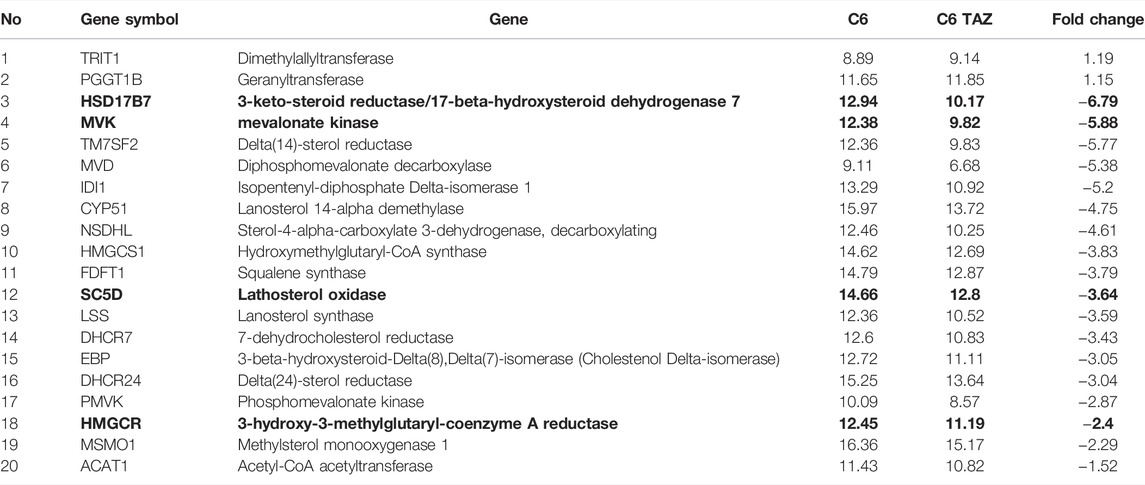
TABLE 3. Up- and down-regulated genes in cholesterol biosynthesis superpathway
In the end we performed a TF binding site profile detection analysis to find common regulatory elements for the top-regulated genes of the cholesterol pathway specifically. Based on the promoter panel (Supplementary Figure S4) of the 20 involved genes we found binding sites for FOS:JUN(var.2), LHX9, MLX, MNX1, NKX2-5, NR1H4, Pax2, SOX15, Stat2, and TBX19 (Supplementary Figure S2). Many of these TFs have more than one putative binding site per sequence. For this reason, we performed an enrichment analysis of the promoters against the background set of none-affected genes and came to the same involved TFs involved in the cholesterol pathway.
IPA Upstream Regulator Analysis was used to identify the upstream regulators that may be responsible for gene expression changes observed in the experimental dataset. Analysis was based on expected causal effects between upstream regulators and targets - the expected causal effects are derived from the literature compiled in the Ingenuity Knowledge Base (QIAGEN IPA; QIAGEN Inc.). As summarized in Figure 4 ACACA, HMGCR, ACSS2, FASN, ACSL1, 3 and 5 were identified as targets with a decreased gene expression compared to the control. These genes known to be inhibited by the following regulators: NR1H4, PTEN, PML, INSIG1, TP53 by a predicted activation and MBTPS1, RXRA, MAPK7, NR1H3, INSR, DBI, SREBF1/2, SCAP, MAP2K5 by a predicated inhibition of the regulators itself. Gene expression of HMGCR have been validated for a selected target gene (Figure 2) while binding sites for predicted regulators (e.g. NR1H4) have been confirmed using the TF binding site profile detection analysis (Supplementary Figure S2).
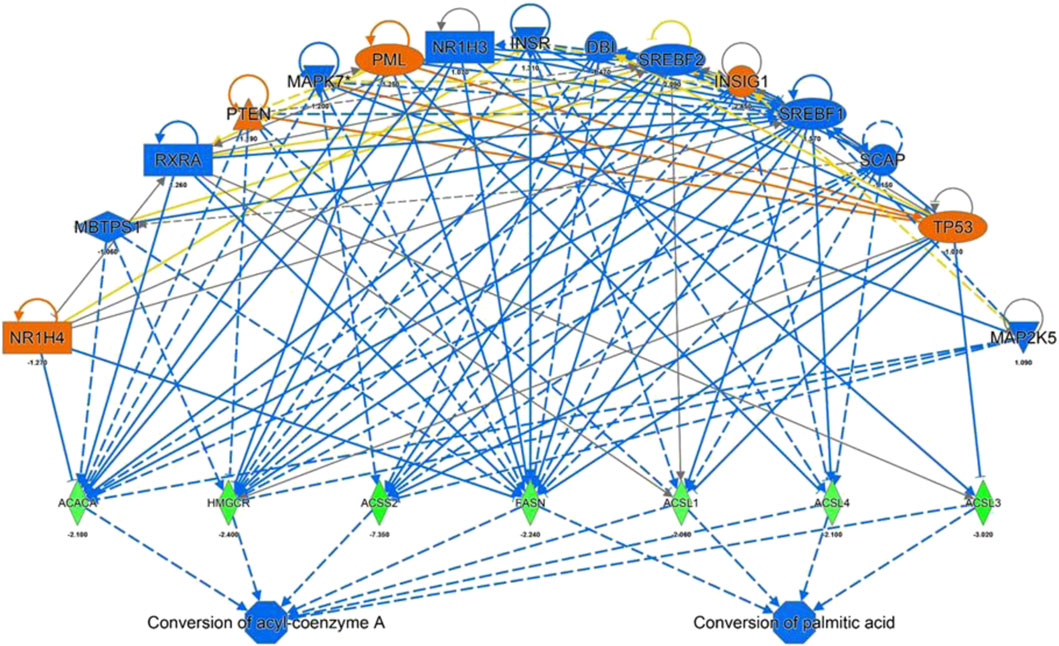
FIGURE 4. IPA Upstream Regulators Analysis for identification of upstream regulators that may be responsible for changes in gene expression observed for ACACA, HMGCR, ACSS2, FASN, ACSL 1,3 and 4 (predicted activation (orange) predicted inhibition (blue) of the regulators leads to a decreased expression (green)).
C6 TAZ cells showed significantly decreased levels of cell proliferation when compared to wild-type C6 cells (Gurtler et al., 2019). To evaluate if the development of cellular senescence contributes to this phenomenon β-galactosidase (SA-βGal) activity was determined in C6 and C6 TAZ cells. Indeed, C6 TAZ cells showed a more than 70fold increase in the fraction of senescent cells (C6 TAZ: 22.64 ŷ 6.90% β-Gal positive cells; versus C6: 0.32 ŷ 0.13% β-Gal positive cells; p = 0.029) (Figure 4A). Senescent cells exhibit a typical phenotype, senescence associated secretory phenotype (SASP). This is characterized by the expression/release of, among others, pro-inflammatory cytokines (IL6, IL1α), chemokines (IL8, CXCL1), proteases (MMPs), soluble factors like colony stimulating factors GM-CSF, G-CSF), and CDK inhibitors (p16, p21) (Ortiz-Montero et al., 2017; Cuollo et al., 2020). Here we demonstrate by RT-qPCR that mRNA amounts of CXCL1, IL6, and ILα were increased in C6 TAZ compared to C6 cells (CXCL1: 1.96[1.50; 3.00] vs. 1.00[0.72; 1.18]; p = 0.0012; IL6: 3.60[3.03;4.13] vs. 1.00[0.72;2.43]; p = 0.0286; and IL1α: 1.34[1.21;1.44] vs. 1.00[0.75;1.16]; p = 0.057) (Figure 4B).
Next, the tafazzin variants (wild-type full length, FL; H69L enzymatically dead mutant, Mut; and tafazzin lacking exon 5, Δ5) were re-expressed in C6 TAZ cells to elucidate, to what extent these variants are able to reverse tafazzin-knock-out-dependent changes in cellular functions. By transfection and subsequent selection, expression of the three tafazzin variants could be achieved in tafazzin-deficient C6-TAZ cells. As shown in Figure 5, all three tafazzin variants could be successfully expressed in C6 cells at a level by far exceeding that of wild-type C6 cells.
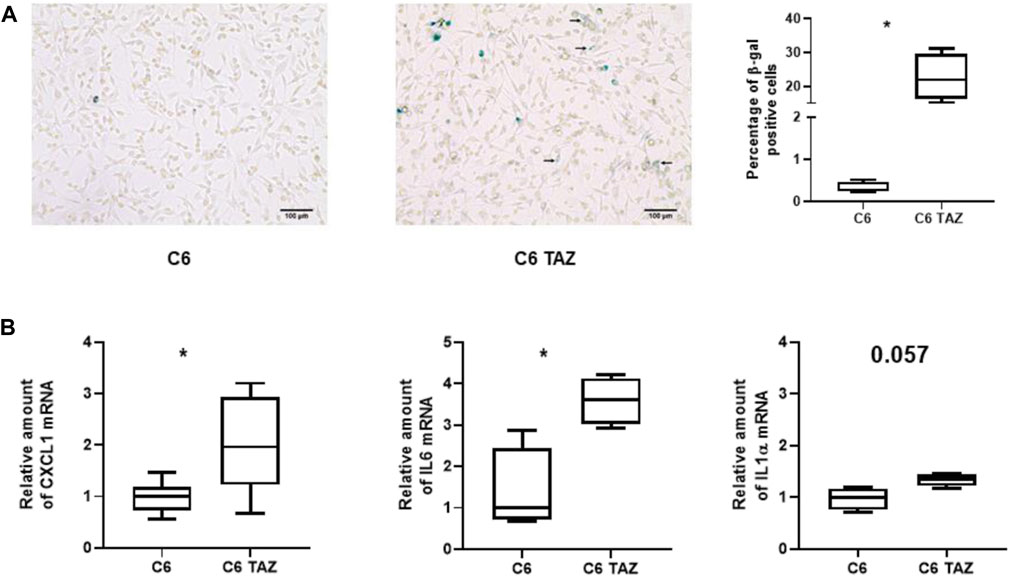
FIGURE 5. (A) Left: Microscopic images of β-gal positive cells (blue color) in C6 and C6 TAZ cells. Right: Percentage of β-gal positive cells is given as boxplot (* indicates p < 0.05). (B) Upregulation of SASP genes: Amounts of mrnas of CXCL1, IL6, and IL1α are elevated in C6 TAZ cells (mrna expression normalized to RPL13a; n = 4, p = 0.029).
First of all, of course, it was analysed to what extent the re-expression of the different TAZ variants could reverse the massive changes in the cardiolipin composition caused by the knock-out of tafazzin in rat C6 cells. As summarized in Table 4, the tafazzin variants full length TAZ and Δ5 TAZ were able to reverse to a large extent the changes in the CL composition observed after TAZ KO. In contrast, and as expected, the mutant lacking transacylase activity (H69L; Mut), did not restore the CL-composition associated with the C6 wildtype phenotype. Of note, for 11 out of 17 individual CL-species (abundance < 0.1; Table 1) re-expression of FL tafazzin resulted in amounts which are closer to the C6 wild-type compared to the ones obtained by re-expressing the Δ5 variant. This also expressly applies to the content of oxidized cardiolipin [C6: 11 (9.46; 11.75); C6 TAZ Δ5: 13.60 (12.65; 14.81); C6 TAZ FL: 10.01 (8.62; 11.17); Table 4].
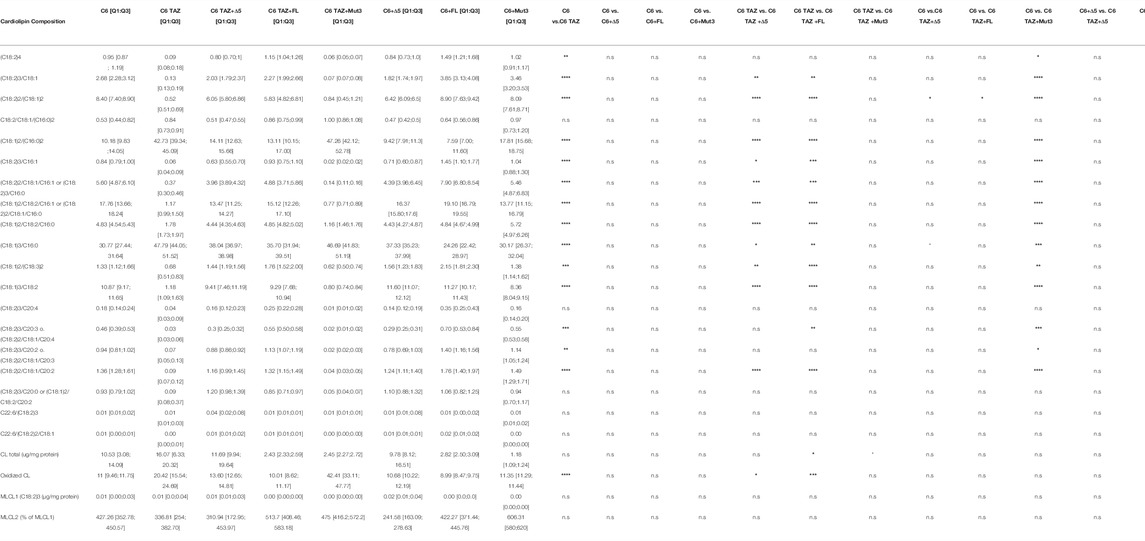
TABLE 4. Cardiolipin composition of C6 (w/o Δ5, FL and Mut) and C6 TAZ (w/o Δ5, FL and Mut) cells
Next, it was analysed whether the re-expressed TAZ variants can reverse the marked reduction in cellular proliferation that has been observed after TAZ knock-down or knock-out, respectively. As summarized in Figure 6, C6 TAZ cells exhibit a substantial decrease in proliferation when compared to C6 wild-type cells [C6 TAZ: 0.28 (0.27; 0.36) vs. C6: 1.00 (0.79; 1.16), p < 0.001]. For control purposes, wild-type C6 cells were also transfected with the three TAZ variants. The stable expression of none of the three variants caused any significant change in cell proliferation compared to C6 wild-type, although there was a marginal increase upon transfection of the Δ5 variant (p = n.s.). Expression of the full-length rat tafazzin in C6 TAZ cells increased proliferation of C6 TAZ cells to the level of wild-type C6 cells [C6 FL: 1.10 (0.88; 1.17); C6 TAZ FL: 0.94 (0.76; 0.93); p = n.s.]. In contrast, and as expected, the expression of an enzymatically inactive mutant (H69L, Mut) failed to restore C6 proliferation [C6 Mut: 0.87 (0.79; 0.93) vs. C6 TAZ Mut: 0.31 (0.27; 0.38); p = 0.002]. Surprisingly, also the re-expression of the Δ5 variant did not lead to the restoration of the “wild-type” proliferation of C6 cells [C6 Δ5: 1.148 (0.93; 1.56) vs. C6 TAZ Δ5: 0.49 (0.40; 0.59); p < 0.0001] (Figure 6).
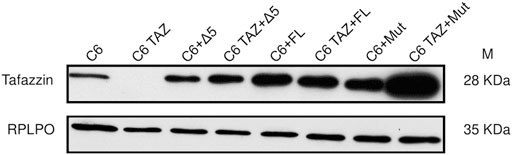
FIGURE 6. Re-expression of human Δ5, rat full length tafazzin (FL) and enzymatically dead mutant (Mut) in C6 and C6 TAZ knockout cells is confirmed by immunoblot using mouse anti tafazzin antibody. RPLPO is used as a loading control.
Finally, it was analysed to what extent the changes in gene expression resulting from down-regulation or lack of tafazzin in C6 cells could be normalized by re-expressing different tafazzin variants in C6 TAZ cells.
As shown in Figure 7, re-expression of FL-TAZ and Δ5-TAZ variants in C6-TAZ cells reversed the tafazzin-knock-out-dependent changes in gene expression to a large extent. In detail, FL-TAZ was able to reverse the tafazzin knock-out-dependent increase in mRNA expression of CPE [C6: 1.00 (0.87; 1.20); C6-TAZ: 5.55 (2.67; 8.53); TAZ-FL: 0.77 (0.57; 0.76); p < 0.0001 C6-TAZ vs. FL-TAZ] and of PPARG [C6: 1.00 (0.61; 1.39); C6-TAZ: 69.74 (9.21; 162.50); TAZ-FL: 2.80 (2.16; 4.48); p < 0.01 C6-TAZ vs. FL-TAZ]. Accordingly, CPM, MVK, HMGCR, HSD17B7, genes the mRNA amounts of which were found to be significantly down-regulated in response to tafazzin knock-out, were significantly increased by re-expression of FL-TAZ [CPM: C6: 1.00 (0.84; 1.15); C6-TAZ: 0.06 (0.03; 0.16); TAZ-FL: 0.76 (0.59; 0.87); p < 0.001 C6-TAZ vs. FL-TAZ; MVK [C6: 1.00 (0.89; 1.12); C6-TAZ: 0.45 (0.36; 0.50); TAZ-FL: 1.20 (1.04; 1.40); p < 0.01 C6-TAZ vs. FL-TAZ; HMGCR: C6: 1.00 (0.88; 1.11); C6-TAZ: 0.54 (0.37; 0.67); TAZ-FL: 0.89 (0.83; 0.99); p < 0.01 C6-TAZ vs. FL-TAZ; HSD17B2: C6: 1.00 (0.92; 1.16); C6-TAZ: 0.24 (0.09; 0.280); TAZ-FL: 0.66 (0.59; 0.79); p < 0.01 C6-TAZ vs. FL-TAZ] (Figure 8). However, FL-TAZ re-expression in C6-TAZ cells was not able to normalize decreased amounts of SC5D and ENPEP mRNA and even further elevated levels of DPP7 mRNA (Figure 8) [SC5D: C6: 1.00 (0.83; 1.19); C6-TAZ: 0.57 (0.31; 0.81); TAZ-FL: 0.53 (0.47; 0.61); p = n.s. C6-TAZ vs. FL-TAZ; ENPEP [C6: 1.00 (0.61; 1.10); C6-TAZ: 0.24 (0.09; 0.50); TAZ-FL: 0.12 (0.07; 0.18); p = n.s. C6-TAZ vs. FL-TAZ; DPP7: C6: 1.00 (0.79; 1.26); C6-TAZ: 1.44 (1.16; 1.73); TAZ-FL: 3.04 (2.24; 3.46); p < 0.01 C6-TAZ vs. FL-TAZ].
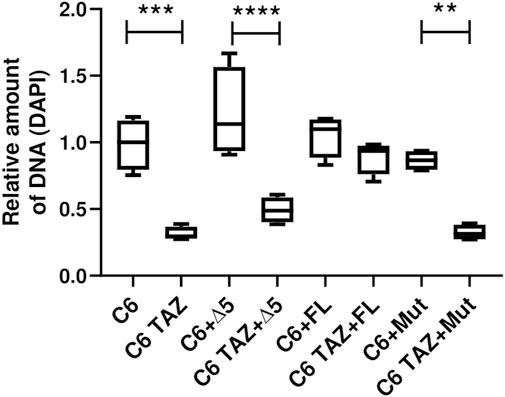
FIGURE 7. Proliferation was confirmed using DAPI stain. Density of 800 C6 and C6 TAZ cells (w/o Δ5, FL, Mut) were seeded in a 96 well plate. Cells were incubated for 96 h then fixed with ethanol and later stained with DAPI (7.5 µM). After subsequent washing steps the fluorescence intensity was measured at 450/570 nm wavelength. n = 4 biological replicates (C6 w/o Δ5, FL and Mut) and n = 4 biological replicates (C6 TAZ w/o Δ5, FL and Mut) is given as a boxplot with median, quartile and interquartile range.
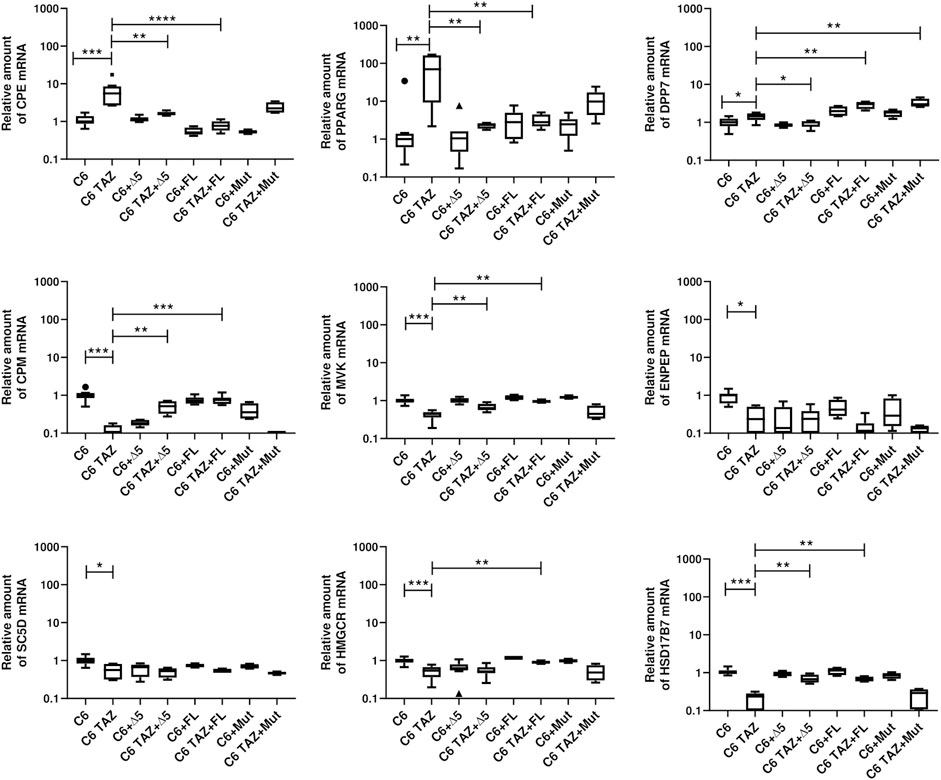
FIGURE 8. Relative mRNA amount of indicated genes in C6 and C6 TAZ (w/o Δ5, FL, Mut) is determined by RT-qPCR and normalized to RPLP13a. Data is represented as boxplot with median, quartile and interquartile range.
Δ5-TAZ, when re-expressed in C6-TAZ cells, was a little less effective than FL-TAZ in restoring C6 wild-type gene expression. Although Δ5-TAZ did alter gene expression towards wild-type, these changes were substantially less pronounced for CPE, CPM, and MVK compared to FL-TAZ. Furthermore, Δ5-TAZ did not restore wild-type levels of HMGCR mRNA atall, but, in contrast to FL-TAZ, did normalize DPP7 mRNA levels (Figure 7) [HMGCR: C6: 1.00 (0.88; 1.11); C6-TAZ: 0.54 (0.37; 0.67); Δ5-TAZ: 0.52 (0.46; 0.67); p = n.s. C6-TAZ vs. Δ5-TAZ; DPP7: C6: 1.00 (0.79; 1.26); C6-TAZ: 1.44 (1.16; 1.73); Δ5-TAZ: 0.99 (0.76; 1.08); p < 0.05 C6-TAZ vs. Δ5-TAZ; CPE: C6: 1.00 (0.87; 1.40); C6-TAZ: 5.55 (2.67; 8.53); Δ5-TAZ: 1.59 (1.46; 1.81); p < 0.01 C6-TAZ vs. Δ5-TAZ; CPM: C6: 1.00 (0.84; 1.15); C6-TAZ: 0.06 (0.03; 0.16); Δ5-TAZ: 0.52 (0.32; 0.70); p < 0.01 C6-TAZ vs. Δ5-TAZ; MVK [C6: 1.00 (0.89; 1.12); C6-TAZ: 0.45 (0.36; 0.50); Δ5-TAZ: 0.64 (0.56; 0.82); p < 0.01 C6-TAZ vs. Δ5-TAZ. The Δ5 variant also restored mRNA expression of PPARG and HSD17B7 (PPARG: C6: 1.00 (0.61; 1.39); C6-TAZ: 69.74 (9.21; 162.50); Δ5-TAZ: 2.38 (1.89; 2.63); p < 0.01 C6-TAZ vs. Δ5-TAZ; HSD17B7C6: 1.00 (0.61; 1.39); C6-TAZ: 69.74 (9.21; 162.50); Δ5-TAZ: 2.38 (1.89; 2.63); p < 0.01 C6-TAZ vs. Δ5-TAZ]. As observed for FL-TAZ, Δ5-TAZ was not able to return mRNA amounts of SC5D and ENPEP to wild-type levels [SC5D: C6: 1.00 (0.83; 1.19); C6-TAZ: 0.57 (0.31; 0.81); Δ5-TAZ: 0.53 (0.35; 0.63); p = n.s. C6-TAZ vs. Δ5-TAZ; ENPEP: C6: 1.00 (0.61; 1.10); C6-TAZ: 0.24 (0.09; 0.50); Δ5-TAZ: 0.24 (0.05; 0.39); p = n.s. C6-TAZ vs. Δ5-TAZ].
As expected, re-expressing the enzymatically in active variant, Mut, did not lead to any restoration of gene expression associated with the C6 wild-type.
As shown in Figure 9, the knock-out of tafazzin led to an increase in the amounts of cellular cholesterol [C6: 4.188 (4.80; 3.881) vs. C6 TAZ1: 5.285 (5.522; 5.057), p < 0.05; C6 vs. C6 TAZ2: 5.367 (5.367; 5.262), p < 0.05]. In C6 cells cholesterol is present mainly in its free form, only low levels of esterified cholesterol could be detected. Re-expression of either full length tafazzin (C6 TAZ + FL) or tafazzin lacking exon 5 (C6 TAZ + Δ5) substantially down-regulated the cells’ cholesterol content [C6 TAZ1: 5.285 (5.522; 5.057) vs. C6 TAZ1 + FL: 1.538 (2.347; 0.78), p < 0.05; C6TAZ1 vs. C6TAZ1 + Δ5: 1.591 (2.283; 1.365), p < 0.05].

FIGURE 9. Cellular content of cholesterol (free and esterified) in C6, C6 TAZ cells, and in response to re-expression of full length tafazzin (C6 TAZ + FL) or tafazzin lacking exon 5 (C6 TAZ + Δ5). n = 4 biological replicates (data given as a boxplot with median, quartile and interquartile range).
It has been shown previously, that the knock-down or knock-out, respectively, of tafazzin in rat glioma C6 cells causes substantial changes in cellular and mitochondrial properties and functions. The changes affect CL composition and cellular fatty acid availability, mitochondrial respiration, mitochondrial ROS production, mitochondrial membrane fluidity, cellular elasticity and proliferation (Schild et al., 2012; Ohlig et al., 2018; Gurtler et al., 2019; Schild et al., 2020). It is now accepted that the cellular availability of fatty acids has a crucial impact on CL composition (Oemer et al., 2020; Oemer et al., 2021; Oemer et al., 2022). As shown in the present work, the knock-out of tafazzin in C6 cells also results in substantial changes in the concentration of oxylipins. Oxylipins can be formed by oxidation of cardiolipin acyl chains by ROS and subsequent release by e.g. phospholipase A2 (Jezek et al., 2010). In our recent publication we were able to demonstrate increased ROS formation in mitochondria of TAZ knockout cells (Gurtler et al., 2019). We assume that the altered cardiolipin composition of the inner mitochondria membrane in these cells impairs the function of the respiratory chain (mainly complex I) that causes increased ROS formation (Adam-Vizi, 2005; Wirth et al., 2016).
In their function as PPAR ligands, oxylipins such as 8,9-EET could potentially contribute to metabolic and gene expression changes observed in C6 TAZ cells. Accordingly, the administration of 3 µM 8,9-EET to C6 cells led to alterations in gene expression. Although this 3 µM 8,9-EET concentration exceeds plasma levels detected in humans and mice (Pozzi et al., 2005; Gao et al., 2012; Lee et al., 2013), the occurrence of higher tissue concentrations under certain pathophysiological conditions cannot be ruled out (Brenneis et al., 2011). However, the contribution of PPAR to tafazzin-dependent expression changes is supposed to be of marginal relevance only, since not PPAR binding sites but those for HOXA5 and Pax2 (which were occurring in ∼100% of all up-regulated genes) were found to be enriched in TAZ-regulated genes when applying more recent databases in transcriptome analysis. In support of a minor role of PPARs only, the addition of the PPARγ agonist, pioglitazone, at 10, 3 or 1 µM concentration failed to induce any changes in the mRNA levels of the TAZ-regulated genes shown in Figure 2.
It is further demonstrated that the knock-down of tafazzin in C6 cells provokes massive changes in gene expression. Defective CL remodelling has been associated with altered gene expression of HIF-1α previously (Chowdhury et al., 2018). Mechanistically, differential expression of HIF-1α could be explained by reduced ROS production and NF-κB signalling in this case.
Here, by applying microarray-based transcriptome analysis, 1,026 genes were found to be differentially expressed (>twofold change) between C6 and C6 TAZ cells. This novel finding has been verified on selected targets using RT-qPCR. The search for responsible mechanisms led to the identification of the transcription factors HOXA5, Pax2, and JUN::JUNB. Transcript levels of these factors themselves were not different between C6 wild-type and C6-TAZ cells. However, Pax2 and also JUN::JUNB appear to be regulated by reversible phosphorylation rather than expression levels (Cai et al., 2002; Meng and Xia, 2011). The effects of tafazzin knock-out on the (phospho)proteome of C6 and other cells should be investigated in further investigations.
By applying Ingenuity Pathway Analysis of transcriptome data Top Diseases and Functions affected by tafazzin knock-out could be identified. Knock-out of tafazzin consistently led to changes in lipid metabolism. The top-regulated Diseases and Functions include [Carbohydrate Metabolism, Lipid Metabolism, Molecular Transport] and [Lipid Metabolism, Small Molecule Biochemistry, Vitamin and Mineral Metabolism]. Of note, Regulation of lipid metabolism/insulin regulation of fatty acid metabolism, Phospholipid metabolism, and Regulation of lipid metabolism/PPAR regulation of lipid metabolism were among the top-regulated pathways that have been identified previously by metabolomics in patients with Barth syndrome (Sandlers et al., 2016). Furthermore, clinical laboratory studies identified a unique biochemical profile specific for Barth patients and which included saturated fatty acids and docosahexaenoic acid (Vernon et al., 2014). All of these data suggest a major change in lipid metabolism in response to lack of tafazzin. Furthermore, in this study, pathways showing highest significance levels include the superpathway of cholesterol biosynthesis and several of its sideways. 14 out of 20 genes of this pathway appeared to be dysregulated in C6-TAZ cells, almost all are down-regulated. In full accordance with a down-regulation of cholesterol biosynthesis, hypocholesterolaemia has been described in some individuals with Barth Syndrome (Vernon et al., 2014). In addition, cholesterol synthesis from palmitate has been shown to depend on CL-synthesis (Hauff et al., 2009). Moreover, plasma concentrations of VLDL-TAGs and LDL-cholesterol concentration were reduced in TAZ knock-out animals (Cole et al., 2016). This points to a compromised hepatic export of cholesterol being present in these patients. C6 TAZ cells contain higher amounts of cholesterol than wild-type C6 cells. It could be speculated that C6 TAZ cells accumulate cholesterol because the efflux is disturbed and/or HDL-based reverse cholesterol transport is not effective under in vitro cell culture conditions. This accumulation of cholesterol would partly explain the down-regulation of cholesterol biosynthesis. Alterations in the fatty acid availability in C6 TAZ cells might also contribute to the observed down-regulation of enzymes involved in cholesterol biosynthesis as it has been reported that e.g., oleic acid, linoleic acid inhibit cholesterol biosynthesis (Natali et al., 2007; Priore et al., 2017).
The data presented demonstrate that the full-length rat tafazzin could be functionally distinguished from the Δ5 isoform. Although they both exhibit enzymatic activity and, when re-expressed in tafazzin-knock-out cells, restored the wild-type profile of cardiolipin composition to almost the same extent, it is only the full-length variant that was able to restore the wild-type cells’ proliferation rate. This unexpected finding strongly suggests the existence of non-enzymatic functions of tafazzin. In support of this view, the Δ5 variant showed slightly different behaviour with regard to the differential gene expression that could be induced by tafazzin knock-out. This fact is reflected in the generally weaker (and, therefore, less significant) effects of the Δ5 isoform and in the differences in the regulation of DPP7 and HMGCR when compared to FL-TAZ. Of note, neither re-expression of FL-TAZ or of Δ5-TAZ in tafazzin-deficient C6 cells could reverse all the substantial changes in gene expression observed after TAZ-knock-out. The reason remains to be elucidated fully.
Both isoforms changed the cardiolipin profile from knock-out to normal. It could be speculated that additional mechanisms exist which provoke longer-lasting or persistent changes in gene expression or proliferation. Accumulating evidence links lipid metabolism, and phospholipid metabolism in particular, to regulation of gene expression. Effects could be mediated by epigenetic regulation, by direct effects of lipid-sensing transcription factors (e.g., PGC1A, FXR) or by altered ROS production due to metabolic (mitochondrial) activity (Ferrari et al., 2012; Musille et al., 2013; Silva-Martinez et al., 2016; Chowdhury et al., 2018). Epigenetic regulation might well contribute to incomplete restoration of gene expression despite of the fact that CL-composition is fully restored. This remains, however, to be investigated in future studies. In this context, it seems worth mentioning that HoxA5, a transcription factor the binding sites of which have been found here enriched in up-regulated genes after tafazzin knock-out by means of TF binding site analysis, has been shown to increase DNA methylation in primary adipocytes (Cao et al., 2018).
Supporting the view that indeed epigenetic regulation contributes to differential gene expression observed after knock-out of tafazzin and its long-lasting retention in spite of tafazzin re-expression, the percentage of senescent cells is significantly elevated in C6-TAZ cells, compared to C6 wild-type cells. Recent data demonstrates that cellular senescence is accompanied by epigenetic and chromatin remodelling (Wiley et al., 2016; Nacarelli et al., 2017). Mechanistically, different cellular stressors have been shown to provoke senescence, including oxidative and metabolic stress (Campisi, 2013; Wiley et al., 2016; Nacarelli et al., 2017). How certain individual lipids regulate senescence and how senescence changes the cellular lipidome has been excellently reviewed recently (Hamsanathan and Gurkar, 2022). Oxidized lipids particularly promote the development of cellular senescence (Hamsanathan and Gurkar, 2022). Higher amounts of oxidised CL, used here as a representative marker for lipid oxidation, were detected in C6-TAZ cells. The fact that amounts of oxCL were normalised to a greater extent by re-expressing full length TAZ rather than by re-expressing Δ5 TAZ is in full accordance with the slightly different ability of the isoforms to restore cellular proliferation and gene expression.
The original contributions presented in the study are publicly available. This data can be found on the Gene Expression Omnibus (GEO) of NCBI with the accession record GSE207004. This includes the raw data from the microarray as well as the processed matrix.
GJ, CW, and UL conceived and designed the experiments; GJ, CW, ME, DP performed the experiments; GJ, CW, DP, and UL analyzed data; GJ and UL wrote the manuscript which was reviewed by all authors. All authors contributed to the article and approved the submitted version.
This work was supported by the Deutsche Forschungsgemeinschaft (RTG 1947-C2 UL) and by the Bogislaw scholarship of the county of Mecklenburg-Vorpommern (GJ).
The authors declare that the research was conducted in the absence of any commercial or financial relationships that could be construed as a potential conflict of interest.
All claims expressed in this article are solely those of the authors and do not necessarily represent those of their affiliated organizations, or those of the publisher, the editors and the reviewers. Any product that may be evaluated in this article, or claim that may be made by its manufacturer, is not guaranteed or endorsed by the publisher.
The Supplementary Material for this article can be found online at: https://www.frontiersin.org/articles/10.3389/fgene.2022.931017/full#supplementary-material
Adam-Vizi, V. (2005). Production of Reactive Oxygen Species in Brain Mitochondria: Contribution by Electron Transport Chain and Non-electron Transport Chain Sources. Antioxidants Redox Signal. 7, 1140–1149. doi:10.1089/ars.2005.7.1140
Basilotta, R., Lanza, M., Casili, G., Chisari, G., Munao, S., Colarossi, L., et al. (2022). Potential Therapeutic Effects of PPAR Ligands in Glioblastoma. Cells 11, 621. doi:10.3390/cells11040621
Brenneis, C., Coste, O., Altenrath, K., Angioni, C., Schmidt, H., Schuh, C.-D., et al. (2011). Anti-inflammatory Role of Microsomal Prostaglandin E Synthase-1 in a Model of Neuroinflammation. J. Biol. Chem. 286, 2331–2342. doi:10.1074/jbc.m110.157362
Bukowska, A., Hammwohner, M., Sixdorf, A., Schild, L., Wiswedel, I., Rohl, F. W., et al. (2012). Dronedarone Prevents Microcirculatory Abnormalities in the Left Ventricle During Atrial Tachypacing in Pigs. Br J. Pharmacol. 166, 964–980.
Cai, Y., Lechner, M. S., Nihalani, D., Prindle, M. J., Holzman, L. B., and Dressler, G. R. (2002). Phosphorylation of Pax2 by the C-Jun N-Terminal Kinase and Enhanced Pax2-dependent Transcription Activation. J. Biol. Chem. 277, 1217–1222. doi:10.1074/jbc.m109663200
Campisi, J. (2013). Aging, Cellular Senescence, and Cancer. Annu. Rev. Physiol. 75, 685–705. doi:10.1146/annurev-physiol-030212-183653
Cao, W., Xu, Y., Luo, D., Saeed, M., and Sun, C. (2018). Hoxa5 Promotes Adipose Differentiation via Increasing DNA Methylation Level and Inhibiting PKA/HSL Signal Pathway in Mice. Cell Physiol. Biochem. 45, 1023–1033. doi:10.1159/000487343
Castro-Mondragon, J. A., Riudavets-Puig, R., Rauluseviciute, I., Berhanu Lemma, R., Turchi, L., Blanc-Mathieu, R., et al. (2022). JASPAR 2022: the 9th Release of the Open-Access Database of Transcription Factor Binding Profiles. Nucleic Acids Res. 50, D165–D173. doi:10.1093/nar/gkab1113
Chen, M., Zhang, Y., and Zheng, P.-S. (2017). Tafazzin (TAZ) Promotes the Tumorigenicity of Cervical Cancer Cells and Inhibits Apoptosis. PLoS One 12, e0177171. doi:10.1371/journal.pone.0177171
Chilukoti, R. K., Giese, A., Malenke, W., Homuth, G., Bukowska, A., Goette, A., et al. (2015). Atrial Fibrillation and Rapid Acute Pacing Regulate Adipocyte/adipositas-Related Gene Expression in the Atria. Int. J. Cardiol. 187, 604–613. doi:10.1016/j.ijcard.2015.03.072
Chilukoti, R. K., Mostertz, J., Bukowska, A., Aderkast, C., Felix, S. B., Busch, M., et al. (2013). Effects of Irbesartan on Gene Expression Revealed by Transcriptome Analysis of Left Atrial Tissue in a Porcine Model of Acute Rapid Pacing In Vivo. Int. J. Cardiol. 168, 2100–2108. doi:10.1016/j.ijcard.2013.01.007
Chowdhury, A., Aich, A., Jain, G., Wozny, K., Lüchtenborg, C., Hartmann, M., et al. (2018). Defective Mitochondrial Cardiolipin Remodeling Dampens HIF-1α Expression in Hypoxia. Cell Rep. 25, 561–570. e566. doi:10.1016/j.celrep.2018.09.057
Clarke, S. L., Bowron, A., Gonzalez, I. L., Groves, S. J., Newbury-Ecob, R., Clayton, N., et al. (2013). Barth Syndrome. Orphanet J. Rare Dis. 8, 23. doi:10.1186/1750-1172-8-23
Cole, L. K., Mejia, E. M., Vandel, M., Sparagna, G. C., Claypool, S. M., Dyck-Chan, L., et al. (2016). Impaired Cardiolipin Biosynthesis Prevents Hepatic Steatosis and Diet-Induced Obesity. Diabetes 65, 3289–3300. doi:10.2337/db16-0114
Couture, O., Callenberg, K., Koul, N., Pandit, S., Younes, R., Hu, Z. L., et al. (2009). ANEXdb: an integrated animal ANnotation and microarray EXpression Database. Mamm Genome 20, 768–777.
Cowart, L. A., Wei, S., Hsu, M.-H., Johnson, E. F., Krishna, M. U., Falck, J. R., et al. (2002). The CYP4A Isoforms Hydroxylate Epoxyeicosatrienoic Acids to Form High Affinity Peroxisome Proliferator-Activated Receptor Ligands. J. Biol. Chem. 277, 35105–35112. doi:10.1074/jbc.m201575200
Cuollo, L., Antonangeli, F., Santoni, A., and Soriani, A. (2020). The Senescence-Associated Secretory Phenotype (SASP) in the Challenging Future of Cancer Therapy and Age-Related Diseases. Biol. (Basel) 9, 485. doi:10.3390/biology9120485
Dreos, R., Ambrosini, G., Cavin Périer, R., and Bucher, P. (2013). EPD and EPDnew, High-Quality Promoter Resources in the Next-Generation Sequencing Era. Nucleic Acids Res. 41, D157–D164. doi:10.1093/nar/gks1233
Ferrari, A., Fiorino, E., Giudici, M., Gilardi, F., Galmozzi, A., Mitro, N., et al. (2012). Linking Epigenetics to Lipid Metabolism: Focus on Histone Deacetylases. Mol. Membr. Biol. 29, 257–266. doi:10.3109/09687688.2012.729094
Flores, A. M., Li, L., McHugh, N. G., and Aneskievich, B. J. (2005). Enzyme Association with PPARγ: Evidence of a New Role for 15-lipoxygenase Type 2. Chemico-Biological Interact. 151, 121–132. doi:10.1016/j.cbi.2004.11.001
Frohman, M. A. (2015). Role of Mitochondrial Lipids in Guiding Fission and Fusion. J. Mol. Med. 93, 263–269. doi:10.1007/s00109-014-1237-z
Gao, Y., Feng, J., Ma, K., Zhou, Z., Zhu, Y., Xu, Q., et al. (2012). 8,9-Epoxyeicosatrienoic Acid Inhibits Antibody Production of B Lymphocytes in Mice. PLoS One 7, e40258. doi:10.1371/journal.pone.0040258
Gearing, L. J., Cumming, H. E., Chapman, R., Finkel, A. M., Woodhouse, I. B., Luu, K., et al. (2019). CiiiDER: A Tool for Predicting and Analysing Transcription Factor Binding Sites. PLoS One 14, e0215495. doi:10.1371/journal.pone.0215495
Gürtler, S., Wolke, C., Otto, O., Heise, N., Scholz, F., Laporte, A., et al. (2019). Tafazzin-dependent Cardiolipin Composition in C6 Glioma Cells Correlates with Changes in Mitochondrial and Cellular Functions, and Cellular Proliferation. Biochimica Biophysica Acta (BBA) - Mol. Cell Biol. Lipids 1864, 452–465. doi:10.1016/j.bbalip.2019.01.006
Hamsanathan, S., and Gurkar, A. U. (2022). Lipids as Regulators of Cellular Senescence. Front. Physiol. 13, 796850. doi:10.3389/fphys.2022.796850
Hauff, K. D., Choi, S.-Y., Frohman, M. A., and Hatch, G. M. (2009). Cardiolipin Synthesis Is Required to Support Human Cholesterol Biosynthesis from Palmitate upon Serum Removal in Hela cellsThis Article Is One of a Selection of Papers Published in a Special Issue Celebrating the 125th Anniversary of the Faculty of Medicine at the University of Manitoba. Can. J. Physiol. Pharmacol. 87, 813–820. doi:10.1139/y09-055
He, Q., Wang, M., Harris, N., and Han, X. (2013). Tafazzin Knockdown Interrupts Cell Cycle Progression in Cultured Neonatal Ventricular Fibroblasts. Am. J. Physiology-Heart Circulatory Physiology 305, H1332–H1343. doi:10.1152/ajpheart.00084.2013
Jezek, J., Jaburek, M., Zelenka, J., and Jezek, P. (2010). Mitochondrial Phospholipase A2 Activated by Reactive Oxygen Species in Heart Mitochondria Induces Mild Uncoupling. Physiol. Res. 59, 737–747.
Joshi, A. S., Zhou, J., Gohil, V. M., Chen, S., and Greenberg, M. L. (2009). Cellular Functions of Cardiolipin in Yeast. Biochimica Biophysica Acta (BBA) - Mol. Cell Res. 1793, 212–218. doi:10.1016/j.bbamcr.2008.07.024
Kimura, T., Jennings, W., and Epand, R. M. (2016). Roles of Specific Lipid Species in the Cell and Their Molecular Mechanism. Prog. Lipid Res. 62, 75–92. doi:10.1016/j.plipres.2016.02.001
Korbecki, J., Bobiński, R., and Dutka, M. (2019). Self-regulation of the Inflammatory Response by Peroxisome Proliferator-Activated Receptors. Inflamm. Res. 68, 443–458. doi:10.1007/s00011-019-01231-1
Lee, A. R., Pechenino, A. S., Dong, H., Hammock, B. D., and Knowlton, A. A. (2013). Aging, Estrogen Loss and Epoxyeicosatrienoic Acids (EETs). PLoS One 8, e70719. doi:10.1371/journal.pone.0070719
Ligasova, A., and Koberna, K. (2019). Quantification of Fixed Adherent Cells Using a Strong Enhancer of the Fluorescence of DNA Dyes. Sci. Rep. 9, 8701.
Liu, Y., Zhang, Y., Schmelzer, K., Lee, T.-S., Fang, X., Zhu, Y., et al. (2005). The Antiinflammatory Effect of Laminar Flow: The Role of PPARγ, Epoxyeicosatrienoic Acids, and Soluble Epoxide Hydrolase. Proc. Natl. Acad. Sci. U.S.A. 102, 16747–16752. doi:10.1073/pnas.0508081102
Lu, Y.-W., Galbraith, L., Herndon, J. D., Lu, Y.-L., Pras-Raves, M., Vervaart, M., et al. (2016). Defining Functional Classes of Barth Syndrome Mutation in Humans. Hum. Mol. Genet. 25, 1754–1770. doi:10.1093/hmg/ddw046
McMillin, J. B., and Dowhan, W. (2002). Cardiolipin and Apoptosis. Biochimica Biophysica Acta (BBA) - Mol. Cell Biol. Lipids 1585, 97–107. doi:10.1016/s1388-1981(02)00329-3
Meng, Q., and Xia, Y. (2011). c-Jun, at the Crossroad of the Signaling Network. Protein Cell 2, 889–898. doi:10.1007/s13238-011-1113-3
Mürke, E., Stoll, S., Lendeckel, U., Reinhold, D., and Schild, L. (2016). The Mitochondrial Phospholipid Cardiolipin Is Involved in the Regulation of T-Cell Proliferation. Biochimica Biophysica Acta (BBA) - Mol. Cell Biol. Lipids 1861, 748–754. doi:10.1016/j.bbalip.2016.05.001
Musille, P. M., Kohn, J. A., and Ortlund, E. A. (2013). Phospholipid - Driven Gene Regulation. FEBS Lett. 587, 1238–1246. doi:10.1016/j.febslet.2013.01.004
Nacarelli, T., Liu, P., and Zhang, R. (2017). Epigenetic Basis of Cellular Senescence and its Implications in Aging. Genes (Basel) 8. doi:10.3390/genes8120343
Natali, F., Siculella, L., Salvati, S., and Gnoni, G. V. (2007). Oleic Acid Is a Potent Inhibitor of Fatty Acid and Cholesterol Synthesis in C6 Glioma Cells. J. Lipid Res. 48, 1966–1975. doi:10.1194/jlr.m700051-jlr200
Oemer, G., Edenhofer, M.-L., Wohlfarter, Y., Lackner, K., Leman, G., Koch, J., et al. (2021). Fatty Acyl Availability Modulates Cardiolipin Composition and Alters Mitochondrial Function in HeLa Cells. J. Lipid Res. 62, 100111. doi:10.1016/j.jlr.2021.100111
Oemer, G., Koch, J., Wohlfarter, Y., Alam, M. T., Lackner, K., Sailer, S., et al. (2020). Phospholipid Acyl Chain Diversity Controls the Tissue-Specific Assembly of Mitochondrial Cardiolipins. Cell Rep. 30, 4281–4291. doi:10.1016/j.celrep.2020.02.115
Oemer, G., Koch, J., Wohlfarter, Y., Lackner, K., Gebert, R. E. M., Geley, S., et al. (2022). The Lipid Environment Modulates Cardiolipin and Phospholipid Constitution in Wild Type and Tafazzin‐deficient Cells. J Inher Metab Disea 45, 38–50. doi:10.1002/jimd.12433
Oh, S.-H., Park, S.-M., Park, J.-S., Jang, A.-S., Lee, Y.-M., Uh, S.-T., et al. (2009). Association Analysis of Peroxisome Proliferator-Activated Receptors Gamma Gene Polymorphisms with Asprin Hypersensitivity in Asthmatics. Allergy Asthma Immunol. Res. 1, 30–35. doi:10.4168/aair.2009.1.1.30
Ohlig, T., Le, D. V., Gardemann, A., Wolke, C., Gürtler, S., Peter, D., et al. (2018). Effects of siRNA-dependent Knock-Down of Cardiolipin Synthase and Tafazzin on Mitochondria and Proliferation of Glioma Cells. Biochimica Biophysica Acta (BBA) - Mol. Cell Biol. Lipids 1863, 379–387. doi:10.1016/j.bbalip.2018.01.003
Ortiz-Montero, P., Londoño-Vallejo, A., and Vernot, J.-P. (2017). Senescence-associated IL-6 and IL-8 Cytokines Induce a Self- and Cross-Reinforced Senescence/inflammatory Milieu Strengthening Tumorigenic Capabilities in the MCF-7 Breast Cancer Cell Line. Cell Commun. Signal 15, 17. doi:10.1186/s12964-017-0172-3
Pfeiffer, K., Gohil, V., Stuart, R. A., Hunte, C., Brandt, U., Greenberg, M. L., et al. (2003). Cardiolipin Stabilizes Respiratory Chain Supercomplexes. J. Biol. Chem. 278, 52873–52880. doi:10.1074/jbc.m308366200
Pozzi, A., Macias-Perez, I., Abair, T., Wei, S., Su, Y., Zent, R., et al. (2005). Characterization of 5,6- and 8,9-epoxyeicosatrienoic Acids (5,6- and 8,9-EET) as Potent In Vivo Angiogenic Lipids. J. Biol. Chem. 280, 27138–27146. doi:10.1074/jbc.m501730200
Priore, P., Gnoni, A., Natali, F., Testini, M., Gnoni, G. V., Siculella, L., et al. (2017). Oleic Acid and Hydroxytyrosol Inhibit Cholesterol and Fatty Acid Synthesis in C6 Glioma Cells. Oxid. Med. Cell Longev. 2017, 9076052. doi:10.1155/2017/9076052
Pu, W. T. (2022). Experimental Models of Barth Syndrome. J Inher Metab Disea 45, 72–81. doi:10.1002/jimd.12423
Raja, V., and Greenberg, M. L. (2014). The Functions of Cardiolipin in Cellular Metabolism-Potential Modifiers of the Barth Syndrome Phenotype. Chem. Phys. Lipids 179, 49–56. doi:10.1016/j.chemphyslip.2013.12.009
Sandlers, Y., Mercier, K., Pathmasiri, W., Carlson, J., McRitchie, S., Sumner, S., et al. (2016). Metabolomics Reveals New Mechanisms for Pathogenesis in Barth Syndrome and Introduces Novel Roles for Cardiolipin in Cellular Function. PLoS One 11, e0151802.
Schild, L., Döring, M., Jansing, S., Peter, D., Jagirdar, G., Wolke, C., et al. (2020). Proliferation of C6 Glioma Cells Requires the Phospholipid Remodeling Enzyme Tafazzin Independent of Cardiolipin Composition. Biochimica Biophysica Acta (BBA) - Mol. Cell Biol. Lipids 1865, 158596. doi:10.1016/j.bbalip.2019.158596
Schild, L., Lendeckel, U., Gardemann, A., Wiswedel, I., Schmidt, C. A., Wolke, C., et al. (2012). Composition of Molecular Cardiolipin Species Correlates with Proliferation of Lymphocytes. Exp. Biol. Med. (Maywood) 237, 372–379. doi:10.1258/ebm.2011.011311
Schlame, M. (2013). Cardiolipin Remodeling and the Function of Tafazzin. Biochimica Biophysica Acta (BBA) - Mol. Cell Biol. Lipids 1831, 582–588. doi:10.1016/j.bbalip.2012.11.007
Schlame, M., and Greenberg, M. L. (2017). Biosynthesis, Remodeling and Turnover of Mitochondrial Cardiolipin. Biochimica Biophysica Acta (BBA) - Mol. Cell Biol. Lipids 1862, 3–7. doi:10.1016/j.bbalip.2016.08.010
Schultz, D., Surabhi, S., Stelling, N., Rothe, M., Group, K. S., Methling, K., et al. (2020). 16HBE Cell Lipid Mediator Responses to Mono and Co-infections with Respiratory Pathogens. Metabolites 10, 113. doi:10.3390/metabo10030113
Silva-Martínez, G. A., Rodríguez-Ríos, D., Alvarado-Caudillo, Y., Vaquero, A., Esteller, M., Carmona, F. J., et al. (2016). Arachidonic and Oleic Acid Exert Distinct Effects on the DNA Methylome. Epigenetics 11, 321–334. doi:10.1080/15592294.2016.1161873
Vaz, F. M., Houtkooper, R. H., Valianpour, F., Barth, P. G., and Wanders, R. J. A. (2003). Only One Splice Variant of the Human TAZ Gene Encodes a Functional Protein with a Role in Cardiolipin Metabolism. J. Biol. Chem. 278, 43089–43094. doi:10.1074/jbc.m305956200
Vernon, H. J., Sandlers, Y., McClellan, R., and Kelley, R. I. (2014). Clinical Laboratory Studies in Barth Syndrome. Mol. Genet. Metabolism 112, 143–147. doi:10.1016/j.ymgme.2014.03.007
Wang, S., Li, Y., Xu, Y., Ma, Q., Lin, Z., Schlame, M., et al. (2020). AAV Gene Therapy Prevents and Reverses Heart Failure in a Murine Knockout Model of Barth Syndrome. Circ. Res. 126, 1024–1039. doi:10.1161/circresaha.119.315956
Wiley, C. D., Velarde, M. C., Lecot, P., Liu, S., Sarnoski, E. A., Freund, A., et al. (2016). Mitochondrial Dysfunction Induces Senescence with a Distinct Secretory Phenotype. Cell Metab. 23, 303–314. doi:10.1016/j.cmet.2015.11.011
Wirth, C., Brandt, U., Hunte, C., and Zickermann, V. (2016). Structure and Function of Mitochondrial Complex I. Biochimica Biophysica Acta (BBA) - Bioenergetics 1857, 902–914. doi:10.1016/j.bbabio.2016.02.013
Xu, Y., Zhang, S., Malhotra, A., Edelman-Novemsky, I., Ma, J., Kruppa, A., et al. (2009). Characterization of Tafazzin Splice Variants from Humans and Fruit Flies. J. Biol. Chem. 284, 29230–29239. doi:10.1074/jbc.m109.016642
Yates, A. D., Achuthan, P., Akanni, W., Allen, J., Allen, J., Alvarez-Jarreta, J., et al. (2020). Ensembl 2020. Nucleic Acids Res. 48, D682–D688. doi:10.1093/nar/gkz966
Keywords: Barth syndrome, cardiolipin, cellular proliferation, gene expression, tafazzin, Barth syndrome (BTHS)
Citation: Jagirdar G, Elsner M, Scharf C, Simm S, Borucki K, Peter D, Lalk M, Methling K, Linnebacher M, Krohn M, Wolke C and Lendeckel U (2022) Re-Expression of Tafazzin Isoforms in TAZ-Deficient C6 Glioma Cells Restores Cardiolipin Composition but Not Proliferation Rate and Alterations in Gene Expression. Front. Genet. 13:931017. doi: 10.3389/fgene.2022.931017
Received: 28 April 2022; Accepted: 13 June 2022;
Published: 25 July 2022.
Edited by:
Rahul Saxena, Georgetown University, United StatesReviewed by:
Luis Alberto Luévano, University of São Paulo, BrazilCopyright © 2022 Jagirdar, Elsner, Scharf, Simm, Borucki, Peter, Lalk, Methling, Linnebacher, Krohn, Wolke and Lendeckel. This is an open-access article distributed under the terms of the Creative Commons Attribution License (CC BY). The use, distribution or reproduction in other forums is permitted, provided the original author(s) and the copyright owner(s) are credited and that the original publication in this journal is cited, in accordance with accepted academic practice. No use, distribution or reproduction is permitted which does not comply with these terms.
*Correspondence: Uwe Lendeckel, dXdlLmxlbmRlY2tlbEBtZWQudW5pLWdyZWlmc3dhbGQuZGU=
Disclaimer: All claims expressed in this article are solely those of the authors and do not necessarily represent those of their affiliated organizations, or those of the publisher, the editors and the reviewers. Any product that may be evaluated in this article or claim that may be made by its manufacturer is not guaranteed or endorsed by the publisher.
Research integrity at Frontiers
Learn more about the work of our research integrity team to safeguard the quality of each article we publish.