- 1College of Horticulture, Northwest Agriculture and Forestry University, Yangling, China
- 2Guangdong Provincial Key Laboratory of Utilization and Conservation of Food and Medicinal Resources in Northern Region, Shaoguan University, Shaoguan, China
- 3Henry Fok School of Biology and Agriculture, Shaoguan University, Shaoguan, China
The nucleotide-binding site and leucine-rich repeat (NBS-LRR) genes, one of the largest gene families in plants, are evolving rapidly and playing a critical role in plant resistance to pathogens. In this study, a genome-wide search in 12 Rosaceae genomes screened out 2188 NBS-LRR genes, with the gene number varied distinctively across different species. The reconciled phylogeny revealed 102 ancestral genes (7 RNLs, 26 TNLs, and 69 CNLs), which underwent independent gene duplication and loss events during the divergence of the Rosaceae. The NBS-LRR genes exhibited dynamic and distinct evolutionary patterns in the 12 Rosaceae species due to independent gene duplication/loss events, which resulted the discrepancy of NBS-LRR gene number among Rosaceae species. Specifically, Rubus occidentalis, Potentilla micrantha, Fragaria iinumae and Gillenia trifoliata, displayed a “first expansion and then contraction” evolutionary pattern; Rosa chinensis exhibited a “continuous expansion” pattern; F. vesca had a “expansion followed by contraction, then a further expansion” pattern, three Prunus species and three Maleae species shared a “early sharp expanding to abrupt shrinking” pattern. Overall, this study elucidated the dynamic and complex evolutionary patterns of NBS-LRR genes in the 12 Rosaceae species, and could assist further investigation of mechanisms driving these evolutionary patterns.
Introduction
Plants are threatened by diverse pathogens in the natural environment during their life cycle. To defend against invading pathogens, plants have evolved a specific immune system, in which the first line of defence response called PAMP- triggered immunity (PTI) and the second called effector-triggered immunity (ETI) (Dangl and Jones, 2001; Bhar et al., 2021). The disease RESISTANCE (R) gene can recognize invading pathogens and initiate the second line of defence (Jones and Dangl, 2006; Bhar et al., 2021). The nucleotide-binding site and leucine-reach repeat (NBS-LRR) genes constitute the largest class of R genes, and confer resistance to numerous plant pathogens (Meyers et al., 2005; Jones and Dangl, 2006; Zhou et al., 2020). A typical NBS-LRR gene comprises a variable N-terminal domain, a central nucleotide-binding site (NBS) domain containing several highly conserved and strictly ordered motifs, and a diverse C-terminal leucine-reach repeat (LRR) domain highly adaptable and involved in protein-protein interactions and pathogen recognition. NBS-LRR genes can be further classified into three subclasses, TIR-NBS-LRR (TNL), CC-NBS-LRR (CNL), and RPW8-NBS-LRR (RNL), based on whether their N-terminal region contains a Toll/interleukin-1 receptor (TIR) domain, a coiled-coil (CC) domain, or a resistance to powdery mildew 8 (RPW8) domain (Shao et al., 2014; Shao et al., 2016; Zhang et al., 2016; Qian et al., 2017; Shao et al., 2019).
Functional characterization revealed that TNL or CNL genes usually serve to trigger resistance pathways in plants by recognizing specific pathogens (Jones and Dangl, 2006; McHale et al., 2006; Zhou et al., 2020). Pathogens invasion recognized by the LRR domain of TNL or CNL proteins can elicits conformational changes in the NBS domain, and further cause multimerization of the TIR or CC domain and transmission of defense signals (Xue et al., 2019). By contrast, RNL genes do not function like regular R genes; they tend to function downstream and transduce signals from TNL or CNL proteins (Bonardi et al., 2011). NBS-LRR genes play essential roles in plant immunity during growth and development. For example, in Arabidopsis thaliana, the TNL gene RPS4 confers specific resistance to a bacterial pathogen in an enhanced disease susceptibility 1 (EDS1) allele-dependent manner (Gassmann et al., 2010). A CNL resistance gene in cotton, GbCNL130, confers resistance to verticillium wilt across different hosts (Li et al., 2021). Likewise, the CNL gene Pm21 (POWDERY MILDEW RESISTANCE21) confers broad-spectrum resistance to wheat powdery mildew disease (He et al., 2018); Pi64, which encodes a CNL protein, confers high-level and broad-spectrum resistance to leaf and neck blast in rice (Ma et al., 2015). RppM, encoding a typical CNL protein, confers resistance to southern corn rust in maize (Wang et al., 2022).
NBS-LRR genes originate in the green plant lineage (Shao et al., 2019), and have evolved into a large gene family in angiosperms via frequent recombination between paralogs, gene duplications/losses, and high substitution rate (Leister, 2004). The number of NBS-LRR genes differs markedly between species, owing to varying numbers of gene gain and loss events during evolution. Among Orchidaceae species, Dendrobium catenatum contains 115 NBS-LRR genes, while Gastrodia elata only harbors five NBS-LRR genes (Xue et al., 2019). In crop species, there are 129 and 508 NBS-LRR genes in maize and rice, respectively, representing a four-fold discrepancy (Li et al., 2010). With increasing availability of sequenced genomes for plants, genome-wide evolutionary analysis of NBS-LRR genes have been performed among many closely related species or subspecies to reveal diverse evolutionary patterns. For example, the NBS-LRR gene family in four Poaceae genomes, rice, maize, Sorghum bicolor, and Brachypodium distachyon, displays a “contracting” pattern (Li et al., 2010). In four Fabaceae species, Medicago truncatula, pigeon pea, common bean, and soybean, the NBS-LRR genes exhibit a “consistently expanding” pattern (Shao et al., 2014). Additionally, frequent lineage losses and deficient gene duplications dominate the evolution of NBS-LRR gene in three Cucurbitaceae genomes (cucumber, melon, and watermelon), resulting a low copy number in these species (Lin et al., 2013). Interestingly, NBS-LRR genes also display diverse evolutionary patterns in plants belonging to the same family. For example, in the Solanaceae, potato BS-LRR genes exhibit a “consistent expansion” pattern, tomato are characterized by a “expansion followed by contraction” pattern, while pepper display a “shrinking” pattern (Qian et al., 2017). In the Soapberry genomes, yellowhorn NBS-LRR genes exhibit an “expansion followed by contraction” pattern, while in both Acer yangbiense and longan, the gene evolutionary pattern is “expansion followed by contraction, and then further expansion” (Zhou et al., 2020). These results suggest that the evolutionary patterns of the NBS-LRR gene family are diverse in different plant species.
As one of the most economically important plant families, the Rosaceae consists of 90 genera with approximately 3,000 species distributed worldwide, including major fruits such as apple, strawberry, pear, peach, and sweet cherry, as well as ornamental flowers such as rose, rowan, and flowering peach (Longhi et al., 2014). These plants face constant threats from pathogens including bacteria, fungi, nematodes, and viruses, which results in seriously economic losses. In order to mitigate the threat of pathogens to Rosaceae plants, it is necessary to investigate NBS-LRR gene family members and understand their essential roles in different Rosaceae species. In recent years, with many Rosaceae family members having been sequenced, multiple genomes of this family are now available (https://www.rosaceae.org/). The systematic evaluation and comparison of NBS-LRR genes at the genome level in more Rosaceae species is needed to obtain a better understanding of the evolutionary history in this gene family. In the present study, 12 sequenced genome datasets from Rosaceae were subjected to genome-wide comparative analysis. The aim of this study was to unveil the evolutionary patterns of NBS-LRR genes in a wide range of Rosaceae species, and provide a foundation for further study of the mechanisms driving these evolutionary changes.
Materials and methods
Identification and classification of NBS-LRR genes
Whole genome sequences and annotation files of 12 Rosaceae species (Fragaria vesca, Fragaria iinumae, Gillenia trifoliata, Prunus armeniaca, Prunus avium, Prunus persica, Potentilla micrantha, Pyrus betulifolia, Rosa chinensis, Rubus occidentalis, Malus baccata, and Malus x domestica) were downloaded from the Genome Database for Rosaceae (https://www.rosaceae.org/; Supplementary File S1). BLAST and HMMER searches with the hidden Markov model of the NB-ARC domain (PF00931) as a query were simultaneously performed to identify the candidate NBS-LRR genes in the 12 Rosaceae genomes. The threshold expectation value was set at 1.0 for the BLAST search, and default parameters were used for the HMM search. All the obtained candidate genes were merged, and the redundant hits were removed manually. The remaining candidate genes then were subjected to online Pfam analysis (http://pfam.sanger. ac.uk/) and NCBI-CDD search to further corroborate the presence of N-terminal domain (CC (PF18052)/TIR (PF01582)/RPW8 (PF05659)) and NBS domains by an E-value of 10−4. Finally, the NBS-LRR genes were divided into TNL, RNL, and CNL classes based on their N-terminal domain.
Analysis of NBS-LRR gene structures and conserved motif of NBS domain
To analyze the conserved motifs of NBS domain of TNL, RNL, and CNL proteins, the amino acid sequences of NBS domain were extracted and subsequently submitted to MEME online program (motifs should MEME find = 10) and WebLogo software (Crooks et al., 2004) with default parameters. Full-length coding sequences (CDS) and genomic DNA sequences of the NBS-LRR genes from 12 Rosaceae species were collected using TBtools (Chen et al., 2020) based on gff3 annotation files and submitted to GSDS2.0 (http://gsds.gao-lab.org/) to reveal the intron positions and phases among the three classes of NBS-LRR genes.
Sequence alignment and phylogenetic analysis of NBS-LRR genes
The sequence alignment of the NBS domain and phylogenetic analysis were conducted as described by Zhang et al. (2016). The amino acid sequences of the NBS domain were firstly extracted by TBtools (Chen et al., 2020) and aligned using Muscle integrated into MEGA 5.0 with the default settings. The resultant amino acid sequence alignments were subsequently corrected and improved manually using MEGA 7.0. The maximum likelihood method phylogenetic tree of NBS-LRR genes were constructed based on the aligned amino acid sequences using JTT + F + R10 model of IQ-Tree (Nguyen et al., 2015). Branch support values were assessed using UFBoot2 tests, and the scale bar indicated the genetic distance (Minh et al., 2013). In addition, the gene duplication/loss events of NBS-LRR genes during the speciation of the 12 Rosaceae taxa were identified by reconciling the unrooted tree with the real species tree using Notung software (Chen et al., 2000).
Synteny analysis within and across the rosaceae genomes
To identify collinear gene pairs and syntenic blocks within a genome or between different genomes, the pair-wise all-against-all blast of protein sequences was first conducted using the Diamond software. Then, the obtained results and gff3 annotation files were subjected to MCScanX (Wang et al., 2012) for intra- and interspecies microsynteny detection and gene duplication type determination. Finally, synteny relationship of NBS-LRR genes was displayed by TBtools (Chen et al., 2020). The ratio of nonsynonymous to synonymous nucleotide substitution (Ka/Ks) of gene pairs in each subclass were calculated according to Zhong et al. (2018).
Results
Identification of NBS-LRR genes in 12 rosaceae species
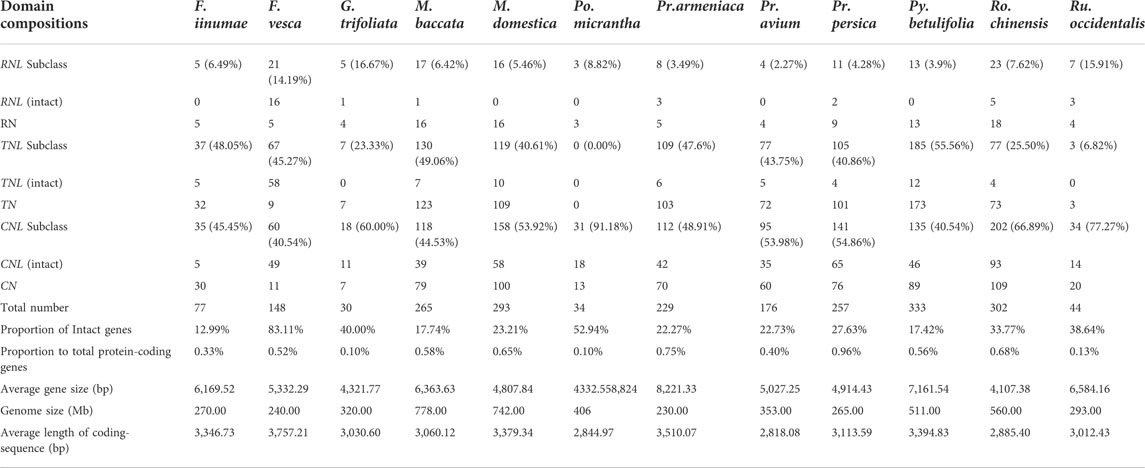
After confirming the N-terminal CC/RPW8/TIR domains and the central NBS domain in protein sequences, 2188 NBS-LRR genes were identified from 12 Rosaceae genomes (Figure 1; Table 1; Supplementary Table S1). We found that the number of NBS-LRR genes varied considerably among different taxa. Py. betulifolia contained the largest number of NBS-LRR genes (333, 0.56% of all annotated genes). There were 302 (0.68%), 293 (0.65%), and 265 (0.58%) NBS-LRR genes in Ro. chinensis, M. domestica and M. baccata genomes, respectively. However, only 30 (0.10%), 34 (0.10%), and 44 (0.13%) NBS-LRR genes were identified in G. trifoliata, Po. micrantha, and Ru. occidentalis genomes, respectively (Table 1). We also found that the number of NBS-LRR genes differed markedly even among closely related species. For example, in the closely related species, F. iinumae and F. vesca, 77 and 148 NBS-LRR genes were found, respectively (Figure 1; Table 1). These results suggest that species-specific expansion or contraction of the NBS-LRR gene family has occurred in 12 Rosaceae species.
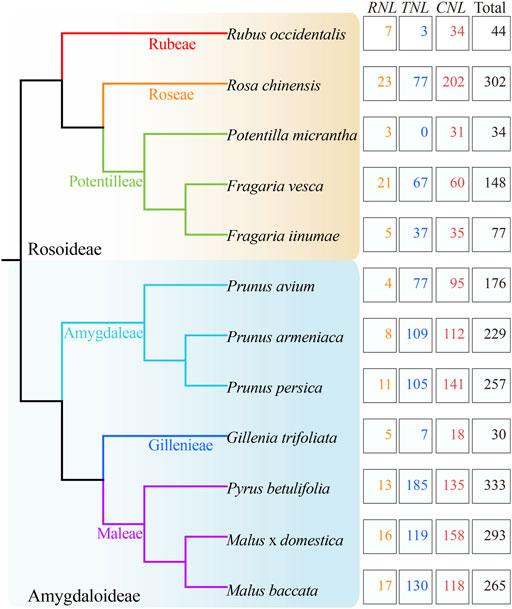
FIGURE 1. Identification and classification of NBS-LRR genes in 12 Rosaceae genomes. The phylogenetic tree (left) was constructed according to Xiang et al. (2017). The total number of NBS-LRR genes and their classification in each species (right) are shown.
Based on the conserved domains (CC/RPW8/TIR) in the N-terminal region, the NBS-LRR genes in the 12 Rosaceous species were classified into three subclasses (Figure 1; Table 1). There were 1139, 916, and 133 members in CNL, TNL, and RNL subclasses, respectively. The CNL genes were detected in all 12 Rosaceae species, while the TNL genes was absent in Po. micrantha. RNL genes were also found in all Rosaceae species, albeit with lower numbers than those of CNL and TNL genes. In the 12 Rosaceae species, only 617 NBS-LRR genes were structurally complete containing all three types of domains (CC/RPW8/TIR-NBS-LRR), and the rest 1571 genes lacked the LRR domain (Table 1). More interestingly, the F. vesca had the highest proportion of intact NBS-LRR genes (83.11%), while the F. iinumae comprised the fewest intact NBS-LRR genes (12.99%). Theoretically, NBS-LRR genes should have an intact structure to trigger immune responses and transmit defense signals, but several studies indicated that genes without intact structures may also function in plant immunity (Nandety et al., 2013; Kato et al., 2014).
Conserved motifs of the NBS domain in rosaceae
It has been shown that the NBS domain is composed of several functionally conservative motifs, which are always strictly ordered (DeYoung and Innes, 2006; Yue et al., 2016). We analyzed the conserved motifs in the NBS domain of NBS-LRR genes identified in this study. Five conserved motifs, P-loop, Kinase-2, Kinase-3, RNBS-C, and GLPL, were identified from the N-terminal to C-terminal regions of NBS domain (Figure 2A). These motifs displayed different degree of similarities among RNL, TNL, and CNL subclasses. P-loop and Kinase-2 motifs showed not only high similarities among the three subclasses but also high conservations within each subclass, compared with other motifs. However, the Kinase-3 motif showed distinctive differences among the three subclasses, but was conserved within each subclass. Notably, RNBS-C and GLPL motifs exhibit remarkable differences both among the three subclasses and within each subclass. In addition, unique amino acid sites could be used as preliminary labels to characterize subclass members without phylogenetic analysis (Figure 2A). For example, the fifth site alanine (A) in the P-loop motif, the second site proline (P) in the Kinase-2 motif, the first site asparagine (N) in the Kinase-3 motif, and the fourth site phenylalanine (F) in the GLPL motif could serve as preliminary labels to categorize RNL subclass members. For TNL subclass members, the second site glycin (G) in the P-loop motif and the 11th site aspartic acid (D) could be used as preliminary labels. Moreover, the sixth site cysteine (C) and seventh site tryptophan (W) in the RNBS-C motif could be used to identify CNL subclass members.
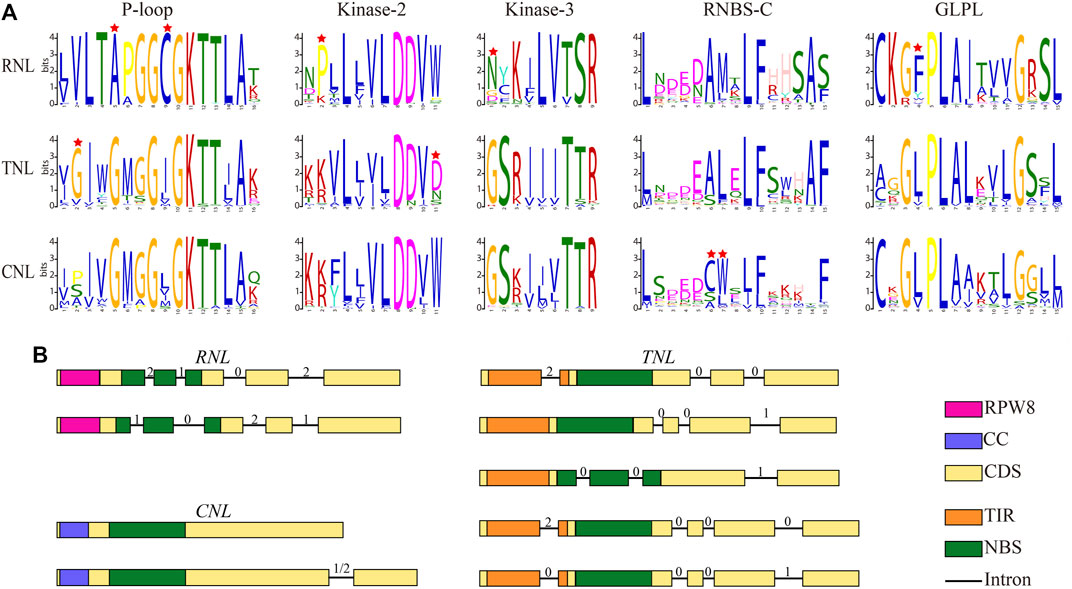
FIGURE 2. Conserved motifs and exon–intron structure models for the three NBS-LRR gene subclasses in Rosaceae genomes. (A) Amino acids of five conserved motifs. Conserved amino acids among CNL, TNL, and RNL subclass genes are labeled with a red star. (B) Exon-intron structure. Filled boxes represent exons and lines represent introns. The numbers on top represent the intron phase.
Diversity of NBS-LRR gene structure
Furthermore, we analyzed structural features of NBS-LRR genes identified in this study, including the number of introns, intron position, and intron phase (excluding 34 Po. micrantha NBS-LRR genes because the Po. micrantha genome was only assembled at the contig level). The number of introns was distinctively different in NBS-LRR genes of 11 Rosaceae species, ranging from 0 to 31, and the average number of introns in RNL, TNL, and CNL subclass members was 4.70, 4.76, and 1.43, respectively (Supplementary Table S2). In the RNL subclass, the majority of members had four introns, with the first two introns separating the NBS domain (Figure 2B). There were two types of intron phases in the RNL subclass: 2, 1, 0, 2 and 1, 0, 2, 1. In the CNL subclass, 438 members had no intron, while 339 members harbored 1 N-terminal intron and the intron phase was 1 or 2 (Figure 2B). In the TNL subclass, a total of 163, 283, and 172 members contained 3, 4, or 5 introns, respectively. Most 3-intron TNL subclass members had three types of intron phase: 2, 0, 0 with the first intron separating the TIR domain; 0, 0, 1 with three N-terminal introns; 0, 0, 1 with the first two introns separating the NBS domain. The majority of the 4-intron TNL subclass members had two types of intron phase (2, 0, 0, 0 and 0, 0, 0, 1), with the first intron separating the TIR domain (Figure 2B). These results indicate that NBS-LRR genes in Rosaceae species have subclass-specific characteristics that can be used to categorize CNL, TNL, and RNL subclass members.
Phylogenetic analysis of NBS-LRR genes
To explore the phylogenetic relationships and evolutionary history of NBS-LRR genes, phylogenetic analysis was carried out with the basal angiosperm Amborellla trichopoda NBS as outgroups. We found that three clades exactly represented the divergence of RNLs, TNLs, and CNLs (Supplementary Figure S1; Figure 3). All NBS-LRR genes fell into groups of corresponding subclasses without exception. By comparing the lengths of the three branches, it was possible to estimate that the RNL subclass had the lowest evolutionary rate than the others.
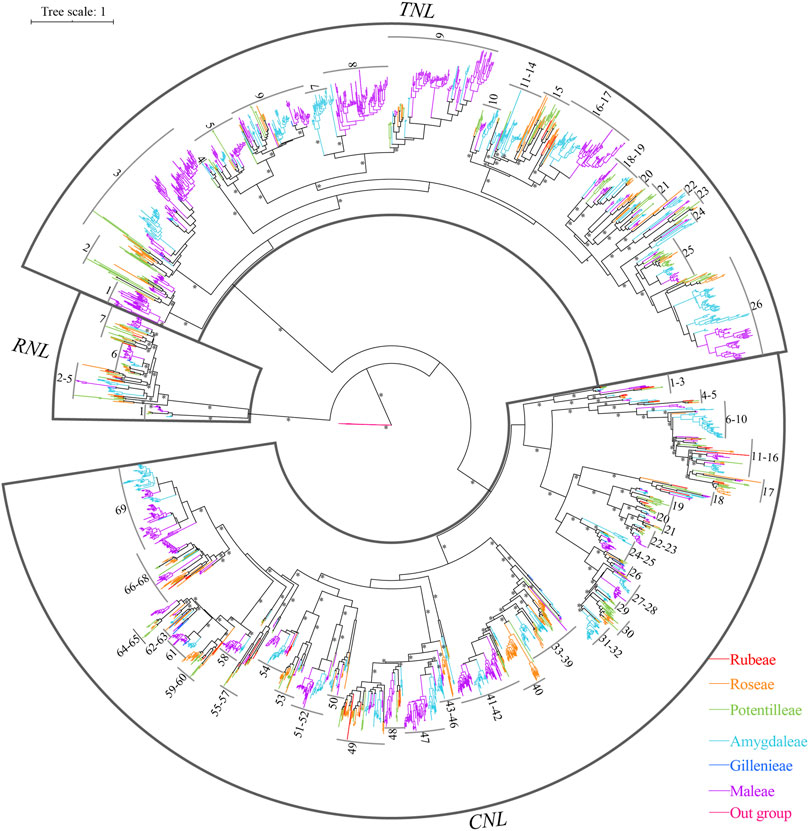
FIGURE 3. Phylogenetic relationships of NBS-LRR genes from Rosaceae genomes. NBS-LRR genes from distinctive plant tribes are indicated by different colors. Branch support values > 70% for basal nodes are indicated by an asterisk (*). The detailed phylogenetic trees are shown in Supplementary Figures S1, S2.
In addition, the reconstructed NBS-LRR gene phylogeny revealed 102 ancestral lineages of NBS-LRR genes, including 7 RNL lineages, 26 TNL lineages, and 69 CNL lineages (Figure 3; Supplementary Figure S2; Supplementary Table S3). Not all 12 Rosaceae species retained to the 102 ancestral lineages in their genomes. For example, Pr. armeniaca kept 67 lineages (3 RNLs, 21 TNLs, and 43 CNLs); Pr. persica maintained 65 lineages (4 RNLs, 20 TNLs, and 41 CNLs); Ro. chinensis had 56 lineages (7 RNLs, 18 TNLs, and 41 CNLs). By contrast, fewer NBS-LRR ancestral lineages were retained by G. trifoliate (4 RNLs, 4 TNLs, and 12 CNLs), Po. micrantha (3 RNLs and 19 CNLs), and Ru. occidentalis (4 RNLs, 3 TNLs, and 19 CNLs). Despite this, none of these 102 ancestral lineages was retained by all the 12 species. Lineages 1 and 6 of RNLs, as well as lineages 18, 21, and 68 of CNLs, were reserved in 11 of the 12 investigated species, indicating their evolutionary conservativeness; while lineages 9, 44, and 59 of CNLs were only found in one species (Ro. chinensis), indicating their evolutionary uniqueness.
We also observed species-specific expansion of NBS-LRR genes in the Rosaceae (Figure 4; Supplementary Figure S2; Supplementary Table S3). For example, the species-specific gene duplications have expanded the gene numbers of lineages 40, 49, 60, and 68 of the CNLs, and lineage 15 of the TNLs in Ro. chinensis, and lineages 7 of the RNLs in F. vesca. The species-specific expansion was also found in lineages 3 and 9 of the TNLs, and lineage 69 of the CNLs in Py. betulifolia. In the case of M. domestica, species-specific gene expansion was found in lineages 3, 8, and 9 of the TNL, and lineages 42 and 69 of the CNL subclass. As for M. baccata, there was species-specific gene expansion in lineages 3, 8, and 9 of the TNL, and lineage 69 of the CNL. These species-specific gene duplications have expanded the NBS-LRR numbers of 12 Rosaceae species. The previous research also found that the species-specific duplications has mainly contributed the recent expansion of NBS-LRR genes in five Rosaceae species (Zhong et al., 2015). In addition, independent gene loss events were evident in the evolutionary history of NBS-LRR genes in the Rosaceae, and none of the species maintained all 102 ancestral lineages.
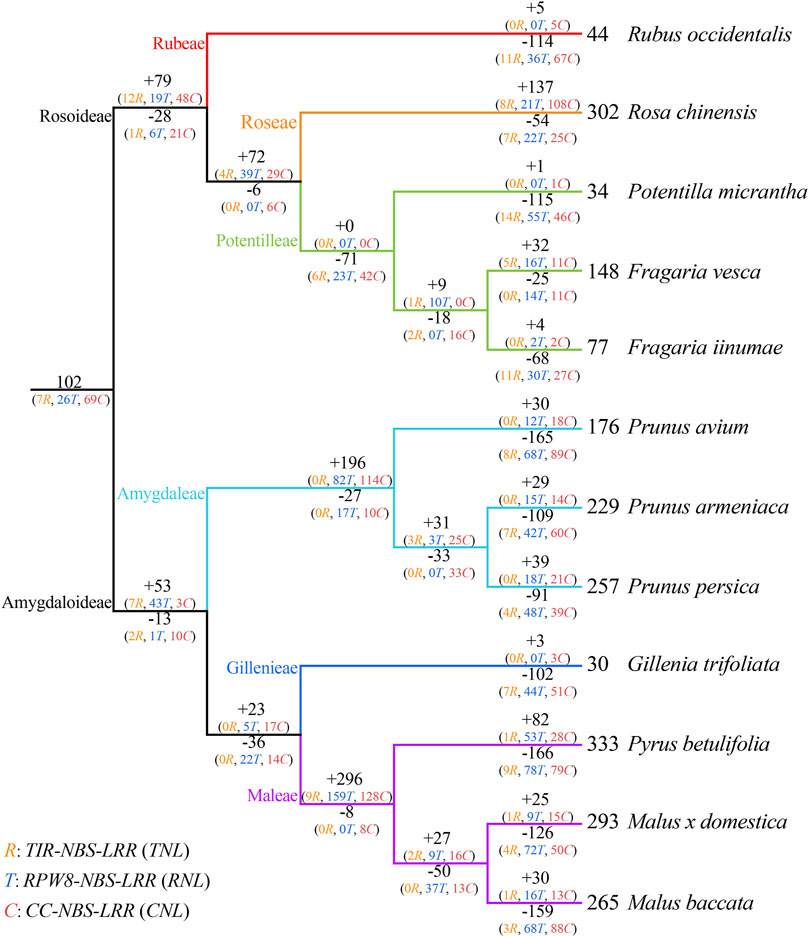
FIGURE 4. Duplication and loss events of NBS-LRR genes during Rosaceae evolution. Gene gains and losses are indicated by + or—symbols on each branch. Detailed information for gene gain and loss events is shown in Supplementary Figure S2.
Evolutionary patterns of NBS-LRR genes
To investigate the evolutionary patterns of NBS-LRR genes in the 12 Rosaceae species, the phylogenetic tree was reconciled with the species tree to recovered gene loss and duplication events that occurred during species speciation (Figure 4; Supplementary Figure S2; Supplementary Table S4). The number of common ancestors increased from 102 to 153 (+79/−28) before differentiation of the Rosoideae subfamily. The evolutionary pattern of NBS-LRR genes in Ru. occidentalis which diverged first, displayed an “expansion followed by contraction” evolutionary pattern, with gene losses outpacing gene duplications, resulting in only 44 NBS-LRR genes in its genome. The evolutionary pattern of NBS-LRR genes in Ro. chinensis was “continuous expansion”, and recent species-specific duplications contributed substantially to the number of NBS-LRR genes in the genome. Po. micrantha and F. iinumae shared a similar “first expansion and then constant contraction” pattern. In Po. micrantha, a large number of genes were lost recently, leaving in only 34 NBS-LRR genes in the current genome. In F. vesca, the evolutionary pattern was “expansion followed by contraction, then a further expansion”, resulting in more NBS-LRR genes than in the two closely related species Po. micrantha and F. iinumae.
The number of NBS-LRR genes increased from 102 to 142 (+53/−13) before the divergence of seven species in Amygdaloideae. Subsequently, NBS-LRR genes in the Prunus genus firstly underwent a sharp gene duplication (+196/−27), leading to an increase in the number of NBS-LRR genes to 311 in their common ancestor. Subsequently, all three species in the Prunus genus experienced recent abrupt gene losses, resulting in a shrinking in the number of NBS-LRR genes. Therefore, the NBS-LRR genes in the three Prunus species underwent an “early sharp expanding to abrupt shrinking” pattern. In addition, three Maleae species, Py. betulifolia, M. baccata, and M. domestica, shared a similar evolutionary patterns to those of Prunus species. The large number of gene duplications (+296/−8) experienced by the common ancestor of Maleae contributed to the large number of NBS-LRR genes, while the recent gene losses was responsible for the differences in NBS-LRR gene number among the three species. G. trifoliata exhibited a “first expansion and then contraction”pattern, and should have experienced more severe gene losses than gene duplications, resulting in only 30 NBS-LRR genes in its genome. These results suggest that gene duplication/loss events are the main factor explaining the distinctive differences of NBS-LRR gene number among Rosaceae species, and that NBS-LRR genes in the 12 Rosaceae species underwent dynamic and complex evolutionary processes.
Syntenic relationship of NBS-LRR genes in rosaceae genomes
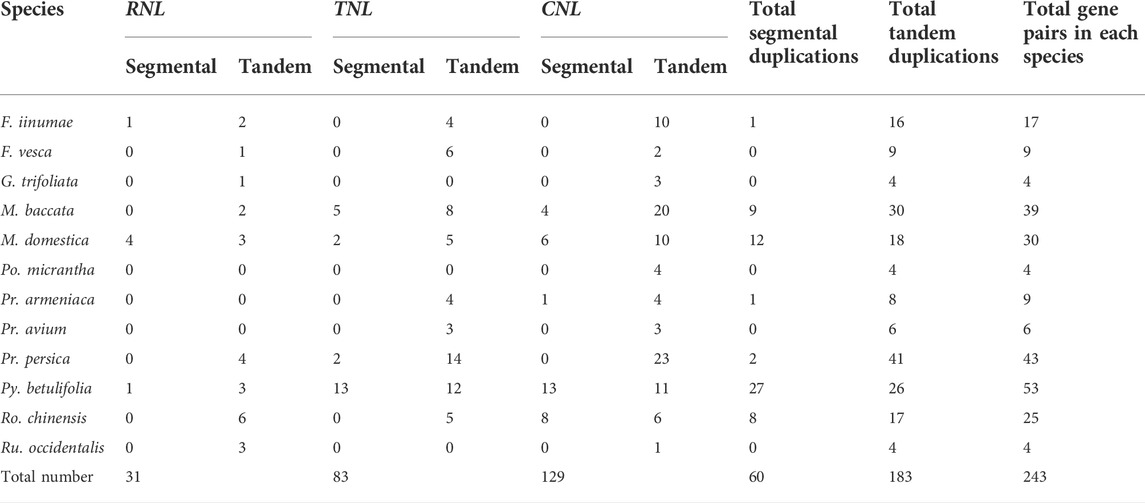
Intra-genomic synteny analysis was performed to uncover whether the NBS-LRR genes were derived from whole genome duplications (duplication of genes via an increase in ploidy), segmental duplications (copying of entire blocks of genes from one chromosome to another), tandem duplications (duplication of a gene via unequal crossing over between similar alleles) or ectopic duplications (duplication of individual or small groups of genes to an unlinked locus) (Leister, 2004; Panchy et al., 2016). And 243 gene pairs (i.e., 31 RNL pairs, 83 TNL pairs, and 129 CNL pairs) were identified (Figure 5; Table 2). The number of tandem duplication events of NBS-LRR genes was 183, considerably greater than the number of segmental duplication events (60 in total). The number of tandem duplications was higher in 11 of the 12 investigated species, with one exception of Ro. chinensis, in which 27 segmental duplication events and 26 tandem duplication events were identified. Interestingly, there were no segmental duplication events in F. vesca, G. trifoliata, and Ru. occidentalis. These results indicate that tandem duplication might be the main type of NBS-LRR gene duplications in the Rosaceae. Nevertheless, we speculate that other types of duplication may have occurred because the number of NBS-LRR genes in both F. vesca and Pr. armeniaca was higher than the number of NBS-LRR ancestral lineages, while only nine duplication events were identified.
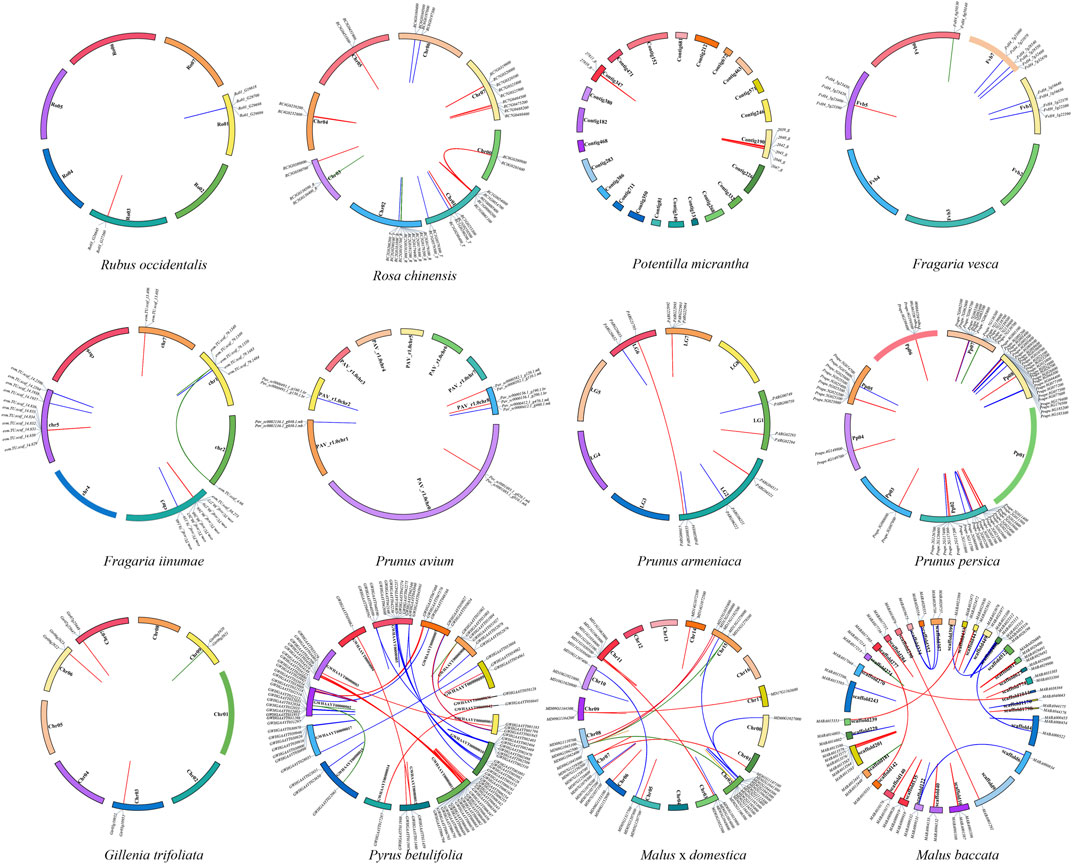
FIGURE 5. Localization and synteny of NBS-LRR genes in Rosaceae genomes. NBS-LRR genes in 12 Rosaceae species were mapped to different chromosomes/contigs/scaffolds. Gene pairs of RNLs, TNLs, and CNLs with a syntenic relationship are connected with green, blue and red lines, respectively.
Based on the results of evolutionary analysis, we also investigated collinear relationships of NBS-LRR genes between closely related Rosaceae species, and identified 425 syntenic gene pairs (i.e., 28 RNL pairs, 182 TNL pairs, and 215 CNL pairs; Figure 6 and Supplementary Table S5). Notably, a large number of syntenic gene pairs was found among Maleae and Prunus species. For example, there were 117 collinear gene pairs between Py. betulifolia and M. domestica, 94 between M. domestica and M. baccata, and 85 between Pr. armeniaca and Pr. avium. Furthermore, we found that the number of NBS-LRR genes and their genetic relationship might influence the number of syntenic gene pairs between closely related species. For instance, 22 syntenic gene pairs existed between F. iinumae and F. vesca, but only five pairs were found between F. iinumae and Pr. avium.
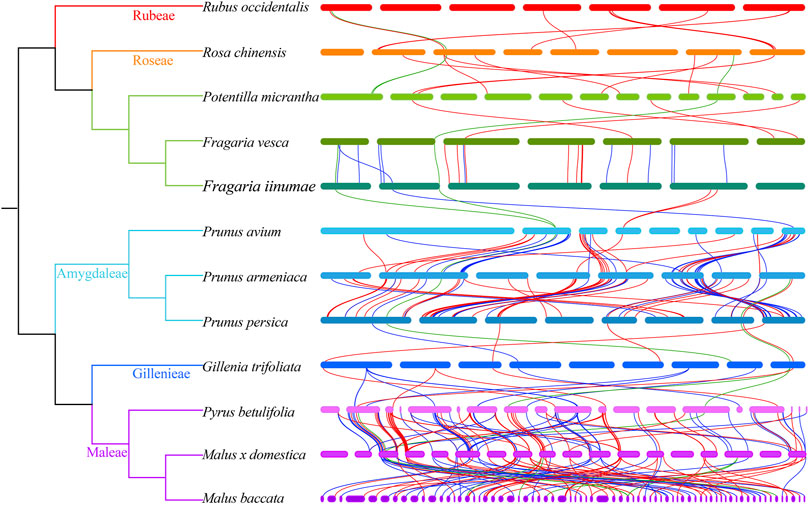
FIGURE 6. Collinearity of NBS-LRR genes between closely related Rosaceae species. The green, blue and red lines show the collinear gene pairs of RNLs, TNLs and CNLs between 12 Rosaceae species.
To detect the direction and intensity of selection, we calculated the Ka/Ks ratios of genes pairs in each subclass. As shown in Figure 7, most of the gene pairs of each subclass had had Ka/Ks values less than 1, which indicated that which indicated that most NBS-LRR genes were under purifying selection in the 12 Rosaceae species. However, 4 paralogs (2 TNLs and 2 CNLs) and 12 orthologs (1 RNL, 9 TNLs and 2 CNLs) had Ka/Ks ratios greater than 1, respectively, illustrating that these NBS-LRR genes were driven by positive selection. The Ka/Ks ratios showed highly significant difference among the three subclasses, with TNL genes having significantly greater average Ka/Ks values than those of RNLs and CNLs, demonstrating that the TNLs are subject to stronger diversifying selection and a faster evolutionary rate than the others.
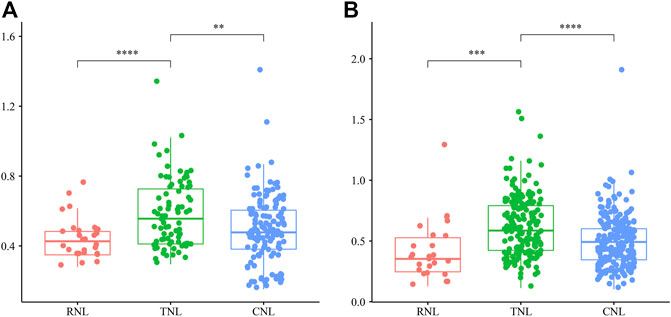
FIGURE 7. The Ka/Ks ratios of NBS-LRR gene pairs in 12 Rosaceae genomes. (A) The Ka/Ks ratios of intraspecies NBS-LRR pairs in three subclasses. (B) The Ka/Ks ratios of interspecies NBS-LRR pairs in three subclasses. In the boxplot, the middle line indicates the median, the box indicates the range of the 25 to 75th percentiles of the total data, the whiskers extend to data points less than 1.5 × IQR (interquartile range) away from the 1st/3rd quartile.
Discussion
Differences in the number of NBS-LRR genes in the rosaceae genomes
Previous studies have found that the number of NBS-LRR genes differs considerably between plant species, even in genetically close species or subspecies. For example, a study of NBS-LRR genes in 22 angiosperm genomes revealed prominent differences among species, with 571 NBS-LRR genes being identified in the M. truncatula genome, while only 88 in the Thellungiella salsuginea genome (Shao et al., 2016). In potato, a Solanaceae species, NBS-LRR genes were 1.75-fold more than those in the closely related tomato and pepper (Qian et al., 2017). Moreover, the number of NBS-LRR genes in maize was shown to be only a fourth of that in rice (Li et al., 2010). Studies on Oryza, Glycine and Gossypium also showed large differences in the number of NBS-LRR genes, not only among species, but also within species (Zhang et al., 2010). In the present study, we also found extreme differences in the number of NBS-LRR genes among the 12 Rosaceae genomes. For example, there are more than 300 NBS-LRR genes in each of Ro. chinensis and Py. betulifolia genomes, but only 30, 34, and 44 NBS-LRR genes in G. trifoliate, Po. micrantha, and Ru. occidentalis genomes, respectively (Figure 1; Table 1). It is noteworthy that the number of NBS-LRR genes in each species in the present study may be the lowest compared with previous studies. For example, Zhong et al. (2015) and Jia et al. (2015) identified 354 and 437 NBS-LRR genes in peaches, respectively, while we retained only 144 genes. Arya at al. (2014) and Zhong et al. (2015) reported 748 and 1015 NBS-LRR genes in apple, respectively, while we only preserved 293 for analysis. The two main reasons for this difference may be that we used different datasets in different researchers, and the other is that we only retained those genes with both N-terminal domain and NBS domain, while the previous study retained the genes containing only NBS or LRR domains. Several factors, such as genome size, natural selection, distribution range, and artificial selection, can influence the number of members in a plant gene family (Zhang et al., 2010). However, we found no specific relationship between the number of NBS-LRR genes and genome size in 12 Rosaceae species (Table 1). Rosaceae species with large genomes do not necessarily contain a large number of NBS-LRR genes. For example, Po. micrantha contains fewer NBS-LRR genes than F. vesca, Pr. armeniaca, and Pr. persica, despite having the largest genome (Table 1). Similar results have been reported in several plant families. In Fabaceae, the genome size of soybean is twice that of M. truncatula, but soybean contains fewer NBS-LRR genes than M. truncatula (Shao et al., 2014). Also, there is no relationship between the number of NBS-LRR genes and genome size in three Sapindaceae species (Zhou et al., 2020). In addition, the number of NBS-LRR genes in gramineous plants is not related to the number of protein-encoding genes (Li et al., 2010). In line with this finding, we found no correlation between the number of NBS-LRR genes and the number of protein-coding genes in the 12 Rosaceae species (Table 1).
Gene duplications and losses can cause gene expansion and contraction, thereby resulting in differences in the number of NBS-LRR genes among different species or subspecies. In Sapindaceae, the NBS-LRR genes of longan, yellowhorn, and A. yangbiense underwent different recent gene duplication/loss events, resulting in clear differences in the number of NBS-LRR genes in these three species (Zhou et al., 2020). Moreover, gene duplication/loss-induced differences in the number of NBS-LRR gene among species have been reported for Cucurbitaceae, Leguminous, Nightshade, Brassica, Gramineae, and Orchidaceae plants (Li et al., 2010; Lin et al., 2013; Shao et al., 2014; Li et al., 2016; Qian et al., 2017; Xue et al., 2020). Our results also indicate that species-specific gene duplication/loss events occurred in NBS-LRR gene evolution after diverging from the common ancestor. Consequently, the number of NBS-LRR genes differed between different species, even closely related species. For example, the number of NBS-LRR genes in Ro. chinensis increased rapidly due to recent species-specific gene duplication. On the contrary, the number of NBS-LRR genes in Ru. occidentalis is quite low due to abrupt gene loss events (Figure 1).
Four types of gene duplications, tandem duplications, ectopic duplications, whole-genome duplications, and segmental duplications, have been reported in NBS-LRR gene evolution (Leister, 2004). In Fabaceae, Brassicaceae, and Solanaceae, most NBS-LRR gene duplications are tandem duplications (Shao et al., 2014; Zhang et al., 2016; Qian et al., 2017). In D. catenatum and Phalaenopsis equestris, tandem and ectopic duplications are the main causes of NBS-LRR gene expansion (Xue et al., 2020). In current study, both tandem duplications and segmental duplications facilitated diversity and evolution of NBS-LRR genes Rosaceae species, with tandem duplications as the main factor. Our result was consistent with the previous study which also claimed tandem duplication played a major role in NBS-encoding gene expansion in the four Rosaceae species (Jia et al., 2015).
Accordingly, the differences in the number of NBS-LRR genes in the Rosaceae species might be related to distributions of each species in natural and cultivated systems. Rosaceae species possessing a large number of NBS-LRR genes are always distributed widely, and might have undergone frequent natural or artificial selection, resulting in high resistance to pathogens. For instance, F. iinumae is found only in northwestern Japan, and has fewer NBS-LRR genes presumably due to the relatively stable environment and pathogen diversity. Different from F. iinumae, F. vesca is mainly distributed in Europe, Asia, and North America. The wide planting area, complex growth environment, and multiple pathogens increase selection pressure for survival; therefore, more NBS-LRR genes are present in the F. vesca genome. Similarly, the number of NBS-LRR genes is also high in Maleae, Prunus, and Rosa species due to the extensive planting range (Figure 1; Table 1).
Evolutionary patterns of NBS-LRR genes in rosaceae species
NBS-LRR genes in angiosperms have evolved quickly in dynamic and diverse patterns. In M. truncatula, pigeon pea, common bean, and soybean, the evolutionary pattern of NBS-LRR genes is characterized by “consistent species-specific gene duplication” (Shao et al., 2014); in T. salsuginea, Capsella rubella, Brassica rapa, Arabidopsis lyrate, and A. thaliana, the pattern is “expansion first and then contraction” (Zhang et al., 2016). Even in closely related species, NBS-LRR genes underwent different evolutionary processes. For instance, NBS-LRR genes in yellowhorn underwent “expansion followed by contraction”, but the pattern was “expansion followed by contraction and a further expansion” for A. yangbiense and longan (Zhou et al., 2020). Using evolutionary analysis, the NBS-LRR ancestral lineages in 12 Rosaceae species were reconstructed in the present study, and their dynamic evolutionary patterns during species differentiation were traced. A total of 102 NBS-LRR ancestors were recovered, and they underwent species-specific evolution during divergence (Figure 4; Supplementary Figure S2; Supplementary Table S4).
Similar to Poaceae, Brassicaceae, and Sapindaceae plants (Li et al., 2010; Zhang et al., 2016; Zhou et al., 2020), the NBS-LRR genes in the Rosaceae displayed diverse evolutionary patterns (Figure 4; Supplementary Figure S2; Supplementary Table S4). For example, the evolutionary pattern of NBS-LRR genes in Ru. occidentalis, Po. micrantha, F. iinumae, and Pr. avium was “first expanded then contracted,” while that in Ro. chinensis was “continuous expansion.” Three Prunus species and three Maleae species shared an “early sharp expanding to abrupt shrinking” pattern. This evidence suggests that complex evolutionary patterns are the main reason for the differences in the number of NBS-LRR genes in surveyed Rosaceae plants.
Factors responsible for differences between NBS-LRR subclasses
NBS-LRR genes can be divided into CNL, TNL, and RNL subclasses (Shao et al., 2016; Zhang et al., 2016; Qian et al., 2017; Shao et al., 2019). In many plants, there are more CNLs than TNLs and RNLs. Shao et al. reported more CNLs than the other two subclasses in 19 of 22 angiosperm species (Shao et al., 2016). In addition, the proportion of CNL genes in the NBS-LRR gene family can be >90% in Phyllostachys heterocycle, B. distachyon, pepper, rice, maize, S. bicolor, millet (Setaria italic), banana (Musa acuminate), tomato, and sesame (Sesamum indicum) (Shao et al., 2016). In the present study, we found a differing number of CNLs, TNLs, and RNLs in Rosaceae genomes, with CNLs being the most prevalent (1139) and RNLs being the scarcest (133) (Figure 1 and Table 1).
There are two possible reasons for the differences in the number of NBS-LRR genes between the three subclasses, namely, the differing number of ancestral genes, and the complex pattern of genetic evolution among different subclasses. In five Brassicaceae plants (T. salsuginea, C. rubella, B. rapa, A. lyrate, and A. thaliana), 148 TNL, 70CNL, and 10 RNL ancestors eventually expanded into 478 TNL, 272CNL, and 32RNL genes (Zhang et al., 2016). In three Sapindaceae genomes (yellowhorn, longan, and A. yangbiense), the number of CNL ancestors is much greater than those of TNL ancestors and RNL ancestors, resulting in a much higher number of CNL genesthan TNL genes and RNL genes in extant species (Zhou et al., 2020). In three Solanaceae crop species (potato, tomato, and pepper), the number of CNL ancestors is also much greater than those of RNL ancestors and TNL ancestors, leading to a much higher number of CNL genes than TNL genes and RNL genes in extant species (Qian et al., 2017). In legumes, CNLs and TNLs have the same number of ancestral genes, but the number of CNL genes is higher than that of TNL genes due to the CNL subclass showing a higher gene expansion rate (Shao et al., 2014).
In the present study, the number of CNL, RNL, and TNL subclass genes also differed significantly. Based on phylogenetic analysis, common ancestors of NBS-LRR genes (7 RNL ancestors, 26 TNL ancestors, and 69 CNL ancestors) were identified in 12 Rosaceae species (Figure 3; Supplementary Figure S2). The ancestors of each subclass underwent complex evolutionary patterns in each species. Except for Ru. occidentalis and Po. micrantha, the number of RNL genes is considerably lower than that of CNL and TNL genes in Rosaceae species, mainly because of the much lower number of RNL ancestors than that of CNL and TNL ancestors. The TNL lineage may have been lost in Po. micrantha during the recent divergence process (Figure 1; Table 1). In addition, the number of CNL and TNL genes is not remarkably different between the two Fragaria species (i.e., F. iinumae and F. vesca), which might be because CNL genes underwent more gene loss events and TNL genes underwent more gene duplication events. A similar situation occurred in Pr. avium, Pr. armeniaca, Py. betulifolia, and M. baccata, resulting in more TNL genes than CNL genes, or no clear differences (Figure 4; Supplementary Figure S2; Supplementary Table S4). Overall, the discrepancies in the number of CNL, RNL, and TNL subclass genes in Rosaceae species are mainly attributed to prominent differences in the number of ancestral genes and gene duplication/loss events.
In conclusion, genome-wide comparative analysis of NBS-LRR genes of 12 Rosaceae species were performed. In total, 2188 genes were identified, with the number varied considerably among different taxa. The NBS-LRR genes in the 12 Rosaceous species were classified into three subclasses, with the number of CNLs being the highest and RNLs the lowest. A total of 102 ancestral genes were reconciled in the common ancestor of the 12 Rosaceae species. The analysis of gene duplication/loss events revealed the NBS-LRR genes of 12 Rosaceae species exhibited dynamic and distinct evolutionary patterns in the 12 Rosaceae species.
Data availability statement
The original contributions presented in the study are included in the article/Supplementary Material, further inquiries can be directed to the corresponding authors.
Author contributions
LG, YW, and RZ planned and designed the research; LG and RZ obtained and analyzed the data; CY and HZ participated in the data analysis; LG and YW drafted the manuscript; RZ complemented the writing paper. All authors have read and agreed to the published version of the manuscript.
Funding
This work was supported by the Basic Research Project of Natural Science in Shaanxi Province (2022JQ-182).
Conflict of interest
The authors declare that the research was conducted in the absence of any commercial or financial relationships that could be construed as a potential conflict of interest.
Publisher’s note
All claims expressed in this article are solely those of the authors and do not necessarily represent those of their affiliated organizations, or those of the publisher, the editors and the reviewers. Any product that may be evaluated in this article, or claim that may be made by its manufacturer, is not guaranteed or endorsed by the publisher.
Supplementary material
The Supplementary Material for this article can be found online at: https://www.frontiersin.org/articles/10.3389/fgene.2022.1052191/full#supplementary-material
References
Arya, P., Kumar, G., Acharya, V., and Singh, A. K. (2014). Genome-wide identification and expression analysis of NBS-encoding genes in Malus x domestica and expansion of NBS genes family in Rosaceae. PLoS One 9 (9), e107987. doi:10.1371/journal.pone.0107987
Bhar, A., Chakraborty, A., and Roy, A. (2021). Plant responses to biotic stress: Old memories matter. Plants (Basel) 11 (1), 84. doi:10.3390/plants11010084
Bonardi, V., Tang, S. J., Stallmann, A., Roberts, M., Cherkis, K., and Dangl, J. L. (2011). Expanded functions for a family of plant intracellular immune receptors beyond specific recognition of pathogen effectors. Proc. Natl. Acad. Sci. U. S. A. 108 (39), 16463–16468. doi:10.1073/pnas.1113726108
Chen, K., Durand, D., and Farach-Colton, M. (2000). Notung: A program for dating gene duplications and optimizing gene family trees. J. Comput. Biol. 7 (3-4), 429–447. doi:10.1089/106652700750050871
Crooks, G. E., Hon, G., Chandonia, J. M., and Brenner, S. E. (2004). WebLogo: A sequence logo generator. Genome Res. 14 (6), 1188–1190. doi:10.1101/gr.849004
Dangl, J. L., and Jones, J. D. (2001). Plant pathogens and integrated defence responses to infection. Nature 411, 826–833. doi:10.1038/35081161
DeYoung, B. J., and Innes, R. W. (2006). Plant NBS-LRR proteins in pathogen sensing and host defense. Nat. Immunol. 7 (12), 1243–1249. doi:10.1038/ni1410
Gassmann, W., Hinsch, M. E., and Staskawicz, B. J. (2010). The Arabidopsis RPS4 bacterial-resistance gene is a member of the TIR-NBS-LRR family of disease-resistance genes. Plant J. 20 (3), 265–277. doi:10.1046/j.1365-313x.1999.t01-1-00600.x
He, H. G., Zhu, S. Y., Zhao, R. H., Jiang, Z. G., Ji, Y. Y., Ji, J., et al. (2018). Pm21, encoding a typical CC-NBS-LRR protein, confers broad-spectrum resistance to wheat powdery mildew disease. Mol. Plant 11 (6), 879–882. doi:10.1016/j.molp.2018.03.004
Jia, Y., Yuan, Y., Zhang, Y., Yang, S., and Zhang, X. (2015). Extreme expansion of NBS-encoding genes in Rosaceae. BMC Genet. 16, 48. doi:10.1186/s12863-015-0208-x
Jones, J. D., and Dangl, J. L. (2006). The plant immune system. Nature 444 (7117), 323–329. doi:10.1038/nature05286
Kato, H., Saito, T., Ito, H., Komeda, Y., and Kato, A. (2014). Overexpression of the TIR-X gene results in a dwarf phenotype and activation of defense-related gene expression in Arabidopsis thaliana. J. Plant Physiol. 171 (6), 382–388. doi:10.1016/j.jplph.2013.12.002
Leister, D. (2004). Tandem and segmental gene duplication and recombination in the evolution of plant disease resistance gene. Trends Genet. 20 (3), 116–122. doi:10.1016/j.tig.2004.01.007
Li, J., Ding, J., Zhang, W., Zhang, Y. L., Tang, P., Chen, J. Q., et al. (2010). Unique evolutionary pattern of numbers of gramineous NBS-LRR genes. Mol. Genet. Genomics 283 (5), 427–438. doi:10.1007/s00438-010-0527-6
Li, T., Zhang, Q., Jiang, X., Li, R., Dhar, N., Zhang, Y., et al. (2021). Cotton CC-NBS-LRR gene GbCNL130 confers resistance to verticillium vilt across different speciesFrequent loss of lineages and deficient duplications accounted for low copy number of disease resistance genes in Cucurbitaceae. Front. Plant SciBMC Genomics 1214, 695691335. doi:10.3389/fpls.2021.695691Lin10.1186/1471-2164-14-335
Longhi, S., Giongo, L., Buti, M., Surbanovski, N., Viola, R., Velasco, R., et al. (2014). Molecular genetics and genomics of the Rosoideae: State of the art and future perspectives. Hortic. Res. 1, 381–392. doi:10.1038/hortres.2014.1
Ma, J., Lei, C. L., Xu, X. T., Hao, K., Wang, J. L., Cheng, Z. J., et al. (2015). Pi64, Encoding a novel CC-NBS-LRR protein, confers resistance to leaf and neck blast in rice. Mol. Plant. Microbe. Interact. 28 (5), 558–568. doi:10.1094/MPMI-11-14-0367-R
McHale, L., Tan, X. P., Koehl, P., and Michelmore, R. W. (2006). Plant NBS-LRR proteins: Adaptable guards. Genome Biol. 7 (4), 212. doi:10.1186/gb-2006-7-4-212
Meyers, B. C., Kaushik, S., and Nandety, R. S. (2005). Evolving disease resistance genes. Curr. Opin. Plant Biol. 8 (2), 129–134. doi:10.1016/j.pbi.2005.01.002
Minh, B. Q., Nguyen, M. A. T., and Haeseler, A, V. (2013). Ultrafast approximation for phylogenetic bootstrap. Mol. Biol. Evol. 30 (5), 1188–1195. doi:10.1093/molbev/mst024
Nandety, R. S., Caplan, J. L., Cavanaugh, K., Perroud, B., Wroblewski, T., Michelmore, R. W., et al. (2013). The role of TIR-NBS and TIR-X proteins in plant basal defense responses. Plant Physiol. 162 (3), 1459–1472. doi:10.1104/pp.113.219162
Panchy, N., Lehti-Shiu, M., and Shiu, S. H. (2016). Evolution of gene duplication in plants. Plant Physiol. 171 (4), 2294–2316. doi:10.1104/pp.16.00523
Qian, L. H., Zhou, G. C., Sun, X. Q., Lei, Z., Zhang, Y. M., Xue, J. Y., et al. (2017). Distinct patterns of gene gain and loss: Diverse evolutionary modes of NBS-encoding genes in three Solanaceae crop species. G3 (Bethesda) 7 (5), 1577–1585. doi:10.1534/g3.117.040485
Shao, Z. Q., Xue, J. Y., Wang, Q., Wang, B., and Chen, J. Q. (2019). Revisiting the origin of plant NBS-LRR genes. Trends Plant Sci. 24, 9–12. doi:10.1016/j.tplants.2018.10.015
Shao, Z. Q., Xue, J. Y., Wu, P., Zhang, Y. M., Wu, Y., Hang, Y. Y., et al. (2016). Large-scale analyses of angiosperm nucleotide-binding site-leucine-rich repeat genes reveal three anciently diverged classes with distinct evolutionary patterns. Plant Physiol. 170, 2095–2109. doi:10.1104/pp.15.01487
Shao, Z. Q., Zhang, Y. M., Hang, Y. Y., Xue, J. Y., Zhou, G. C., Wu, P., et al. (2014). Long-term evolution of nucleotide-binding site-leucine-rich repeat genes: Understanding gained from and beyond the legume family. Plant Physiol. 166, 217–234. doi:10.1104/pp.114.243626
Wang, S., Wang, X., Zhang, R., Liu, Q., Sun, X., Wang, J., et al. (2022). Identification and fine mapping of RppM, a southern corn rust resistance gene in maize. Front. Plant Sci. 13, 1057. doi:10.3389/fpls.2020.01057
Wang, Y. P., Tang, H. B., Debarry, J. D., Tan, X., Li, J. P., Wang, X. Y., et al. (2012). MCScanX: A toolkit for detection and evolutionary analysis of gene synteny and collinearity. Nucleic Acids Res. 40, e49. doi:10.1093/nar/gkr1293
Xue, J. Y., Zhao, T., Liu, Y., Zhang, Y. X., Zhang, G. Q., Chen, H. F., et al. (2019). Genome-wide analysis of the nucleotide binding site-leucine-rich repeat genes of four orchids revealed extremely low numbers of disease resistance genes. Front. Genet. 10, 1286. doi:10.3389/fgene.2019.01286
Zhang, M. P., Wu, Y. H., Lee, M. K., Liu, Y. H., Rong, Y., Santos, T. S., et al. (2010). Numbers of genes in the NBS and RLK families vary by more than four-fold within a plant species and are regulated by multiple factors. Nucleic Acids Res. 38, 6513–6525. doi:10.1093/nar/gkq524
Zhang, Y. M., Shao, Z. Q., Wang, Q., Hang, Y. Y., Xue, J. Y., Wang, B., et al. (2016). Uncovering the dynamic evolution of nucleotide-binding site-leucine-rich repeat (NBS-LRR) genes in Brassicaceae. J. Integr. Plant Biol. 58, 165–177. doi:10.1111/jipb.12365
Zhong, Y., Yin, H., Sargent, D. J., Malnoy, M., and Cheng, Z. M. (2015). Species-specific duplications driving the recent expansion of NBS-LRR genes in five Rosaceae species. BMC Genomics 16 (1), 77. doi:10.1186/s12864-015-1291-0
Zhong, Y., Zhang, X., and Cheng, Z. M. (2018). Lineage-specific duplications of NBS-LRR genes occurring before the divergence of six Fragaria species. BMC Genomics 19 (1), 128. doi:10.1186/s12864-018-4521-4
Keywords: Rosaceae, NBS-LRR, evolutionary patterns, phylogenetic analysis, gene duplication/loss
Citation: Guo L, You C, Zhang H, Wang Y and Zhang R (2022) Genome-wide analysis of NBS-LRR genes in Rosaceae species reveals distinct evolutionary patterns. Front. Genet. 13:1052191. doi: 10.3389/fgene.2022.1052191
Received: 23 September 2022; Accepted: 26 October 2022;
Published: 10 November 2022.
Edited by:
Madhav P. Nepal, South Dakota State University, United StatesReviewed by:
Zhu-Qing Shao, Nanjing University, ChinaAnirban Bhar, Ramakrishna Mission Vivekananda Centenary College, India
Preeti Arya, Institute of Microbial Technology (CSIR), India
Xiaochuan Sun, Huaiyin Institute of Technology, China
Copyright © 2022 Guo, You, Zhang, Wang and Zhang. This is an open-access article distributed under the terms of the Creative Commons Attribution License (CC BY). The use, distribution or reproduction in other forums is permitted, provided the original author(s) and the copyright owner(s) are credited and that the original publication in this journal is cited, in accordance with accepted academic practice. No use, distribution or reproduction is permitted which does not comply with these terms.
*Correspondence: Yukun Wang, d2FuZ3l1X2t1bjFAMTYzLmNvbQ==; Rui Zhang, cnVpemhhbmdAbndhZnUuZWR1LmNu
†These authors have contributed equally to this work
 Liping Guo
 Chen You1†
 Yukun Wang
 Rui Zhang