 Douglas Batista da Costa1
 Robson Borges de Lima2*
 Rinaldo L. Caraciolo Ferreira3Alessandro de Paula1Cinthia Pereira de Oliveira2José A. Aleixo da Silva3
 Joselane P. Gomes2Mariana M. M. Santana2Ana Luisa L. Pereira1
- 1Departamento de Ciências Florestais, Universidade Estadual do Sudoeste da Bahia, Vitória da Conquista, Brazil
- 2Departamento de Engenharia Florestal, Universidade do Estado do Amapá, Macapá, Brazil
- 3Departamento de Ciência Florestal, Universidade Federal Rural de Pernambuco, Recife, Brazil
The Caatinga, a seasonally dry tropical forest in northeastern Brazil, is notable for its biodiversity and high proportion of endemic plants adapted to its semi-arid environment. Among its prominent tree species, Myracrodruon urundeuva (Aroeira) stands out due to its extensive distribution and economic value. Despite its significance, little is known about the environmental factors influencing its distribution. This study uses species distribution modeling (SDM) to assess the current and potential distribution of M. urundeuva and its habitat suitability under various climate change scenarios. Utilizing models like GLM, GAM, and BRT, and MaxEnt, the research analyzes georeferenced occurrence data and bioclimatic variables (selected by the variance inflation factor) from precipitation and temperature metrics. Our findings indicate that M. urundeuva is projected to experience relative stability or slight expansion in suitable habitats under future climate scenarios, including the pessimistic SSP585 scenario. However, localized habitat losses may occur, particularly in certain regions and timeframes, highlighting the complex and regionally variable impacts of climate change. This study emphasizes the need for localized and regional action plans to mitigate climate change impacts on M. urundeuva’s habitats. Conservation efforts should target areas identified as stable, ensuring the species’ resilience against escalating climate threats, thereby preserving one of its critical habitats within the Caatinga.
1 Introduction
Climate is one of the main drivers that delineates and influences biodiversity, geographic distribution, and the occurrence of plant species on a global scale. There is a latitudinal pattern especially in the tropics indicating that many plant species can be seriously affected by climate changes (Liang et al., 2022). However, there are still few approaches addressing why tropical species are more vulnerable to climate changes (Menezes-Silva et al., 2019), particularly those in arid and dry climate areas, which are strongly influenced by climatic seasonality. These areas in Brazil are almost exclusively located in the northeastern region and are predominantly dominated by Caatinga vegetation.
The Caatinga vegetation is a phytogeographic domain classified as a biodiversity hotspot and falls under the category of seasonally dry tropical forest (STDF) (Banda-R et al., 2016; Pennington et al., 2018). The hot-arid and seasonal climate is the main underlying mechanism for the endemism of many plant species (da Silva et al., 2017b). Its ecological processes, such as energy balance, CO₂ exchange, and water use efficiency, have been the focus of recent studies, highlighting its critical role in the carbon and hydrological cycles (da Silva et al., 2017a; Mendes et al., 2020; Carneiro et al., 2025). For instance, the efficiency of water use by Caatinga vegetation underscores its adaptation to semi-arid conditions, further corroborated by satellite-based assessments of regional evapotranspiration and productivity (de Oliveira et al., 2023). These findings emphasize the ecological importance of Caatinga in mitigating climate change impacts through its resilience and resource optimization strategies (Moura et al., 2023).
Approximately 1,000 vascular plant species have been recorded in this region (Fernandes et al., 2020), among which M. urundeuva, regionally known as Aroeira, is one of the most well-known. It has become a highly sought-after species in the Caatinga due to its larger size for the production of firewood, stakes, and fence posts. It has geographical distribution in the Cerrado and a high resilience capacity in areas with long periods of water scarcity, high temperatures, and poor soils (Gariglio et al., 2010). Given its wide occurrence, M. urundeuva significantly contributes to nutrient cycling by releasing organic matter and nutrients back into the soil as they develop, mature, and decompose, improving soil fertility and enabling the growth of other plant species. Additionally, it plays a role in erosion control. For example, the large root systems of the species help stabilize the soil and prevent erosion on slopes or particularly in areas with loose soils.
Despite its importance and current legal protection against cutting (Normative Ordinance No. 83, Ibama—1991), it is among the most threatened and least studied forest species, and as a result it may be listed as an endangered species. Recent research shows that some species in tropical ecosystems have already experienced a higher frequency of local extinctions associated with climate changes and are expected to have reduced physiological temperature tolerance (Zurell et al., 2020a; Grinder and Wiens, 2023; Bedair et al., 2024). On the other hand, no studies have yet been conducted to investigate the effects of climate change on M. urundeuva. This is likely because arid ecosystems are some of the least researched regions in the world for ecological niche modeling of plant species (Bedair et al., 2023).
The ecological niche modeling or species distribution modeling (SDM) approach is crucial for understanding the niche and predicting the distribution of many plant species, indicating areas of potential occurrence and projecting their possible future distribution changes on a landscape scale (Guisan et al., 2017; Zurell et al., 2020a). The results of SDMs can be widely used to guide management and conservation strategies for threatened areas, including direct objectives to mitigate the effects of climate change (Guisan et al., 2013; Pecchi et al., 2020). SDMs are therefore the most commonly used spatial modeling technique to predict how global changes will affect biodiversity. This increase in SDM research is likely due to the growing accessibility of digital data available on platforms and user-friendly software solutions (Elith et al., 2020).
Recent studies in arid and desert environments have concluded that species distribution modeling methods have been successful, providing useful information on the direct effect of bioclimatic factors on the occurrence and potential distribution of local plants (Santos e Silva et al., 2019; La Montagna et al., 2023; Zaiats et al., 2024). Rodrigues et al. (2015) suggested significant advances on regional scales, indicating a significant influence of temperature and precipitation metrics on the distribution of three species in the Caatinga, including M. urundeuva. However, despite these advances, approaches to SDM in Caatinga plants, especially regarding suitable habitats for M. urundeuva under climate change scenarios, are still incipient.
Understanding environmental factors and mapping species’ geographic distributions over time and space through spatial models is currently one of the most practical methods to assess the potential effects of future climate changes on species distribution areas (Guisan and Thuiller, 2005; Elith and Leathwick, 2009). SDMs have been significantly improved in recent years through the use of artificial intelligence tools (i.e., machine learning) and other algorithms that can incorporate continuous spatio-temporal information on key environmental factors, thus improving their use and accuracy (Naimi and Araújo, 2016; Raes and Aguirre-Gutiérrez, 2018). It is important to emphasize that integrating bioclimatic remote sensing data into SDMs can enhance spatial prioritization decisions for conservation planning, as effective habitat management needs to consider other structural environmental variables beyond climate to address appropriate habitat characteristics for relevant management actions (Tuanmu and Jetz, 2015; Randin et al., 2020). These habitat characteristics are important to spatially inform conservation planning and management decisions to sustain forest biodiversity, especially when considering extensive areas such as the Caatinga.
Herein, considering the wide occurrence of M. urundeuva in the Caatinga, we aim to evaluate how climate changes affect its potential distribution range. Specifically, the objectives were: (a) to model the current suitable potential habitats for this species; (b) to study the effects of climate changes on its current range, using an ensemble model of four algorithms for 2041–2060 and 2061–2080, under the most optimistic and pessimistic climate change scenarios; and (c) to assess future changes in gain and loss of area for this species. We conducted this study with the aim of providing new insights aimed at guiding management and protecting plants with high potential threatened by the effects of climate change in this rich region of Brazil.
2 Materials and methods
2.1 Study area
The scope of this study encompasses the territory of the Caatinga phytogeographic domain, classified as seasonally dry tropical forests (SDTF) (Pennington et al., 2018; Moonlight et al., 2021), located in the northeastern region of Brazil (Figure 1). It covers an area of 862,818 km2, corresponding to 18% of the Brazilian territory. The predominant climate of the region according to the Köppen climate classification (Alvares et al., 2013), is semi-arid (BSh), with patches of tropical climate with dry summers (As) and tropical climate with alternating seasons (Am). Some regions can also be classified as hot and dry, with the rainy season occurring between summer and autumn (da Silva et al., 2017b).
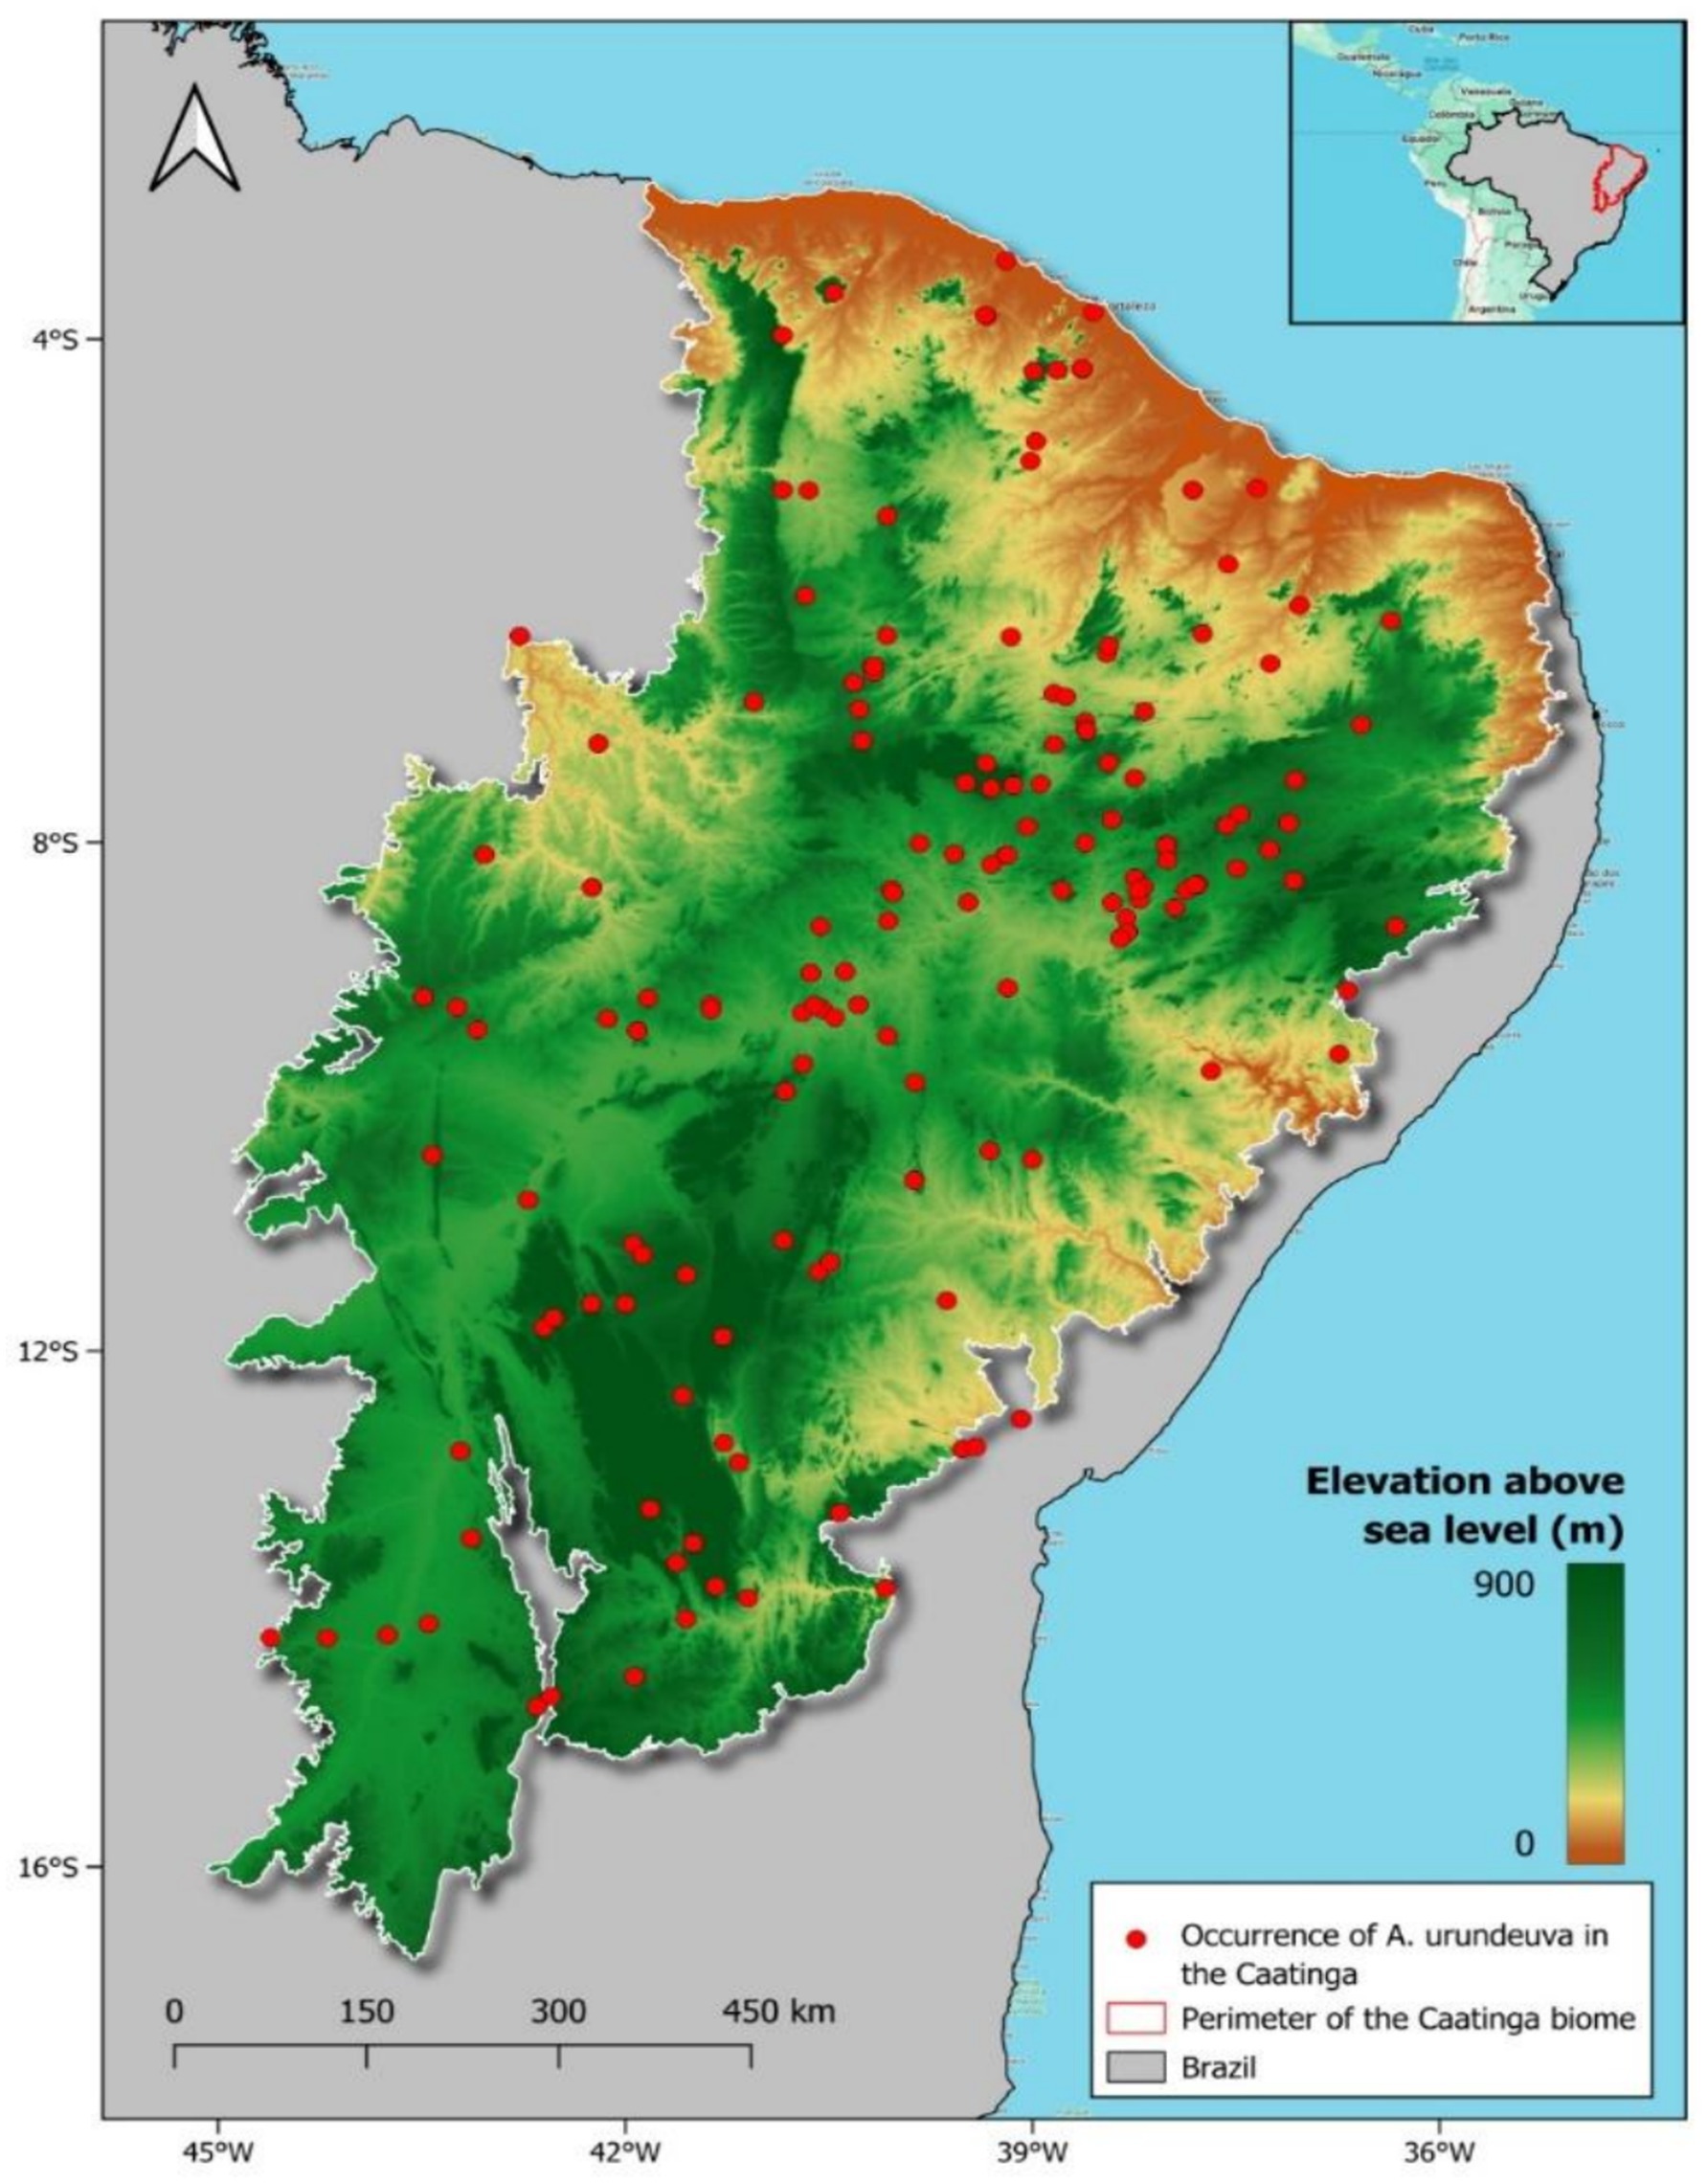
Figure 1. Study area—phytogeographic domain of the Caatinga in Northeast Brazil. The elevation range reported in the legend is for the entire domain that corresponds to the occurrence of the seasonally dry tropical forest (SDTF).
The average annual precipitation is around 800 mm year−1, with well-defined dry and rainy seasons, also presenting high annual and monthly rates of solar radiation and potential evapotranspiration (Martins et al., 2019). The average temperature in the Caatinga is high, ranging between 25°C and 30°C. However, temperatures in mountainous regions can be lower, and precipitation can be higher. Thus, the Caatinga is considered a diverse phytogeographic domain, presenting variations in topography, soils, climate, and vegetation (da Silva et al., 2017b). Due to the limited availability of robust meteorological data from many locations in the northeastern region of Brazil, temporal climatological summaries could not be produced. To overcome this, spatially explicit maps of the selected bioclimatic variables were generated, providing a detailed representation of climatic variation across the study region. These maps are included as Supplementary Table 1 and Supplementary Figure 1 to enhance the contextual understanding of the region’s climate.
The soils in the Caatinga exhibit low natural fertility, low organic matter content, and reduced water retention capacity. The region has a variety of soil orders, commonly including Neosols, Latosols, Planosols, Cambisols, Argisols, and Luvisols (Marques et al., 2014).
2.2 Species occurrence data
We compiled a database with 1.416 georeferenced occurrence (presence) information of the tree species locally known as Aroeira—M. urundeuva, obtained from the Global Biodiversity Information Facility—GBIF,1 using the rgbif package 3.7.5 (Chamberlain and Boettiger, 2017). Data with uncertain coordinates, missing latitude or longitude, marked as NA (not available), were eliminated using the dplyr 1.0.10 (Wickham et al., 2023) and tidyr 1.3.0 (Wickham et al., 2024) packages. Duplicate occurrences were also excluded to reduce the effects of spatial autocorrelation by trimming records within 5 km of individual occurrence points using the R spThin package (Aiello-Lammens et al., 2019). These procedures resulted in 516 occurrence points for the species. This step was crucial to ensure that the model accurately reflects the climatic conditions of the Caatinga domain. Data from occurrences in the Cerrado or tropical savannas might represent individuals of M. urundeuva persisting under distinct climatic conditions, which could introduce biases and fail to represent the ecological and environmental characteristics specific to Caatinga populations (Guisan et al., 2017).
An accessible region delimited at the scale of the phytogeographic domain was extended using a buffer radius of 100 km around each occurrence point. Subsequently, we simulate 1,000 background points. Each background point within was randomly allocated within a grid cell (i.e., 1 × 1 km) using the spThin package (Aiello-Lammens et al., 2019), based on the methodology proposed by Erfanian et al. (2021) to avoid potential modeling bias related to absent data in model calibration. Different approaches exist for creating background or pseudo-absence data (Phillips et al., 2009; Barbet-Massin, 2012; Kramer-Schadt et al., 2013), although there remains room for further development in this field, and more clear recommendations for users would certainly be useful (Zurell et al., 2020a).
2.3 Acquisition and pre-processing of geospatial variables
We used the 19 bioclimatic covariates from WorldClim2 (Fick and Hijmans, 2017) with a resolution of 2.5 arc minutes to develop the spatial model.
Before selecting the bioclimatic layers by the variance inflation factor (VIF), we proceeded with selecting all 19 layers individually for the limit of the study area, represented by the Caatinga Biome polygon. This procedure was essential to ensure that any uncertainty about relevant biological aspects of the species was noticed. We took special care when dealing with quarterly variables, ensuring they were considered carefully to avoid any undue influence on the modeling (Booth, 2022). Next, we used the variance inflation factor (VIF) test to identify strong correlations between variables and avoid issues related to multicollinearity in order to mitigate and assess the effect of high spatial correlation among the 19 bioclimatic variables. We then eliminated the least significant bioclimatic variable from each pair with an absolute correlation greater than 0.8 using the R “usdm” package (Naimi, 2023). Additionally, we excluded variables with a VIF greater than a threshold of 10 from subsequent analyses. As a result, nine variables contributed to the current potential distribution of M. urundeuva, namely: (1) Isothermality (Bio 2/Bio 7) (×100) (Bio 3): Reflects thermal stability throughout the year; (2) Temperature seasonality (standard deviation ×100) (Bio 4): Measures the annual temperature amplitude; (3) Annual temperature range (Bio 5–Bio 6) (Bio 7): Difference between the maximum temperature of the warmest month and the minimum temperature of the coldest month, represents thermal extremes; (4) Mean temperature of wettest quarter (Bio 8): Indicates thermal conditions during periods of higher precipitation; (5) Mean temperature of driest quarter (Bio 9): Reflects thermal conditions during periods of lower precipitation; (6) Annual precipitation (Bio 12): Represents the total precipitation volume over the year; (7) Precipitation seasonality (coefficient of variation) (Bio 15): Measures variability in precipitation throughout the year; (8) Precipitation of warmest quarter (Bio 18): Quantifies rainfall volume in the warmest months; and (9) Precipitation of coldest quarter (Bio 19): Quantifies rainfall volume in the coldest months. These variables represent critical climatic aspects, such as thermal stability, extremes of temperature and precipitation, and seasonal variations, which influence the habitat suitability for M. urundeuva. Further details about these variables can be found in the WorldClim documentation (Supplementary Table 1 and Supplementary Figure 1).
All selected spatial covariates were pre-processed using the QGIS and R 4.2.1 software (R Core Team, 2023), and were reprojected to the coordinate system of each sample point area to extract in situ values of each variable for spatial model calibration and to optimize the accuracy of the final figure and map areas. The first preparatory step in creating the spatial prediction was to assemble a data matrix with the location (longitude and latitude) of each sample point. Then, all raster files of geospatial covariates were plotted and stacked one by one at the located points. Geospatial metrics were extracted at each sample point using the raster::extract function from the raster package (Hijmans et al., 2021) in R for each raster file of the geospatial covariates. This information was stored and saved in a final matrix and used as predictor variables in the model.
2.4 Spatial modeling and ensemble forecasts
We employ four algorithms from the SDM package (Naimi and Araújo, 2016): generalized linear model (GLM), generalized additive model (GAM), maximum entropy (MaxEnt), and boosted regression trees (BRT) These algorithms are widely used in species distribution models and report feasible results for pseudo-absence data (Raes and Aguirre-Gutiérrez, 2018). Moreover, those algorithm builds a model based on splines that fit different linear functions to data intervals, efficiently capturing complex variations (Leathwick et al., 2006; Elith and Leathwick, 2007; Valavi et al., 2022). GLMs are relatively simple models that offer a direct interpretation of variable coefficients, which helps understand the influence of each variable in the model. Although linear, GLMs can be extended to include nonlinear effects and interactions by including polynomial or spline terms; GAMs extend GLMs by allowing relationships between the predictor variables and the response variable to be modeled in a nonlinear manner, using smooth spline functions. Despite their ability to model complex relationships, GAMs maintain interpretability, allowing you to visualize how each predictor variable affects the response quickly. MaxEnt, one of the most widely used algorithms for species distribution modeling, was used to predict the probability of occurrence of trees by maximizing the entropy of the distribution of presences conditioned on climatic variables (Phillips et al., 2006). BRTs are efficient in dealing with unbalanced data and can capture complex interactions between variables by combining several tree models in sequence, where each subsequent tree tries to correct the errors of the previous ones. BRT can achieve high accuracy in predicting species distributions due to its iterative focus on correcting the errors of previous models. For more details, see the Supplementary material with the mathematical description of the algorithms.
The data were randomly divided into a training dataset (70%) and a test dataset (30%). The training data were used for model calibration, and the test dataset was used for cross-validation of model evaluation. We divided the data because we did not have independent data for model evaluation. One hundred replicates were run for each model using resampling methods for subsampling. We evaluated model performance using the true skill statistic (TSS) and the area under the curve (AUC) of the receiver operating characteristic (ROC) curves. TSS is a threshold-dependent measure, ranging from −1 to +1, where +1 indicates perfect agreement between predictions and observations, and values of 0 or less indicate no better agreement than random partitioning (Allouche et al., 2006). AUC is widely used to determine the predictive accuracy of ecological niche models. Typically, AUC ranges from 0.5 to 1.0, with models having AUC >0.8 categorized as very good (Zhang et al., 2015). The ROC curve allows visualizing the relationship between true positives and false positives at different cut-off points, while TSS offers a single measure of the model’s discriminative ability. We used the threshold that maximizes TSS (TSS >0.8) to convert the probability of occurrence values into presence/absence predictions for binary transformation. The threshold approach that maximizes TSS is suitable because it produces the same threshold using presence-absence or presence-only data through sensitivity analysis (Guisan et al., 2017). For more details, see the Supplementary material with the mathematical description of the model performance using the true skill statistic (TSS) and the area under the curve (AUC) of the receiver operating characteristic (ROC) curves.
Additionally, we performed a sensitivity analysis, systematically changing one variable at a time while maintaining the other constants, to observe how changes in the variable affected the model output. This approach allows you to identify which variables impact the model most. Given the available computational capacity, the algorithms were trained 10 times to ensure the robustness of the results. The model parameterization consisted of a pre-modeling process using the sdmData function from the SDM package. This function creates the conditions for modeling, indicating the response variable (species occurrence) as a function of the complete set of bioclimatic layers selected through VIF. During this process, we defined the background randomly, following the recommendations proposed by Smith (2013).
We then used the ensemble prediction procedure to obtain final models in order to reduce uncertainty among the potential distribution modeling algorithms for the M. urundeuva species in the Caatinga domain. Ensemble models were predicted for current and future conditions at a resolution of 2.5 km2. The ensemble can reduce variability in forecasts and minimize the risk of overfitting by leveraging the strengths and mitigating the weaknesses of different algorithms. Predictions from individual models are combined to produce a final forecast. In this study, we use weighted average; for example, instead of giving each model the same weight, we assign different weights based on each model’s performance during validation. Models with better performance are given more weight in the final prediction. Weight was assigned using each model’s individual TSS maximized values. Next, we conducted estimates for future analyses and projections considering the same bioclimatic variables selected in the VIF and projected for climate scenarios in 2041–2060 and 2061–2080. These data were obtained from the CMIP6 general circulation model (Coupled Model Intercomparison Project—phase 6: BCC-CSM2-MR, CNRM-ESM2-1, and MIROC6; WorldClim v.2.1) of the sixth assessment report (AR6) of the Intergovernmental Panel on Climate Change (IPCC) using geodata package (Hijmans et al., 2024). This global climate model was selected based on its recent performance in case studies for ecological niche modeling, potential distribution, and habitat suitability for many plant species in arid climate areas (Bedair et al., 2024). We additionally used the shared socioeconomic pathways (SSPs) with low and high emission scenarios, SSP126 (optimistic) (van Vuuren et al., 2011b) and SSP585 (pessimistic) (Riahi et al., 2011), respectively. The two SSPs used in this study represent contrasting climate futures for the Caatinga region. SSP126, the optimistic scenario, assumes low greenhouse gas emissions and significant global efforts to mitigate climate change, resulting in relatively stable temperature and precipitation patterns. In contrast, SSP585, the pessimistic scenario, represents a high-emission trajectory with minimal mitigation efforts, leading to significant increases in temperature and more pronounced variability in precipitation. These contrasting pathways provide insights into the potential range of impacts on habitat suitability for M. urundeuva under future climate conditions (van Vuuren et al., 2011a).
Finally, in each raster file generated by the spatial model, we estimated absolute values and percentages of area gain and loss compared to the species’ current distribution. In this step, in QGIS (version 3.32 LTR, 2023) we reclassify into multiple categories the raster files generated using the spatial analysis tools and converted them to polygons. Soon after, in the reclassified file and with defined polygons, we created a new column of attributes and calculated the sum of areas in km2 of each class and the probability of occurrence of the species.
3 Results
3.1 Model performance and current potential distribution of Myracrodruon urundeuva
The cross-validation results revealed reliable performance metrics for each algorithm individually (overall mean AUC = 0.904, TSS = 0.84). The GLM showed a mean training AUC of 0.887 (TSS = 0.81), followed by GAM with 0.895 (TSS = 0.82), BRT with 0.924 (TSS = 0.82), and MaxEnt with mean of 0.908 (TSS = 0.83). The ensemble model demonstrated a slight improvement over individual models, compared to individual TSS values ranging from 0.81 to 0.84. This improvement, while modest, underscores the strength of ensemble models in integrating predictions from multiple algorithms to achieve more robust and consistent results. By combining the strengths of each algorithm, the ensemble model reduces variability and enhances the reliability of predictions, particularly in regions with overlapping or uncertain habitat suitability.
We noted that the Ensemble SDM presents the highest probability values of occurrence for M. urundeuva in the central diagonal portion connecting the northeast to the south of the Caatinga’s phytogeographic domain (approximately −5° to −10° latitude South and −36° to −41° longitude West, Figure 2). Large areas in the northern portion (approximately between −3° and −7° latitude South), northeastern (approximately between −37° and −35° longitude West), and central-western (approximately −10° and −13° latitude South) parts of the Caatinga are generally dominated by vegetation with a low probability of M. urundeuva occurrence (<0.10).
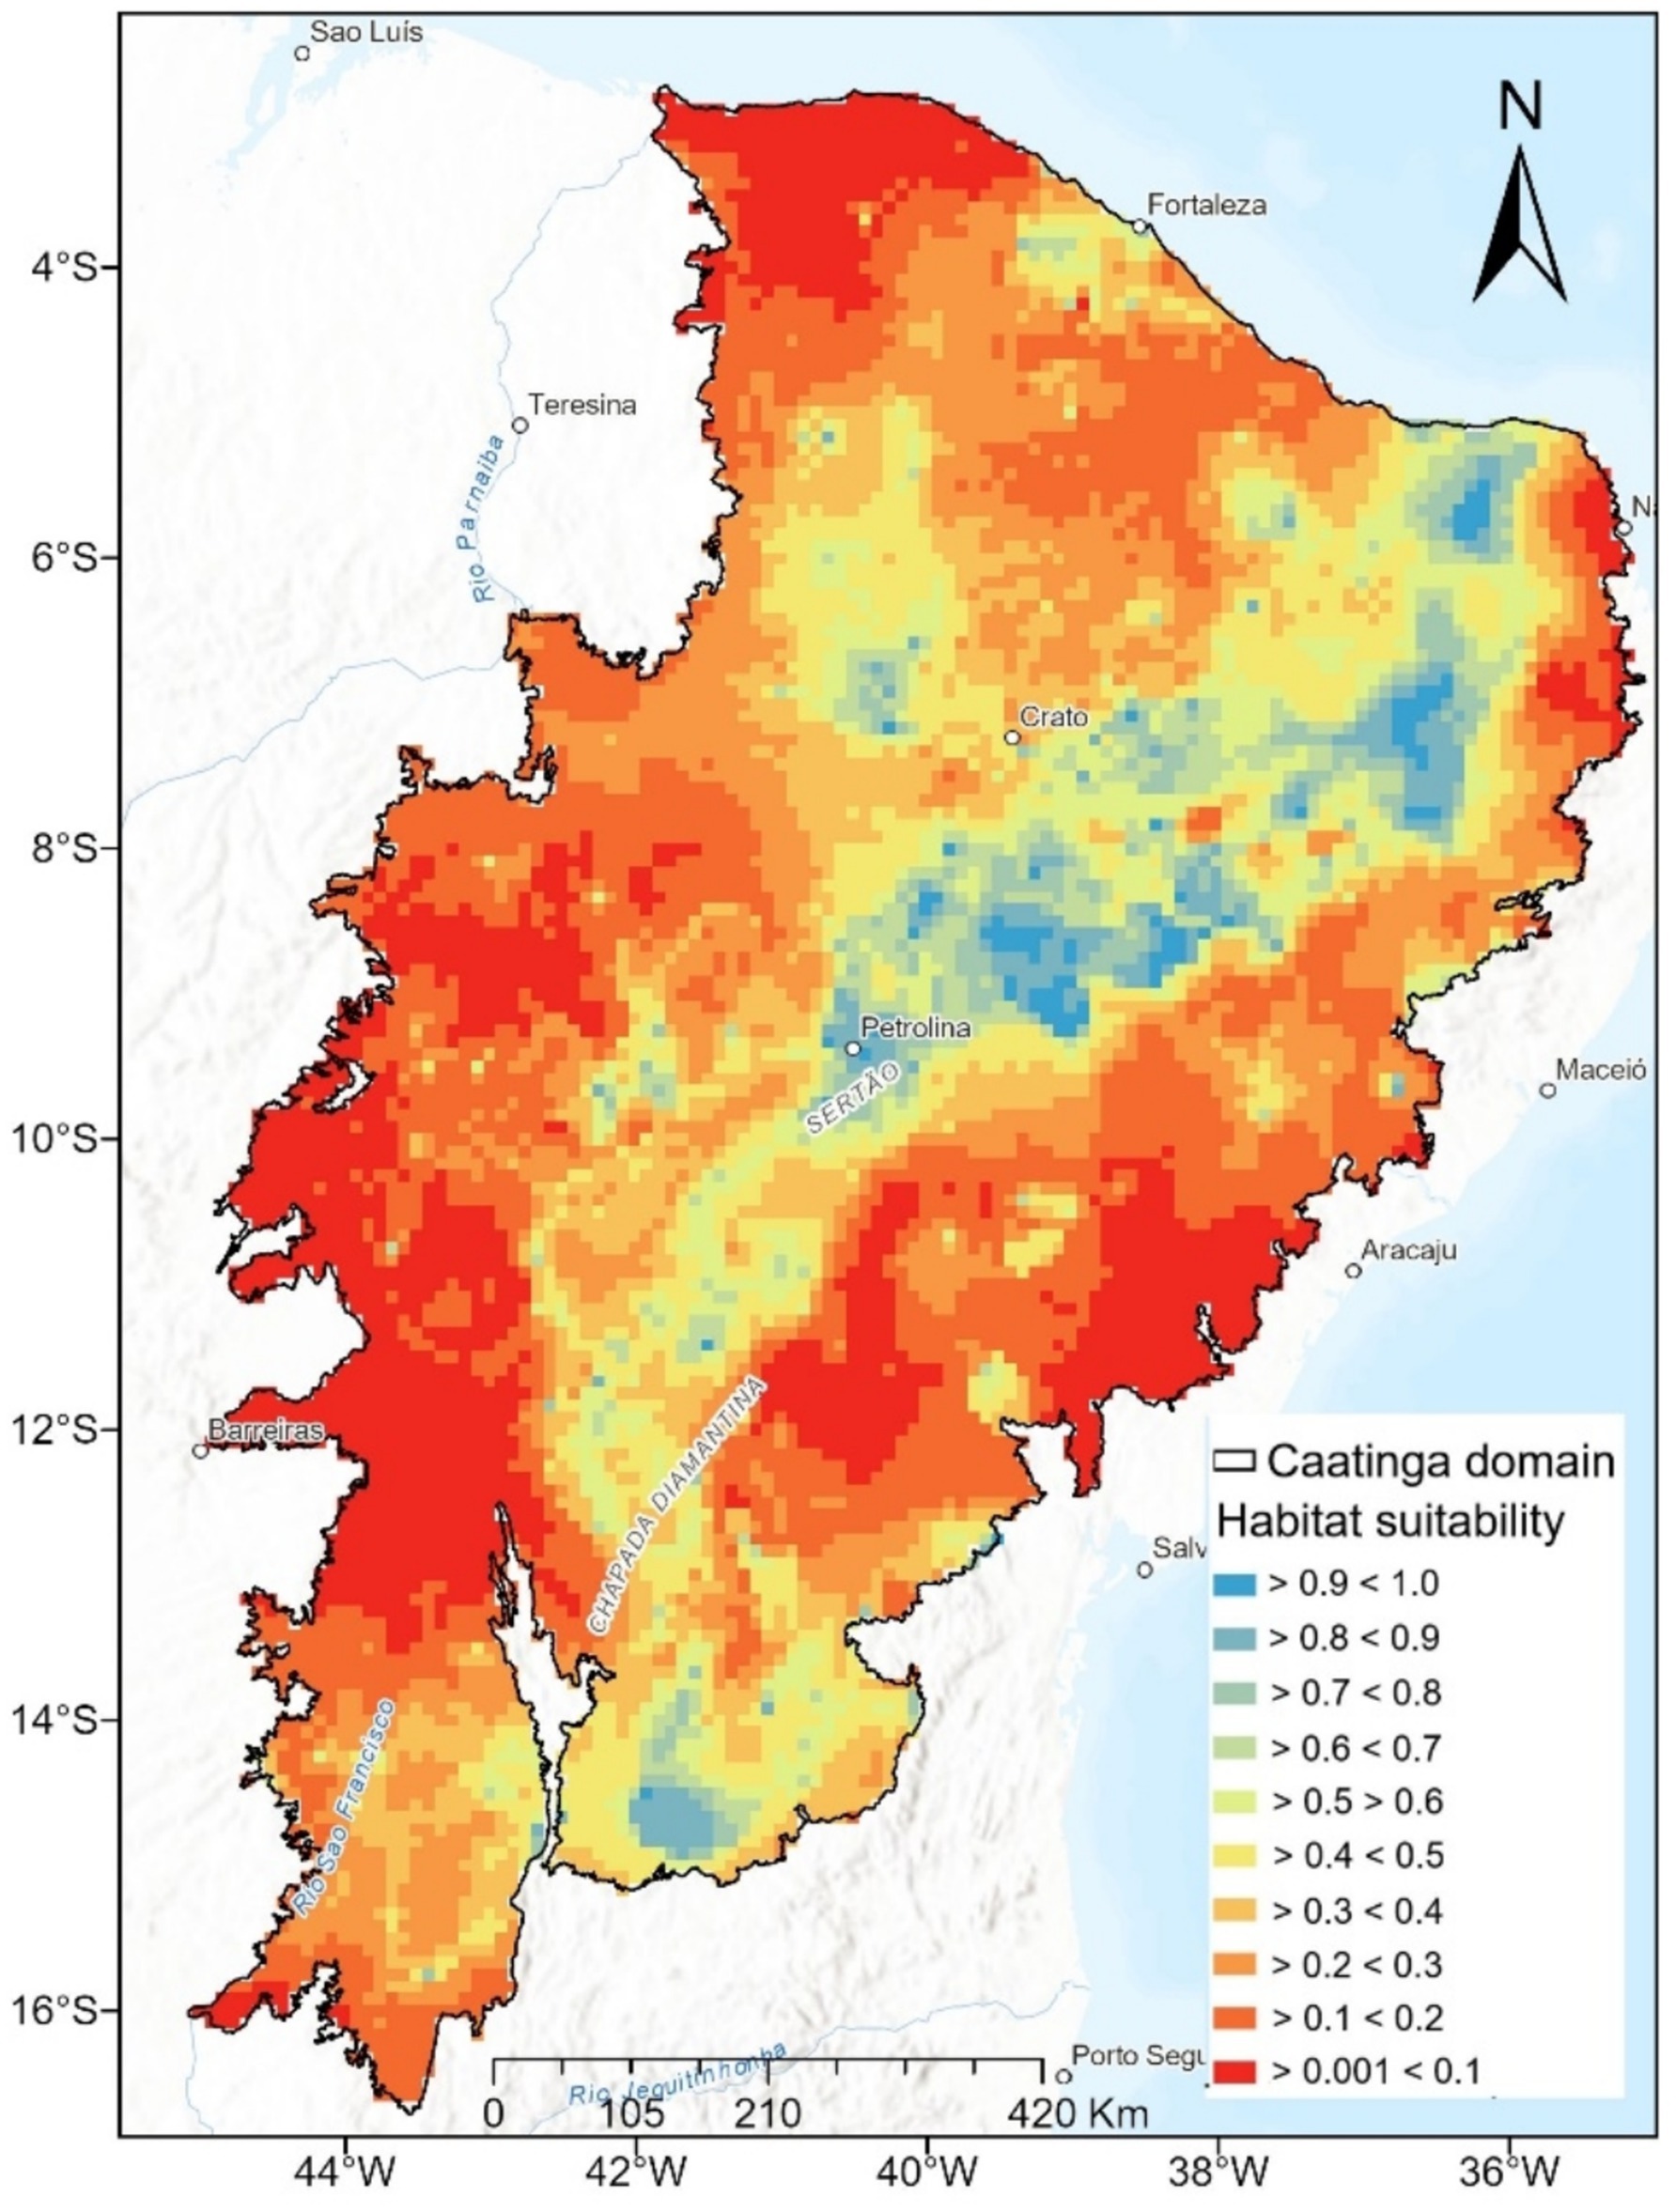
Figure 2. Current habitat suitability of M. urundeuva in Caatinga. The black outline represents the Caatinga domain, and the color gradient indicates habitat suitability values, ranging from highly suitable areas (dark blue, >0.9) to extremely unsuitable areas (red, <0.1). The habitat suitability scale represents the probability that a given area provides optimal environmental conditions for species occurrence, based on species distribution models (SDMs). Higher values (blue shades, 0.7–1.0) indicate regions with optimal conditions, intermediate values (green to yellow, 0.4–0.7) suggest moderate suitability, and lower values (orange to red, 0.001–0.3) represent unsuitable environments where species occurrence is unlikely.
This result is expected because the areas located in the northern and discontinuous strips in the northeast are in a state of desertification (Torres et al., 2017), and the areas located in the central-west coincide with the Chapada Diamantina region and are dominated by forests with low floristic diversity and resilient to gravelly soils and rocky outcrops. The predictive map also reveals many areas with intermediate probability values of occurrence (0.40 < 0.70) in the northern and northwestern parts of the Caatinga. These areas may suggest ecological tension or transition bands between seasonal vegetations within the domain, likely contributing to the intermediate values favorable for species occurrence.
3.2 Bioclimatic factors
We observed four distinct degrees of association between the nine selected bioclimatic variables and the potential occurrence of M. urundeuva in this study: (1) positive (the probability of occurrence increases as the factor increases, Figure 3f); (2) negative (the probability of occurrence decreases as the factor increases, Figure 3c); (3) descending parabolic behavior (the probability of occurrence initially increases, but then decreases as the factor increases, Figures 3a,c,g,h); and (4) ascending concave parabolic behavior (the probability of occurrence initially decreases but then increases as the factor increases, Figures 3b,d,e,i). Additionally, these bioclimatic variables can be divided into two groups: (1) environmental variables associated with plant growth resources (development and establishment), and (2) those suggesting climatic disturbances that may affect the development and occurrence of tree species on a landscape scale. Resources climate variables show slight variation over time and include factors such as average annual temperature and precipitation (i.e., providing more energy for growth). They provide a general overview of a species’ average climate conditions over a typical year. Disturbance variables or climate extremes represent extreme climate events or stresses, such as maximum temperature, evapotranspiration, and drought indices. These variables can cause significant disturbances in the ecosystem, especially in regions such as the Caatinga, where plants must face long periods without rain. In these areas, high maximum temperatures and high evapotranspiration rates can cause significant water stress, affecting the survival and distribution of many species. While some variables may reflect both resources and disturbances, for the sake of discussion we have associated such variables herein with the more relevant of the two categories.
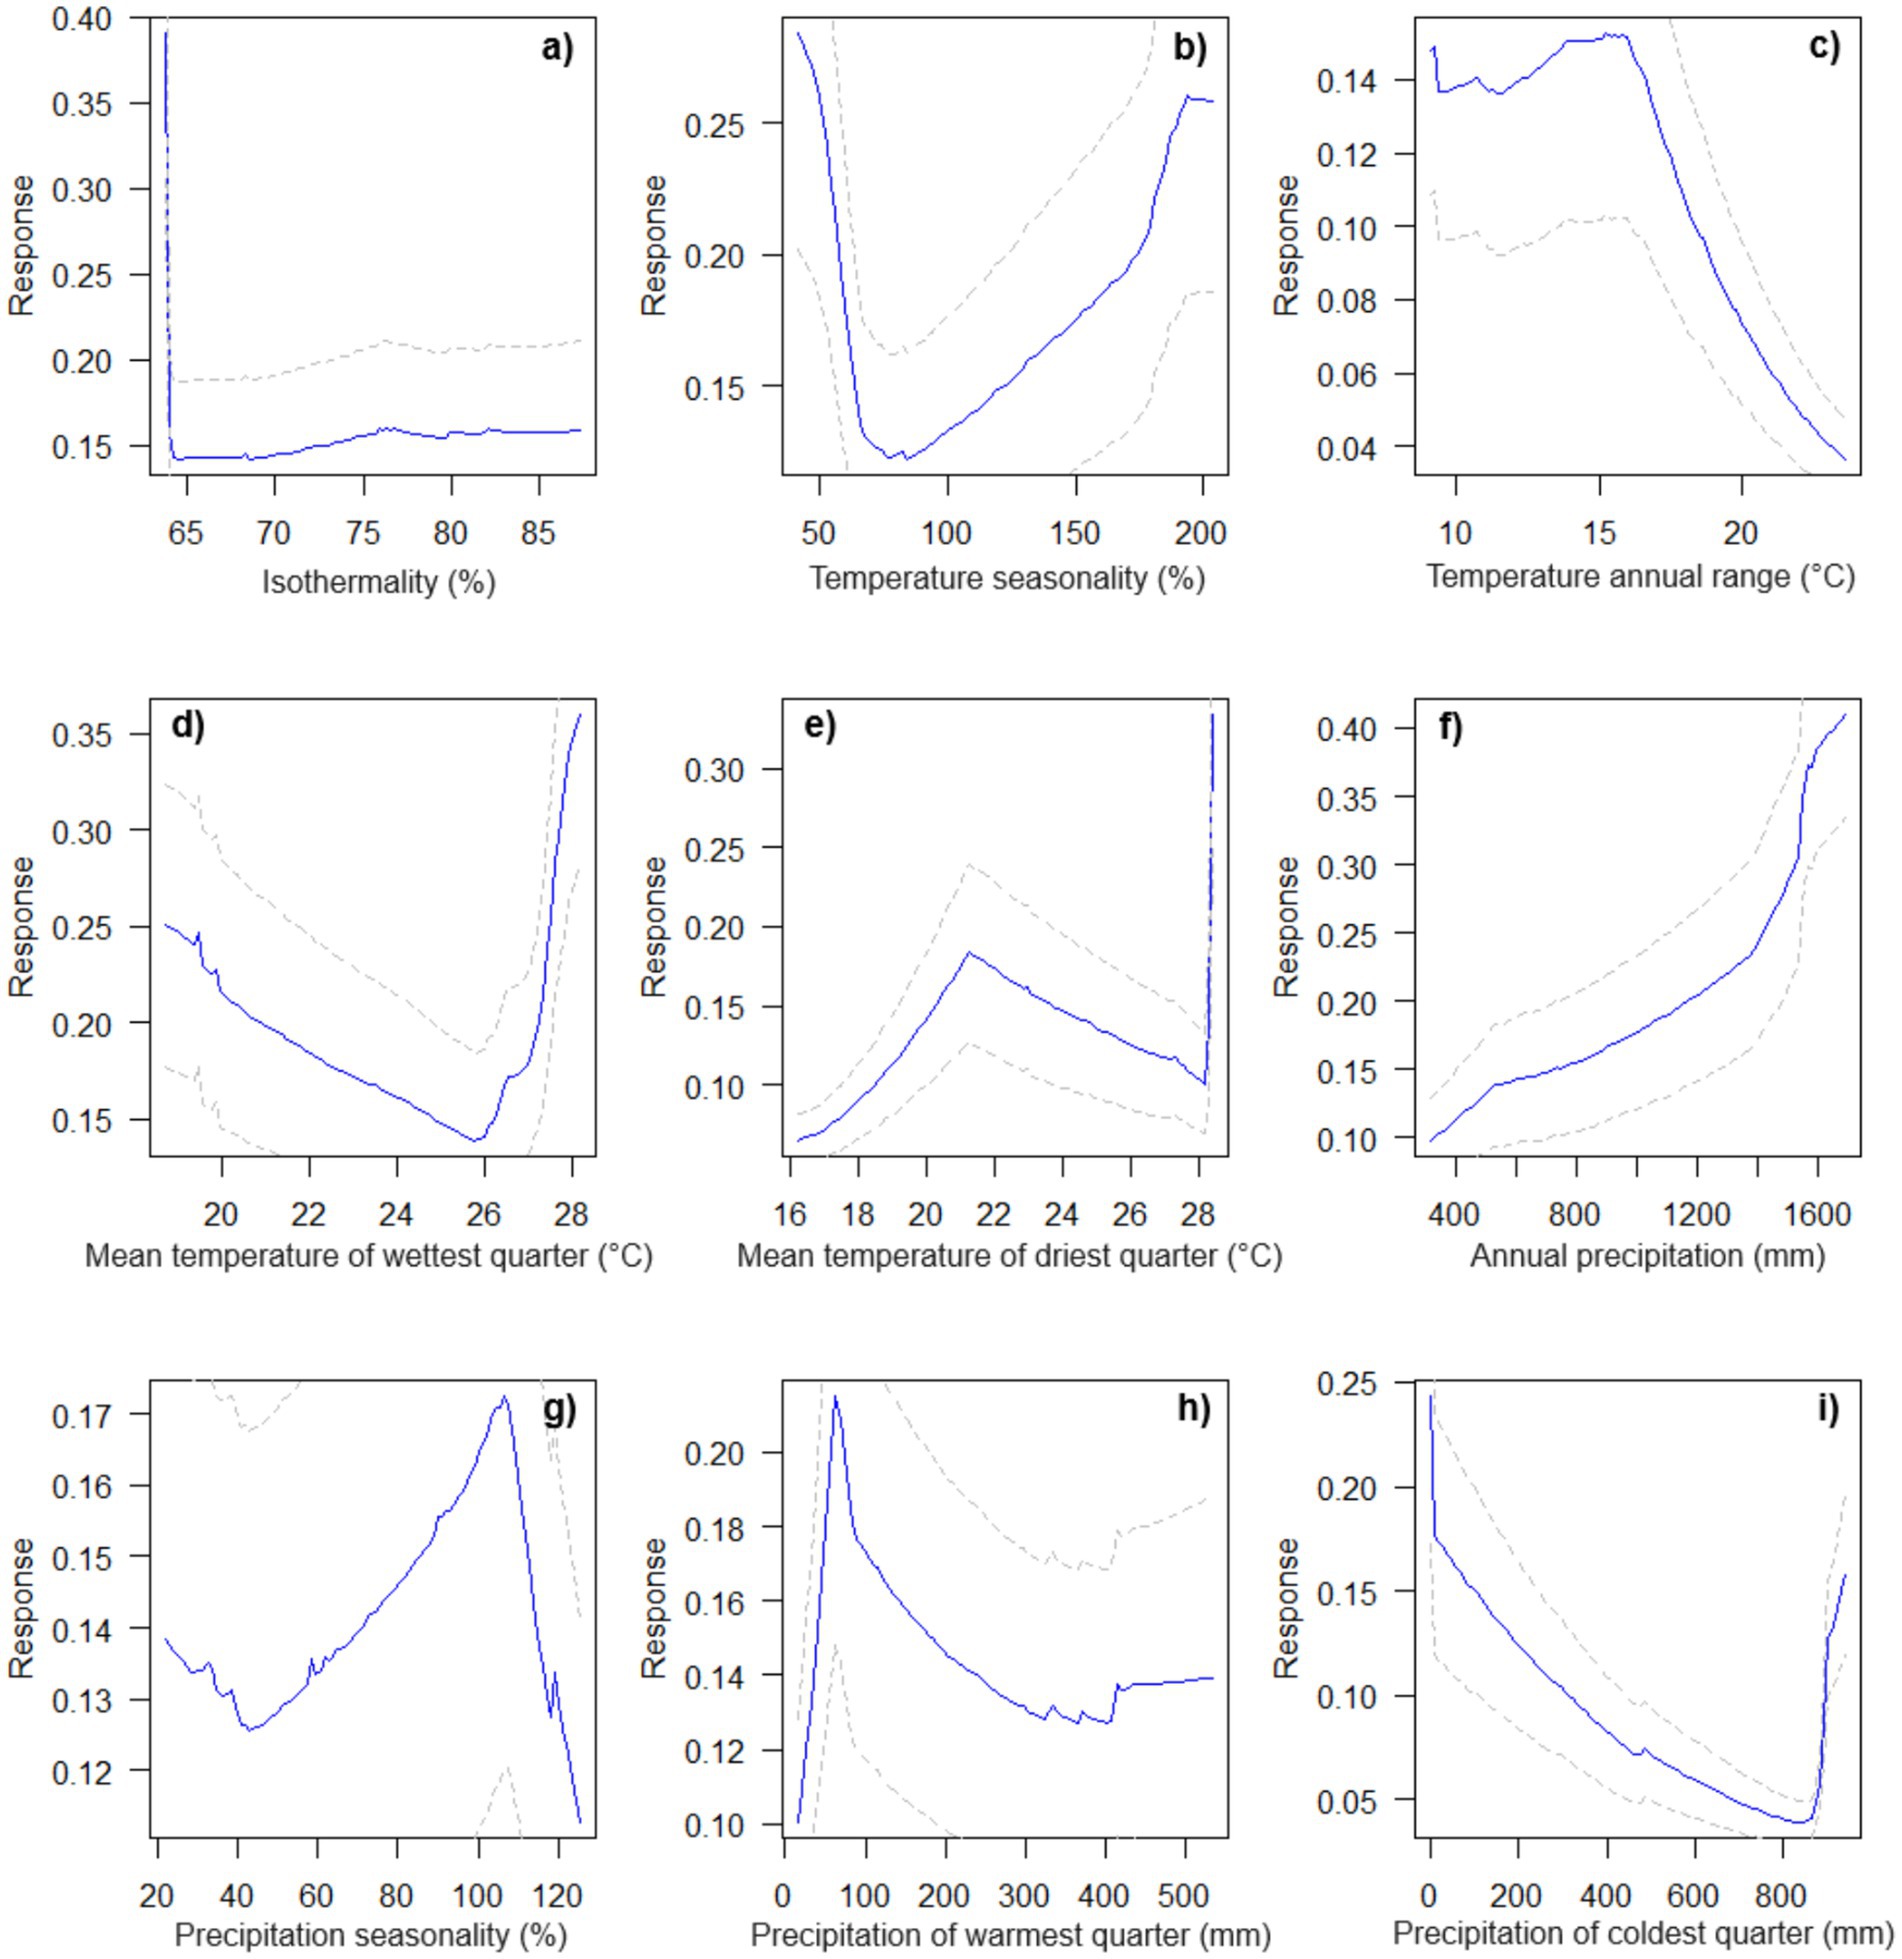
Figure 3. Response curves showing the effect of environmental variables on habitat suitability for the species. The solid blue lines represent the model’s response, illustrating how habitat suitability changes as a function of each predictor while holding other variables constant. The dashed lines correspond to the 95% confidence intervals (p = 0.05), providing an estimate of the uncertainty in model predictions. Wider confidence intervals indicate higher variability or lower data availability, whereas narrower intervals suggest more reliable predictions. The environmental variables analyzed are: (a) Isothermality (%), (b) Temperature seasonality (%), (c) Temperature annual range (°C), (d) Mean temperature of the wettest quarter (°C), (e) Mean temperature of the driest quarter (°C), (f) Annual precipitation (mm), (g) Precipitation seasonality (%), (h) Precipitation of the warmest quarter (mm), and (i) Precipitation of the coldest quarter (mm). These response curves help interpret the influence of climatic factors on the species’ habitat suitability and distribution.
Interestingly, M. urundeuva shows a higher probability of occurrence in warmer areas strongly influenced by different temperature range metrics. For example, environmental variables associated with climatic disturbances, such as temperature seasonality and mean temperature of the driest quarter, were positively relevant for the potential occurrence of the species (Figure 4) and are among the variables with the highest correlational importance (79.2, 48.5%, respectively) (Figure 4). However, response curves for isothermality (21.2%) and annual temperature range (25.1%) revealed that the probability of species occurrence tends to decrease with increased monthly temperature oscillations. On the other hand, as expected, annual precipitation above 800 mm (35.9%, Figure 4) is a strong indicator of increased species occurrence in the Caatinga (Figure 3). Other variables generally indicating ecologically suitable habitat for species growth and occurrence were precipitation of the coldest quarter (Bio 19–33.5%) and the interaction between temperature and precipitation, for example, mean temperature of the wettest quarter (Bio 8–10.6%), which indicated variation trends in intermediate range bands of potential occurrence data.
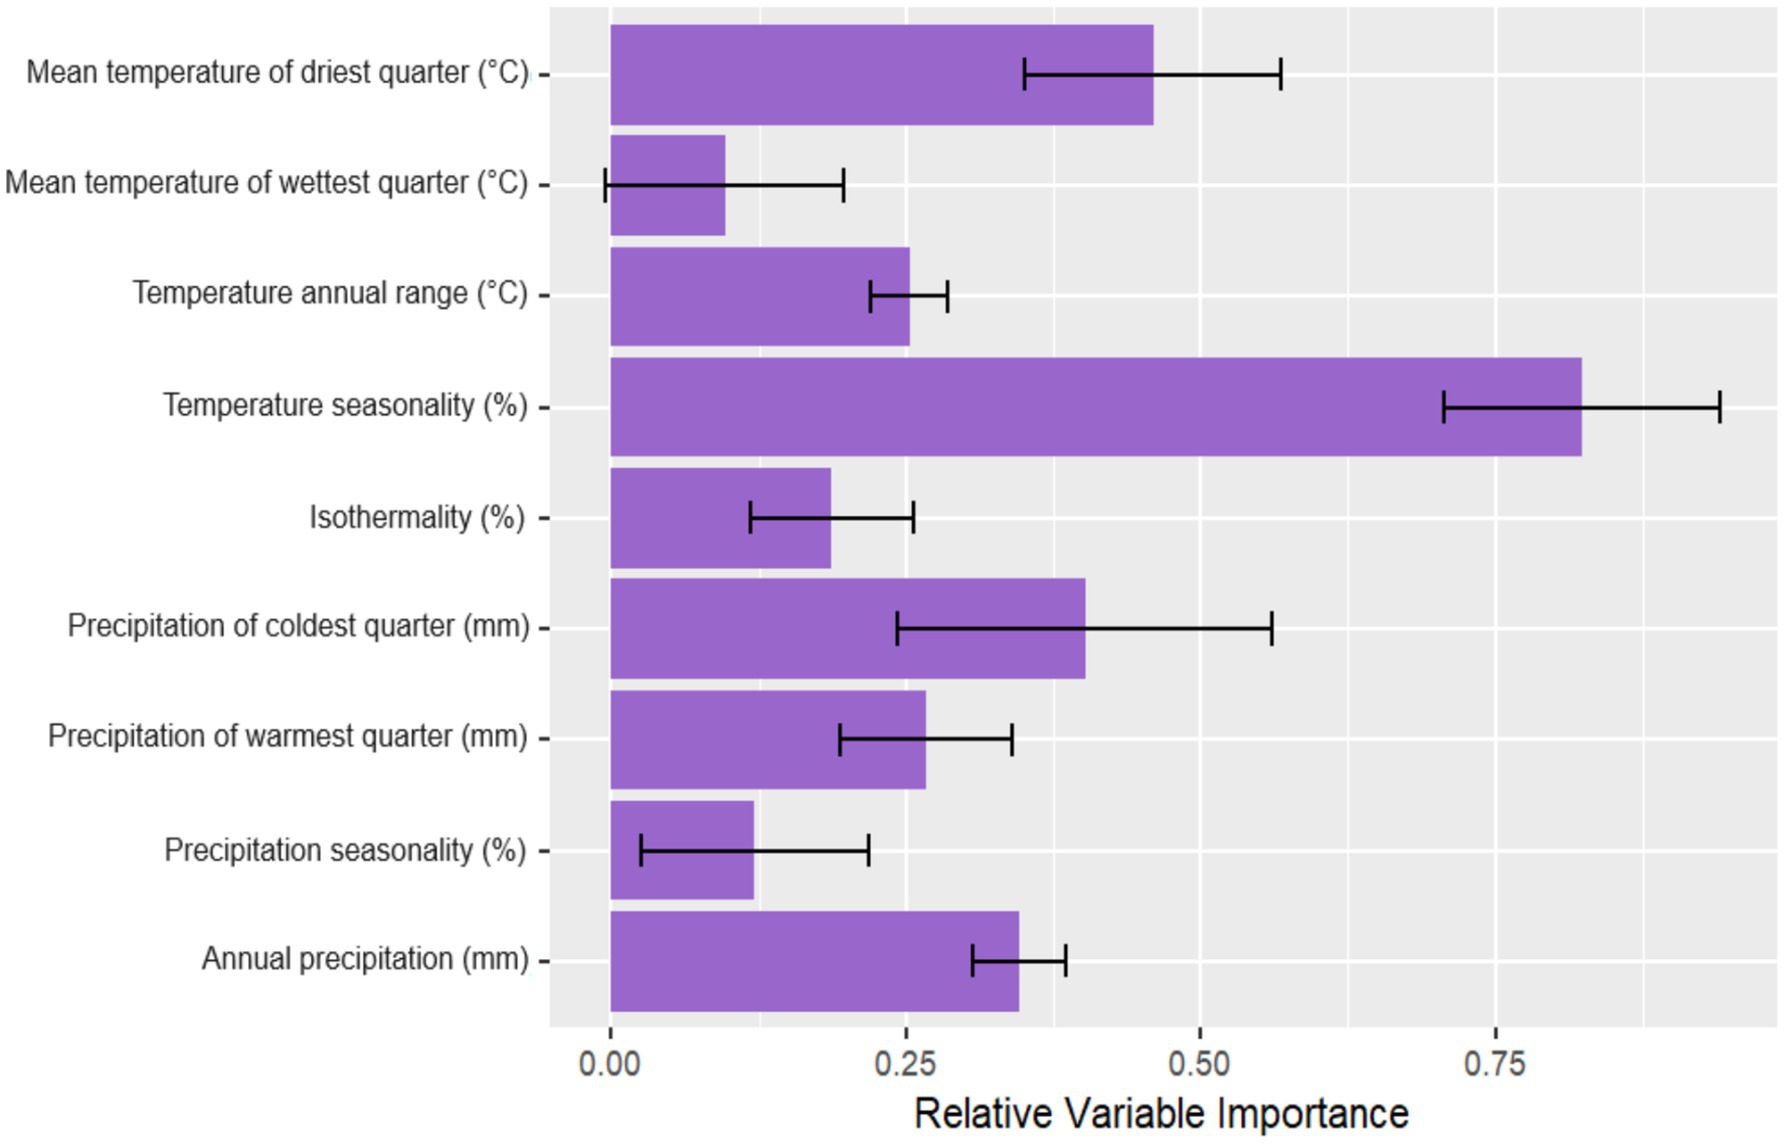
Figure 4. Relative contributions of bioclimatic variables to the potential distribution of M. urundeuva as estimated by the ensemble model. The error bars indicate the standard deviation of the relative contributions across 100 replicates of the model, reflecting the variability in the importance of each variable during cross-validation.
3.3 Potential suitability in future climate scenarios
The total area of currently suitable habitat for M. urundeuva is 701,557 km2, representing 81.3% of the total study area (862,818 km2). Under the SSP126 scenario (2041–2060), 80,795 km2 of currently suitable habitats will be lost, while 80,530 km2 will become newly suitable, resulting in a relatively stable total area (Figure 5). Similarly, under SSP585, 11,607 km2 will be lost, and 11,597 km2 will be gained. By 2061–2080, the total gain of 375,154 km2 represents the sum of new suitable areas emerging across different regions of the Caatinga, driven by shifting climatic conditions. Across both scenarios, the species is projected to lose approximately 43.47% (375,091 km2) of its currently suitable habitat while gaining 43.48% (375,154 km2) of new suitable areas by 2061–2080. Despite these shifts, around 13.1% (113,029 km2) of the Caatinga domain is expected to remain stable, providing long-term refugia for the species. Areas of habitat loss are concentrated in the central-western and eastern regions, whereas habitat gains are scattered and discontinuous but represented throughout the Caatinga (Figure 5).
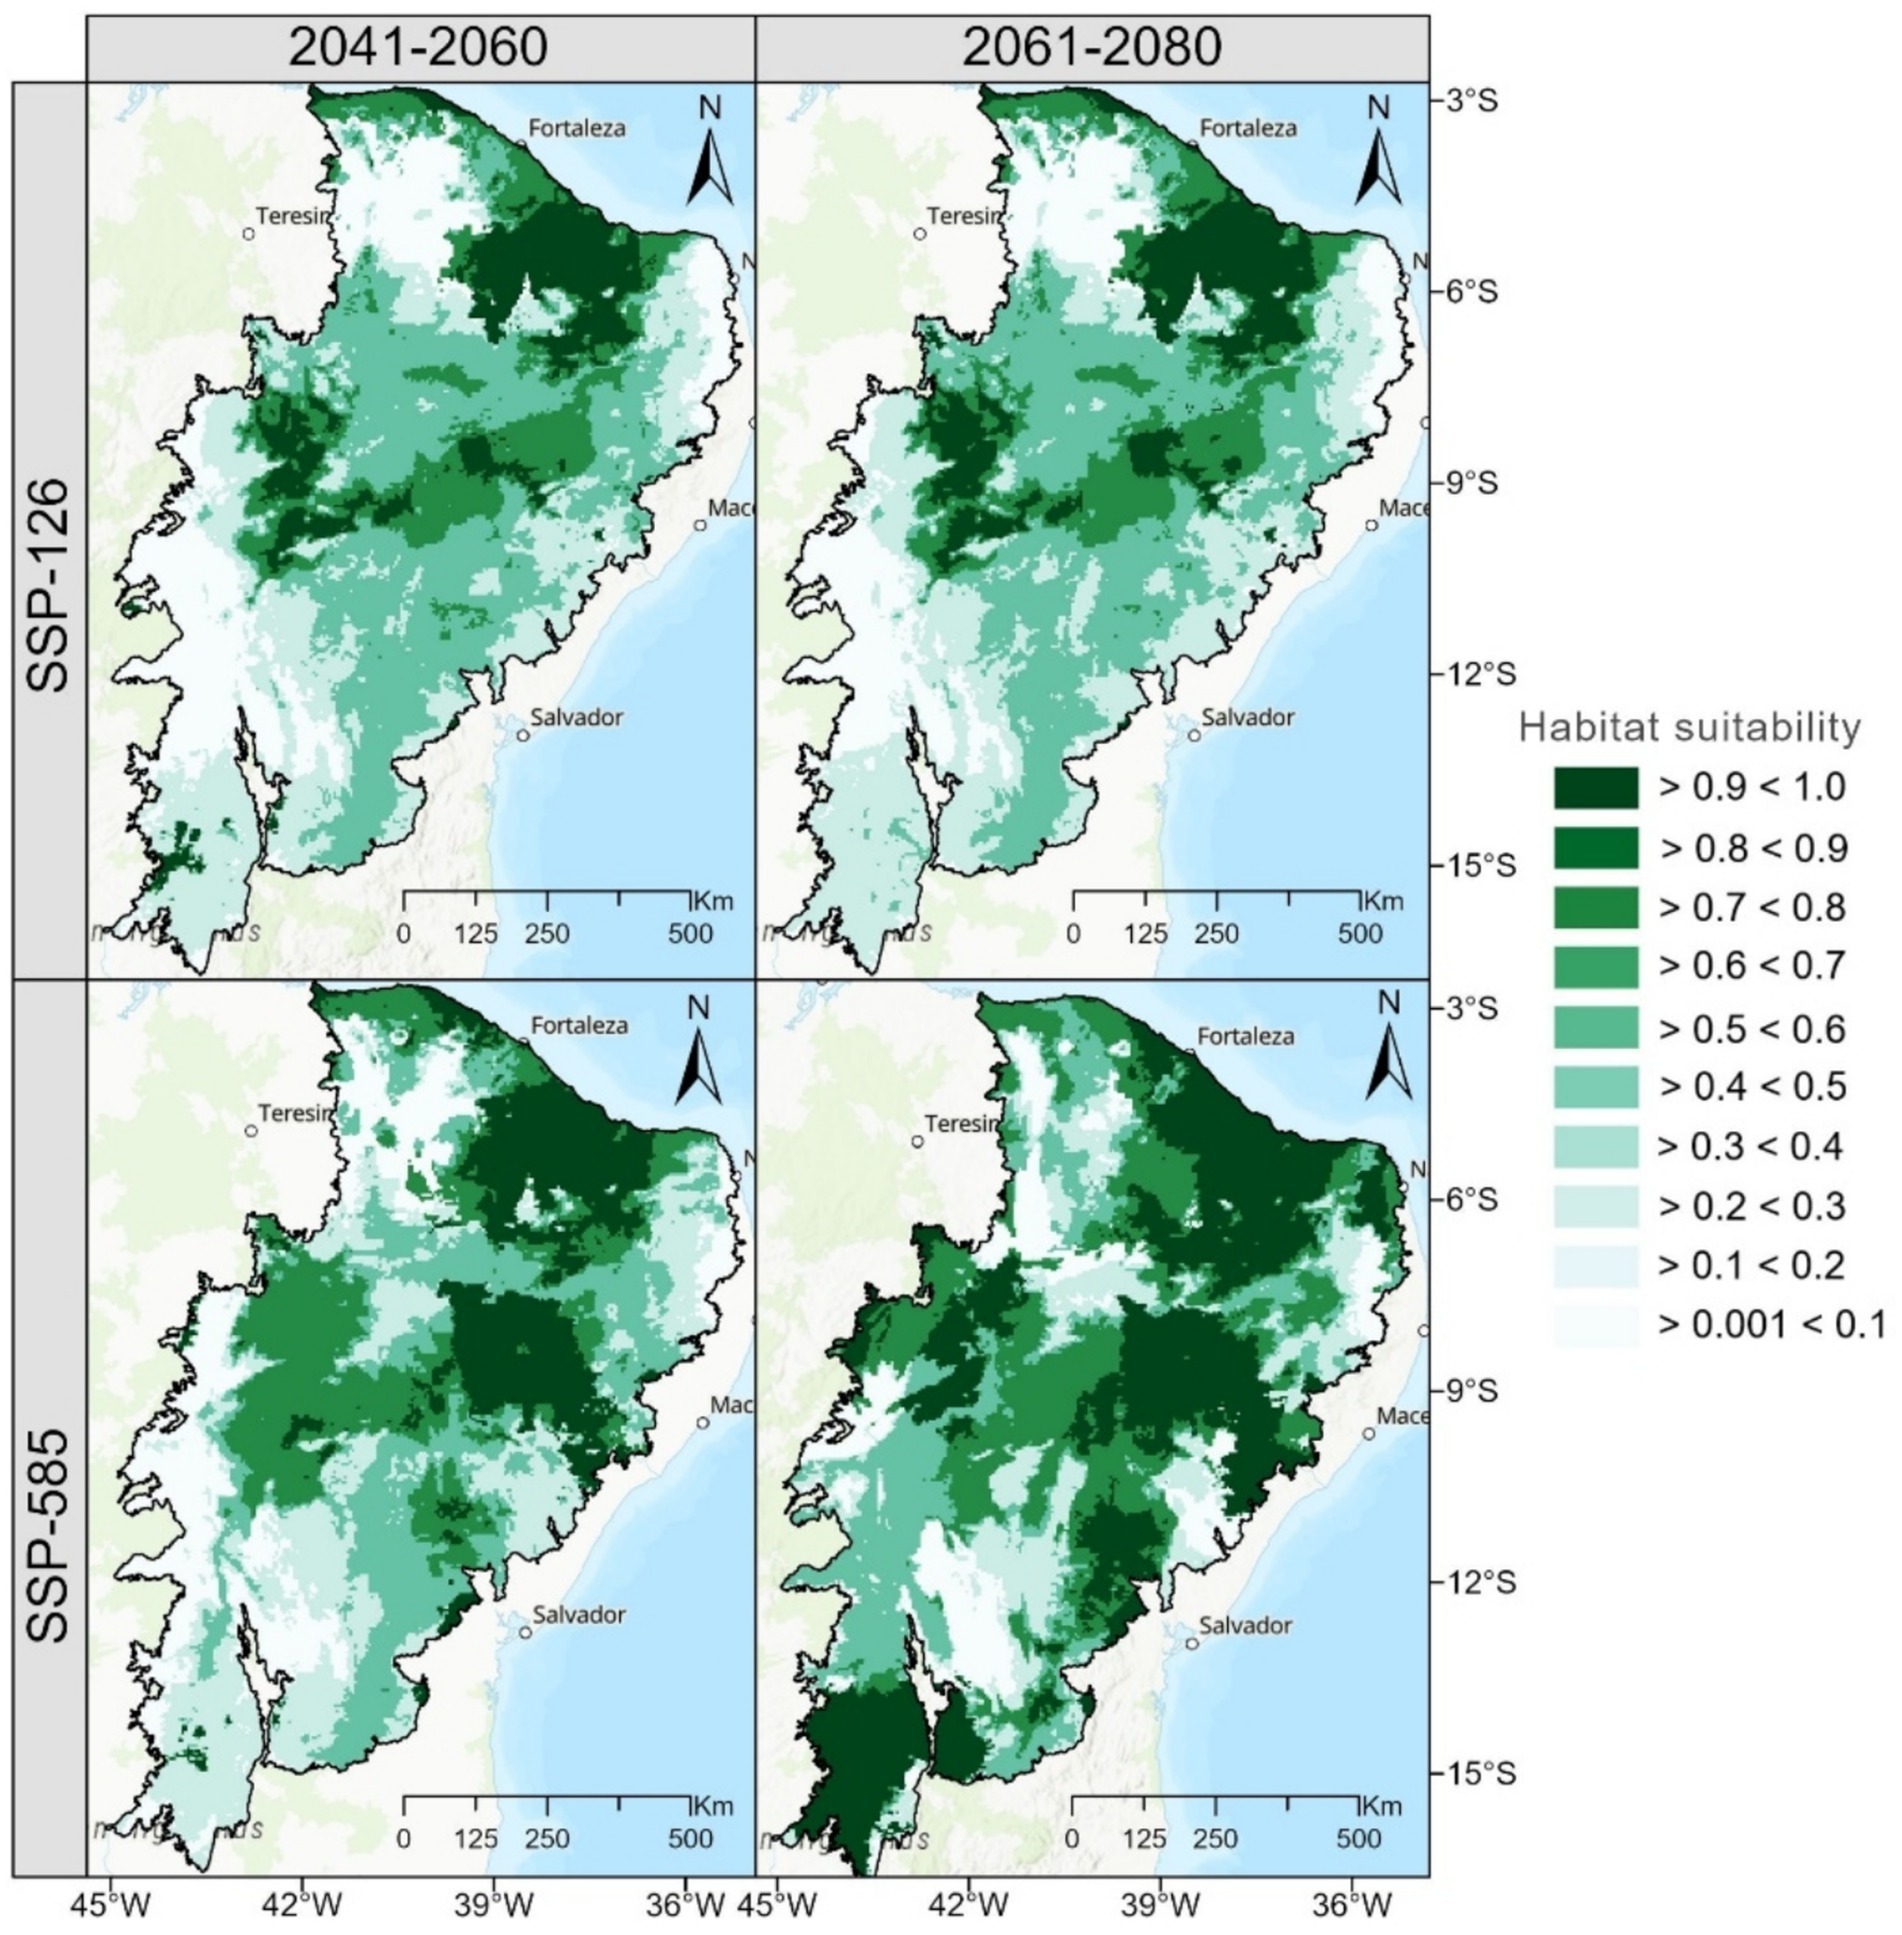
Figure 5. Potential distribution of M. urundeuva in decades 2041–2060 and 2061–2080 predicted using the spatial ensemble model for habitat suitability under climate change scenarios. These maps represent areas of habitat suitability, which inherently reflect changes compared to the current situation. Regions gaining or losing suitability can be identified by comparing the maps across scenarios and time periods.
Under the SSP126 scenario (2041–2060), 80,795 km2 of currently suitable habitats are projected to be lost, representing 9.37% of the current suitable habitat. Simultaneously, 80,530 km2 of new areas are expected to become suitable, effectively balancing the loss with an equivalent gain. This results in a net stable distribution area for the species. The term “distribution area” encompasses both current and newly suitable areas under future scenarios, whereas “habitat” specifically refers to areas currently suitable based on ecological conditions. Approximately 701,557 km2 (81.3%) of the current habitat is expected to remain suitable, resulting in an overall net change of 18.69% in the species’ distribution area. In 2061–2080, the species is projected to lose 28,376 km2 (3.28%), while 805,958 km2 (93.41%) of the current habitat remains suitable. Additionally, 28,600 km2 of new areas will become suitable, indicating a slight increase over the previously unsuitable areas. This results in a modest net range change of 6.59%.
In the SSP 585 scenario for 2041 to 2060, a loss of 11,607 km2 (3.28%) and a gain of 11,597 km2 of new suitable areas are expected, effectively maintaining a suitable habitat. About 662,609 km2 (76.8%) of current habitat will remain stable, resulting in a net change of 23.2%. By 2061–2080, habitat loss increases to 165,776 km2 (19.2%), while 165,964 km2 of new areas are gained, leading to a net area gain of 100% relative to habitat lost. Approximately 531,081 km2 (61.55%) of the current habitat remains suitable, reflecting a more significant change in this scenario.
4 Discussion
4.1 Modeling and bioclimatic factors
Our findings demonstrate a consensus among the evaluated species distribution modeling (SDM) algorithms. Given the absence of a single best algorithm, we employed an ensemble model combining four different approaches (Araujo and New, 2007; Hao et al., 2019). Ensemble models have proven effective in ecological niche modeling, particularly for plant species under future climate scenarios (Antúnez et al., 2018; Alegria et al., 2023). While each algorithm contributed positively, their combined predictions significantly improved the discrimination of projected area classes and occurrence probabilities. The ensemble’s ROC curve showed a robust AUC, indicating excellent separation of occurrence probability classes, while the TSS value surpassed individual model performances. These results underscore the ensemble model’s effectiveness in addressing complex spatial problems, such as predicting species occurrence under future scenarios. Sensitivity analysis further highlighted model strengths and areas for improvement, ensuring reliability and practical utility in spatial predictions.
We identified a clear spatial trend in the potential distribution of M. urundeuva across the Caatinga, with high precision. Two key conclusions emerged: (1) suitable habitats are strongly influenced by temperature seasonality (Bio 4) and the mean temperature of the driest quarter (Bio 9), and (2) climate change may expand or contract the species’ distribution. These insights enhance our understanding of species-level responses to climate change, supporting forest restoration and conservation planning.
Temperature seasonality significantly impacts ecophysiological processes in plants adapted to arid environments, driving functional adaptations (Amissah et al., 2014; Mendes et al., 2022). In the Caatinga, annual temperature extremes can exceed 40°C, shaping species distribution and photosynthetic efficiency (do Nascimento Accioly et al., 2024; Santos e Silva et al., 2019). Higher altitudes, however, mitigate these effects through cooler conditions (Kwiecien et al., 2022; Schwartz et al., 2022). This variability supports the climate variability hypothesis, linking temperature seasonality to woody plant diversity in dry climates (El-Rawy et al., 2023; Suarez-Contento et al., 2024). In such extreme environments, identifying key climatic variables is crucial, as drought and small diurnal temperature variations disrupt species development (da Silva et al., 2017b; Torres et al., 2017). Plants in these regions often develop adaptations like water storage and dormancy to cope with water scarcity and heat (Eamus and Prior, 2001; Mendes et al., 2022).
Response curves (Figure 3) reveal pronounced changes at the extremes of bioclimatic variables like isothermality (Bio 3) and temperature seasonality (Bio 4), likely due to limited data or physiological stress thresholds (Elith et al., 2020; Zurell et al., 2020b). For M. urundeuva, deviations beyond optimal temperature ranges may render habitats unsuitable, with data scarcity increasing prediction uncertainty (Guisan et al., 2017). Future climate shifts toward these extremes could further impact habitat suitability, emphasizing the need for broader occurrence data and field validation (Guisan and Thuiller, 2005).
Temperature range in warm and cold quarters (Bio 7) significantly reduces occurrence probability, while mean temperatures of the driest (Bio 9) and wettest quarters (Bio 8) show contrasting effects. For instance, Drimys angustifolia Miers, a species from southern Brazil, exhibits a 79.15% decline in occurrence likelihood under extreme scenarios (dos Santos et al., 2020). Such seasonality extremes impact photosynthetic efficiency and water conservation, necessitating adaptations like increased water use efficiency (WUE) and leaf morphology changes (Lambers et al., 2008). In the Caatinga, high WUE reflects adaptations to semi-arid conditions (dos Santos Silva et al., 2019; dos Santos et al., 2021), potentially mitigating water scarcity under elevated CO₂ levels (Lambers et al., 2008; Hatfield and Dold, 2019).
Annual precipitation (Bio 12) is a key driver of habitat suitability, with species growth and spread increasing with rainfall (Figure 2). Precipitation enhances soil moisture, fostering floristic diversity (Yu et al., 2020; Guerreiro et al., 2022). Water availability is critical for physiological processes like transpiration and photosynthesis (Yang et al., 2021; Ievinsh, 2023), with drought-induced wilting threatening species survival and food security (Pan et al., 2022; Bedair et al., 2024). Seasonal precipitation variability (Bio 15) further influences habitat suitability by affecting soil moisture during critical growth phases (Reich and Borchert, 1984; Murphy and Lugo, 1986; Dexter et al., 2018).
Precipitation and temperature variables (e.g., Bio 18 and Bio 19) interact synergistically, shaping species occurrence patterns. Suitable habitats likely result from the co-limitation of these factors (Liang et al., 2022), a common concept in plant ecology (Eskelinen and Harrison, 2015). Our findings align with previous studies highlighting the joint role of water and temperature in net primary productivity, with water availability dominating in warmer, flatter regions (Cabrerizo et al., 2020; Liang et al., 2022).
4.2 Impacts of climate change on Myracrodruon urundeuva
Habitat suitability maps derived from ensemble model predictions reflect the probability of M. urundeuva occurrence but do not necessarily indicate optimal growing conditions. Suitable habitats align with the species’ ecological requirements, though they may include areas where populations persist under suboptimal or stressful conditions, such as extreme temperature variability or limited water availability (Rito et al., 2017; Moura et al., 2023). This highlights the need to incorporate additional ecological metrics, like physiological performance and reproductive output, into future models to better assess habitat quality.
The ensemble map reveals climatically suitable habitats for M. urundeuva in areas influenced by topography, characterized by high temperatures and rainfall (Figure 2). Notably, the species is absent in regions with severe desertification, high aridity, or gravelly and rocky soils, such as the Chapada Diamantina, suggesting local extinction or insufficient floristic data. However, projections indicate a potential increase in occurrence probability in these areas. Under the optimistic SSP126 scenario, habitat expansion is predicted for 2041–2060 and 2061–2080. Conversely, the SSP585 scenario for 2061–2080 shows localized habitat loss due to severe climatic changes, though gains in newly suitable areas offset these losses, resulting in net stability or expansion. This suggests that extreme climate changes do not necessarily reduce overall habitat suitability, emphasizing the importance of evaluating multiple scenarios and timelines to understand climate change impacts.
Climate change-induced habitat gains and losses have been documented for plant species in dry and endemic ecosystems globally (Rodrigues et al., 2015; Manchego et al., 2017; dos Santos et al., 2020). For instance, species in the Middle East (Erfanian et al., 2021; Bedair et al., 2024), India (Chitale et al., 2014), Sardinia (Fois et al., 2018), Namibia (Thuiller et al., 2006), and (Thuiller et al., 2006) and several other plant species in some European countries (Thuiller et al., 2005a, 2005b) have shown habitat expansions under climate change. In the Caatinga, while higher altitudes support habitat gains across scenarios, lower altitudes face losses under pessimistic scenarios (Figure 5). The SSP585 scenario shows that extreme climatic shifts render some areas unsuitable but create new suitable regions, partially offsetting losses. In contrast, SSP126 leads to gradual unsuitability in marginal areas without significant gains (Santos e Silva et al., 2019). These dynamics underscore the role of regional climatic variability in shaping species distribution under climate change (Santos et al., 2014).
Projections for 2041–2060 and 2061–2080 are independent, reflecting distinct climatic conditions for each period (Torres et al., 2017). Areas unsuitable in 2041–2060 may regain suitability by 2061–2080 due to shifts in precipitation or temperature, while others may become unsuitable only in the later period as climate change intensifies (Santos et al., 2014).
M. urundeuva occurrence data show lower concentrations in northern coastal Caatinga regions, with higher frequencies in interior areas characterized by greater temperature seasonality and reduced precipitation (Figure 1). This reflects the species’ adaptability to diverse environmental conditions. However, no records exist below 100 m altitude, suggesting local extinction due to timber extraction or historical disturbances like land-use changes and grazing (Araujo et al., 2023). Despite increasing desertification in arid and semi-arid habitats under pessimistic scenarios, M. urundeuva demonstrates significant adaptive potential and resilience to climate change, supported by its current distribution patterns.
4.3 Study limitations and broader implications
This study utilized geographic and bioclimatic data to develop potential distribution maps for M. urundeuva in the Caatinga. However, data limitations, such as incomplete coverage or resolution, constrain the analysis.
First, soil characteristics were excluded due to the lack of dynamic soil data under future climate scenarios (Raes and Aguirre-Gutiérrez, 2018). Unsuitable soil conditions, such as low fertility, poor water retention, or high salinity, could limit species expansion despite favorable climates. Future studies should integrate high-resolution soil data to improve predictions, especially in semi-arid regions like the Caatinga. However, static soil data may bias results by conflating soil and climate effects, so we focused solely on dynamic climate variables.
Second, species presence data pose quality limitations. Small or discontinuous occurrence records may not capture climatic and topographic variability. The choice of scale depends on the study’s objectives, with global distribution models requiring different scales than local habitat assessments (Guisan et al., 2017; Zurell et al., 2020b). Presence-only data, often from herbarium or museum records, lack information on sampling effort, complicating habitat availability definitions. Cavalcante and Sampaio (2022) suggest a minimum of 17–30 records for narrow and widespread species, respectively, in the Caatinga. Integrating forest inventory data (Blundo et al., 2021) can enhance occurrence area coverage, though field sampling remains a challenge.
Third, species distribution models (SDMs) are sensitive to spatial and temporal scales, as well as extent (Domisch et al., 2015; Lee-Yaw et al., 2022). Climate change projections are uncertain due to model discrepancies, emission trajectories, and natural variability. SDMs often overlook biotic interactions, dispersal, adaptation, and soil-vegetation dynamics, limiting their ability to fully capture species responses (Guisan and Thuiller, 2005; Doninck et al., 2020; Cavalcante et al., 2024). Inadequate soil and vegetation characteristics can render climatically suitable areas uninhabitable, restricting habitat tracking as climates shift (Zuquim et al., 2020). Soil–plant-water relationships are critical in the Caatinga (Pinheiro et al., 2016; Paloschi et al., 2021), and large-scale soil and vegetation data are essential for understanding climate change impacts.
Lastly, SDMs are widely used but criticized for their assumptions, such as species-environment equilibrium and perfect sampling (Wiens et al., 2009). Species respond dynamically to global changes, influenced by physiology, demography, dispersal, interspecific interactions, and land-use changes (Zurell et al., 2020b). Ignoring these processes can distort predictions, highlighting the need for improved modeling approaches. Therefore, while this study provides insights into M. urundeuva’s potential distribution, it underscores the importance of critically evaluating SDM assumptions and addressing limitations to enhance predictive accuracy.
5 Conclusion
Our findings highlight the potential risks and uncertainties posed by climate change to the suitable habitats of M. urundeuva. The species’ distribution is strongly influenced by temperature metrics, with suitable habitats primarily found in areas receiving over 500 mm of annual precipitation. Projections indicate significant habitat gains in the central-northern Caatinga, driven by the species’ adaptability to future climatic conditions. The ensemble modeling approach effectively captured the synergistic effects of temperature and precipitation at local scales, providing reliable spatial predictions. However, our analysis is limited to the Caatinga domain, as inferences beyond the sampled data range and other ecosystems are not supported.
The observed habitat shifts underscore the need for localized and regional conservation strategies to mitigate climate change impacts on M. urundeuva. The Caatinga, a seasonally dry tropical forest, is highly resilient to extreme climatic conditions but faces threats from desertification and high aridity. Species like M. urundeuva have evolved adaptive traits, such as deep root systems and modified leaves, to cope with water scarcity. These adaptations not only support local biodiversity but also offer insights for ecological restoration and climate change mitigation in other arid regions. We recommend prioritizing conservation efforts in stable habitats identified in this study, as they serve as critical refuges for the species amidst escalating climate challenges.
Data availability statement
The original contributions presented in the study are included in the article/Supplementary material, further inquiries can be directed to the corresponding author.
Author contributions
DC: Conceptualization, Data curation, Formal analysis, Investigation, Methodology, Validation, Visualization, Writing – original draft. RL: Conceptualization, Data curation, Formal analysis, Investigation, Methodology, Project administration, Supervision, Validation, Visualization, Writing – original draft, Writing – review & editing. RC: Conceptualization, Formal analysis, Investigation, Writing – original draft. AP: Conceptualization, Data curation, Formal analysis, Investigation, Writing – original draft. CO: Conceptualization, Data curation, Formal analysis, Investigation, Methodology, Writing – original draft. JA: Conceptualization, Data curation, Formal analysis, Methodology, Writing – original draft. JG: Conceptualization, Data curation, Formal analysis, Investigation, Methodology, Writing – original draft. MS: Conceptualization, Formal analysis, Visualization, Writing – original draft. AP: Conceptualization, Data curation, Formal analysis, Investigation, Methodology, Writing – original draft.
Funding
The author(s) declare that financial support was received for the research and/or publication of this article. Coordination for the Improvement of Higher Education Personnel in Brazil (CAPES; Finance Code 001), National Council for Scientific and Technological Development (301432/2022-8).
Acknowledgments
We express our sincere gratitude to the Universidade do Estado do Amapá (UEAP) and the Universidade Estadual do Sudoeste da Bahia (UESB) for their financial support and the infrastructure provided for the development of this work. Additionally, we thank the National Council for Scientific and Technological Development (CNPq) for the productivity scholarships awarded to the second, third, and sixth authors.
Conflict of interest
The authors declare that the research was conducted in the absence of any commercial or financial relationships that could be construed as a potential conflict of interest.
Generative AI statement
The authors declare that no Generative AI was used in the creation of this manuscript.
Publisher’s note
All claims expressed in this article are solely those of the authors and do not necessarily represent those of their affiliated organizations, or those of the publisher, the editors and the reviewers. Any product that may be evaluated in this article, or claim that may be made by its manufacturer, is not guaranteed or endorsed by the publisher.
Supplementary material
The Supplementary material for this article can be found online at: https://www.frontiersin.org/articles/10.3389/ffgc.2025.1519432/full#supplementary-material
Footnotes
References
Aiello-Lammens, M. E., Boria, R. A., Radosavljevic, A., Vilela, B., Anderson, R. P., Bjornson, R., et al. (2019). spThin: functions for spatial thinning of species occurrence records for use in ecological models. Available at: https://cran.r-project.org/web/packages/spThin/index.html. (Accessed July 21, 2023)
Alegria, C., Almeida, A. M., Roque, N., Fernandez, P., and Ribeiro, M. M. (2023). Species distribution modelling under climate change scenarios for maritime pine (Pinus pinaster Aiton) in Portugal. Forests 14:591. doi: 10.3390/f14030591
Allouche, O., Tsoar, A., and Kadmon, R. (2006). Assessing the accuracy of species distribution models: prevalence, kappa and the true skill statistic (TSS). J. Appl. Ecol. 43, 1223–1232. doi: 10.1111/j.1365-2664.2006.01214.x
Alvares, C. A., Stape, J. L., Sentelhas, P. C., and de Moraes Gonçalves, J. L. (2013). Modeling monthly mean air temperature for Brazil. Theor. Appl. Climatol. 113, 407–427. doi: 10.1007/s00704-012-0796-6
Amissah, L., Mohren, G. M. J., Bongers, F., Hawthorne, W. D., and Poorter, L. (2014). Rainfall and temperature affect tree species distribution in Ghana. J. Trop. Ecol. 30, 435–446. doi: 10.1017/S026646741400025X
Antúnez, P., Suárez-Mota, M., Valenzuela-Encinas, C., and Ruiz-Aquino, F. (2018). The potential distribution of tree species in three periods of time under a climate change scenario. Forests 9:628. doi: 10.3390/f9100628
Araujo, H. F. P., Canassa, N. F., Machado, C. C. C., and Tabarelli, M. (2023). Human disturbance is the major driver of vegetation changes in the Caatinga dry forest region. Sci. Rep. 13:18440. doi: 10.1038/s41598-023-45571-9
Araujo, M., and New, M. (2007). Ensemble forecasting of species distributions. Trends Ecol. Evol. 22, 42–47. doi: 10.1016/j.tree.2006.09.010
Banda-R, K., Delgado-Salinas, A., Dexter, K. G., Linares-Palomino, R., Oliveira-Filho, A., Prado, D., et al. (2016). Plant diversity patterns in neotropical dry forests and their conservation implications. Science 353, 1383–1387. doi: 10.1126/science.aaf5080
Barbet-Massin, M. (2012). Selecting pseudo-absences for species distribution models: how, where and how many? Methods Ecol. Evol. 3, 327–338. doi: 10.1111/j.2041-210X.2011.00172.x
Bedair, H., Badawy, N. K., Morsy, A., Rashad, H., and Dakhil, M. A. (2024). Impact of climate change on the spatial distribution of the endemic shrub Rubus asirensis in the Arabian Peninsula. Plant Ecol. 225, 441–450. doi: 10.1007/s11258-024-01405-w
Bedair, H., Shaltout, K., and Halmy, M. W. A. (2023). A critical inventory of the Mediterranean endemics in the Egyptian flora. Biodivers. Conserv. 32, 1327–1351. doi: 10.1007/s10531-023-02555-5
Blundo, C., Carilla, J., Grau, R., Malizia, A., Malizia, L., Osinaga-Acosta, O., et al. (2021). Taking the pulse of Earth’s tropical forests using networks of highly distributed plots. Biol. Conserv. 260:108849. doi: 10.1016/j.biocon.2020.108849
Booth, T. H. (2022). Checking bioclimatic variables that combine temperature and precipitation data before their use in species distribution models. Austral Ecol. 47, 1506–1514. doi: 10.1111/aec.13234
Cabrerizo, M. J., Helbling, E. W., Villafañe, V. E., Medina-Sánchez, J. M., and Carrillo, P. (2020). Multiple interacting environmental drivers reduce the impact of solar UVR on primary productivity in Mediterranean lakes. Sci. Rep. 10:19812. doi: 10.1038/s41598-020-76237-5
Carneiro, R. G., Rykowska, Z., Borges, C. K., Stachlewska, I. S., and dos Santos, C. A. C. (2025). Energy balance and evapotranspiration response to environmental variables in the semi-arid Caatinga biome. J. S. Am. Earth Sci. 152:105319. doi: 10.1016/j.jsames.2024.105319
Cavalcante, T., Barnett, A. A., Van Doninck, J., and Tuomisto, H. (2024). Modelling 21st century refugia and impact of climate change on Amazonia’s largest primates. Ecography 2024:e06988. doi: 10.1111/ecog.06988
Cavalcante, A. M. B., and Sampaio, A. C. P. (2022). Modeling the potential distribution of cacti under climate change scenarios in the largest tropical dry forest region in South America. J. Arid Environ 200:104725. doi: 10.1016/j.jaridenv.2022.104725
Chamberlain, S. A., and Boettiger, C. (2017). R Python, and Ruby clients for GBIF species occurrence data. PeerJ Preprints 5:e3304v1. doi: 10.7287/peerj.preprints.3304v1
Chitale, V. S., Behera, M. D., and Roy, P. S. (2014). Future of endemic flora of biodiversity hotspots in India. PLoS One 9:e115264. doi: 10.1371/journal.pone.0115264
da Silva, P. F., de Sousa Lima, J. R., Antonin, A. C. D., Souza, R., de Souza, E. S., Silva, J. R. I., et al. (2017a). Seasonal patterns of carbon dioxide, water and energy fluxes over the Caatinga and grassland in the semi-arid region of Brazil. J. Arid Environ. 147, 71–82. doi: 10.1016/j.jaridenv.2017.09.003
de Oliveira, M. L., dos Santos, C. A. C., Santos, F. A. C., de Oliveira, G., Santos, C. A. G., Bezerra, U. A., et al. (2023). Evaluation of water and carbon estimation models in the Caatinga biome based on remote sensing. Forests 14:828. doi: 10.3390/f14040828
Dexter, K. G., Pennington, R. T., Oliveira-Filho, A. T., Bueno, M. L., Silva de Miranda, P. L., and Neves, D. M. (2018). Inserting tropical dry forests into the discussion on biome transitions in the tropics. Front. Ecol. Evol. 6:104. doi: 10.3389/fevo.2018.00104
do Nascimento Accioly, A., de Paiva Farias, R., and de Arruda, E. C. P. (2024). Plants in the Caatinga possess multiple adaptative leaf morphoanatomical traits concurrently, a pattern revealed from a systematic review. J. Arid Environ. 222:105162. doi: 10.1016/j.jaridenv.2024.105162
Domisch, S., Jähnig, S., Simaika, J., Kuemmerlen, M., and Stoll, S. (2015). Application of species distribution models in stream ecosystems: the challenges of spatial and temporal scale, environmental predictors and species occurrence data. Fundam. Appl. Limnol. 186, 45–61. doi: 10.1127/fal/2015/0627
Doninck, J. V., Jones, M. M., Zuquim, G., Ruokolainen, K., Moulatlet, G. M., Sirén, A., et al. (2020). Multispectral canopy reflectance improves spatial distribution models of Amazonian understory species. Ecography 43, 128–137. doi: 10.1111/ecog.04729
dos Santos, G. N., da Silva, A. C., and Higuchi, P. (2020). Impact of climate change on the geographical distribution of a cloud forest indicator tree species. Rev. Árvore 44:e4432. doi: 10.1590/1806-908820200000032
dos Santos, W. R., de Souza, L. S. B., Pacheco, A. N., da Rosa Ferraz Jardim, A. M., and da Silva, T. G. F. (2021). Eficiência do Uso da Água para Espécies da Caatinga: Uma Revisão Para o Período de 2009–2019. Rev. Bras. Geogr. Fis. 14, 2573–2591. doi: 10.26848/rbgf.v14.5.p2573-2591
dos Santos Silva, L. K., Alves, M. C. J. L., Costa, R. N., Silva, D. M. R., dos Santos, J. C. C., de Barros Prado Moura, F., et al. (2019). Gas exchange and photochemical efficiency of Caatinga plants submitted to different water management strategies. J. Agric. Sci. 11:p53. doi: 10.5539/jas.v11n11p53
Eamus, D., and Prior, L. (2001). “Ecophysiology of trees of seasonally dry tropics: comparisons among phenologies” in Advances in ecological research (London: Academic Press), 113–197.
Elith, J., Graham, C., Valavi, R., Abegg, M., Bruce, C., Ferrier, S., et al. (2020). Presence-only and presence-absence data for comparing species distribution modeling methods. Biodivers. Inform. 15, 69–80. doi: 10.17161/bi.v15i2.13384
Elith, J., and Leathwick, J. (2007). Predicting species distributions from museum and herbarium records using multiresponse models fitted with multivariate adaptive regression splines. Divers. Distrib. 13, 265–275. doi: 10.1111/j.1472-4642.2007.00340.x
Elith, J., and Leathwick, J. R. (2009). Species distribution models: ecological explanation and prediction across space and time. Annu. Rev. Ecol. Evol. Syst. 40, 677–697. doi: 10.1146/annurev.ecolsys.110308.120159
El-Rawy, M., Batelaan, O., Al-Arifi, N., Alotaibi, A., Abdalla, F., and Gabr, M. E. (2023). Climate change impacts on water resources in arid and semi-arid regions: a case study in Saudi Arabia. Water 15:606. doi: 10.3390/w15030606
Erfanian, M. B., Sagharyan, M., Memariani, F., and Ejtehadi, H. (2021). Predicting range shifts of three endangered endemic plants of the Khorassan-Kopet Dagh floristic province under global change. Sci. Rep. 11:9159. doi: 10.1038/s41598-021-88577-x
Eskelinen, A., and Harrison, S. P. (2015). Resource colimitation governs plant community responses to altered precipitation. Proc. Natl. Acad. Sci. U.S.A. 112, 13009–13014. doi: 10.1073/pnas.1508170112
Fernandes, M. F., Cardoso, D., and de Queiroz, L. P. (2020). An updated plant checklist of the Brazilian Caatinga seasonally dry forests and woodlands reveals high species richness and endemism. J. Arid Environ. 174:104079. doi: 10.1016/j.jaridenv.2019.104079
Fick, S. E., and Hijmans, R. J. (2017). WorldClim 2: new 1-km spatial resolution climate surfaces for global land areas. Int. J. Climatol. 37, 4302–4315. doi: 10.1002/joc.5086
Fois, M., Bacchetta, G., Cogoni, D., and Fenu, G. (2018). Current and future effectiveness of the Natura 2000 network for protecting plant species in Sardinia: a nice and complex strategy in its raw state? J. Environ. Plan. Manag. 61, 332–347. doi: 10.1080/09640568.2017.1306496
Gariglio, M. A., Sampaio, E. V., Cestaro, L. A., and Kageyama, P. Y. (2010). Uso sustentável e conservação dos recursos florestais da caatinga. Brasília: Serviço Florestal Brasileiro.
Grinder, R. M., and Wiens, J. J. (2023). Niche width predicts extinction from climate change and vulnerability of tropical species. Glob. Change Biol. 29, 618–630. doi: 10.1111/gcb.16486
Guerreiro, M. S., de Andrade, E. M., de Sousa, M. M. M., Brasil, J. B., Filho, J. C. R., and de Queiroz Palácio, H. A. (2022). Contribution of non-rainfall water input to surface soil moisture in a tropical dry forest. Hydrology 9:102. doi: 10.3390/hydrology9060102
Guisan, A., and Thuiller, W. (2005). Predicting species distribution: offering more than simple habitat models. Ecol. Lett. 8, 993–1009. doi: 10.1111/j.1461-0248.2005.00792.x
Guisan, A., Thuiller, W., and Zimmermann, N. E. (2017). Habitat suitability and distribution models: with applications in R. Cambridge: Cambridge University Press.
Guisan, A., Tingley, R., Baumgartner, J. B., Naujokaitis-Lewis, I., Sutcliffe, P. R., Tulloch, A. I. T., et al. (2013). Predicting species distributions for conservation decisions. Ecol. Lett. 16, 1424–1435. doi: 10.1111/ele.12189
Hao, T., Elith, J., Guillera-Arroita, G., and Lahoz-Monfort, J. J. (2019). A review of evidence about use and performance of species distribution modelling ensembles like BIOMOD. Divers. Distrib. 25, 839–852. doi: 10.1111/ddi.12892
Hatfield, J. L., and Dold, C. (2019). Water-use efficiency: advances and challenges in a changing climate. Front. Plant Sci. 10:103. doi: 10.3389/fpls.2019.00103
Hijmans, R. J., Barbosa, M., Ghosh, A., and Mandel, A. (2024). geodata: download geographic data. Available at: https://cran.r-project.org/web/packages/geodata/index.html. (Accessed June 11, 2024)
Hijmans, R. J., van Etten, J., Sumner, M., Cheng, J., Baston, D., Bevan, A., et al. (2021). raster: geographic data analysis and modeling. Available at: https://CRAN.R-project.org/package=raster. (Accessed August 28, 2021)
Ievinsh, G. (2023). Water content of plant tissues: so simple that almost forgotten? Plan. Theory 12:1238. doi: 10.3390/plants12061238
Kramer-Schadt, S., Niedballa, J., Pilgrim, J. D., Schröder, B., Lindenborn, J., Reinfelder, V., et al. (2013). The importance of correcting for sampling bias in MaxEnt species distribution models. Divers. Distrib. 19, 1366–1379. doi: 10.1111/ddi.12096
Kwiecien, O., Braun, T., Brunello, C. F., Faulkner, P., Hausmann, N., Helle, G., et al. (2022). What we talk about when we talk about seasonality—a transdisciplinary review. Earth Sci. Rev. 225:103843. doi: 10.1016/j.earscirev.2021.103843
La Montagna, D., Attorre, F., Hamdiah, S., Maděra, P., Malatesta, L., Vahalík, P., et al. (2023). Climate change effects on the potential distribution of the endemic Commiphora species (Burseraceae) on the island of Socotra. Front. For. Glob. Change 6:1183858. doi: 10.3389/ffgc.2023.1183858
Lambers, H., Chapin, F. S., and Pons, T. L. (2008). Plant physiological ecology. New York, NY: Springer.
Leathwick, J. R., Elith, J., and Hastie, T. (2006). Comparative performance of generalized additive models and multivariate adaptive regression splines for statistical modelling of species distributions. Ecol. Model. 199, 188–196. doi: 10.1016/j.ecolmodel.2006.05.022
Lee-Yaw, A., McCune, J. L., Pironon, S., and Sheth, S. N. (2022). Species distribution models rarely predict the biology of real populations. Ecography 2022:e05877. doi: 10.1111/ecog.05877
Liang, J., Gamarra, J. G. P., Picard, N., Zhou, M., Pijanowski, B., Jacobs, D. F., et al. (2022). Co-limitation towards lower latitudes shapes global forest diversity gradients. Nat. Ecol. Evol. 6, 1423–1437. doi: 10.1038/s41559-022-01831-x
Manchego, C. E., Hildebrandt, P., Cueva, J., Espinosa, C. I., Stimm, B., and Günter, S. (2017). Climate change versus deforestation: implications for tree species distribution in the dry forests of southern Ecuador. PLoS One 12:e0190092. doi: 10.1371/journal.pone.0190092
Marques, F. A., do Nascimento, A. F., de Araujo Filho, J. C., and da Silva, A. B. (2014). Solos do Nordeste. Available at: http://www.infoteca.cnptia.embrapa.br/handle/doc/1003864. (Accessed June 17, 2024)
Martins, F., Lima, F., Costa, R., Gonçalves, A., and Pereira, E. (2019). The seasonal variability and trends for the surface solar irradiation in northeastern region of Brazil. Sustain Energy Technol Assess 35, 335–346. doi: 10.1016/j.seta.2019.08.006
Mendes, K. R., Batista-Silva, W., Dias-Pereira, J., Pereira, M. P. S., Souza, E. V., Serrão, J. E., et al. (2022). Leaf plasticity across wet and dry seasons in Croton blanchetianus (Euphorbiaceae) at a tropical dry forest. Sci. Rep. 12:954. doi: 10.1038/s41598-022-04958-w
Mendes, K. R., Campos, S., da Silva, L. L., Mutti, P. R., Ferreira, R. R., Medeiros, S. S., et al. (2020). Seasonal variation in net ecosystem CO2 exchange of a Brazilian seasonally dry tropical forest. Sci. Rep. 10:9454. doi: 10.1038/s41598-020-66415-w
Menezes-Silva, P., Loram-Lourenço, L., Alves, R., Sousa, L., Almeida, S., and Farnese, F. (2019). Different ways to die in a changing world: consequences of climate change for tree species performance and survival through an ecophysiological perspective. Ecol. Evol. 9, 11979–11999. doi: 10.1002/ece3.5663
Moonlight, P. W., Banda-R, K., Phillips, O. L., Dexter, K. G., Pennington, R. T., Baker, T. R., et al. (2021). Expanding tropical forest monitoring into dry forests: the DRYFLOR protocol for permanent plots. Plants, People, Planet 3, 295–300. doi: 10.1002/ppp3.10112
Moura, M. R., do Nascimento, F. A. O., Paolucci, L. N., Silva, D. P., and Santos, B. A. (2023). Pervasive impacts of climate change on the woodiness and ecological generalism of dry forest plant assemblages. J. Ecol. 111, 1762–1776. doi: 10.1111/1365-2745.14139
Murphy, P. G., and Lugo, A. E. (1986). Ecology of tropical dry Forest. Annu. Rev. Ecol. Syst. 17, 67–88. doi: 10.1146/annurev.es.17.110186.000435
Naimi, B. (2023). usdm: uncertainty analysis for species distribution models. Available at: https://cran.r-project.org/web/packages/usdm/index.html. (Accessed June 10, 2024)
Naimi, B., and Araújo, M. B. (2016). sdm: a reproducible and extensible R platform for species distribution modelling. Ecography 39, 368–375. doi: 10.1111/ecog.01881
Paloschi, R. A., Ramos, D. M., Ventura, D. J., Souza, R., Souza, E., Morellato, L. P. C., et al. (2021). Environmental drivers of water use for Caatinga Woody Plant species: combining remote sensing phenology and sap flow measurements. Remote Sens. 13:75. doi: 10.3390/rs13010075
Pan, R., Buitrago, S., Feng, Z., Abou-Elwafa, S. F., Xu, L., Li, C., et al. (2022). HvbZIP21, a novel transcription factor from wild barley confers drought tolerance by modulating ROS scavenging. Front. Plant Sci. 13:878459. doi: 10.3389/fpls.2022.878459
Pecchi, M., Marchi, M., Moriondo, M., Forzieri, G., Ammoniaci, M., Bernetti, I., et al. (2020). Potential impact of climate change on the spatial distribution of key forest tree species in Italy under RCP4.5 for 2050s. Available at: https://doi.org/10.21203/rs.3.rs-20281/v1 (Accessed May 18, 2023).
Pennington, R. T., Lehmann, C. E. R., and Rowland, L. M. (2018). Tropical savannas and dry forests. Curr. Biol. 28, R541–R545. doi: 10.1016/j.cub.2018.03.014
Phillips, S. J., Anderson, R. P., and Schapire, R. E. (2006). Maximum entropy modeling of species geographic distributions. Ecol. Model. 190, 231–259. doi: 10.1016/j.ecolmodel.2005.03.026
Phillips, S. J., Dudík, M., Elith, J., Graham, C. H., Lehmann, A., Leathwick, J., et al. (2009). Sample selection bias and presence-only distribution models: implications for background and pseudo-absence data. Ecol. Appl. 19, 181–197. doi: 10.1890/07-2153.1
Pinheiro, E. A. R., Metselaar, K., de Jong van Lier, Q., and de Araújo, J. C. (2016). Importance of soil-water to the Caatinga biome, Brazil. Ecohydrology 9, 1313–1327. doi: 10.1002/eco.1728
R Core Team. (2023). Download R-4.2.1 for Windows. The R-project for statistical computing. Available at: https://cran.r-project.org/bin/windows/base/. (Accessed October 15, 2022)
Raes, N., and Aguirre-Gutiérrez, J. (2018). “A modeling framework to estimate and project species distributions in space and time” in Mountains, climate and biodiversity (Hoboken, NJ: John Wiley & Sons).
Randin, C. F., Ashcroft, M. B., Bolliger, J., Cavender-Bares, J., Coops, N. C., Dullinger, S., et al. (2020). Monitoring biodiversity in the Anthropocene using remote sensing in species distribution models. Remote Sens. Environ. 239:111626. doi: 10.1016/j.rse.2019.111626
Reich, P. B., and Borchert, R. (1984). Water stress and tree phenology in a tropical dry Forest in the lowlands of Costa Rica. J. Ecol. 72:61. doi: 10.2307/2260006
Riahi, K., Rao, S., Krey, V., Cho, C., Chirkov, V., Fischer, G., et al. (2011). RCP 8.5—a scenario of comparatively high greenhouse gas emissions. Clim. Change 109, 33–57. doi: 10.1007/s10584-011-0149-y
Rito, K., Arroyo-Rodríguez, V., Queiroz, R., Leal, I., and Tabarelli, M. (2017). Precipitation mediates the effect of human disturbance on the Brazilian Caatinga vegetation. J. Ecol. 105, 828–838. doi: 10.1111/1365-2745.12712
Rodrigues, P., Silva, J., Eisenlohr, P., and Schaefer, C. (2015). Climate change effects on the geographic distribution of specialist tree species of the Brazilian tropical dry forests. Braz. J. Biol. 75, 679–684. doi: 10.1590/1519-6984.20913
Santos e Silva, J. L., Cruz-Neto, O., Peres, C. A., Tabarelli, M., and Lopes, A. V. (2019). Climate change will reduce suitable Caatinga dry forest habitat for endemic plants with disproportionate impacts on specialized reproductive strategies. PLoS One 14:e0217028. doi: 10.1371/journal.pone.0217028
Santos, M. G., Oliveira, M. T., Figueiredo, K. V., Falcão, H. M., Arruda, E. C. P., Almeida-Cortez, J., et al. (2014). Caatinga, the Brazilian dry tropical forest: can it tolerate climate changes? Theor. Exp. Plant Physiol. 26, 83–99. doi: 10.1007/s40626-014-0008-0
Schwartz, N., Medvigy, D., Tijerin-Triviño, J., Pérez-Aviles, D., Rivera-Polanco, D., Pereira, D., et al. (2022). Intra-annual variation in microclimatic conditions in relation to vegetation type and structure in two tropical dry forests undergoing secondary succession. For. Ecol. Manag. 511:120132. doi: 10.1016/j.foreco.2022.120132
Smith, A. (2013). On evaluating species distribution models with random background sites in place of absences when test presences disproportionately sample suitable habitat. Divers. Distrib. 19, 867–872. doi: 10.1111/ddi.12031
Suarez-Contento, K. Y., Teles, C. B., Alves-Ferreira, G., Martins, M. L. L., and Athiê-Souza, S. M. (2024). Projected effects of climate change on the potential distribution range of Manihot species endemic to Northeast Brazil. An. Acad. Bras. Ciênc. 96:e20231211. doi: 10.1590/0001-3765202420231211
Thuiller, W., Lavorel, S., and Araújo, M. B. (2005a). Niche properties and geographical extent as predictors of species sensitivity to climate change. Glob. Ecol. Biogeogr. 14, 347–357. doi: 10.1111/j.1466-822X.2005.00162.x
Thuiller, W., Lavorel, S., Araújo, M. B., Sykes, M. T., and Prentice, I. C. (2005b). Climate change threats to plant diversity in Europe. Proc. Natl. Acad. Sci. U.S.A. 102, 8245–8250. doi: 10.1073/pnas.0409902102
Thuiller, W., Midgley, G. F., Hughes, G. O., Bomhard, B., Drew, G., Rutherford, M. C., et al. (2006). Endemic species and ecosystem sensitivity to climate change in Namibia. Glob. Change Biol. 12, 759–776. doi: 10.1111/j.1365-2486.2006.01140.x
Torres, R. R., Lapola, D. M., and Gamarra, N. L. R. (2017). “Future climate change in the Caatinga,” in Caatinga: the largest tropical dry forest region in South America, eds. J. M. C. Silvada, I. R. Leal, and M. Tabarelli Cham: Springer, 383–410
Tuanmu, M.-N., and Jetz, W. (2015). A global, remote sensing-based characterization of terrestrial habitat heterogeneity for biodiversity and ecosystem modelling. Glob. Ecol. Biogeogr. 24, 1329–1339. doi: 10.1111/geb.12365
Valavi, R., Guillera-Arroita, G., Lahoz-Monfort, J., and Elith, J. (2022). Predictive performance of presence-only species distribution models: a benchmark study with reproducible code. Ecol. Monogr. 92:e1486. doi: 10.1002/ecm.1486
van Vuuren, D. P., Edmonds, J., Kainuma, M., Riahi, K., Thomson, A., Hibbard, K., et al. (2011a). The representative concentration pathways: an overview. Clim. Change 109, 5–31. doi: 10.1007/s10584-011-0148-z
van Vuuren, D. P., Stehfest, E., den Elzen, M. G. J., Kram, T., van Vliet, J., Deetman, S., et al. (2011b). RCP2.6: exploring the possibility to keep global mean temperature increase below 2°C. Clim. Change 109, 95–116. doi: 10.1007/s10584-011-0152-3
Wickham, H., François, R., Henry, L., Müller, K., Vaughan, D., Software, P., et al. (2023). dplyr: a grammar of data manipulation. Available at: https://cran.r-project.org/web/packages/dplyr/index.html. (Accessed June 10, 2024)
Wickham, H., Vaughan, D., Girlich, M., Ushey, K., and Posit Software, P. B. C. PBC (2024). tidyr: tidy messy data. Available at: https://cran.r-project.org/web/packages/tidyr/index.html. (Accessed June 10, 2024)
Wiens, J. A., Stralberg, D., Jongsomjit, D., Howell, C. A., and Snyder, M. A. (2009). Niches, models, and climate change: assessing the assumptions and uncertainties. Proc. Natl. Acad. Sci. U.S.A. 106, 19729–19736. doi: 10.1073/pnas.0901639106
Yang, X., Lu, M., Wang, Y., Wang, Y., Liu, Z., and Chen, S. (2021). Response mechanism of plants to drought stress. Horticulturae 7:50. doi: 10.3390/horticulturae7030050
Yu, S., Mo, Q., Chen, Y., Li, Y., Li, Y., Zou, B., et al. (2020). Effects of seasonal precipitation change on soil respiration processes in a seasonally dry tropical forest. Ecol. Evol. 10, 467–479. doi: 10.1002/ece3.5912
Zaiats, A., Cattau, M. E., Pilliod, D. S., Liu, R., Dumandan, P. K. T., Hojatimalekshah, A., et al. (2024). Structural heterogeneity predicts ecological resistance and resilience to wildfire in arid shrublands. Landsc. Ecol. 39:108. doi: 10.1007/s10980-024-01901-4
Zhang, L., Liu, S., Sun, P., Wang, T., Wang, G., Zhang, X., et al. (2015). Consensus forecasting of species distributions: the effects of niche model performance and niche properties. PLoS One 10:e0120056. doi: 10.1371/journal.pone.0120056
Zuquim, G., Costa, F. R. C., Tuomisto, H., Moulatlet, G. M., and Figueiredo, F. O. G. (2020). The importance of soils in predicting the future of plant habitat suitability in a tropical forest. Plant Soil 450, 151–170. doi: 10.1007/s11104-018-03915-9
Zurell, D., Franklin, J., König, C., Bouchet, P., Dormann, C., Elith, J., et al. (2020a). A standard protocol for reporting species distribution models. Ecography 43, 1261–1277. doi: 10.1111/ecog.04960
Keywords: dry forest, species distribution models, environmental suitability maps, future projections, predictive biogeography
Citation: da Costa DB, de Lima RB, Caraciolo Ferreira RL, de Paula A, de Oliveira CP, Aleixo da Silva JA, Gomes JP, Santana MMM and Pereira ALL (2025) Assessing the potential distribution of Myracrodruon urundeuva Allemão (Aroeira) in the Caatinga under climate change scenarios. Front. For. Glob. Change. 8:1519432. doi: 10.3389/ffgc.2025.1519432
Edited by:
Göran Wallin, University of Gothenburg, SwedenReviewed by:
Lasse Tarvainen, University of Gothenburg, SwedenGabriel Brito Costa, Federal University of Western Pará, Brazil
Copyright © 2025 da Costa, de Lima, Caraciolo Ferreira, de Paula, de Oliveira, Aleixo da Silva, Gomes, Santana and Pereira. This is an open-access article distributed under the terms of the Creative Commons Attribution License (CC BY). The use, distribution or reproduction in other forums is permitted, provided the original author(s) and the copyright owner(s) are credited and that the original publication in this journal is cited, in accordance with accepted academic practice. No use, distribution or reproduction is permitted which does not comply with these terms.
*Correspondence: Robson Borges de Lima, cmJsX2Zsb3Jlc3RhbEB5YWhvby5jb20uYnI=; cm9ic29uLmxpbWFAdWVhcC5lZHUuYnI=