 Muhammad Junaid Ismail
 Tika Ram Poudel
 Akber Ali
 Lingbo Dong
- 1Key Laboratory of Sustainable Forest Ecosystem Management-Ministry of Education, College of Forestry, Northeast Forestry University, Harbin, China
- 2Feline Research Center of National Forestry and Grassland Administration, College of Wildlife and Protected Area, Northeast Forestry University, Harbin, China
Tree attributes, such as height (H) and diameter at breast height (D), are essential for predicting forest growth, evaluating stand characteristics and developing yield models for sustainable forest management. Measuring tree H is particularly challenging in uneven-aged forests compared to D. To overcome these difficulties, the development of updated and reliable H-D models is crucial. This study aimed to develop robust H-D models for Larix gmelinii forest by incorporating stand variables. The dataset consisted of 7,069 Larix gmelinii trees sampled from 96 plots at Northeast China, encompassing a wide range of stand densities, age classes, and site conditions. Fifteen widely recognized nonlinear functions were assessed to model the H-D relationship effectively. Model performance was assessed using root mean square error (RMSE), mean absolute error (MAE), and the coefficient of determination (R2). Results identified the Ratkowsky model (M8) as the best performer, achieving the highest R2 (0.74), the lowest RMSE (16.47%) and MAE (12.50%), at statistically significant regression coefficients (p < 0.05). Furthermore, M8 was modified into 5 generalized models (GMs) by adding stand-variables (i.e., mean height, mean diameter and volume and their combination), the results indicate that GM2 was the best model achieving R2 of 0.82% and RMSE of 13.7%. We employed generalized nonlinear mixed-effects modeling approach with both fixed and random effects to account for variations at the individual plot level, enhancing the predictive accuracy. The model explained 71% of variability with significant trends in the residuals. The model was calibrated using response calibration method, through EBLUP theory. Our findings suggest that incorporating stand-level variables representing plot-specific characteristics can further improve the fit of mixed- effects models. These advancements provide forest authorities with enhanced tools for supporting sustainable forest management.
1 Introduction
Forest management is essential for the sustainable utilization and conservation of forest resources, predicting ecosystem dynamics, habitat restoration, carbon sequestration, and promoting sustainable livelihoods (Lindner et al., 2010; Pretzsch et al., 2015). It encompasses various practices like growth and yield modeling (Schneider et al., 2024), biomass estimation (Anees et al., 2024), thinning (Sakib et al., 2024), sustainable grazing (Roberts et al., 2021), forest mechanism and reforestation (Saha et al., 2023a; Saha et al., 2023b). The height (H) and diameter at breast height (D) model is an integral part of forest growth and yield models, as an essential input for biomass, carbon budget, and several forest models used in forest management plans (Vanclay, 1995). The correlation between D and H is a pivotal aspect of forestry study, frequently employed for estimating forest resources and wood production (Fu et al., 2018). So, accurately assessing trees H and D is essential for efficient forest management (Adame et al., 2008) and modeling growth in stands (Calama and Montero, 2004). Measuring D is a quick, easy, and reliable process (Lin et al., 2022), while measuring H is difficult, time-consuming, and costly (Zang et al., 2016). Moreover, the measurement of H is often severely affected by visual impairment, which may produce extensive bias (Wang et al., 2019).
Hence, H and D relationship models are widely used to address these challenges (Ng'andwe et al., 2019). By this modeling approach, H of a few sample trees and D of all trees are measured in a specific plot, and the total height of the whole plot is predicted with H-D models (Hao et al., 2016). Developing H-D regression models decreases the cost of field-level data acquisition (Bettinger et al., 2016). These models facilitate the appropriate formulation of stand structure (Dorado et al., 2006), volume, biomass, and other critical parameters essential for growth modeling and sustainable forest management (Parresol, 1992).
Many H-D relationship models were created and analyzed, including simple to generalized models (Temesgen and Gadow, 2004) and linear to nonlinear models (Mehtatalo and Lappi, 2020). Simple models utilize H as a responsive variable to D as an independent variable. The relationship between H and D is not constant and varies from stand to stand, making simple models unreliable in estimating H from D (Ciceu et al., 2020). Generalized H-D models associated with stand-level derivatives, such as mean diameter (MD), Mean height (MH), Stand density (Ns), and basal area, can better explain the H-D relationship and overcome stand-level variations (Bronisz and Mehtätalo, 2020). The addition of stand-level variables better explains the influence of climatic and topographic factors on growth by capturing variability more effectively (Carrer et al., 2007). The connectivity between H-D exhibits a hierarchical structure, indicating that measurements, even those obtained from the same plot or stand, are not independent and have variations (Arcangeli et al., 2014). This situation becomes more critical in uneven-aged forests, resulting in highly correlated data (Ciceu et al., 2020). To overcome this situation, mixed effect models consist of fixed effect features applied to the entire population (i.e., trees) and random effect features extended to every specific sampling tree level (Pinheiro and Bates, 2006). These features improve the effectiveness of mixed-effects models, especially for making new predictions by utilizing existing available information. The mixed-effects modeling strategy addresses the higher variability of tree H at the stand level (i.e., sample plot level). It improves the model’s accuracy and predicts an unbiased and efficient estimation of the H-D growth model (Dorado et al., 2006).
The mixed effect modeling approach is applied to linear and nonlinear models to analyze highly complicated data. The relationship between H and D mostly shows nonlinear behavior, as growth is affected by different ecological factors (Huang et al., 1992). Nonlinear mixed effect models (NLME), including conventional regression models, utilize fixed parameters to evaluate covariate or treatment effects. In contrast, random parameters describe the variability and unpredictability of data from recognized and unrecognized sources and improve prediction accuracy for unmeasured and unrecorded field samples (Dong et al., 2016). Due to their flexibility, NLME models are frequently used in forestry for growth and yield modeling (Fang and Bailey, 2001; Corral-Rivas et al., 2014).
Larix gmelinii (Dahurian larch) is very significant for its widespread distribution across northeast Asia, including China, Russia, and Mongolia. In Northeast China, it is a dominant tree species that covers an area of about 3.14 million ha, with a volume of 18.4 million m3 (Chen et al., 2017). It is renowned for its adaptability, rapid growth, and resistance to very low temperatures (Luo et al., 2024). Larix gmelinii is very important in forest ecosystems, and sustainable forest management (Huang et al., 2024). The impacts of climate change on its growth and distribution have made precise growth modeling essential for sustainable forestry management in China (Luo et al., 2024). This study aims to evaluate and model height–diameter relationships by a nonlinear mixed effects modeling approach for L. gmelinii to determine tree heights with higher precision and accuracy with suitable variables. This modeling framework enhances predictive accuracy and provides both macro-and micro-level understandings essential for conservation and sustainable management. The prospective objectives are to (1) identify the most suitable model from fifteen base H-D models, (2) integrate stand-level parameters to create a generalized model, and (3) practice a nonlinear mixed-effects modeling approach to improve predictive accuracy.
2 Materials and methods
2.1 Study area
The study was conducted at the Cuigang Forest Farm in the Daxing’an Mountains of Heilongjiang Province, Northeast China, located between 123°20′ to 124°21′E and 52°16′ to 52°47’N (Zhang et al., 2020). This forest region, characterized by low to medium-elevation mountains, features a distinctive northeast-to-southwest orientation with altitudes ranging from 180 m to 1,530 m above sea level. The area receives an annual precipitation of 450 mm to 500 mm, primarily during summer. Temperatures in the region vary significantly, from −52.3°C in winter to 40.6°C in summer. The climate is classified as cold temperate with a continental monsoon influence, featuring warm, humid, shorter summers and cold, dry, longer winters. Snow cover, approximately 50 cm deep, persists for about five months during winter. The soil types in this area include dark brown coniferous forest soils, which form under the combined influence of warmth and moisture in mixed forests, with meadow and swamp soils prevalent in lower elevations. The predominant vegetation comprises Larix gmelinii in natural forests, along with Betula platyphylla, Populus davidiana, Picea platyphylla, Pinus sylvestris, Quercus mongolica, and Alnus sibirica.
2.2 Data compilation and evaluation
In 2022, data were collected from 7,069 larch trees randomly selected from 96 sampling plots (20 m × 30 m), representing stand densities, ages, and site characteristics of natural Larix gmelinii forests (Stehman, 2012). Comprehensive ecological data were accurately recorded, including physiographic, climatic, biotic, and edaphic factors (Tatian et al., 2010). H was measured using a ultrasonic altimeter (Vertex Laser Geo, 0.1 m), and D was measured with a diameter tape (Saliu et al., 2021). Only dominant, mature trees with H ≥ 1.3 m and D ≥ 5 cm were considered; trees with deformities or damage and missing data were excluded to ensure data accuracy (McCarthy et al., 2001). After initially processing and refining data, H and D of 7,036 trees were used for model training (n = 4,925) and model testing (n = 2,111). Further statistical analysis and modeling were conducted in R 4.2.2 (R Core Team, 2024), utilizing nlme, dplyr, and ggplot packages. Descriptive statistics for variables are also calculated in Table 1.
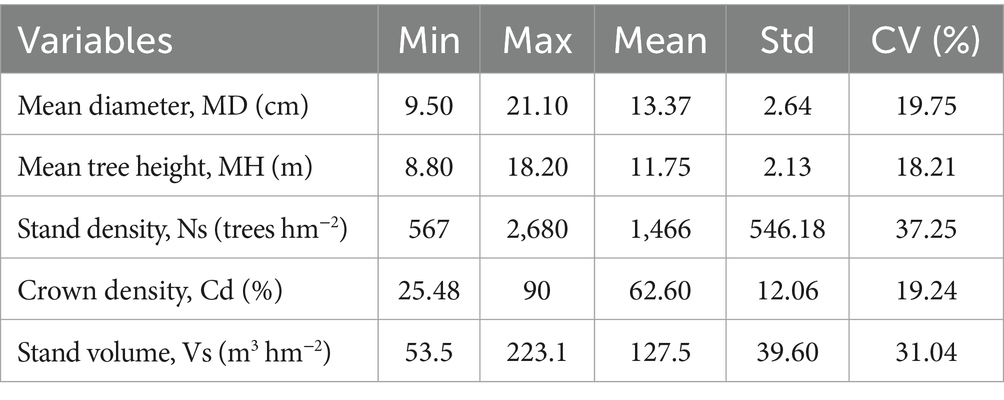
Table 1. Descriptive statistics of natural Larix gmelinii forests in northeast China, where Std is standard deviation, and CV is coefficient of variation.
2.3 Selection of H-D base models
We evaluated 15 models (Table 2) divided into two-parameter (n = 9) and three-parameter (n = 6) models widely used in the literature to find the best one. Other researchers have widely used the mentioned models to assess the association between H and D with significant variability.
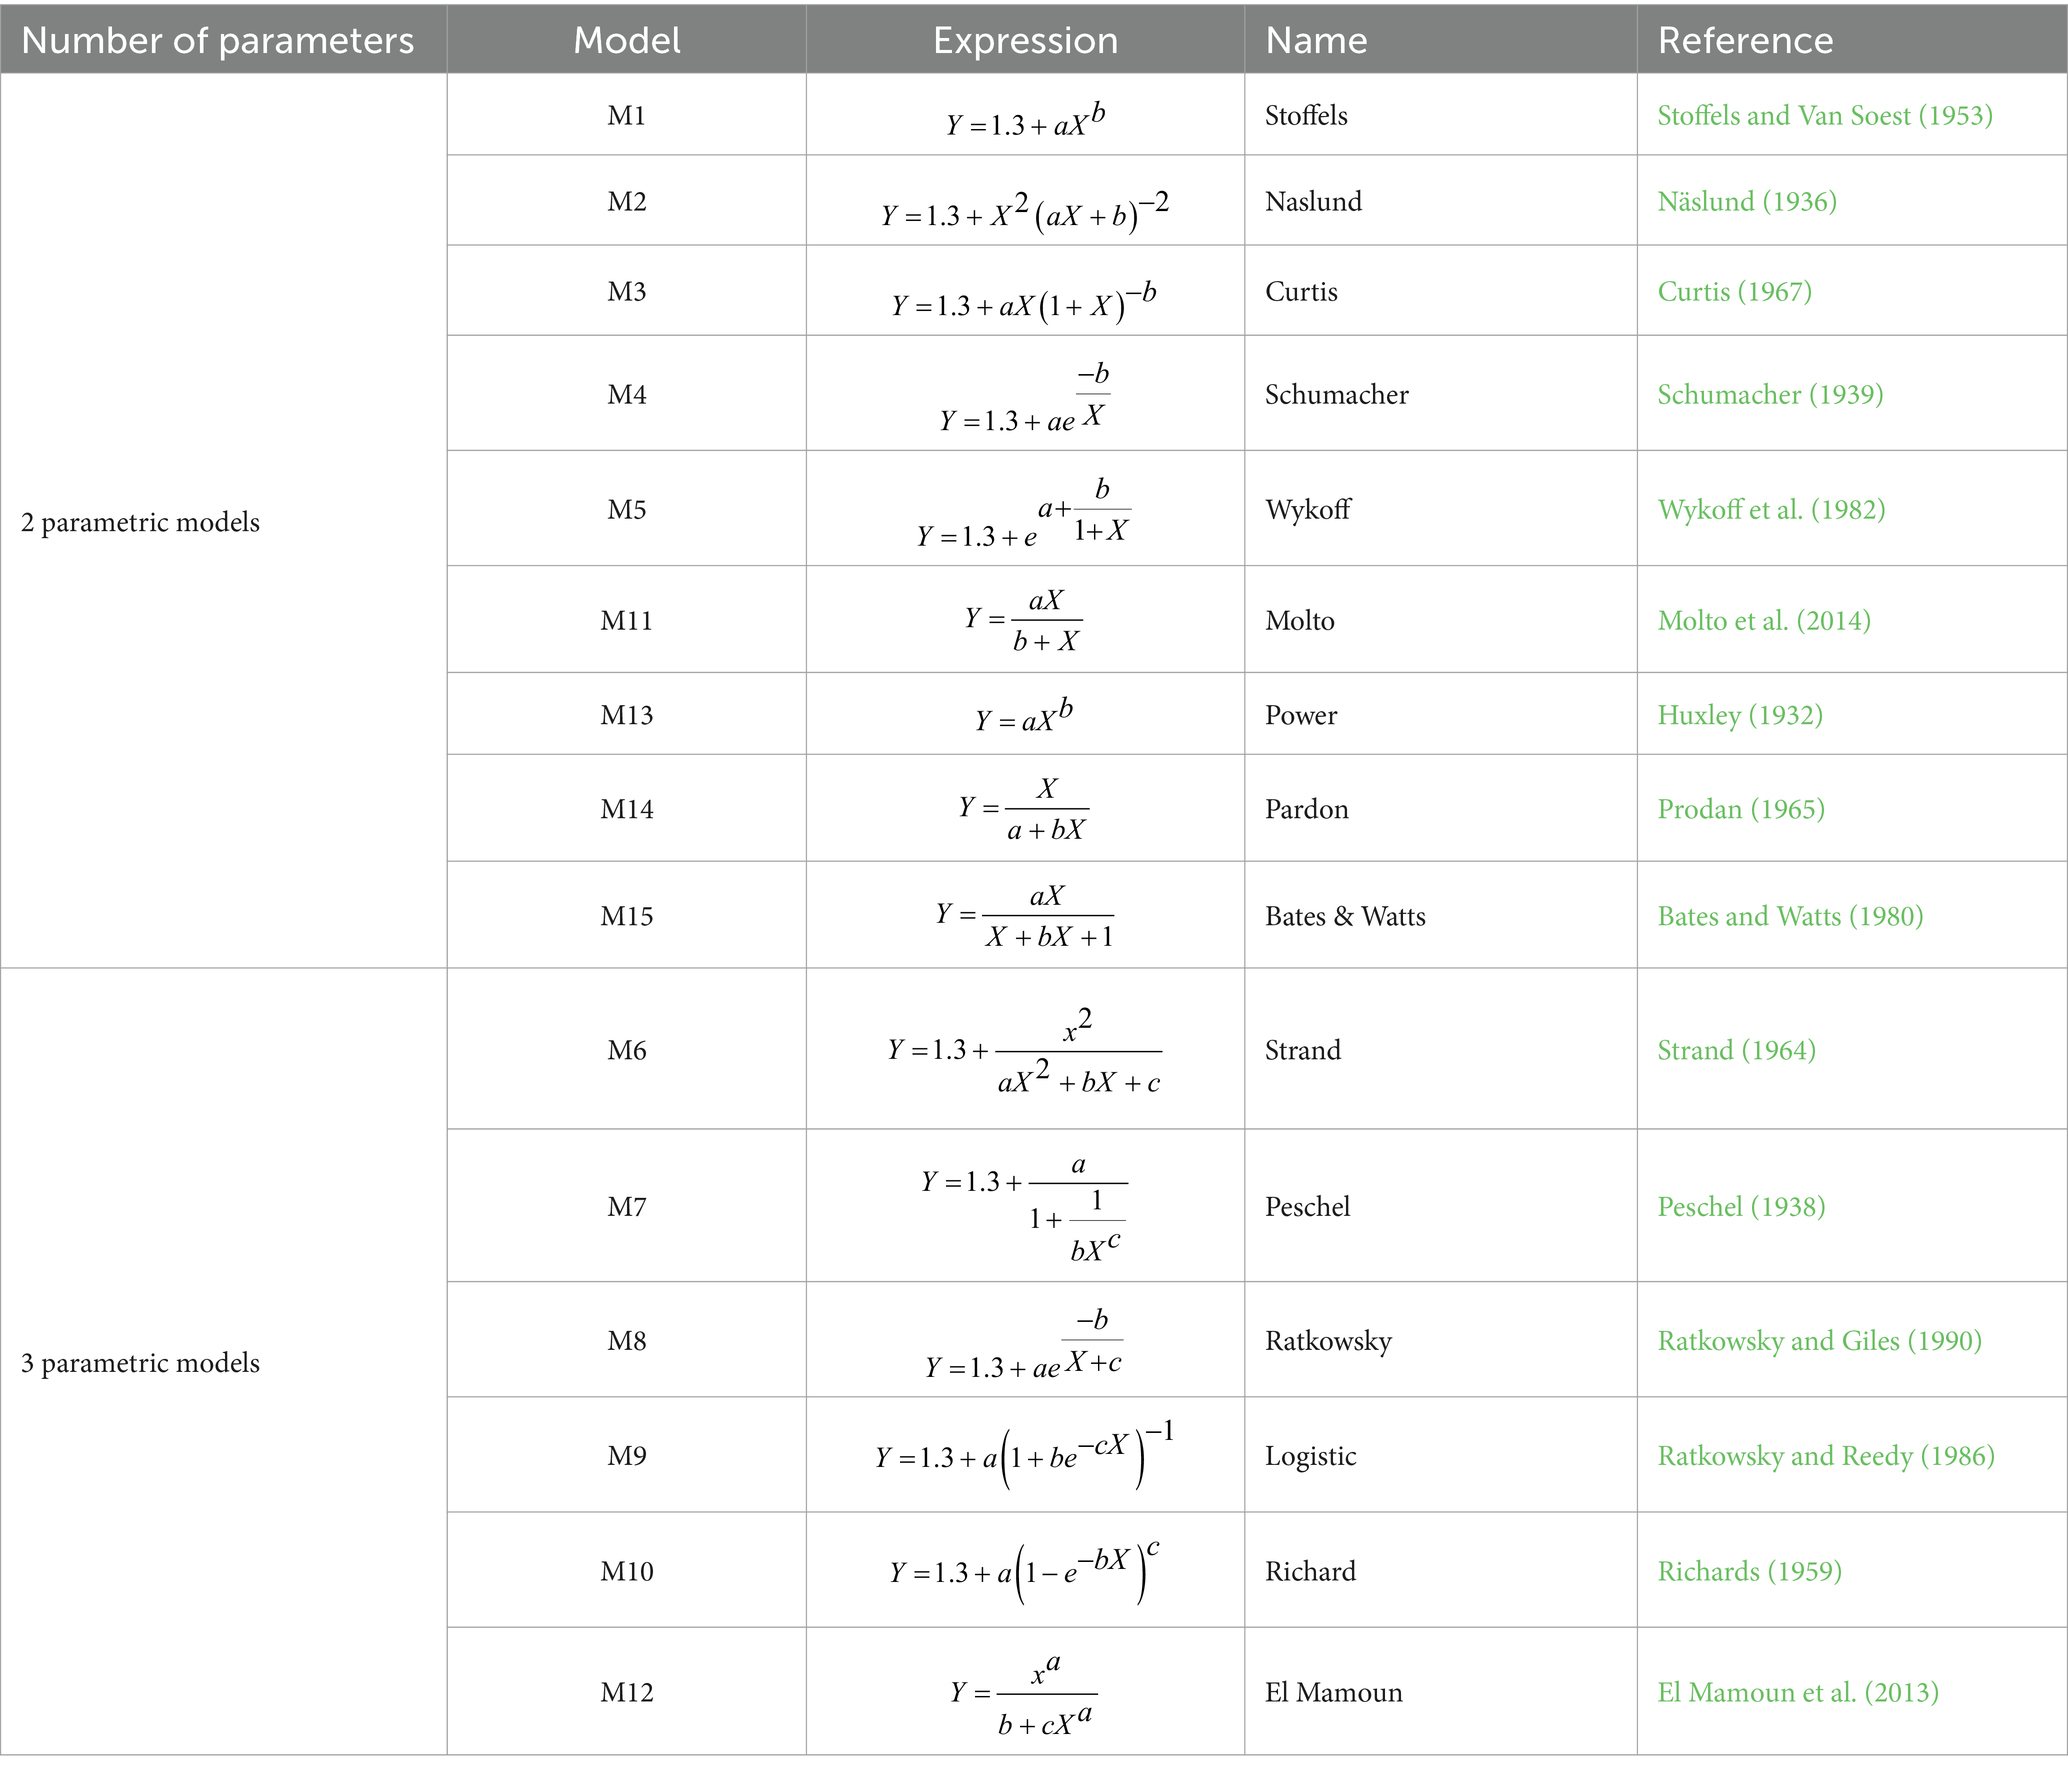
Table 2. Alternative models of H and D for Larix gmelinii in northeast China.
The M1 was applied in forest growth and yield modeling for species with high data variability (Stoffels and Van Soest, 1953). M2 was widely used in European conifers’ H-D modeling (Näslund, 1936). M3 was used in secondary-growth Douglas fir stands (Curtis, 1967), while M4 was applied to model the relationship between H and D in managed forests (Schumacher, 1939). M5 designed for single species, was influential in analyzing mixed-species forest data (Wykoff et al., 1982). M6 was used in forest dynamics, growth, and yield analysis of forest data (Strand, 1964) and played a vital role in Scandinavian forest growth simulations. The M7 and M8 models were documented in several ecological datasets, including H-D data from both plantations and natural forests (Peschel, 1938; Ratkowsky and Giles, 1990). M9 and M10 were effectively utilized in non-linear H-D models of mixed open stands with trees of different ages (Richards, 1959; Ratkowsky and Reedy, 1986). M11 was used to estimate tree H in tropical forests (Molto et al., 2014), and M12 was utilized for forest growth assessments to explain species-specific growth patterns (El Mamoun et al., 2013). The M13 power equation was applied in forest growth modeling to clarify relationships between variables, especially when growth patterns show exponential or allometric scaling (Huxley, 1932), and M14 was employed to analyze forest growth in temperate zones (Prodan, 1965). Lastly, M15 was utilized for non-linear data fitting (Bates and Watts, 1980).
Furthermore, the models’ significant characteristics are considered, as outlined by Lei and Parresol (2001) and Peng et al. (2001). Firstly, the desirable mathematical features, such as the number of parameters and flexibility, were considered. Secondly, the potential biological interpretation of the parameters and the models providing accurate predictions for the H-D relationships were ensured. Each model presented in Table 2 can be expressed in a more generalized format as follows, as described in Equation 1 (Salas-Eljatib et al., 2021)
where represents a set of observations for the dependent variable H, while corresponds to observations for the independent variable D. The vector denotes the parameters for estimation, and stands for a set of random errors. A constant value (1.3) was added to the right-hand side of all H-D models to meet the condition that tree H should be 1.3 m when tree D is zero. The scatter plots (Figure 1) illustrate a significant positive correlation (r = 0.82) between H and tree D. This suggests that tree H also tends to increase when D increases.
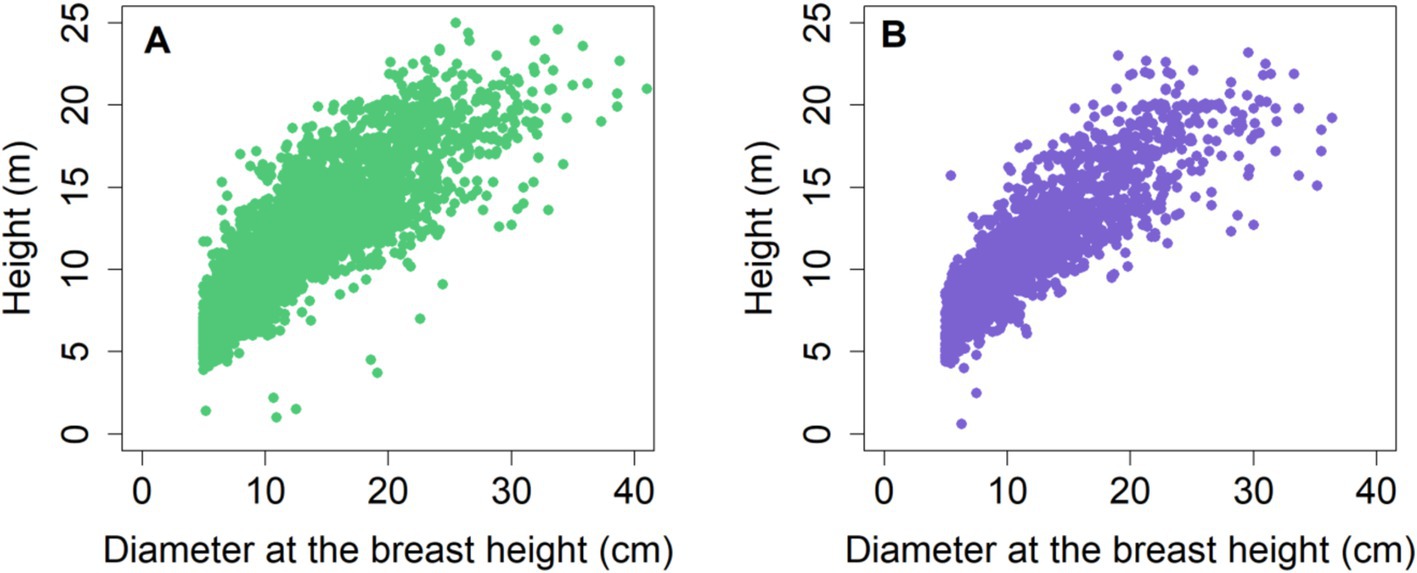
Figure 1. Scatter plots for (A) training date and (B) testing data.
2.4 Generalized H-D models
Addressing the variability across various stand conditions, the initial base model, which solely relies on D as a predictor, was further analyzed. This evaluation involves integrating stand-related variables into the model to capture the characteristics and conditions of each stand. The resulting model was termed a generalized H-D model. Staudhammer and LeMay (2000) outline two approaches for integrating stand variables into base H-D models. The first approach, known as “parameter prediction” or the “two-stage” method, involves establishing the relationship between trees H and D for each plot in the initial stage. In the subsequent stage, the parameter estimates derived are linked to stand variables. The second approach, known as the “direct approach,” involves directly incorporating stand variables into the model (Parresol, 1992). It is noted that there is no definitive preference between these two methods in terms of the quality of the best fits. The parameter prediction method might be preferred because it uses additional variables to predict parameters, making the model easier to interpret (Staudhammer and LeMay, 2000). However, this approach could lead to a complex model with numerous coefficients, especially when multiple additional variables are included, making it challenging to choose starting values for model fitting using nonlinear least squares regression. This observation was also apparent in our preliminary analysis. Consequently, we opted for the direct method following Adame et al. (2008), Sharma and Parton (2007), and Temesgen and Gadow (2004), which allows for the creation of a more concise model compared to the parameter prediction approach. In this study, stand variables such as mean diameter at breast height (MD), mean height (MH), and stand volume (V) (Table 1), characterizing the plots, were tested for inclusion in the base H-D model. Following the assessment of various stand variables, it was determined that integrating additional stand variables (MD, MH, DH, and Vs) enhanced the model’s fitness.
2.5 Non-linear mixed-effect model
The mixed-effect model simultaneously incorporates both fixed and random effects, allowing it to capture overall population trends and individual-level variations. This dual capability provides greater flexibility compared to traditional nonlinear models. This approach enhances significant differences across plot levels by reducing the bias. Model assumptions were verified through residual analysis, examining residual plots for evidence of random and fixed effect structures or patterns that might indicate model performance. In recent years, mixed-effects models have gained traction for addressing more considerable variability in tree H at the subject level, such as the sample plot level, thereby improving prediction accuracy. Unlike conventional models that only predict average population outcomes, mixed-effects models account for group-specific variations, overcoming this limitation. They apply to both individual and generalized H-D models.
Non-linear mixed-effect models offer several advantages over standard linear models in uneven-aged forest growth modeling. First, they accommodate hierarchical data structures by modeling the covariance among random parameters within and between sampling units, thereby reducing the interdependence of measurements (Calama and Montero, 2004; Demidenko, 2013). Second, these models balance the complexity of global models, which have few parameters but ignore sampling unit variability, with the specificity of local models that often involve many correlated parameters (Pinheiro and Bates, 2006). Third, by accounting for parameter variation at each level of the sampling hierarchy, mixed-effects models provide unbiased parameter estimates even for units with small sample sizes. Finally, they can be efficiently calibrated for new or un-sampled plots or stands, especially if random parameters can be estimated from covariates (Lappi, 1991; Lynch et al., 2005).
In essence, a nonlinear mixed-effects model applied at the plot level can be represented in matrix form, as described in Equation 2 (Pinheiro and Bates, 2006). This matrix formulation allows for the modeling of both fixed effects, which capture tree-level trends, and random effects, which account for variation at the plot level (Timilsina and Staudhammer, 2013).
where represents a response vector for H measurements for the -th plot, and includes predictor variables for that plot. In the equation, = + represents fixed effects, represents random effects, and represent residual error. was the design matrix that links fixed parameters to the observed data. represents the fixed-effect parameters, capturing population-level trends in H as influenced by predictor variables. was a design matrix that links random effects to the data, allowing for flexibility in plot-specific variation. denotes the random effects vector for the plot , which was assumed to follow a multivariate normal distribution with mean zero and a variance–covariance matrix . The random effects capture unobserved variability between plots, and the elements represent variances and covariances rather than correlations. represents the residual errors for the plot , which was assumed to follow a normal distribution with mean zero and plot-specific variance–covariance matrix of the observation error components in .
2.6 Performance evaluation
We applied model M1-M15 growth equations to our dataset based on their suitability, model structure and their potential to accurately capture the growth dynamics in our study. Each model was parameterized estimating optimal parameters (a, b, and c) and their respective standard errors (SE). Subsequently, we assessed the effectiveness of each developed model through performance on the basis of three main criteria: (i) Root Mean Square Error (RMSE) was employed goodness-to-fit criteria to evaluate the accuracy of a model or estimator by quantifying the disparities between the projected values and the observed values (Anderson and Burnham, 2004), (i.e., minimum the value higher the performance). (ii) Mean absolute error (MAE) to explain variations in model predictions (Hodson, 2022). (iii) Coefficient of determination (R2) provides a comprehensive measure of model reliability.
We assessed each model’s precision, accuracy, and reliability in predicting the H of Larix gmelinii. The measured H of Larix gmelinii trees are compared with the H estimated by each model. Equations of Statistical indicators can be expressed in matrix form Equations 3–5, respectively.
The Akaike Information Criterion (AIC), as described in Equation 6 (Tanovski et al., 2023) Bayesian Information Criterion (BIC), as described in Equation 7 (Sclove, 1987) and log-likelihood, as described in Equation 8 (Joreskog, 1969) are utilized to evaluate the disparity between a simple base model and a sophisticated nonlinear mixed-effects model (Aho et al., 2014); (iv) AIC addresses model accuracy with parsimony, proving it effective for choosing models that excel with larger dataset. Reduced AIC values indicate superior models (Burnham et al., 2011). (v) BIC supports simpler models compared to AIC, particularly with bigger datasets, rendering it optimal for emphasizing explanatory power over complexity (Claeskens and Hjort, 2008). (vi) The log-likelihood represents the probability of the observed data according to the designated model, contingent upon its parameters. Elevated log-likelihood values signify a superior fit (Fuchs, 1982).
The mixed-effects H-D model was calibrated and validated utilizing the empirical best linear unbiased prediction (EBLUP) theory model (Pinheiro and Bates, 2000; Sharma et al., 2019b) to improve predictive precision. The training dataset encompassed trees of various ages and D classifications. The validation dataset primarily consisted of middle-aged and mature forest stands, leading to a reduced number of stems per plot. Calibration entailed estimating random effects by utilizing past information regarding the H-D relationship inside each plot (Hall and Bailey, 2001; Sharma et al., 2019b). To estimate the random effects, five to twelve randomly selected trees per plot were utilized, contingent upon the number of accessible trees, hence resolving the issue of plots containing fewer than twelve trees of a specific species in the validation dataset (Sharma et al., 2019a). The calculated random effects were integrated into the fixed component of the mixed-effects H-D model, producing plot-specific H-D curves and improving the model’s predicted accuracy and robustness for Larix gmelinii.
3 Results
3.1 Optimal base model outcomes
An optimal base model was initially chosen by evaluating statistical parameters from the 15 base models (Table 2). These models were trained and tested using R software’s “nls” function. Based on the findings, the M8 provided the most accurate results with the highest value of 0.74, along with RMSE and MAE of 16.47 and 12.50%, respectively. The M8 emerged as the most effective in estimating tree H. This conclusion was further supported when the models were applied to testing data. The RMSE, MAE, and R2 values across selected base models varied from 16.47 to 17.3%, 12.5 to 13.16%, and 0.72 to 0.74, respectively. All 15 models exhibited similar levels of performance, and estimated regression coefficients for parameters a, b, and c were statistically significant (p < 0.05) (Table 3).
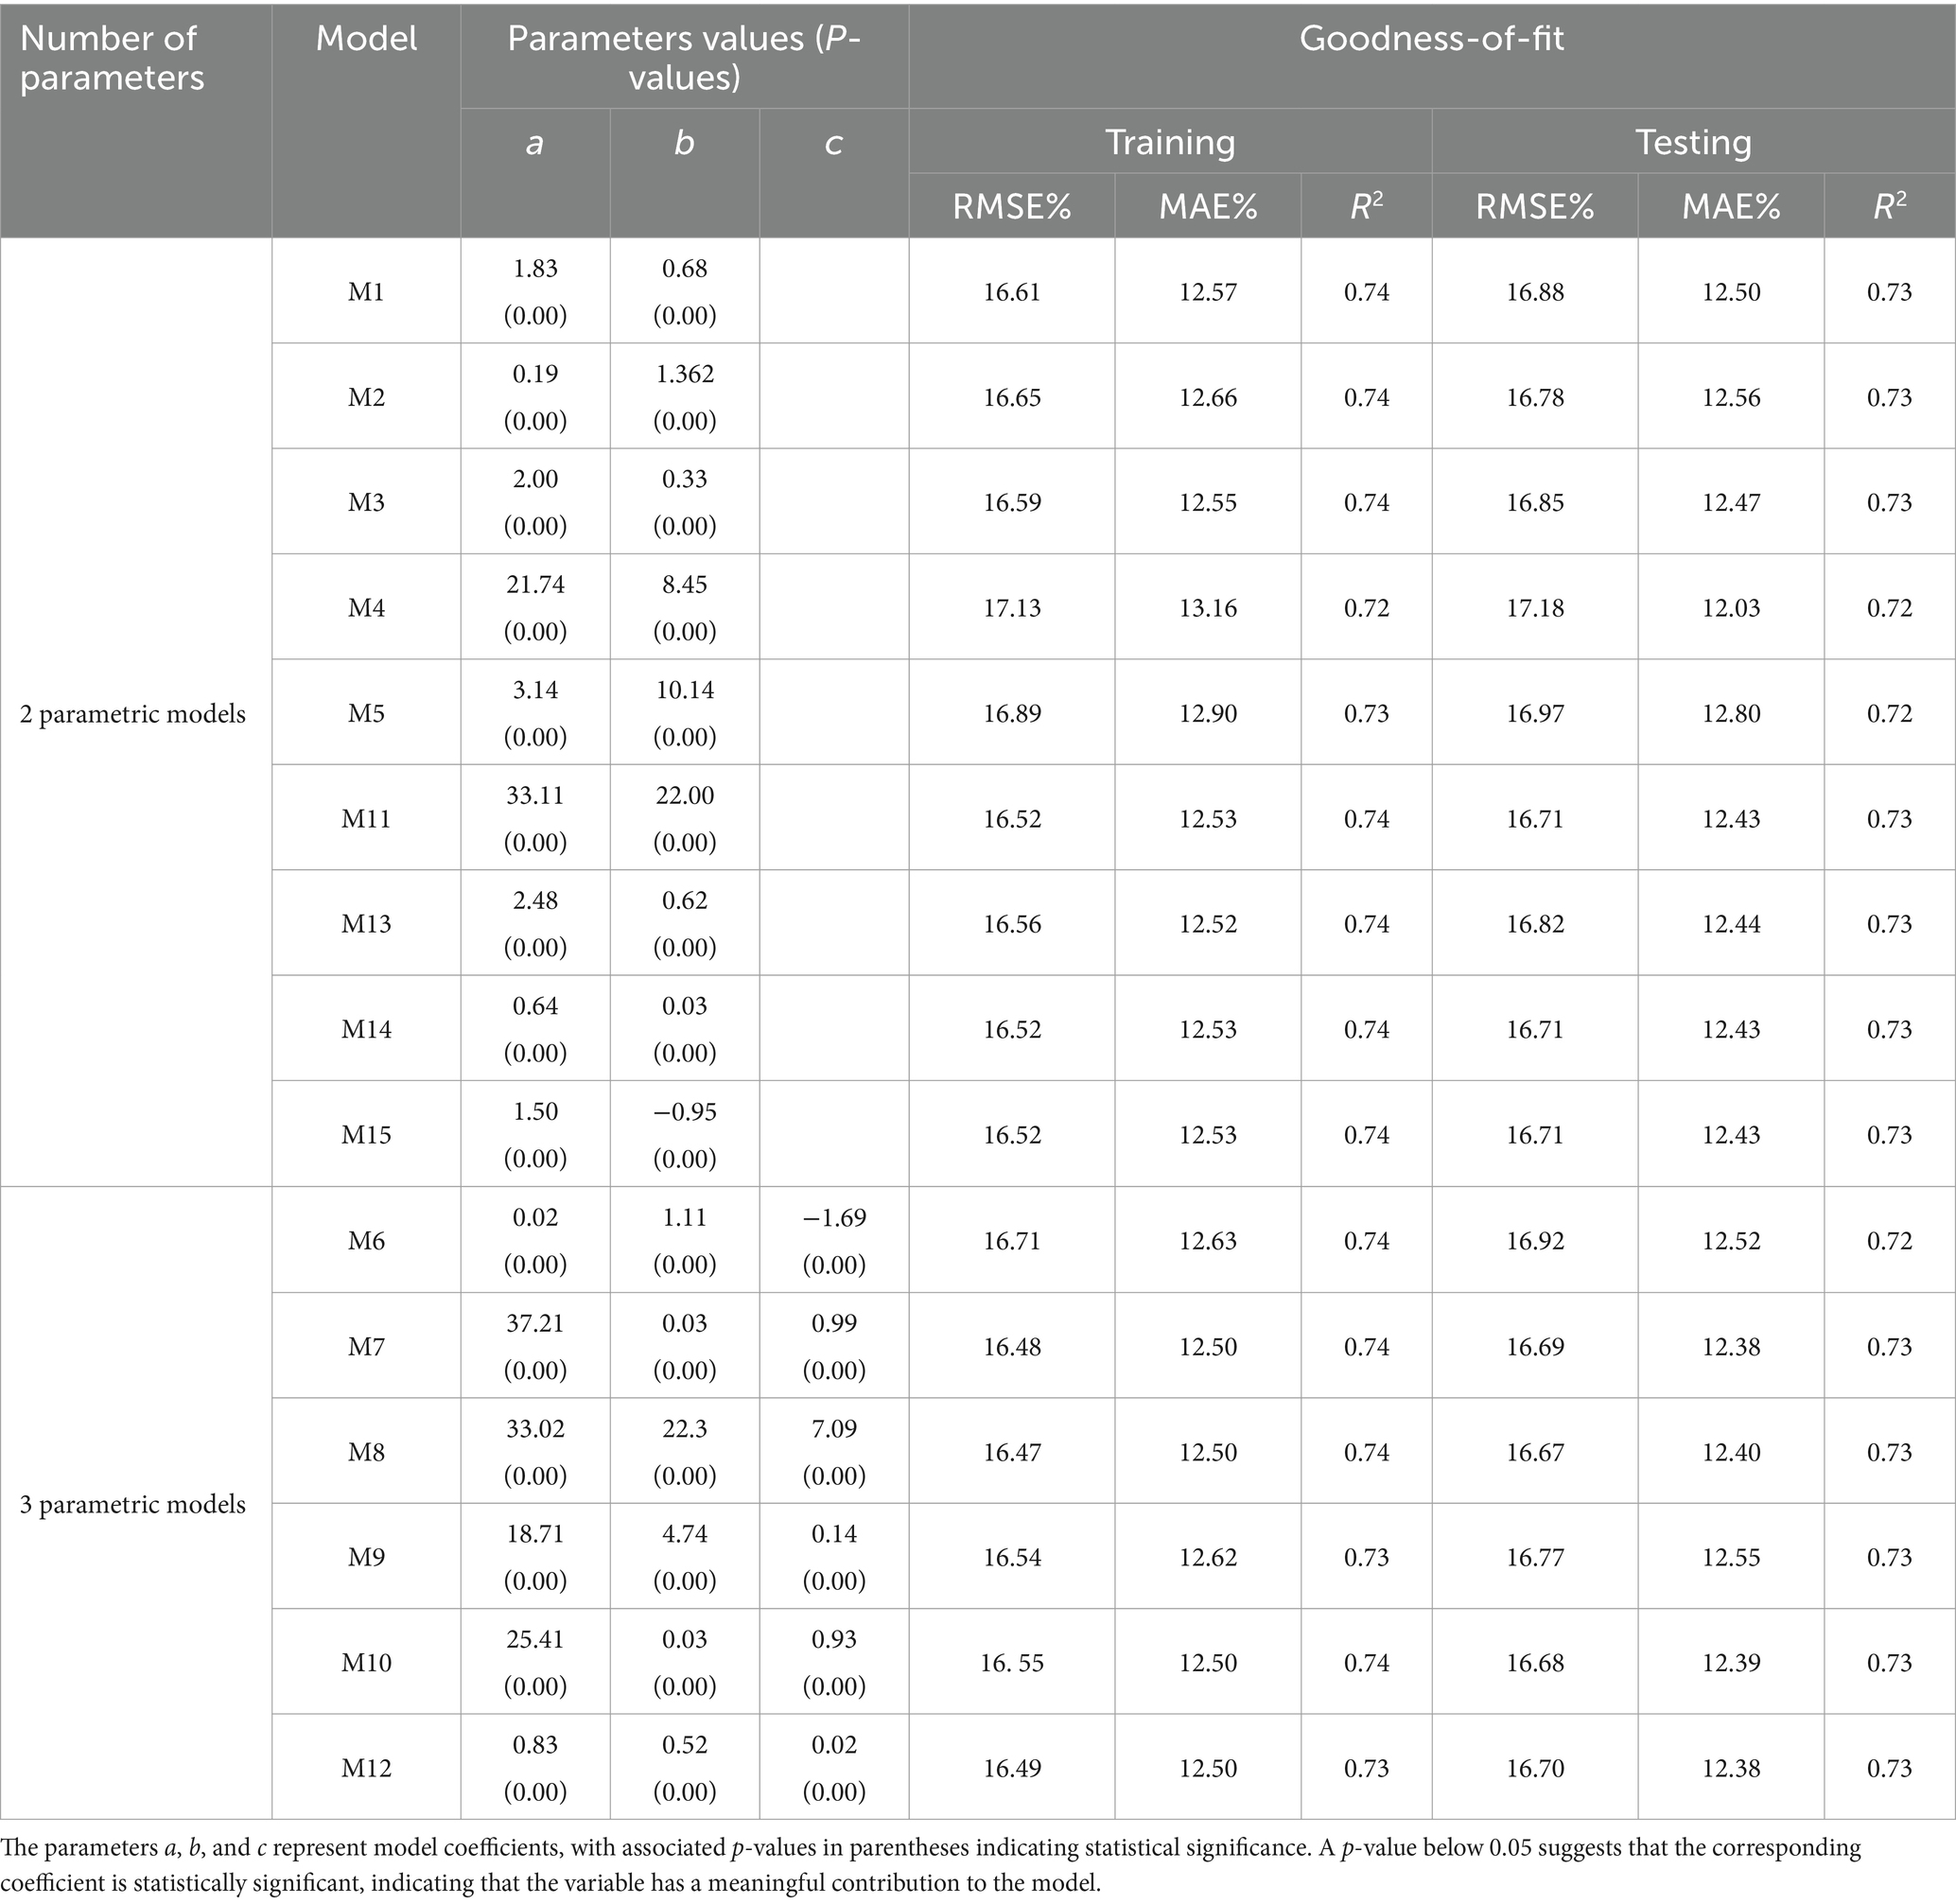
Table 3. Values of estimated parameters (a, b, c) and Statistical parameters; RMSE (Root mean square error), MAE (Mean absolute error), and R2 (Coefficient of determination) for 2 and 3 parametric models, respectively.
The optimal fit lines of two-parameter and three-parameter base models were derived, and the predicted H against D was displayed to represent the correlation between them (Figure 2). The comparison between observed and estimated tree H indicates that the M8 provides the most accurate estimations of total tree H based on D measurements and is selected as the most suitable model out of the 15 base models evaluated. The regression lines of most models exhibit similar patterns, except for M1, M4, M6, M9, and M13, which display deviations compared to those of the other models (Figure 2).
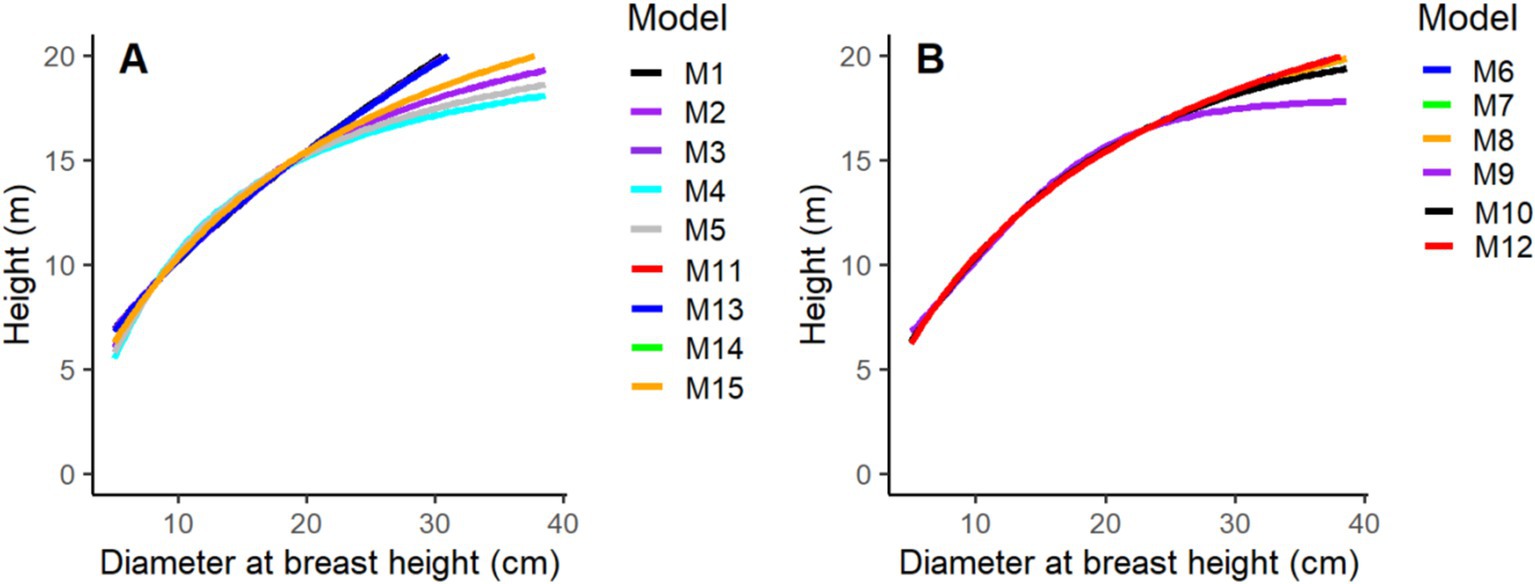
Figure 2. Fitness lines for two-parametric (A) and three-parametric models (B).
This outcome suggests that employing models solely based on D to forecast the total H of trees might not be sufficient for elucidating the variations in tree H across different stands and forest sites, and it may not meet the requirements for effective forest management. When just measurements of the diameter are available, these models could be utilized. However, their ability to predict might be compromised. This is because, regardless of the stand conditions, all trees with the same diameter within a plot would receive the same predicted H. Consequently, it is recommended to incorporate additional stand variables to enhance the accuracy of H predictions.
3.2 Generalized model outcomes
The base H-D model (M8) was extended to encompass generalized independent variables (stand variables) to refine H estimations and account for variations between stands. Initially, multiple models incorporating different combinations of stand variables were evaluated (Table 4).
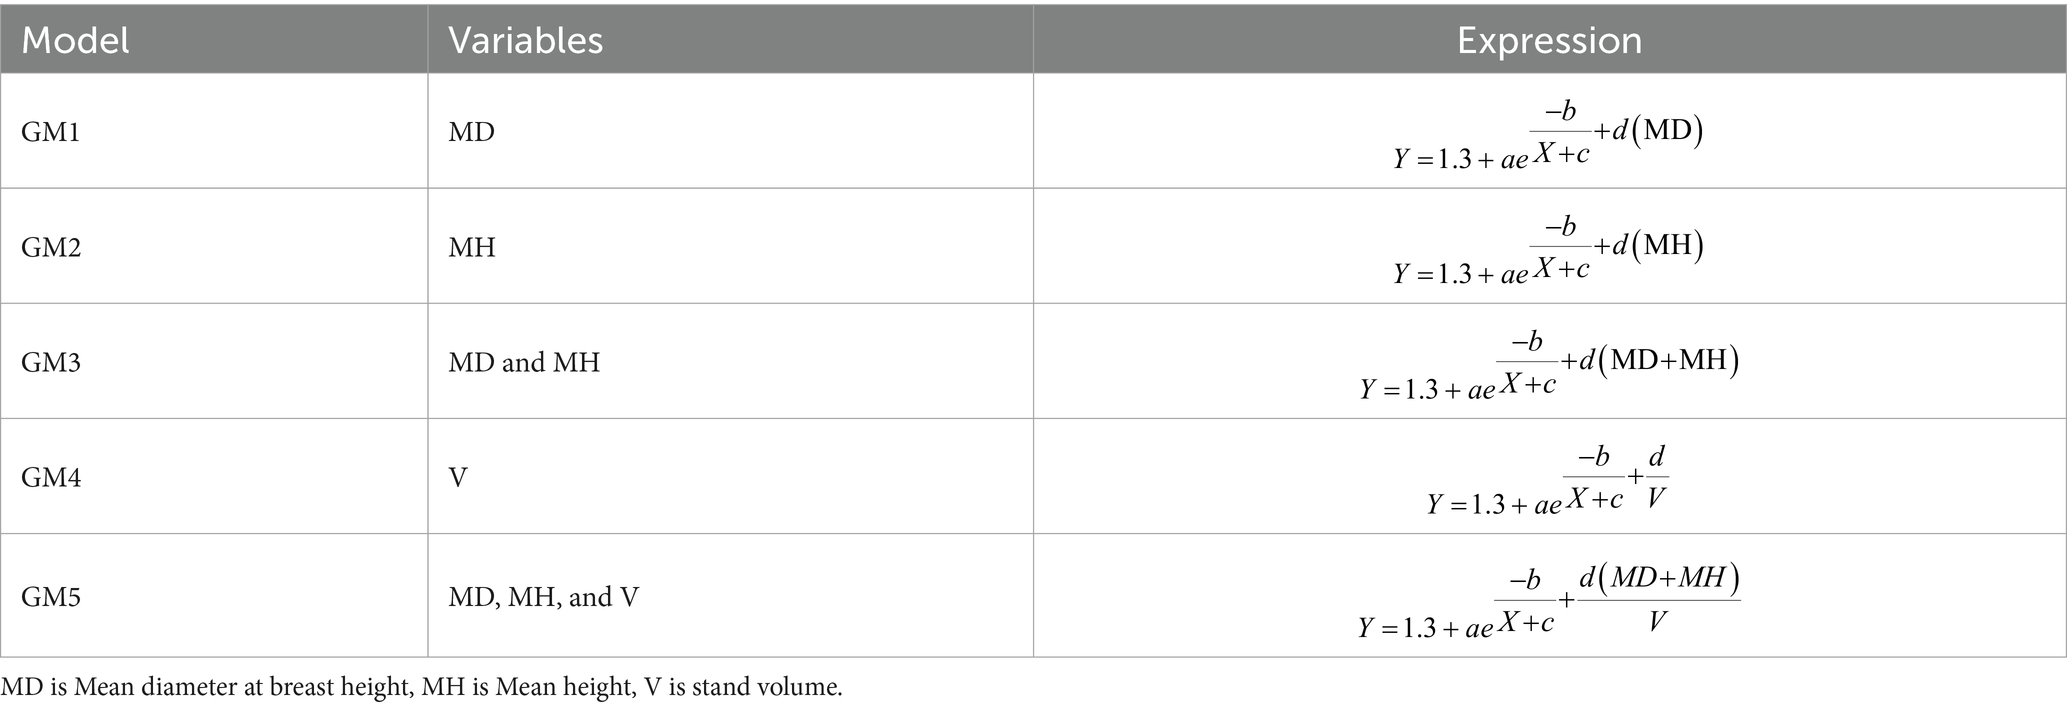
Table 4. Generalized nonlinear models for M8.
The generalized models (GM) are trained and tested to evaluate goodness-of-fit with the coefficients and related statistical indicators. The results show that GM2 was the best-performing model, exhibiting the lowest RMSE and MAE and the highest value of R2 in both the training and testing phases (Table 5). Furthermore, GM1, GM4, and GM5 exhibit higher RMSE and MAE with lower R2 values, indicating poorer predictive performance compared to GM2 and GM3. However, GM3 demonstrates a moderate R2 value in the testing phase, indicating a reasonable level of explanatory power despite its slightly higher errors. Hence, GM2 represents the most accurate predictions of tree H based on the given dataset. However, this model may have limitations in capturing the underlying patterns and variability within plots.
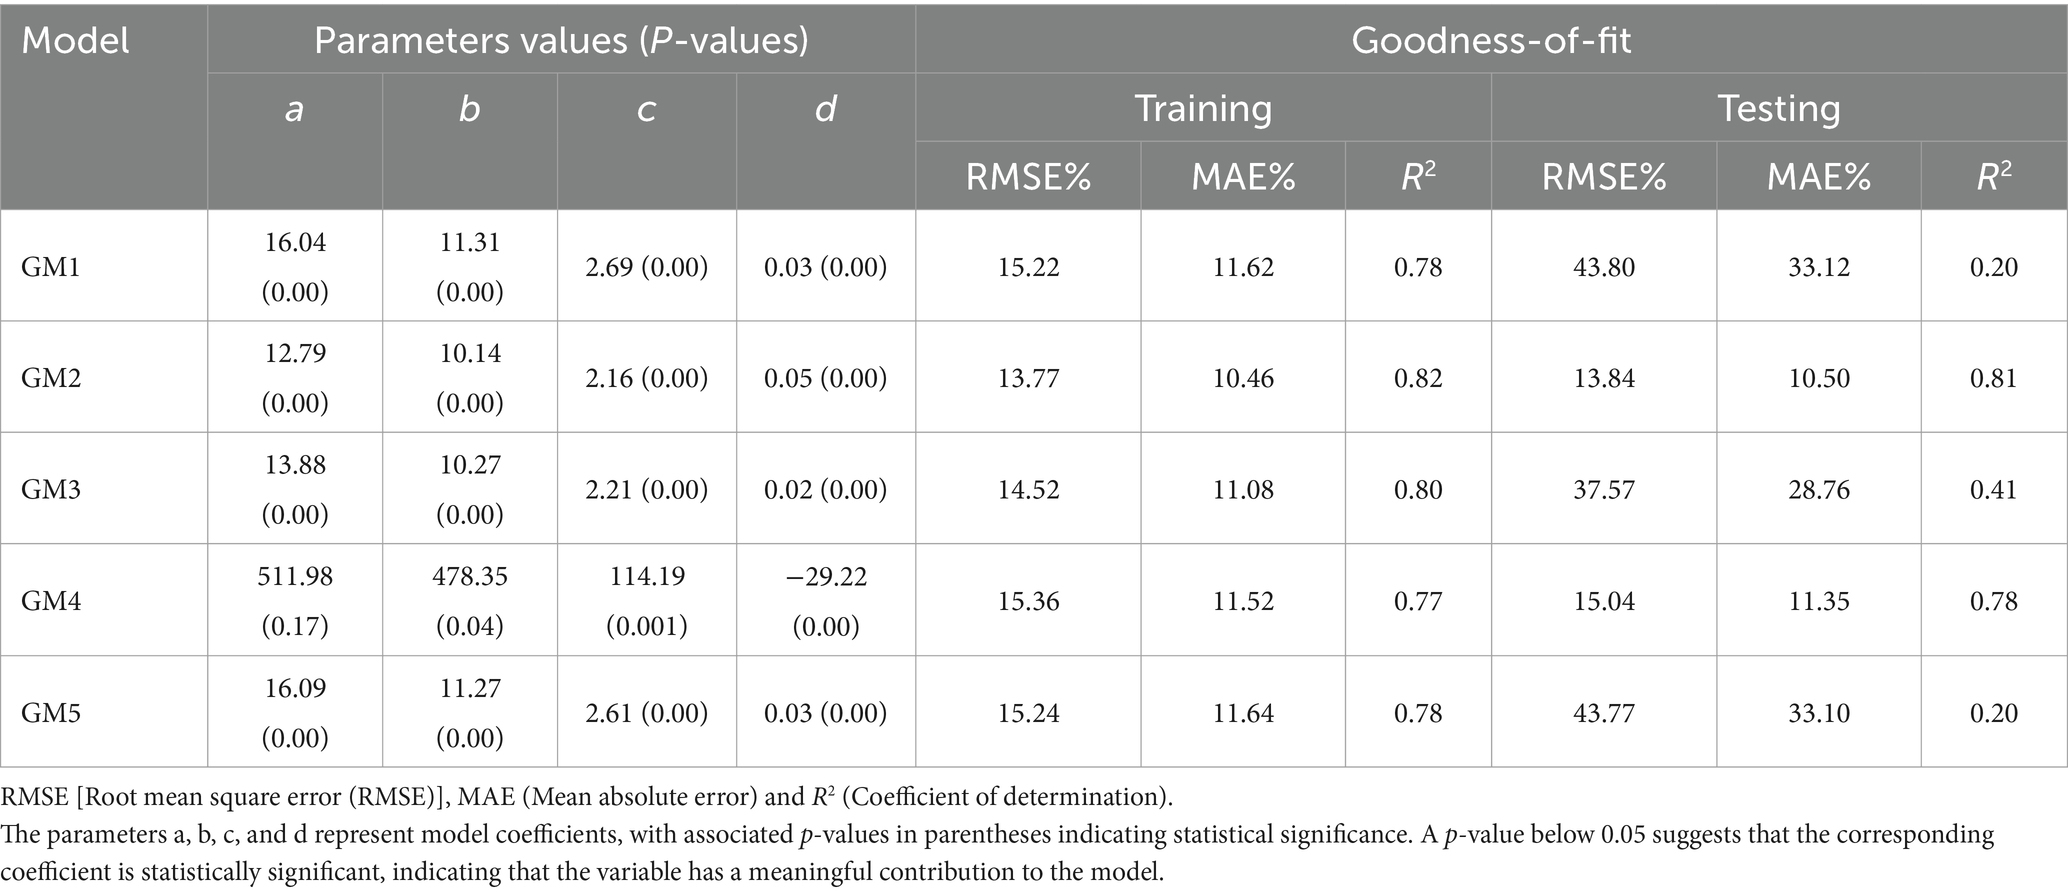
Table 5. Coefficients of generalized mixed effect models.
3.3 Mixed-effect model outcomes
The classical model required three fundamental assumptions (i.e., normality, independence, and homogeneity of variance). The generalized model (GM2) was trained and tested using a nonlinear mixed-effects modeling approach, incorporating both fixed and random parameters. The fixed-effects (Table 6A) reveals statistically significant contributions from all parameters, with coefficient estimates of a (12.56 ± 0.30), b (9.80 ± 0.48), c (1.96 ± 0.31), and d (0.05 ± 0.0009). Each parameter exhibits a highly significant p-value (< 0.001) and strong t-values (ranging from 6.31 to 48.89), indicating that these predictors are robustly associated with the response variable. The substantial magnitudes of a and b suggest that these factors have pronounced impacts, while the precision and significance of d, despite its smaller magnitude, highlight its potential regulatory role. The large sample size (DF = 4,650) further supports the reliability of these estimates, emphasizing the importance of these predictors in explaining variability within the model.
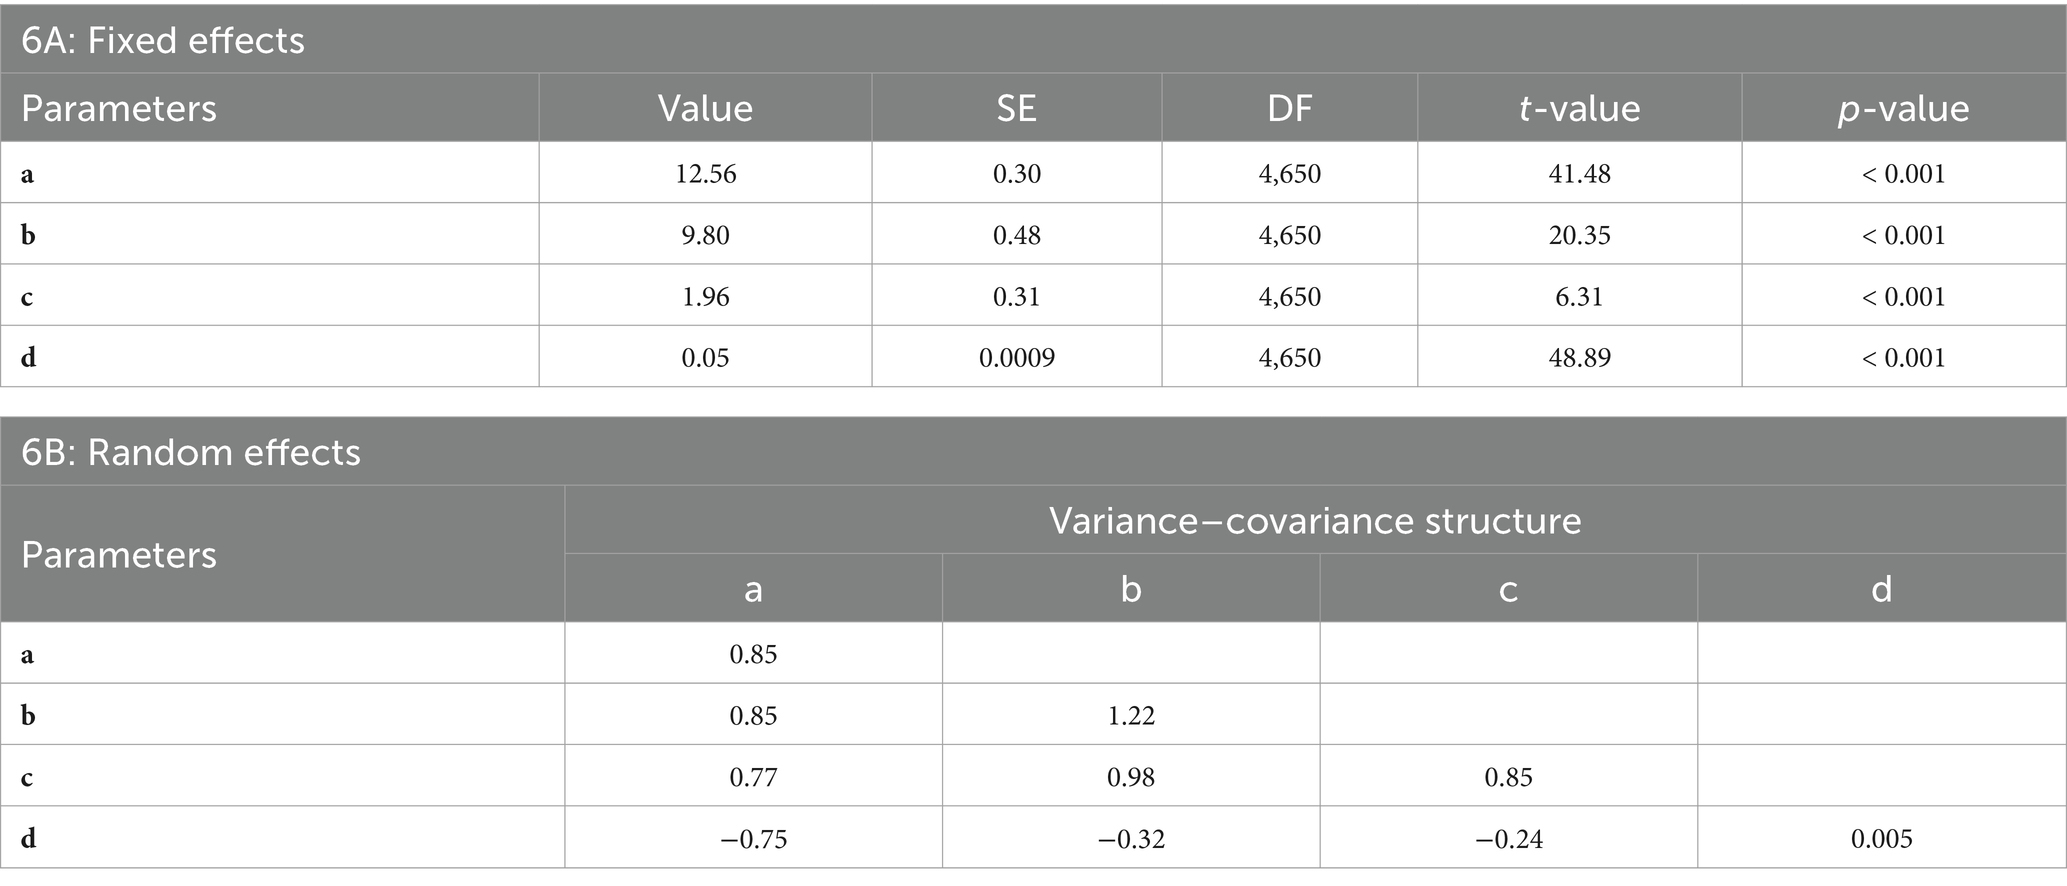
Table 6. Statistical summary of fixed and random Effects in a Generalized Nonlinear Mixed-Effects Model. 6A: Fixed Effects – Displays estimated coefficients (Value), standard errors (SE), degrees of freedom (DF), t-values, and p-values for each fixed-effect parameter. 6B: Random Effects – Displays variance–covariance structure for each random-effect parameter.
Random-effects (Table 6B) were specified for levels of D, with correlation structure and variance function accounted for to address potential correlations and heteroskedasticity. The variances on the diagonal (a: 0.85), (b: 1.22), (c: 0.85), and (d: 0.005) demonstrate major variability for parameters a, b, and c whereas d was very small. The off-diagonal covariance shows strong association, such as the strong positive correlation between a and b (0.85) and the moderate negative correlation between c and d (−0.238). The structured variance–covariance matrix provides evidence of the model’s flexibility and robustness in accommodating complex data relationships, thereby supporting its superiority over simple models. The statistical calculations (Table 6) demonstrated improved results with the inclusion of the stand variable (MH) in the generalized nonlinear mixed-effects model (GM2).
3.4 Validation of the model
The comparison of models M8 and GM2 was conducted using AIC, BIC, and log-likelihood values to assess model fit. Both AIC and BIC favor GM2, which has an AIC of 18224.35 and a BIC of 18269.87, over M8, which has an AIC of 20031.07 and a BIC of 20070.09. These lower values for GM2 indicate a better model fit, achieving an optimal balance between accuracy and complexity. Additionally, GM2 demonstrates a higher log-likelihood value (−9105.177) compared to M8 (−10009.54), providing further evidence of a superior model fit. Based on these criteria, GM2 emerges as the more suitable model, offering an improved fit over M8.
In addition to these statistical indicators, examining predicted H and residuals revealed similarities in the residual values between the two models: M8 as a basic nonlinear model and GM2 as the mixed effect model. However, differences in distribution patterns were observed. The patterns of residuals exhibited similarities with variations in distribution. The distribution of residuals followed a regular circular type pattern, indicating that errors were evenly spread across tree H predictions. The residuals tend to be positioned negatively for trees ranging from 8 to 15 meters in H. This observation holds for the predicted tree H residuals concerning D (Figure 3).
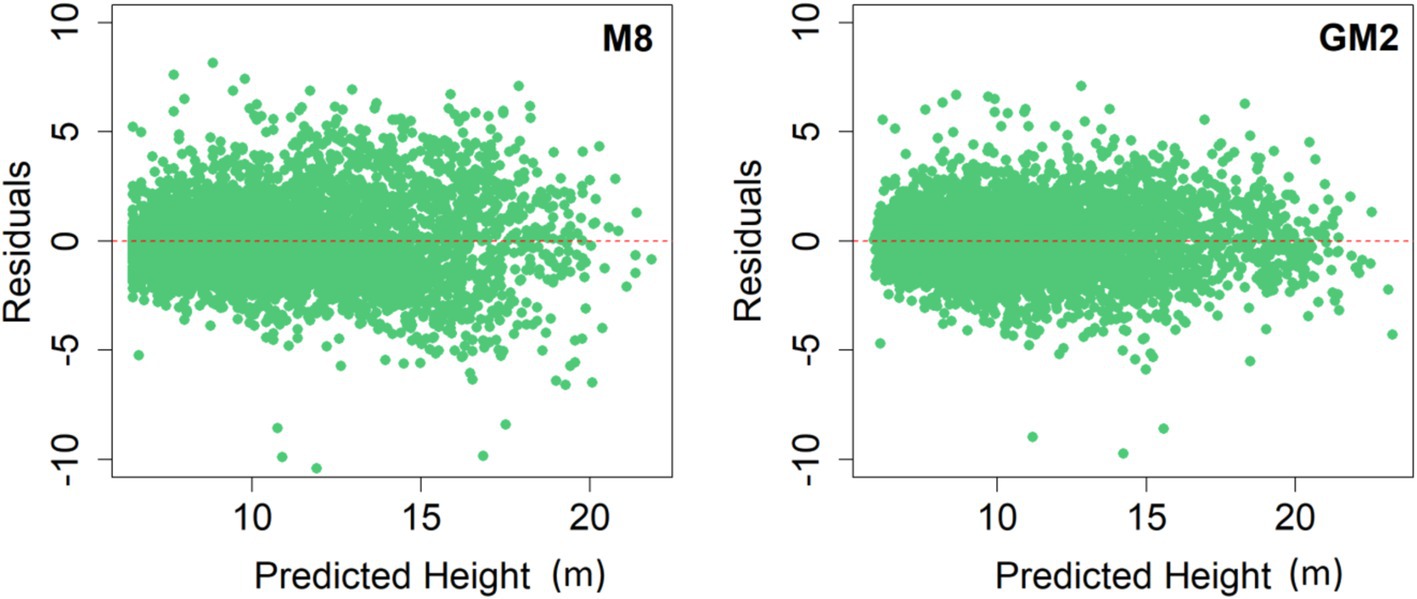
Figure 3. Residuals plots for predicted heights with the optimal base model M8 and generalized mixed-effect model GM2.
In M8, the positive residual errors were more pronounced for trees with both smaller and larger diameters. This phenomenon could be due to the limited number of mature trees with large diameters and the considerable variability in tree H within the plots with large diameters (Figure 4).
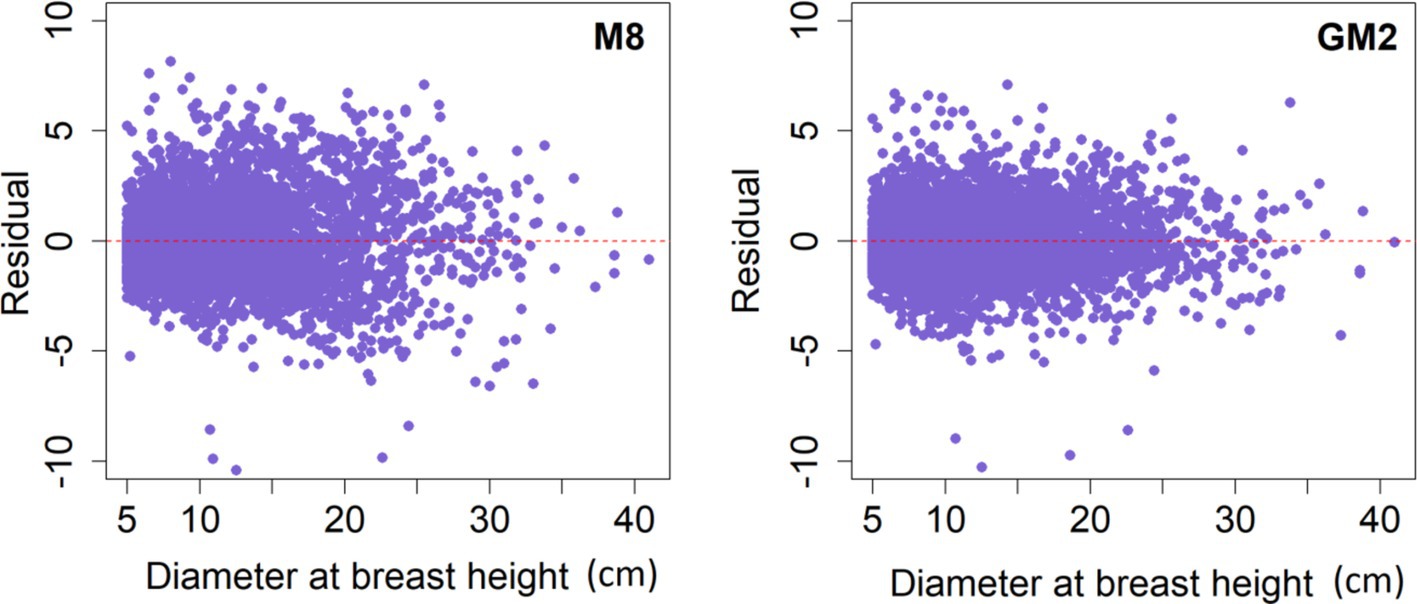
Figure 4. Residuals plots for Diameter at breast heights with the optimal base model M8 and generalized mixed-effect model GM2.
The calibrated mixed-effects model produced simulated H-D curves, which were assessed for all sample plots in the validation dataset (Figure 5). In the majority of plots, the model-predicted curves closely corresponded with the observed height measurements, accurately reflecting the variation for Larix gmelinii. Furthermore, tree height demonstrated a notable positive correlation with increases in MH for a specific D (Figure 6).
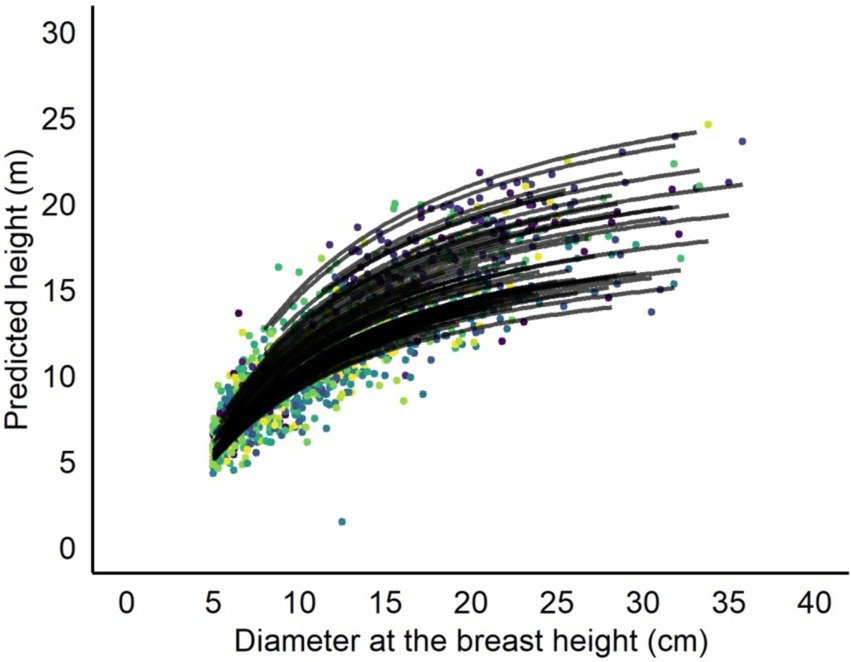
Figure 5. Sample plot predicted height to diameter (H-D) curves overlaid on the validation data. Curves were produced with the calibrated mixed-effects H-D model using the sample plot-mean height as covariate variable and allowing individual tree D of each sample plot. The mixed-effects H-D model was calibrated with the random effect predicted using H-D measurements from Larix gmelinii depending on the availability of their numbers per sample plot in the validation of data set through EBLUP.
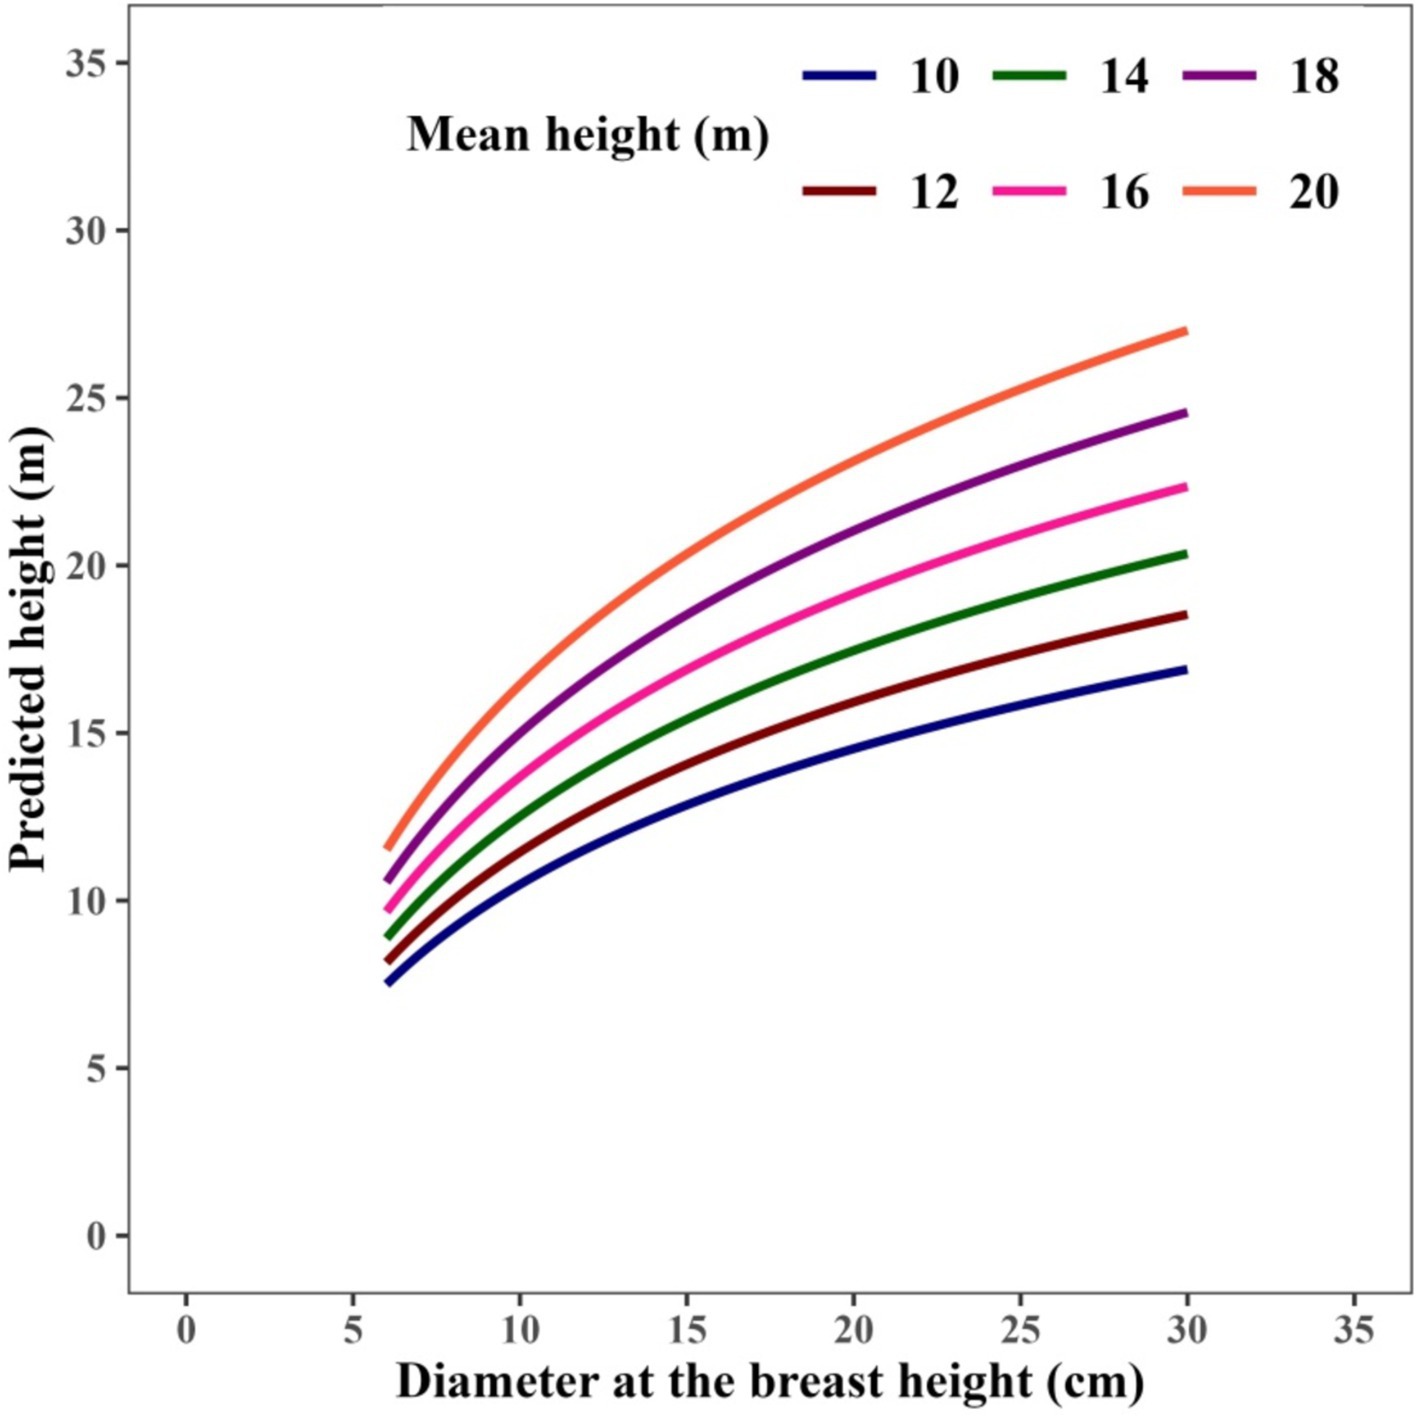
Figure 6. Effects of different mean heights on the H-D curves for natural Larix gmelinii forests.
4 Discussion
Tree H is a critical parameter in modeling to understand forest productivity, health, and resilience for sustainable forest management. Consequently, developing and selecting effective models for tree H estimation is essential in sustainable forest management (Chenge, 2021) and supporting forest management decisions for resource allocation and conservation strategies. This study evaluated and compared 15 H-D model functions to predict tree H, focusing on Larix gmelinii in Northeast China. `In our study, two parametric models, M11 (Molto) and M14 (Pardon), and three parametric models, M7 (Peschel), M8 (Ratkowsky), and M10 (Richard), performed well among the base models. The M8 demonstrated the best-fit performance, with the highest R2 and the lowest RMSE and MAE values. Additionally, the M8 model explained 74% of the total variance in H-D relationships and further demonstrated the highest predictive accuracy based on statistical fit.
Previous studies had demonstrated high goodness-of-fit of M8 in predicting tree H across various forest types, including temperate oak forests (Misik et al., 2016), broad-leaf mixed forests (Cao et al., 2024), and Larix olgensis forests (Xie et al., 2020). Our results are similar to previous findings that three-parameter models generally provide better evaluation results in large datasets if compared to two-parameter models and have only minor differences observed between them (Mehtätalo et al., 2015; Lebedev and Kuzmichev, 2020). Particularly, the differences between two-parameters and three-parameters were not as pronounced, however three-parameters models may be much more meaningful when integrated other stand variables into the base model, which may can helpful to diversify the application scenarios of the final generalized model. Stand characteristics and environmental factors notably influence the prediction accuracy and performance of the H-D model (Ng'andwe et al., 2019). Due to the effects of competition, several studies (Sharma and Yin Zhang, 2004; Solonenko et al., 2021) have found that trees in dense forests are expected to have higher H but lower D (higher sharpness) than those in sparse forests; Thus, maintaining stand density in a reasonable range can be meaningful to maximize timber production or other ecosystem service objectives (Dong et al., 2024).
Including stand characteristics as independent variables in H-D models improved tree H prediction accuracy (Sánchez et al., 2003; Sharma and Yin Zhang, 2004; Temesgen and Gadow, 2004). It indicates a need for further refinement of the local model to incorporate the effects of different stand variables (Ng'andwe et al., 2019). Tree H and D generally rise with tree age and are influenced by stand density (Sumida et al., 2013; Li et al., 2015). So, models that predict H growth for a stand are suggested to use variables that describe the stand rather than stand age and density. However, we prioritized prediction over investigating the factors affecting the H-D relationship, thus avoiding estimating additional parameters.
To enhance the accuracy of H prediction at the plot level, incorporating stand variables using metrics such as mean height (MH), mean diameter at breast height (MD), volume (V), and their combinations proved essential. Models with MD and V as stand variables (GM1, GM3, and GM5) had higher RMSE and lower R2 values in the test data compared to the training data. It shows that the models were less accurate at predicting the future and unable to generalize. GM4 achieved a moderate R2 score, offering an adequate level of explanation and slightly elevated error levels.
Among the models incorporating MH as a stand variable, GM2 outperformed the others, showing an improved R2 (i.e., 0.82) and reduced RMSE (i.e., 13.81%). Models that include MH as a stand variable at plot level compared to dominant height (TH), which required measurement of fewer trees. Previous studies recommended using TH to obtain significant results for generalized mixed-effect H-D models, thereby fostering stronger correlations with stand-level characteristics. Though determining TH requires fewer measurements, accurately estimating TH in uneven-aged forests seems challenging due to the potential misclassification of dominant trees (Florin et al., 2010). Therefore, we selected MH as an appropriate variable to use in place of TH, especially for uneven-aged forests that require more widespread measurements (Ciceu et al., 2020). This approach provides a more consistent and representative average, reduces observer bias, and enhances the reliability of assessments in uneven-aged forests. In this study, we employed pre-existing tree height data gathered for model evaluation to measure MH. The results may suggest that increasing MH of a stand through reasonable density controls are beneficial for promoting the total yield of stand volume and carbon stocks, mainly due to both of them are jointly controlled by H and D variables (Dutcă et al., 2019). The parameters for all five generalized H-D models showed significant deviations close to zero (Bronisz and Mehtätalo, 2020), except for GM4.
Generalized models work well in handling population-level variability (Bolker et al., 2009) but lack variation within the plot level (Dorado et al., 2006). The generalized mixed effect H-D model is a predictive tool for forecasting tree H in emerging stands (Huang et al., 2009). To develop a nonlinear mixed-effects model with both fixed and random parameters required to enhance predictive accuracy (Bergstrand et al., 2011). Fixed effects in nonlinear mixed-effects models typically offer higher predictive accuracy (Jiang and Li, 2010). Moreover, predictions based on fixed effects were often improved by incorporating random effects to capture plot-level variability when new H measurements were available (Fu et al., 2020; Skudnik and Jevšenak, 2022).
This study used fixed and random effects during data testing and training to evaluate model accuracy (Bell and Jones, 2015) and found that both approaches yielded significant results. The correlation matrix for fixed effects revealed a range of correlations between variables, from highly positive linear relationships to weak negative correlations. Random effects were modeled at the D level, accounting for potential correlations and heteroscedasticity through correlation structure and variance functions, resulting in greater H prediction accuracy than fixed effects alone. However, the number of measured trees and D influence prediction accuracy (Li et al., 2015). When fewer trees were sampled, the performance of fixed effects was weaker, whereas increasing the number of samples improved performance (Gottard et al., 2023).
The residual analysis of models M8 and the mixed effects model shows that, despite similar residual values but differing distribution patterns, M8 displays more pronounced positive residuals for smaller and larger diameter trees, likely due to the limited number of large-diameter trees and variability in tree H. Perhaps, the thinning influences correlation between diameter and H by impacting the increments in tree growth. It is due to anthropogenic disturbance, environmental factors, and plot variations, which affect the H-D relationship, influencing growth increments (Li et al., 2015).
Mixed-effects regression models are powerful in modeling variation in the H-D relationship among trees within unevenly aged forests (i.e., trees of different ages and growth stages) (Jha et al., 2023). Such variability arises as trees with the same D may have differences in H based on stand (i.e., age, species composition) and site factors (i.e., environmental conditions). These models include significant stand-level predictors that affect tree H (Peng, 2000). Such inclusion of variables enables the mixed-effects models to more closely represent the natural variability of H within the forest. Accounting for both fixed effects (i.e., stand-or plot-specific variations) and random effects (i.e., with-in plot or trees-level) provide better prediction of H compared to simpler models (Ciceu et al., 2023). Stand-level predictors are usually easier to measure than individual tree characteristics, making the field data collection faster and less expensive (Tian et al., 2020). Such efficiency saves resources for forest management (i.e., both in terms of time and money) to estimate H. Generally, mixed-effects models increase the robustness of H predictions in complex forest structures, given the importance of forestry practices that depend on accurate stand-level data for decision-making.
According to the mixed-effects model theory (Pinheiro and Bates, 2006), the mean response of the model was quantified using the fixed components, which were expected to be statistically significant, while site-specific variances were measured using random components, thus significances on these random components were usually not a key problem. For application, many previous studies (Wang et al., 2021; Patrício et al., 2022; Xie et al., 2022) had suggested that measuring the height of just 3 to 5 trees are generally sufficient to estimate random parameters accurately, thereby reducing survey time and costs. Hence, developing mixed-effects models tailored to these predictors was critical for cost-effective and efficient forestry surveys, enhancing the robustness of height predictions in complex forest structures—a key factor for forestry practices that depend on precise stand-level data.
In future research, incorporating additional stand variables into H-D modeling enhances its utility for forest managers and policymakers by deepening their understanding of forest dynamics and supporting decisions that promote long-term ecosystem sustainability. At the micro level, the model provides detailed, stand-specific insights crucial for optimizing forest operations. This includes precise timber volume estimation for better harvesting planning, accurate biomass calculation for carbon trading and ecosystem balance, and analysis of canopy structure for managing light availability, species diversity, and forest health. Additionally, it reveals growth dynamics and aids in the optimization of silvicultural practices. At the macro level, the model informs broader strategies for sustainable forest management, contributing to environmental and conservation goals. It supports sustainable harvesting by predicting future growth and yield, ensuring activities do not exceed the forest’s production capacity. The model enhances carbon sequestration estimates and is essential for climate change mitigation by refining predictive accuracy for carbon storage across diverse habitats. It incorporates random and fixed effects to account for variability in plot data, enabling more accurate estimates of biomass and carbon stored in vegetation. This approach ensures that carbon estimates accurately reflect actual ecosystem conditions, which is vital for reliable climate projections and mitigation strategies while also playing a pivotal role in conservation planning. These models will significantly influence the development of regional and national policy decisions by effectively balancing economic, ecological, and social goals. In the future, this modeling approach will be necessary for sustainable forest management, enhancing our understanding of regeneration, growth, species diversity, carbon sequestration, and long-term utilization of forest resources.
5 Conclusion
This study explored a comprehensive model framework for predicting H-D relationships in Larix gmelinii forests in Northeast China, contributing valuable insights into sustainable forest management strategies. From the systematic evaluation of 15 growth equations, this study identified the M8 model as the best base model based on R2, RMSE, and MAE. In the M8 model, stand variables were incorporated to create a generalized model; among them, GM2 demonstrated superior performance by including MH as a stand characteristic. Integrating nonlinear mixed-effects modeling with fixed and random effects enhanced prediction accuracy by accounting for site-specific variability, aligning with the growth dynamics typical of uneven-aged forest stands.
Furthermore, our findings highlight that a model relying solely on D measurements may fail to capture the essential structural complexity within diverse forest ecosystems. By incorporating stand-level parameters, our model achieved more precise H predictions across various growth stages, making it especially useful for applications in the quantification of forest structure, biomass estimation, yield forecasting, and carbon sequestration—critical indicators of forest productivity and ecosystem health. This adaptability across diverse stand conditions underscores the model’s utility in supporting sustainable resource management.
Incorporating stand-level variables enhanced prediction accuracy and demonstrated significant potential for reducing field measurement costs while facilitating informed decision-making in conservation planning. Our approach supports balanced ecological, economic, and social goals by providing forest managers with a robust tool (i.e., forest modeling) for sustainable harvesting, biodiversity conservation, and carbon trading. These insights contribute to a broader understanding of forest ecosystem resilience, emphasizing the importance of H-D models in advancing sustainable forest management and ecological stability in the face of climate variability. Future research could further explore the model’s applicability to other forest types and management objectives, reinforcing its role in fostering long-term ecosystem sustainability.
Data availability statement
The raw data supporting the conclusions of this article will be made available by the authors, without undue reservation.
Author contributions
MI: Conceptualization, Data curation, Formal analysis, Methodology, Software, Validation, Visualization, Writing – original draft, Writing – review & editing. TP: Conceptualization, Data curation, Formal analysis, Methodology, Software, Validation, Visualization, Writing – original draft, Writing – review & editing. AA: Validation, Writing – review & editing. LD: Conceptualization, Funding acquisition, Investigation, Methodology, Project administration, Resources, Supervision, Validation, Writing – review & editing.
Funding
The author(s) declare that financial support was received for the research, authorship, and/or publication of this article. This research was funded by the National Key R&D Program of China (Grant number 2023YFF1304002), and the Heilongjiang Touyan Innovation Team Program (Technology Development Team for High-efficient Silviculture of Forest Resources).
Acknowledgments
The authors are grateful to two reviewers, the handling editor and editor-in-chief, whose comments were critical in finalizing the manuscript. Further, the authors are thankful to the Cuigang Forest Farm (CFF) authority for facilitating the fieldwork, specifically the CFF staff for field assistance, and Key Laboratory of Sustainable Forest Ecosystem Management-Ministry of Education, College of Forestry, Northeast Forestry University for providing resources and guidance in this research. We are grateful to Sudipta Saha, Nathan James Roberts, Lele Lv, Md Zahirul Islam, Nazmus Sakib, Bhavana Chaudhari, and Saraswoti Adhikari, as well as all individuals who provided direct and indirect support at various stages of the study. The usual disclaimer applies, and all mistakes remain the author’s responsibility.
Conflict of interest
The authors declare that the research was conducted in the absence of any commercial or financial relationships that could be construed as a potential conflict of interest.
Publisher’s note
All claims expressed in this article are solely those of the authors and do not necessarily represent those of their affiliated organizations, or those of the publisher, the editors and the reviewers. Any product that may be evaluated in this article, or claim that may be made by its manufacturer, is not guaranteed or endorsed by the publisher.
References
Adame, P., del Río, M., and Cañellas, I. (2008). A mixed nonlinear height–diameter model for pyrenean oak (Quercus pyrenaica Willd.). For. Ecol. Manag. 252, 88–89. doi: 10.1016/j.foreco.2008.04.006
Aho, K., Derryberry, D., and Peterson, T. (2014). Model selection for ecologists: the worldviews of AIC and BIC. Ecology 95, 631–636. doi: 10.1890/13-1452.1
Anderson, D., and Burnham, K. (2004, 2020). Model selection and multi-model inference, vol. 63. 2nd Edn. New York, NY: Springer-Verlag, 10.
Anees, S. A., Mehmood, K., Khan, W. R., Sajjad, M., Alahmadi, T. A., Alharbi, S. A., et al. (2024). Integration of machine learning and remote sensing for above ground biomass estimation through Landsat-9 and field data in temperate forests of the Himalayan region. Eco. Inform. 82:102732. doi: 10.1016/j.ecoinf.2024.102732
Arcangeli, C., Klopf, M., Hale, S., Jenkins, T., and Hasenauer, H. (2014). The uniform height curve method for height–diameter modelling: an application to Sitka spruce in Britain. Forestry 87, 177–186. doi: 10.1093/forestry/cpt041
Bates, D. M., and Watts, D. G. (1980). Relative curvature measures of nonlinearity. J. Royal Statistical Soc. 42, 1–16. doi: 10.1111/j.2517-6161.1980.tb01094.x
Bell, A., and Jones, K. (2015). Explaining fixed effects: random effects modeling of time-series cross-sectional and panel data. Polit. Sci. Res. Methods 3, 133–136. doi: 10.1017/psrm.2014.7
Bergstrand, M., Hooker, A. C., Wallin, J. E., and Karlsson, M. O. (2011). Prediction-corrected visual predictive checks for diagnosing nonlinear mixed-effects models. AAPS J. 13, 143–151. doi: 10.1208/s12248-011-9255-z
Bettinger, P., Boston, K., Siry, J. P., and Grebner, D. L. (2016). Forest management and planning: academic press.
Bolker, B. M., Brooks, M. E., Clark, C. J., Geange, S. W., Poulsen, J. R., Stevens, M. H. H., et al. (2009). Generalized linear mixed models: a practical guide for ecology and evolution. Trends Ecol. Evol. 24, 127–135. doi: 10.1016/j.tree.2008.10.008
Bronisz, K., and Mehtätalo, L. (2020). Mixed-effects generalized height–diameter model for young silver birch stands on post-agricultural lands. For. Ecol. Manag. 460:117901. doi: 10.1016/j.foreco.2020.117901
Burnham, K. P., Anderson, D. R., and Huyvaert, K. P. (2011). AIC model selection and multimodel inference in behavioral ecology: some background, observations, and comparisons. Behav. Ecol. Sociobiol. 65:23. doi: 10.1007/s00265-010-1029-6
Calama, R., and Montero, G. (2004). Interregional nonlinear height diameter model with random coefficients for stone pine in Spain. Can. J. For. Res. 34:150. doi: 10.1139/x03-199
Cao, X.-M., Miao, Z., Hao, Y.-S., and Dong, L.-H. (2024). Height-diameter model of broad-leaved mixed forest based on species classification in Maoershan, Northeast China. J. Appl. Ecol. 35, 307–320. doi: 10.13287/j.1001-9332.202402.016
Carrer, M., Nola, P., Eduard, J. L., Motta, R., and Urbinati, C. (2007). Regional variability of climate–growth relationships in Pinus cembra high elevation forests in the Alps. J. Ecol. 95, 1072–1083. doi: 10.1111/j.1365-2745.2007.01281.x
Chen, D., Huang, X., Zhang, S., and Sun, X. (2017). Biomass modeling of larch (Larix spp.) plantations in China based on the mixed model, dummy variable model, and Bayesian hierarchical model. Forests 8:268. doi: 10.3390/f8080268
Chenge, I. B. (2021). Height–diameter relationship of trees in Omo strict nature forest reserve, Nigeria. Trees Forests People 3:100051. doi: 10.1016/j.tfp.2020.100051
Ciceu, A., Chakraborty, D., and Ledermann, T. (2023). Examining the transferability of height–diameter model calibration strategies across studies. Forestry :63. doi: 10.1093/forestry/cpad063
Ciceu, A., Garcia-Duro, J., Seceleanu, I., and Badea, O. (2020). A generalized nonlinear mixed-effects height–diameter model for Norway spruce in mixed-uneven aged stands. For. Ecol. Manag. 477:118507. doi: 10.1016/j.foreco.2020.118507
Corral-Rivas, S., Álvarez-González, J. G., Crecente-Campo, F., and Corral-Rivas, J. J. (2014). Local and generalized height-diameter models with random parameters for mixed, uneven-aged forests in Northwestern Durango, Mexico. Forest Ecosystems 1, 6–9. doi: 10.1186/2197-5620-1-6
Curtis, R. O. (1967). Height-diameter and height-diameter-age equations for second-growth Douglas-fir. For. Sci. 13, 365–375.
Dong, L., Chen, G., Chung, W., and Liu, Z. (2024). Variations on the maximum density-size lines to climate and site factors for Larix spp. plantations in Northeast China. Ecol. Model. 498:110913. doi: 10.1016/j.ecolmodel.2024.110913
Dong, L., Liu, Z., and Bettinger, P. (2016). Nonlinear mixed-effects branch diameter and length models for natural Dahurian larch (Larix gmelini) forest in Northeast China. Trees 30, 1191–1206. doi: 10.1007/s00468-016-1356-y
Dorado, F. C., Diéguez-Aranda, U., Anta, M. B., Rodríguez, M. S., and von Gadow, K. (2006). A generalized height–diameter model including random components for radiata pine plantations in northwestern Spain. For. Ecol. Manag. 229, 202–213. doi: 10.1016/j.foreco.2006.04.028
Dutcă, I., McRoberts, R., Naesset, E., and Blujdea, V. N. (2019). A practical measure for determining if diameter (D) and height (H) should be combined into D2H in allometric biomass models. Forestry 92, 627–634. doi: 10.1093/forestry/cpz041
El Mamoun, H., El Zein, A. I., and El Mugira, M. (2013). Height-diameter prediction models for some utilitarian natural tree species. J. forest Products Indust. 2, 31–39.
Fang, Z., and Bailey, R. L. (2001). Nonlinear mixed effects modeling for slash pine dominant height growth following intensive silvicultural treatments. For. Sci. 47:287. doi: 10.1093/forestscience/47.3.287
Florin, B. C., Cătălin-Constantin, R., and Gheorghe, F. (2010). Structural research in the natural beech forest, situated at the eastern limit (Humosu old growth beech forest, Ia. I county, Romania). Adv. Environ. Sci. 2, 203–214.
Fu, L., Duan, G., Ye, Q., Meng, X., Luo, P., Sharma, R. P., et al. (2020). Prediction of individual tree diameter using a nonlinear mixed-effects modeling approach and airborne LiDAR data. Remote Sens. 12:1066. doi: 10.3390/rs12071066
Fu, L., Lei, X., Sharma, R. P., Li, H., Zhu, G., Hong, L., et al. (2018). Comparing height–age and height–diameter modelling approaches for estimating site productivity of natural uneven-aged forests. Forestry 91. doi: 10.1093/forestry/cpx049
Fuchs, C. (1982). Maximum likelihood estimation and model selection in contingency tables with missing data. J. Am. Stat. Assoc. 77:270. doi: 10.1080/01621459.1982.10477795
Gottard, A., Vannucci, G., Grilli, L., and Rampichini, C. (2023). Mixed-effect models with trees. ADAC 17:431. doi: 10.1007/s11634-022-00509-3
Hall, D. B., and Bailey, R. L. (2001). Modeling and prediction of forest growth variables based on multilevel nonlinear mixed models. For. Sci. 47:311. doi: 10.1093/forestscience/47.3.311
Hao, Z., Xiang-dong, L., Hui-ru, Z., Chun-ming, L., and Jun, L. (2016). Nonlinear mixed-effects height-diameter model of Pinus koraiensis. J. Beijing Forest. Univ. 38, 8–9. doi: 10.13332/j.1000-1522.20160008
Hodson, T. O. (2022). Root mean square error (RMSE) or mean absolute error (MAE): when to use them or not. Geoscientific Model Dev. Discuss. 2022, 1–10. doi: 10.5194/gmd-15-5481-2022
Huang, M., Hu, T., Wang, J., Ding, Y., Köster, K., and Sun, L. (2024). Effects of biochar on soil carbon pool stability in the Dahurian larch (Larix gmelinii) forest are regulated by the dominant soil microbial ecological strategy. Sci. Total Environ. 951:175725. doi: 10.1016/j.scitotenv.2024.175725
Huang, S., Titus, S. J., and Wiens, D. P. (1992). Comparison of nonlinear height–diameter functions for major Alberta tree species. Can. J. For. Res. 22:1297. doi: 10.1139/x92-172
Huang, S., Wiens, D. P., Yang, Y., Meng, S. X., and Vanderschaaf, C. L. (2009). Assessing the impacts of species composition, top height and density on individual tree height prediction of quaking aspen in boreal mixedwoods. For. Ecol. Manag. 258:1235. doi: 10.1016/j.foreco.2009.06.017
Jha, S., Yang, S.-I., Brandeis, T. J., Kuegler, O., and Marcano-Vega, H. (2023). Evaluation of regression methods and competition indices in characterizing height-diameter relationships for temperate and pantropical tree species. Front. Forests Global Change 6. doi: 10.3389/ffgc.2023.1282297
Jiang, L., and Li, Y. (2010). Application of nonlinear mixed-effects modeling approach in tree height prediction. J. Comput. 5, 1575–1581. doi: 10.4304/jcp.5.10.1575-1581
Joreskog, K. G. (1969). A general approach to confirmatory maximum likelihood factor analysis. Psychometrika, 34, 183–202. doi: 10.1007/BF02289343
Lappi, J. (1991). Calibration of height and volume equations with random parameters. For. Sci. 37:781. doi: 10.1093/forestscience/37.3.781
Lebedev, A., and Kuzmichev, V. (2020). Verification of two-and three-parameter simple height-diameter models for birch in the European part of Russia. J. For. Sci. 9, 375–382. doi: 10.17221/76/2020-JFS
Li, Y.-Q., Deng, X.-W., Huang, Z.-H., Xiang, W.-H., Yan, W. D., Lei, P. F., et al. (2015). Development and evaluation of models for the relationship between tree height and diameter at breast height for Chinese-fir plantations in subtropical China. PloS one 104:e0125118. doi: 10.1371/journal.pone.0125118
Lin, F., Xie, L., Hao, Y., Miao, Z., and Dong, L. (2022). Comparison of modeling approaches for the height–diameter relationship: an example with planted mongolian pine (Pinus sylvestris var. mongolica) trees in Northeast China. Forests 13:1168. doi: 10.3390/f13081168
Lindner, M., Maroschek, M., Netherer, S., Kremer, A., Barbati, A., Garcia-Gonzalo, J., et al. (2010). Climate change impacts, adaptive capacity, and vulnerability of European forest ecosystems. For. Ecol. Manag. 259:698. doi: 10.1016/j.foreco.2009.09.023
Luo, T., Wang, Z., Zhang, D., Li, X., and Wang, X. (2024). Response of radial growth of Dahurian larch (Larix gmelinii) to climate factors at different altitudes in the northern part of the greater Khingan Mountains. Front. Forests Global Change 7. doi: 10.3389/ffgc.2024.1434773
Lynch, T. B., Holley, A. G., and Stevenson, D. J. (2005). A random-parameter height-dbh model for cherrybark oak. South. J. Appl. For. 29:22. doi: 10.1093/sjaf/29.1.22
McCarthy, B. C., Small, C. J., and Rubino, D. L. (2001). Composition, structure and dynamics of Dysart woods, an old-growth mixed mesophytic forest of southeastern Ohio. For. Ecol. Manag. 140:193. doi: 10.1016/S0378-1127(00)00280-2
Mehtätalo, L., de-Miguel, S., and Gregoire, T. G. (2015). Modeling height-diameter curves for prediction. Can. J. For. Res. 45, 826–837. doi: 10.1139/cjfr-2015-0054
Mehtatalo, L., and Lappi, J. (2020). Biometry for forestry and environmental data: With examples in R: chapman and Hall/CRC.
Misik, T., Antal, K., Kárász, I., and Tóthmérész, B. (2016). Nonlinear height–diameter models for three woody, understory species in a temperate oak forest in Hungary. Can. J. For. Res. 46:1337. doi: 10.1139/cjfr-2015-0511
Molto, Q., Hérault, B., Boreux, J.-J., Daullet, M., Rousteau, A., and Rossi, V. (2014). Predicting tree heights for biomass estimates in tropical forests–a test from French Guiana. Biogeosciences 11:3121. doi: 10.5194/bg-11-3121-2014
Näslund, M. (1936). Skogsförsöksanstaltens gallringsförsök i tallskog. Meddelanden från Statens. skogsförsöksanstalt, 29, 1–169.
Ng'andwe, P., Chungu, D., Yambayamba, A. M., and Chilambwe, A. (2019). Modeling the height-diameter relationship of planted Pinus kesiya in Zambia. For. Ecol. Manag. 447:51. doi: 10.1016/j.foreco.2019.05.051
Parresol, B. R. (1992). Baldcypress height–diameter equations and their prediction confidence intervals. Can. J. For. Res. 22:1429. doi: 10.1139/x92-191
Patrício, M. S., Dias, C. R., and Nunes, L. (2022). Mixed-effects generalized height-diameter model: a tool for forestry management of young sweet chestnut stands. For. Ecol. Manag. 514:120209. doi: 10.1016/j.foreco.2022.120209
Peng, C. (2000). Growth and yield models for uneven-aged stands: past, present and future. For. Ecol. Manag. 132:259. doi: 10.1016/S0378-1127(99)00229-7
Peng, C., Zhang, L., and Liu, J. (2001). Developing and validating nonlinear height–diameter models for major tree species of Ontario's boreal forests. North. J. Appl. For. 18:87. doi: 10.1093/njaf/18.3.87
Peschel, W. (1938). Mathematical methods for growth studies of trees and forest stands and the results of their application. Tharandter Forstliches Jahrburch 89, 169–247.
Pinheiro, J. C., and Bates, D. M. (2000). Linear mixed-effects models: basic concepts and examples. Mixed-effects models S S-Plus, 3–56. doi: 10.1007/978-1-4419-0318-1_1
Pinheiro, J., and Bates, D. (2006). Mixed-effects models in S and S-PLUS. Springer science & business media.
Pretzsch, H., Forrester, D. I., and Rötzer, T. (2015). Representation of species mixing in forest growth models. A review and perspective. Ecol. Model. 313:276. doi: 10.1016/j.ecolmodel.2015.06.044
R Core Team (2024). R: A language and environment for statistical computing. Vienna, Austria: R Foundation for Statistical Computing.
Ratkowsky, D. A., and Giles, D. E. (1990). Handbook of nonlinear regression models, vol. 107. New York, NY, USA: M. Dekker.
Ratkowsky, D. A., and Reedy, T. J. (1986). Choosing near-linear parameters in the four-parameter logistic model for radioligand and related assays. Biometrics 42:575. doi: 10.2307/2531207
Richards, F. J. (1959). A flexible growth function for empirical use. J. Exp. Bot. 10:290. doi: 10.1093/jxb/10.2.290
Roberts, N. J., Zhang, Y., Convery, I., Liang, X., Smith, D., and Jiang, G. (2021). Cattle grazing effects on vegetation and wild ungulates in the forest ecosystem of a national park in northeastern China. Front. Ecol. Evol. 9. doi: 10.3389/fevo.2021.680367
Saha, S., Huang, L., Khoso, M. A., Wu, H., Han, D., Ma, X., et al. (2023a). Fine root decomposition in forest ecosystems: an ecological perspective. Front. Plant Sci. 14. doi: 10.3389/fpls.2023.1277510
Saha, S., Paul, D., Poudel, T. R., Basunia, N. M., Hasan, T., Hasan, M., et al. (2023b). Biofertilizer science and practice for agriculture and forestry: a. J Applied Biol Biotechnol 11, 44–31. doi: 10.7324/JABB.2023.148741
Sakib, N., Poudel, T. R., Hao, Y., Roberts, N. J., Iddrisu, A.-Q., Adhikari, S., et al. (2024). Effects of different thinning intensities on carbon storage in Pinus koraiensis middle-aged plantations in Northeast China. Forests 15:738. doi: 10.3390/f15050738
Salas-Eljatib, C., Mehtätalo, L., Gregoire, T. G., Soto, D. P., and Vargas-Gaete, R. (2021). Growth equations in forest research: mathematical basis and model similarities. Curr. For. Rep. 7, 230–240. doi: 10.1007/s40725-021-00145-8
Saliu, I. S., Satyanarayana, B., Fisol, M. A. B., Wolswijk, G., Decannière, C., Lucas, R., et al. (2021). An accuracy analysis of mangrove tree height mensuration using forestry techniques, hypsometers and UAVs. Estuar. Coast. Shelf Sci. 248:106971. doi: 10.1016/j.ecss.2020.106971
Sánchez, C. A. L., Varela, J. G., Dorado, F. C., Alboreca, A. R., Soalleiro, R. R., González, J. G. Á., et al. (2003). A height-diameter model for Pinus radiata D. Don in Galicia (Northwest Spain). Ann. For. Sci. 60, 237–245. doi: 10.1051/forest:2003015
Schneider, R., Meliho, M., Segalina, G., Fortin, M., Simard, T., Franceschini, T., et al. (2024). “Growth and yield models for predicting tree and stand productivity” in Ecological forest management handbook (Boca Raton, Fla. United States: CRC Press), 127–165. doi: 10.1201/9781003431084-8
Sclove, S. L. (1987). Application of model-selection criteria to some problems in multivariate analysis. Psychometrika, 52, 333–343. doi: 10.1007/BF02294360
Sharma, M., and Parton, J. (2007). Height–diameter equations for boreal tree species in Ontario using a mixed-effects modeling approach. For. Ecol. Manag. 249:187. doi: 10.1016/j.foreco.2007.05.006
Sharma, R. P., Vacek, Z., Vacek, S., and Kučera, M. (2019a). Modelling individual tree height–diameter relationships for multi-layered and multi-species forests in Central Europe. Trees 33, 103–119. doi: 10.1007/s00468-018-1762-4
Sharma, R. P., Vacek, Z., Vacek, S., and Kučera, M. (2019b). A nonlinear mixed-effects height-to-diameter ratio model for several tree species based on Czech national forest inventory data. Forests 10:70. doi: 10.3390/f10010070
Sharma, M., and Yin Zhang, S. (2004). Height–diameter models using stand characteristics for Pinus banksiana and Picea mariana. Scand. J. For. Res. 19, 442–451. doi: 10.1080/02827580410030163
Skudnik, M., and Jevšenak, J. (2022). Artificial neural networks as an alternative method to nonlinear mixed-effects models for tree height predictions. For. Ecol. Manag. 507:120017. doi: 10.1016/j.foreco.2022.120017
Solonenko, A. M., Podorozhniy, S. M., Bren, O. G., Siruk, I. M., and Zhukov, O. V. (2021). Effect of stand density and diversity on the tree ratio of height to diameter relationship in the park stands of southern Ukraine. Ecologia Balkanica 2, 173–197.
Staudhammer, C., and LeMay, V. (2000). Height prediction equations using diameter and stand density measures. For. Chron. 76:303. doi: 10.5558/tfc76303-2
Stehman, S. V. (2012). Impact of sample size allocation when using stratified random sampling to estimate accuracy and area of land-cover change. Remote Sens. Lett. 3:111. doi: 10.1080/01431161.2010.541950
Stoffels, A., and Van Soest, J. (1953). The main problems in sample plots. Ned Boschb Tijdschr 25, 190–199.
Sumida, A., Miyaura, T., and Torii, H. (2013). Relationships of tree height and diameter at breast height revisited: analyses of stem growth using 20-year data of an even-aged Chamaecyparis obtusa stand. Tree Physiol. 33:106. doi: 10.1093/treephys/tps127
Tanovski, V., Matović, B., Risteski, M., and Trajkov, P. (2023). Modelling the tree height-diameter relationship of Macedonian pine (Pinus peuce Gris.) forests in North Macedonia. J. For. Sci. 69, 497–513. doi: 10.17221/68/2023-JFS
Tatian, M., Arzani, H., Reihan, M. K., Bahmanyar, M. A., and Jalilvand, H. (2010). Effect of soil and physiographic factors on ecological plant groups in the eastern Elborz mountain rangeland of Iran. Grassl. Sci. 56:77. doi: 10.1111/j.1744-697X.2010.00178.x
Temesgen, H., and Gadow, K. V. (2004). Generalized height–diameter models—an application for major tree species in complex stands of interior British Columbia. Eur. J. For. Res. 123, 45–51. doi: 10.1007/s10342-004-0020-z
Tian, X., Sun, S., Mola-Yudego, B., and Cao, T. (2020). Predicting individual tree growth using stand-level simulation, diameter distribution, and Bayesian calibration. Annals Forest Sci 77, 1–17. doi: 10.1007/s13595-020-00970-0
Timilsina, N., and Staudhammer, C. L. (2013). Individual tree-based diameter growth model of slash pine in Florida using nonlinear mixed modeling. For. Sci. 59:27. doi: 10.5849/forsci.10-028
Vanclay, J. K. (1995). Synthesis: growth models for tropical forests: a synthesis of models and methods. For. Sci. 41:7. doi: 10.1093/forestscience/41.1.7
Wang, Y., Lehtomäki, M., Liang, X., Pyörälä, J., Kukko, A., Jaakkola, A., et al. (2019). Is field-measured tree height as reliable as believed–a comparison study of tree height estimates from field measurement, airborne laser scanning and terrestrial laser scanning in a boreal forest. ISPRS J. Photogramm. Remote Sens. 147:132. doi: 10.1016/j.isprsjprs.2018.11.008
Wang, T., Xie, L., Miao, Z., Widagdo, F. R. A., Dong, L., and Li, F. (2021). Stand volume growth modeling with mixed-effects models and quantile regressions for major forest types in the eastern Daxing’an mountains, Northeast China. Forests 12:1111. doi: 10.3390/f12081111
Wykoff, W. R., Crookston, N. L., and Stage, A. R. (1982). User’s guide to the stand prognosis model USDA For. Serv., GTR-INT-133, p. 112.
Xie, L., Widagdo, F. R. A., Dong, L., and Li, F. (2020). Modeling height–diameter relationships for mixed-species plantations of Fraxinus mandshurica Rupr. and Larix olgensis Henry in northeastern China. Forests 11:610. doi: 10.3390/f11060610
Xie, L., Widagdo, F. R. A., Miao, Z., Dong, L., and Li, F. (2022). Evaluation of the mixed-effects model and quantile regression approaches for predicting tree height in larch (Larix olgensis) plantations in northeastern China. Can. J. For. Res. 52:309. doi: 10.1139/cjfr-2021-0184
Zang, H., Lei, X., and Zeng, W. (2016). Height–diameter equations for larch plantations in northern and northeastern China: a comparison of the mixed-effects, quantile regression and generalized additive models. Forestry 89, 434–445. doi: 10.1093/forestry/cpw022
Keywords: height-diameter model, nonlinear mixed-effects model, height prediction, unevenaged forest, Larix gmelinii
Citation: Ismail MJ, Poudel TR, Ali A and Dong L (2025) Incorporating stand parameters in nonlinear height-diameter mixed-effects model for uneven-aged Larix gmelinii forests. Front. For. Glob. Change. 7:1491648. doi: 10.3389/ffgc.2024.1491648
Edited by:
Ram P. Sharma, Tribhuvan University, NepalReviewed by:
Matija Klopčič, University of Ljubljana, SloveniaYuhui Weng, Stephen F. Austin State University, United States
Copyright © 2025 Ismail, Poudel, Ali and Dong. This is an open-access article distributed under the terms of the Creative Commons Attribution License (CC BY). The use, distribution or reproduction in other forums is permitted, provided the original author(s) and the copyright owner(s) are credited and that the original publication in this journal is cited, in accordance with accepted academic practice. No use, distribution or reproduction is permitted which does not comply with these terms.
*Correspondence: Lingbo Dong, ZmFycmVsbDA1MDNAMTI2LmNvbQ==