- 1Agricultural and Food Engineering Department, Indian Institute of Technology Kharagpur, Kharagpur, West Bengal, India
Introduction: A comprehensive assessment of a photovoltaic (PV) integrated hybrid solar dryer (HSD) for drying paddy was undertaken in the present investigation. Performance evaluation of the system along with finite element model of HSD at no-load and load conditions were successfully developed.
Methods: A three-dimensional PV aided hybrid solar dryer assembly model was created in indoor simulations using COMSOL Multiphysics version 5.3 a. Solidworks 16 was used to build the dryer’s collector, drying chamber, chimney, and thin food grain layer.Mesh refinement tests verified the mesh size independence of the panel temperature forecast finite element model.
Results and Discussion: Collector efficiency ranged from 49.24% to 81.19% and peaked at 750 W/m2 thermal intensity. System evaporation ranged from 0.25 to 0.39 kg/h. We also compared HSD, tray dryer (TD), and mixed-mode solar dryer (MMSD) system efficiency, specific energy consumption (SEC), and specific moisture extraction rate (SMER). HSD SEC values were 72% and 46% lower than TD and MMSD. HSD, MMSD, and TD had SMER values of 0.27, 0.15, and 0.08 kg/kWh. HSD dried paddy samples 36.36% and 84.61% faster than TD and MMSD. Hybrid solar dryers saved 33% and 50% more time than mixed mode and tray dryers, respectively. Simulations of the collector and chamber air distribution profiles showed a dead zone where air velocity drops below 0.5 m/s. I must note that the model accurately predicted the dryer’s temperature, wetness, and air dispersion pattern at load and no-load. PV-assisted HSD is suitable for sustainable food grain drying, according to this study.
1 Introduction
Drying technologies for various food processing operations share an inevitable linkage with energy, cost, and environmental sustainability. Hence, solar drying of food grains has become an imperative choice to combat duo challenges of meeting high energy demand for drying and to address the climate change scenario. Studies suggested that solar drying not only reduces the energy load but also significantly reduces the drying time, yields better quality of the product, enhances process efficiency, and also safeguards the environment from harmful gaseous emissions (Jha and Tripathy, 2017a). Despite that, processing parameters of a solar energy-based food drying system are variable with the time of the day, geographical position, and climatic and weather conditions, which leads to deviation in the performance results. To resolve these major issues, the concept of ‘hybrid solar drying technology’ has emerged, presenting fusion of thermal/chemical/renewable energy sources to existing solar dryers as auxiliary energy support in off-sunshine hours. This has opened up a wide window for more advanced solar drying technology. Nonetheless, to maintain or predict the processing parameters of any solar dryer at different locations is among the most enduring challenge, which restricts its wide applicability (Jha and Tripathy, 2021a). Simulation studies come into play at this critical juncture, and a properly validated simulation model will enable the professionals to predict the changes in process parameters such as the required drying time and temperature on a virtual platform. This can be employed prior to final fabrication of the system, thereby reducing time and budget involved in the system development (Jha et al., 2019). Furthermore, simulation can be employed as a handy tool, providing a vital advantage of proper assessment of the operating parameters. This offers a great deal of leverage in designing a hybrid solar dryer for various regions across the globe.
Many researchers in the recent past have attempted computational and statistical modeling for either analyzing the design aspects or processing parameters of various solar dryers (Maia et al., 2012; Yunus and Al-Kayiem, 2013; Jha and Tripathy, 2017b; Zoukit et al., 2019; Aukah et al., 2020; Rodrigues and Basso, 2020; Getahun et al., 2021). Zoukit et al. (2019) performed a simulation test of a hybrid biogas-assisted solar dryer and predicted the chamber temperature, humidity, and heat distribution within the dryer in solar only, biogas only, and hybrid modes, respectively. They found that CFD simulations provided adequate results for efficient drying of food products and were reported to successfully predict the efficiency of the system. Similarly, simulation exercise for a thermal storage type hybrid solar dryer at no-load condition was carried out by Rodrigues and Basso (2020). The proposed dryer was simulated on TRNSYS platform, to forecast the ambient, absorber plate, and air temperature, respectively, along with monthly useful energy gain, accounting for seasonal variations in Brazil. Jha and Tripathy (2019) imposed finite element modeling for the prediction of seasonal variation in the electrical efficiency of photovoltaic power plant integrated to a hybrid-type solar grain dryer. On the other hand, many researchers have developed simulation models for visualizing the heat and mass transfer process occurring during solar drying of various food products like potato, carrot, pineapple, banana, maize, cocoa, and paddy (Jha and Tripathy, 2017b; Amer et al., 2018; Amer, 2019; Mahapatra and Tripathy, 2019a; Kuan et al., 2019; Rani and Tripathy, 2020). To a greater extent, for the ease of simulation, most of these studies have considered a single piece of sample for performing the numerical analysis; however, the drying process is often conducted with a bulk amount of sample. Second, most of the studies are limited to the analysis of temperature distribution within the dryer at the no-load condition and air profile in the natural convection mode. Moreover, the heat and mass transfer analysis of food cereals subjected to a PV-integrated hybrid solar dryer in bulk, as well as the simultaneous assessment of temperature and air distribution within the dryer, has not been thoroughly investigated.
It is important to consider that solar dryers need good weather conditions to work properly. Often, on hot and bright days, the air temperature within the dryer might exceed the allowed limits, which can harm the crop. Hence, a thorough examination of the operating parameters and performance indicators of the solar dryer is essential. Evaluating the performance indicator of a solar dryer is crucial for achieving the most efficient drying rate and product quality while considering the optimal energy use and cost. Fudholi et al. (2010) conducted an energy analysis of an active-mode indirect sun drier for drying chillies. They determined that the system efficiency was around 13% and the exergetic efficiency was 57%. Several studies have examined the performance characteristics of solar dryers, and it has been shown that the overall efficiency of these dryers is often low, ranging from 10% to 45% (Jha and Tripathy, 2021a; Daş et al., 2021; Vijayan et al., 2016; Hamdi and Kooli, 2018; Suherman et al., 2018; Mahapatra and Tripathy, 2019b; Jha and Tripathy, 2021b). No-load testing yields consistent data on temperature distribution and air distribution inside the system. These data may be used to determine the optimal time of day for drying and estimate the duration of the drying process. With this research background, the main novelty of this work deals with the development of a comprehensive finite element model for the PV-assisted hybrid solar dryer to investigate the temperature and air distribution within the dryer in the forced convection mode along with the heat and mass transfer analysis of paddy grains. Moreover, important performance parameters such as the collector efficiency, system efficiency, and energy effectiveness of the hybrid solar drying system were assessed. In addition, the SMER, SEC, and evaporative capacity at various processing conditions were also estimated.
2 Dryer setup and instrumentation
The PV power plant comprising an array of eight panels with an output capacity of 2 kWh and area 13.2 m2 was installed on the roof top of the Dairy and Food Engineering building of the Department of Agricultural and Food Engineering, Indian Institute of Technology Kharagpur, India. The output of the panel is connected to an arrangement of batteries via an inverter. An array of solar cells within the panels of photovoltaic system generates solar electricity, which is then supplied to the hybrid solar dryer for in-house experiments. The schematic layout of the entire system is shown in Figure 1. The collector and drying chamber were made of I. C. I. Dulux satin finish soft sheen enamel painted 30 SWG G. I sheet and a 4-mm toughened glass sheet. The system was made air leak-proof by providing a rubber gasket beneath the glass cover. Mineral wool insulation was provided at the bottom and sides of the whole system in order to minimize heat loss from the system. The thermal intensity levels were acquired from strip heaters fitted beneath the absorber plate, and the power to the heating plates was altered with the help of a Variac regulator so that absorber plates of the collector and drying chamber attained identical power per unit cross-sectional area. The temperatures of drying air and the sample were measured using calibrated K-type thermocouples connected to a NI-DAQmx device attached to LabVIEW data acquisition system software (version 15, accuracy ± 0.2°C). The air flow rate to the collector was measured using an anemometer (Model 4,213, Lutron, Taiwan).
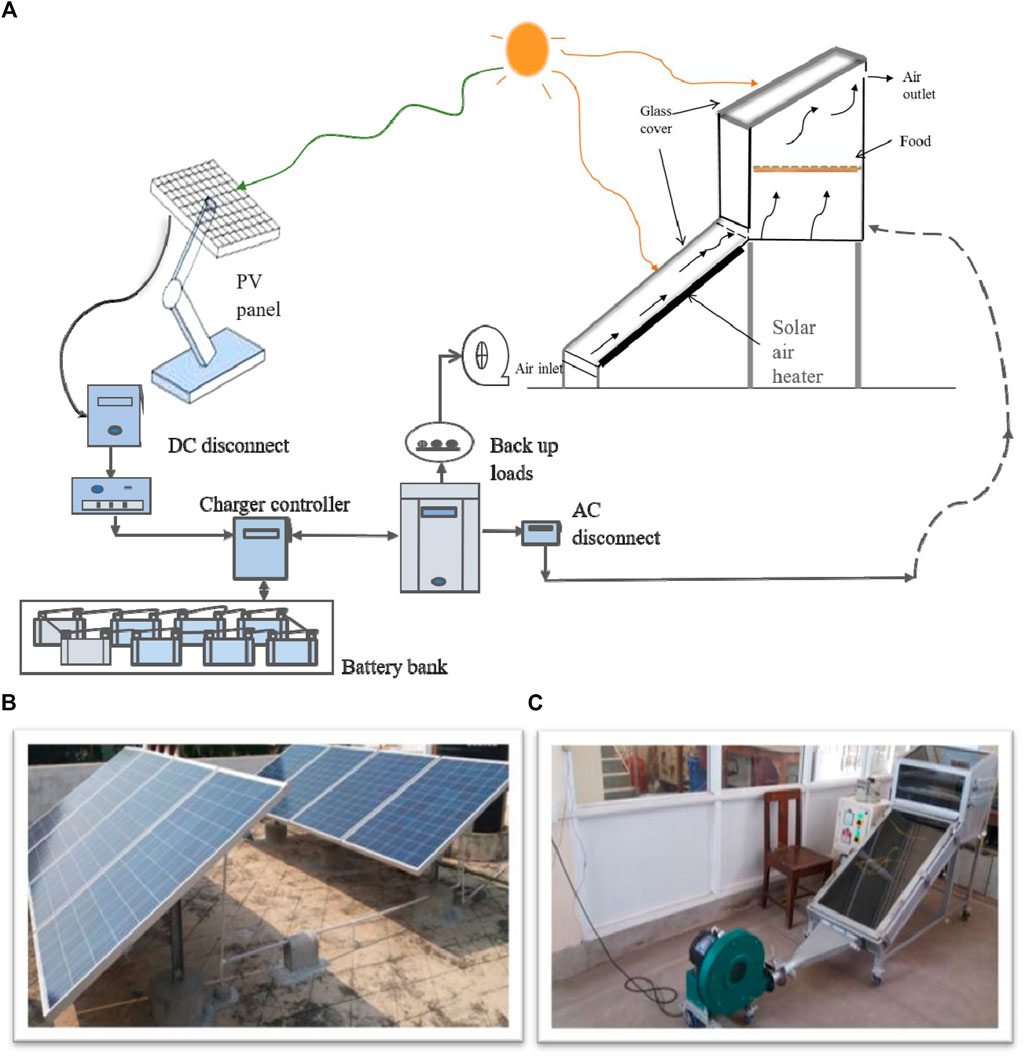
Figure 1. (A) Schematic representation of the PV-integrated hybrid system, (B) photovoltaic panels, and (C) dryer unit.
In our previous study, the response surface methodology (RSM) was used to optimize three important parameters’ power level, air velocity, and final moisture content during drying of paddy (Jha and Tripathy, 2021b). Optimum operating parameters for drying paddy were 700 W, 3.5 m/s, and 12% moisture, and the same were used in the present study. The experimental observations of thermal intensity, temperatures of the glass cover, absorber plate, ambient air, collector inlet, and outlet air were recorded at regular intervals of 30 min.
3 Model formulation
3.1 System specification and geometry formation
The finite element software package, i.e., COMSOL Multiphysics version 5.3, was implemented to develop a three-dimensional model for the PV-assisted hybrid solar dryer assembly in indoor simulated conditions. The virtual 3D geometry of various components of the dryer such as the collector, drying chamber, chimney, and thin layer of food grains has been built and assembled using a computer-aided design software package, i.e., SolidWorks version 16. The 3D geometry along with meshed geometry of the whole dryer is shown in Figure 2. The mesh refinement test was conducted to ensure that the developed finite element model is independent of mesh size for predicting the panel temperature. A mesh independency test was conducted with four different mesh types, (i.e., coarse, normal, fine, and extra fine meshes) having different element qualities, and the user-defined fine mesh was opted for the final simulation. User-defined meshing depending upon the size of each component was performed, and the total number of discretized finite elements was 314,070. The average mesh quality was maintained over 0.60; the minimum and average mesh quality of the model was 0.027–0.626. The total volume of the model was recorded to be 1,900,000 cm3.
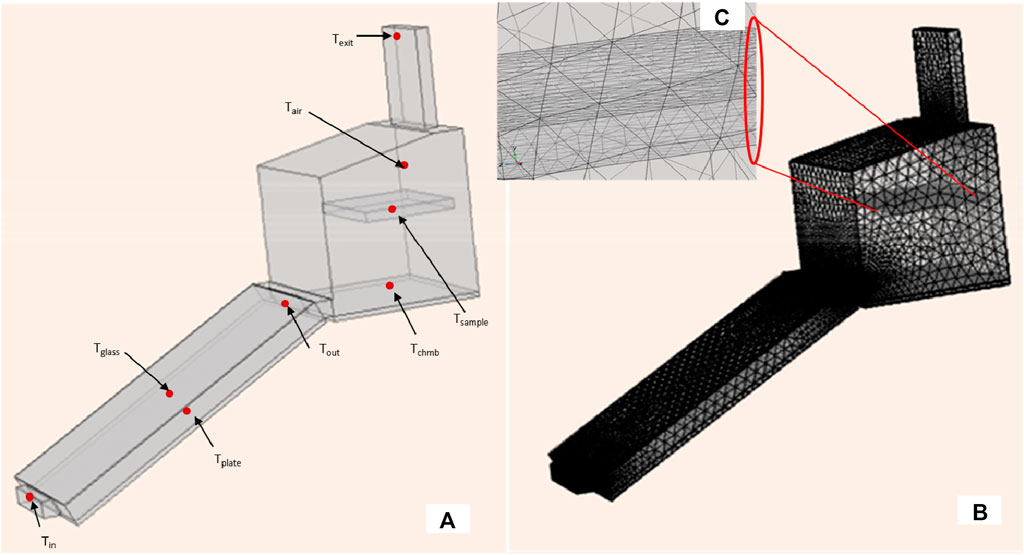
Figure 2. Geometry of (A) dryer with the sample (red dots are representative of thermocouples), (B) meshed geometry of dryer with the sample, and (C) enlarged view of the bulk sample inside the dryer.
In order to formulate the comprehensive numerical analysis of the hybrid solar dryer, the whole model has been approached in two subsections i) temperature and the air velocity profile within the dryer and ii) temperature and moisture distribution inside the food grains. To model the temperature and air velocity profile within the dryer, a steady state study involving heat transfer in the solid and k–ε model-based turbulent flow physics was put into practice. At the same time, to model heat and moisture migration in a thin layer of grains loaded in the dryer, physics involving heat transfer in porous media and transport of diluted species in porous media was chosen. The multi-physics modules were fully coupled in order to run the model in a single comprehensive study on an HP workstation with the Windows 7 operating system of an Intel (R) core (TM) i5-4570T CPU (Intel 64 Family 6) processor @ 2.90 GHz and 16 GB RAM.
3.2 Model development
3.2.1 Temperature and air velocity profile within the dryer
The following assumptions were considered in order to simulate the temperature and air distribution profile within the dryer.
1. Thermo-physical properties of glass, absorber plate, and air were presumed isotropic and independent of temperature.
2. The air was supposed to be an incompressible fluid.
3. Thermal losses were supposed to be negligible.
4. The sample layer is considered to be a rectangular slab to ease the computation.
The temperature distribution inside the dryer can be explained using Fourier’s law for heat conduction and is well-explained by the Equations 1–10 given as following:
For absorber plate:
For glass cover:
For air:
where Cp, ρ, and k stand for specific heat (kJ/kgK), density (kg/m3), and thermal conductivity (W/mK), respectively. Tabs, Tg, Tair, and Tamb are the temperatures of the absorber plate, glass cover, hot air, and ambient air, respectively. u and q are the air velocity (m/s) and inward heat flux (W/m2) inside the dryer, respectively.
The initial and boundary conditions for heat transfer simulation are given as follows:
where subscripts i and f stand for initial and final air temperatures, respectively, at time t. The list of input parameters used for air properties, glass, and absorber plate is shown in Table 1.
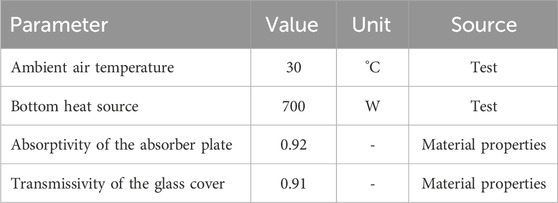
Table 1. List of input parameters used for modeling temperature distribution inside the hybrid solar dryer.
The ambient air was pumped into the collector via a blower, which passes through the absorber plate and gets heated gradually. Furthermore, the hot air enters the chamber, moves across the sample trays, and gets released from the dryer’s outlet. To study the air profile distribution inside the dryer, the k–ε turbulence model was opted. The standard k–ε model was proposed by Launder and Spalding (1974), in which turbulent viscosity was used to determine the Reynolds stresses. The k–ε model is basically a two-equation model, where k is the measure of turbulence kinetic energy and ε indicated the turbulence dissipation rate. Turbulent viscosity was calculated by assuming a specific relation between the transported variables, such as the turbulent kinetic energy (kE) and the turbulence dissipation rate (εE), which is determined (empirically or theoretically) for specific flow conditions, and can be given in Equations 14–18.
Preceding equations have five adjustable constants Cε1, Cε2, Cµ, σk, and σε, which have been determined by exhaustive data fitting for a wide range of turbulent models: Cε1 = 1.44, Cε2 = 1.92, Cµ = 0.09, σk = 1.0, and σε = 1.3.
The initial and final boundary conditions for the air distribution profile can be given as
where, Po is the ambient pressure, Uref is the reference velocity of the fluid, IT is the turbulence intensity, and LT is the turbulent length scale.
3.2.2 Temperature and moisture profile of the sample along with dryer
In this section, the temperature and moisture profile of the sample placed inside the dryer, along with the air velocity variation within the dryer were simulated simultaneously. A rectangular thin layer of bulk grains, which is porous in nature, has been assumed to be placed inside the drying chamber. The heat transfer within the rectangular matrix of grain layer was considered to take place via conduction. The heat transfer within the thin layer of grains was solved using governing equations given as in Equations 20, 21:
The drying of food products during the falling rate period is controlled by the mechanism of liquid and/or vapor diffusion (Jha and Tripathy, 2021b). The moisture migration from the grain bed to the surface majorly occurs under the influence of diffusive flux, and therefore, Fick’s second law of diffusion in a three-dimensional system was employed to simulate the moisture transport process within the sample and can be given as in Equations 22–24
where τ is the tortuosity factor is defined as a ratio between the length of a straight line through the porous media and the length of the tortuous path (Aprajeeta et al., 2015).
The initial and boundary conditions for heat and mass transfer during drying of food grains were given as in Equations 25–29:
The surface convective heat transfer coefficient of the grain–air interface was determined by using the following relationship (Sokhansanj and Bruce, 1987). Thermo-physical properties of samples used for FE modeling are given in Table 2.
4 Performance evaluation
4.1 Collector performance
The thermal efficiency of the collector or heat collection efficiency is a common measure of collector performance in a solar dryer (Fudholi et al., 2014). The useful heat delivered by the collector can be estimated from the temperature and air flow rate at the outlet. Therefore, it can be well-defined as the ratio of gained useful energy by the collector to the total thermal energy supplied and can be expressed mathematically by drawing an analogy with Hottel–Whillier–Bliss Equations 37, 38 (Duffie and Beckman, 1991; Eltawil et al., 2018).
where mair is the mass flow rate of drying air, Cpair denotes the specific heat capacity of drying air, TI is the thermal intensity, and Tf and Ti are the collector outlet and inlet temperature, respectively.
4.2 Dryer performance
A higher drying rate is one of the most prominent indicators of better moisture extraction ability of a dryer and is critical for cost and energy optimization. The drying performance can be evaluated based on the procedure proposed by Vijayan et al. (2016). The initial moisture content (IMC) of grains was determined by using Equation 39.
The quantity of water to be removed from the wet product was calculated from the initial and desired final moisture contents by using Equation 40 (Fudholi et al., 2014):
The drying rate can be calculated by the given formula as in Equation 41 (Suherman et al., 2018):
where Wd is the weight of dry matter (g), Wo represents the initial weight of the sample (g), and IMC and FMC denote the initial and final moisture contents (wb), respectively. Wloss is the amount of moisture to be evaporated to attain FMC, and Dr and Dt are the drying rate (kg/kg dry matter.h) and drying time (h), respectively.
Loading density (LD) gives the quantitative measure of volume of the sample which can be dried per unit area of the solar aperture of the system as mentioned in Equation 42 (Daş et al., 2021).
where Ws is the weight of the sample and SA denotes the solar aperture (m2).
System efficiency of the dryer is given as the ratio of energy utilized for removal of moisture to the total input energy provided to the system (Daş et al., 2021). It measures overall effectiveness of a drying system by showing how effectively the input energy is utilized for drying the product. The efficiency of the developed hybrid solar dryer can be expressed as Equation 43
where W is the weight of water evaporated from the product (g), Lv is the latent heat of vaporization (J/kg), and Pb represents the power required by the blower (kWh).
4.3 Energy effectiveness indices
The specific moisture extraction rate (SMER) is the energy required by the dryer to remove per unit of water from the sample. It can be calculated using the following Equation 44 (Fudholi et al., 2014).
The specific energy consumption (SEC) can be understood as the total energy supplied to the total weight of sample dried as given in Equation 45 (Motevali et al., 2011).
where TI is the thermal intensity, Pb denotes the power required by blower, and Ac denotes the heat collection area.
The evaporative capacity (EC) can be expressed as the weight of water that can be extracted from the products at a specific air flow rate during the drying process and is given in Equations 46–49 (Khawale et al., 2016).
where ϕ is the relative humidity; Hdin and Hamb are the absolute humidity of drying air at exit and ambient, respectively; and Pv and Pvsat are the vapor pressure and saturation vapor pressure, respectively, at a given temperature.
In order to evaluate the robustness of the developed system, a comparative analysis of the developed system with a laboratory scale tray dryer and a mixed-mode solar dryer was conducted. The net saving in drying time was calculated from the Equation 50.
where tcon is the time taken for drying the product in the tray dryer/mixed-mode solar dryer and thsd is the time taken for drying in the developed hybrid solar dryer.
4.4 Statistical analysis
The model’s best fit was evaluated using regression analysis metrics. These included the coefficient of determination (R2) and chi-square (χ2) and were estimated by formulas given below in Equations 51, 52.
where T is the respective variable, namely, the panel temperature, sample temperature, sample moisture, heat transfer coefficient, solar radiation etc.; N is the sample size; and exp and pre are experimental and predicted values of the ith term, respectively. All the experiments were conducted in triplicate.
5 Results and discussion
5.1 Temperature and air velocity distribution in the collector
Figure 3 depicts the range of attainable temperature by various components of the flat plate collector at different thermal intensity and air velocities. It is noteworthy from Figure 3A that the temperature of each component, viz., the absorber plate (Tp), glass cover (Tg), and outlet air temperature (To), tends to increase with an increase in input thermal intensity.
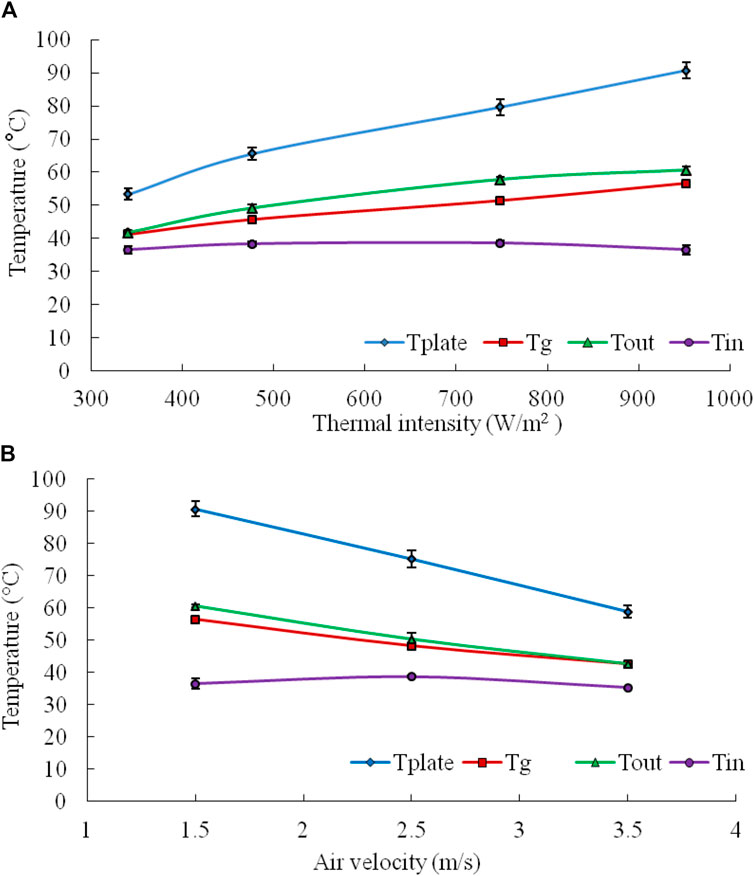
Figure 3. Temperature variations inside the flat plate collector at different (A) thermal intensities and (B) air velocity.
The percentage rise in air temperature passing through the collector at 350 W/m2, 500 W/m2, 750 W/m2, and 950 W/m2 was estimated to be 12.3%, 22.0%, 33.2%, and 39.7%, respectively. The maximum temperature attained by the absorber plate and glass cover ranged between 53.4°C–90.7°C and 41.3°C–56.6°C, respectively. A similar range of temperature for the mixed-mode solar dryer was also reported by Mahapatra and Tripathy (2019b), where average plate, glass, and hot air temperatures were found to be 73.4°C, 48.8°C, and 59.9°C, respectively. Similarly, the maximum attainable air temperature in a photovoltaic ventilated hybrid greenhouse grain dryer was reported to be 50.4°C Madhava and Smith (2017).
Similarly, Figure 3B represents the relationship between the collector temperature (i.e., absorber plate, glass cover, and outlet air temperature) with respect to air velocity. It is evident that with an increase in air velocity, the temperature gained by each component decreases, signifying an antagonistic correlation. The percentage rise in air temperature passing through the collector at 1.5 m/s, 2.5 m/s, and 3.5 m/s was projected to be 39.7%, 23.1%, and 17.4%, respectively. The tendency of lower heat gain at higher air inflow rates can be attributed to the residence time of air in the collector region. Higher air velocity leads to a lower residence time, hence resulting in lower temperature change. However, it is worth mentioning that the appropriate range of drying air temperature for dehydration of paddy and wheat is suggested to be below 50°C (Jha and Tripathy, 2021b; Akowuah et al., 2012). Hence, in the present study, the suitable drying temperature was achieved by passing air at 3.5 m/s.
Figures 4, 5 represent temperature distribution and the air velocity profile across the collector at different air velocities ranging from 1.5 to 3.5 m/s. Figure 4 shows higher temperature values on the central part of the collector and lower heat dissipation in the corners of the plate. Interesting to this pattern, it can be observed from Figure 5 that there is formation of small eddies in the corners of the plate toward the inlet. This was due to creation of a locked corner in the flat plate collector design. Additionally, from both the figures, it can be visualized that higher heat dissipation in the collector occurs at regions where the air velocity is minimum. This behavior can be attributed to the fact that greater turbulence leads to the even air distribution, thus resulting in efficient heat transfer between the absorber plate and air. It was also observed that the lower the values of air velocity, the higher the temperature of the absorber plate and the predictions are in line with the experimental data. The validation of the temperature profile of the collector at different air velocities at 700 W is shown in Table 3. Results signify that the proposed model can successfully predict the temperature profile and air distribution within the solar air collector.
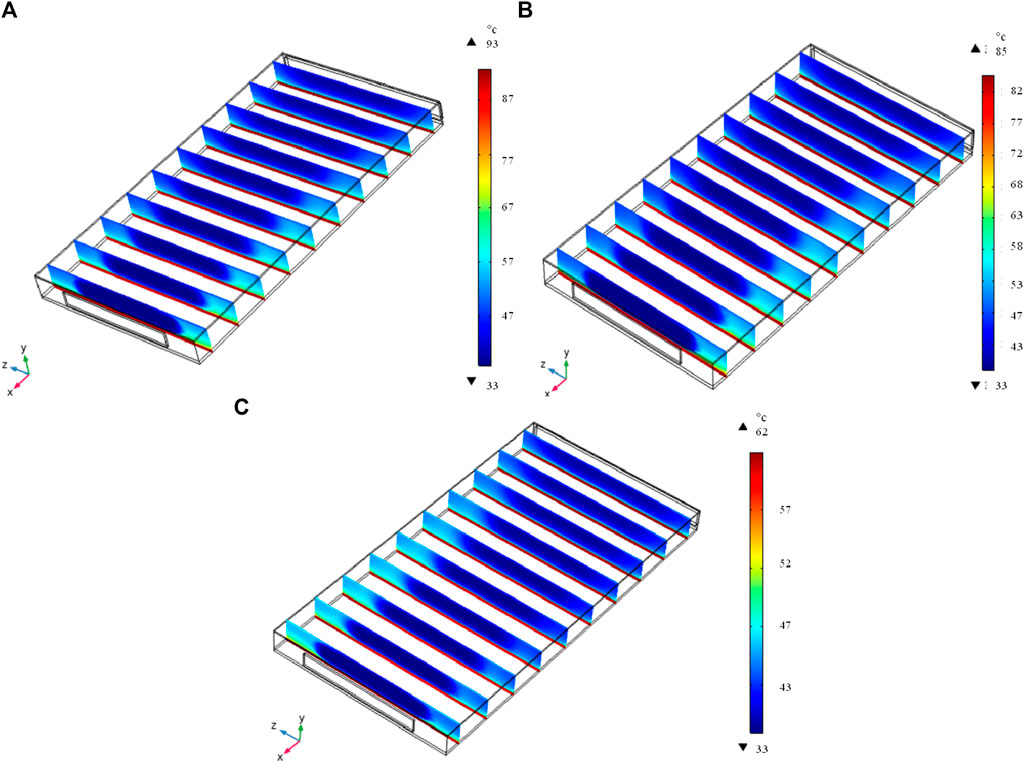
Figure 4. Temperature distribution across the collector at different air velocities: (A) 1.5 m/s, (B) 2.5 m/s, and (C) 3.5 m/s, (the vertical slices were captured at an equidistance measurement of 10 cm across the length of the collector).
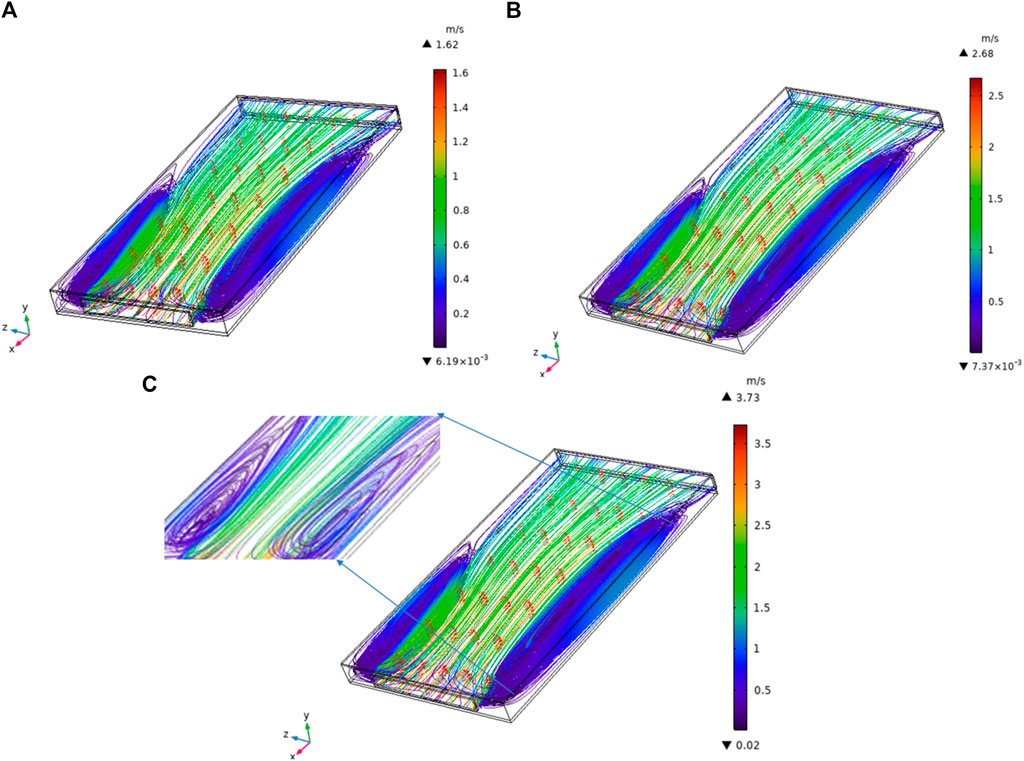
Figure 5. Velocity distribution across the collector at different air velocities of (A) 1.5 m/s, (B) 2.5 m/s, and (C) 3.5 m/s and a zoomed image of the eddies forming in the corners of the collector.

Table 3. Validation of the temperature profile of the collector at different air velocities at 700 W.
5.2 Temperature and air velocity distribution in the dryer at the no-load condition
Temperature and air velocity distribution inside the dryer at no-load conditions were carried out. Figure 6 depicts the temperature variation within the drying chamber at different thermal intensities and air velocities. Both the variables, viz., power level and air velocity, have been simultaneously varied. It can be noticed that the temperature of each component such as plate, glass cover, and chamber air temperatures increased with an increase in thermal intensity, whereas a decrease was witnessed with an increase in air velocity. The temperature and air velocity pattern follow the same trend as that of the collector. The percentage rise in air temperature passing through the chamber at 350 W/m2, 500 W/m2, 750 W/m2, and 950 W/m2 was estimated to be 10.6%, 20.1%, 30.3%, and 41.2%, respectively. The maximum temperature attained by the chamber plate and glass cover ranged between 57.5°C–99.5°C and 37.7°C–48.3°C, respectively.
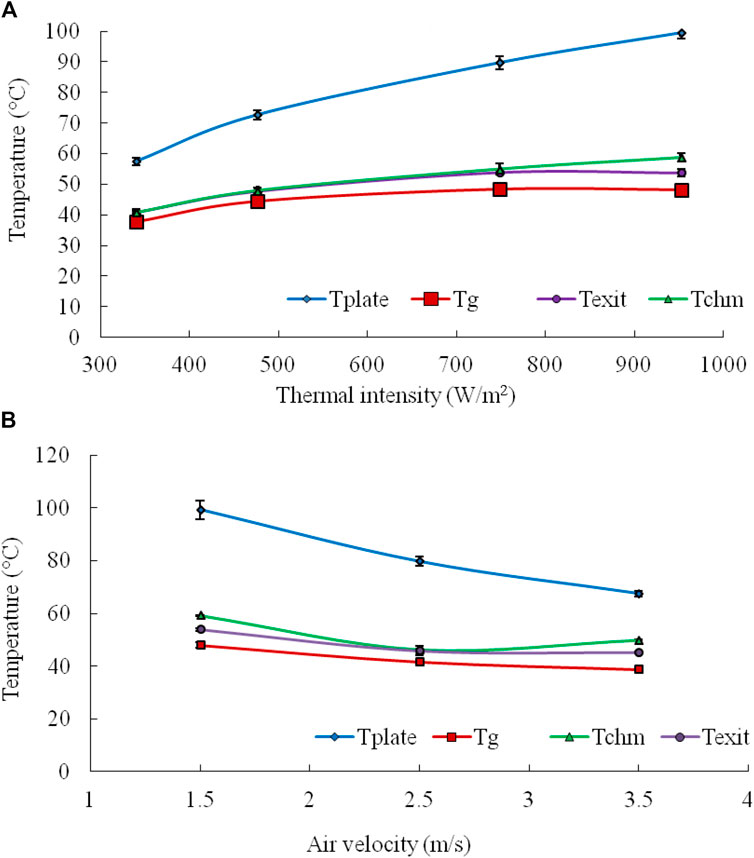
Figure 6. Temperature variations within the drying chamber at different (A) thermal intensities and (B) air velocities (the representative location of thermocouples is shown in Figure 2).
FE modeling of the dryer at the no-load condition was attempted at 700 W and 3.5 m/s and 550 W and 1.5 m/s to establish the versatility of the model to forecast the temperature and air velocity profile at various operational parameters. A chi-squared test was conducted to validate the adequacy of the developed simulation model with experimental data, as shown in Table 4. It can be observed that predicted temperature values are in close agreement with experiments for each component, justifying the suitability of the developed model. Figures 7, 8 depict the temperature and air distribution contour within the inlet vent, collector dryer assembly, and chimney. As can be observed, the temperature within the chamber section at 700 W and 3.5 m/s ranged in between 42°C and 48°C and air velocity inside the chamber dropped down to the range of 0.3–1.5 m/s. A higher turbulence was observed within the drying chamber in comparison to the collector. It can be observed from Figure 8 that the heated air coming from the collector region hits the bottom wall of the drying chamber, forming a recirculation/eddy region in a vertical direction. Here, the air tends to flow first near the backward wall of the drying chamber and then turns around the top and front walls of the chamber.

Table 4. Validation of the temperature profile of the drying chamber at a power level and air velocity of 700 W and 3.5 m/s; 550 W and 1.5 m/s.
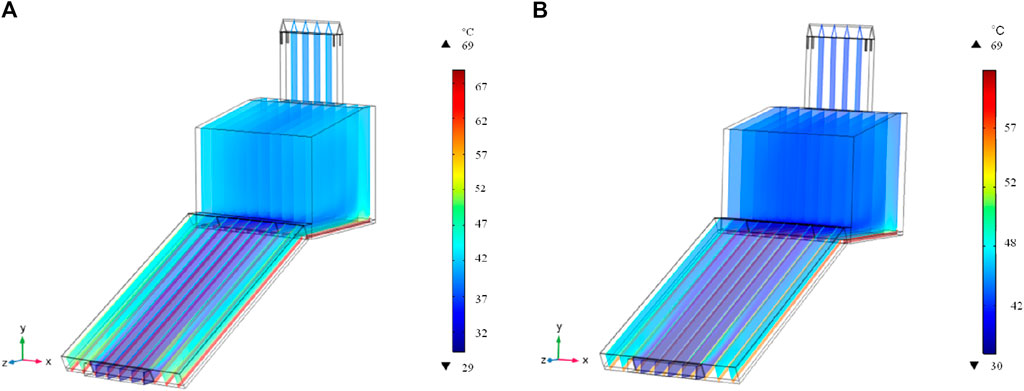
Figure 7. Temperature distribution across the dryer at a power level and air velocity of (A) 550 W and 1.5 m/s and (B) 700 W and 3.5 m/s.
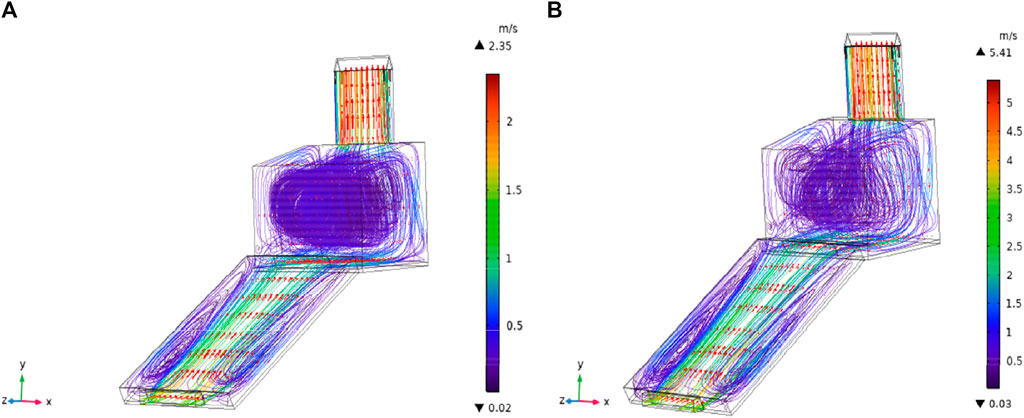
Figure 8. Velocity distribution across the dryer at a power level and air velocity of (A) 550 W and 1.5 m/s and (B) 700 W and 3.5 m/s.
Following that, the stream line of air consequently forms a loop extending toward the top of the drying chamber wall. This flow pattern is responsible for the uniform temperature distribution inside the chamber, as shown in Figure 8. It is also noteworthy that denser and uniform streamlines of air flow were formed inside the chamber operating at 550 W and 1.5 m/s in comparison to 700 W and 3.5 m/s. This may be attributed to the fact that at higher air velocity, air particles tend to adopt different trajectories, causing a higher degree of turbulence. Similar behavior of the air flow profile was witnessed by Maia et al. (2012) for the electrical solar dryer at the no-load condition. It can also be noticed that the air velocity at the chimney exit was significantly higher estimated up to 5.41 m/s. The significant rise in air velocity may have occurred due to constriction in the flow area, as well as the tendency of hot air to escape through the area of low-pressure region. A similar type of air velocity pattern in the chimney section was also reported for a biomass-assisted hybrid solar dryer (Yunus and Al-Kayiem, 2013).
5.3 Analysis of the transfer process within the dryer at the load condition
In continuation to no-load analysis, further simulation studies were conducted to investigate the temperature, moisture profile within the sample, and air distribution inside the collector–dryer assembly at the load condition. In Figure 9, the contour plots represent (a) temperature distribution within the dryer along with the sample, (b) air distribution within the dryer, (c) moisture distribution inside the sample, and (d) exaggerated view of the sample. It can be observed that temperature and air distribution outline inside the collector region was similar to the no-load condition. However, inside the drying chamber, the temperature profile can be segregated in two layers; the first layer depicts the hotter section below the samples, and the second layer represents the cooler section above the grains. This observation can be attributed to the fact that as soon as hot air comes in contact with high-moisture grains, it absorbs moisture and cools down. Furthermore, spatial distribution of the air flow pattern showed that a denser stream line loop was formed beneath the samples due to the movement of air from the backward wall toward the top and frontal region. It was also observed that the air velocity in the eddy region decreases to 0.3 m/s, which is also responsible for higher heat dissipation in this region.
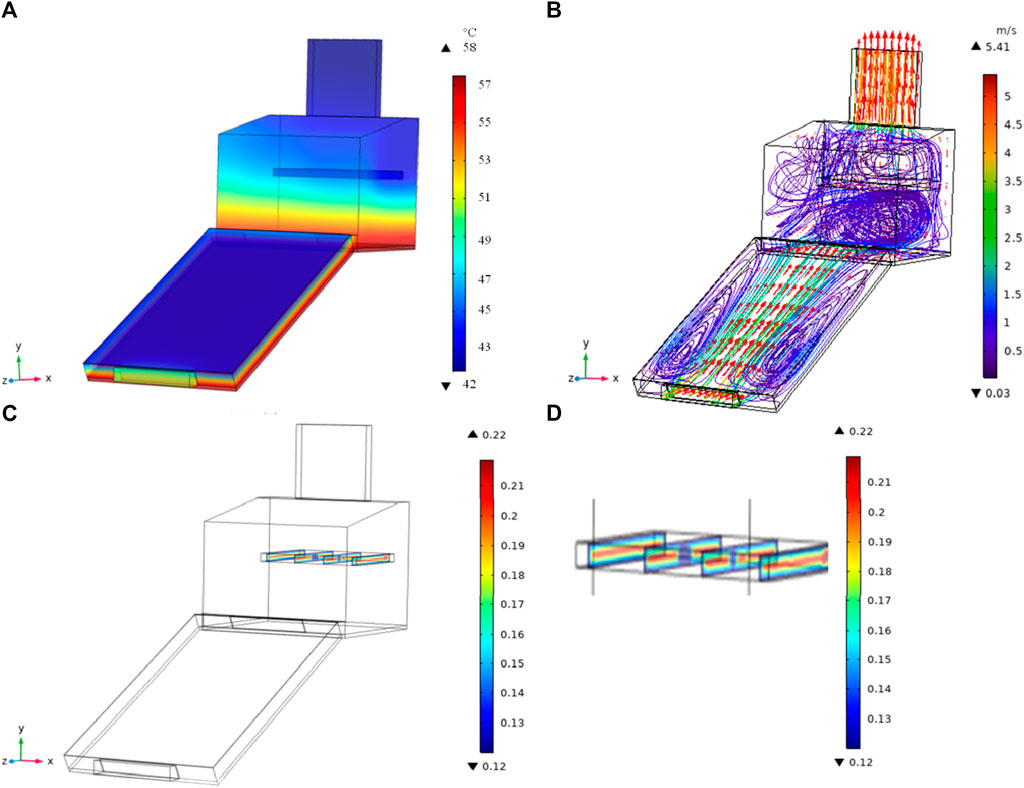
Figure 9. (A) Temperature distribution, (B) air velocity profile inside the dryer, (C) moisture distribution inside the sample; view at 700 W and 3.5 m/s, and (D) exaggerated view of the sample.
Second, various air flow trajectories passing through the sample and the gaps between the tray and dryer wall can be observed from Figure 9B. Since the air above the sample follows different trajectories, the section also tends to have better air mixing and higher turbulence, thereby improving heat distribution required for a faster drying purpose. Furthermore, the moisture profile of the sample was successfully predicted by the developed model and the spatial moisture distribution within the grain samples can be visualized using contour plots derived from the model. To check the correlation between predicted results and experimental data, regression analysis of the sample temperature and moisture profile was conducted.
The model validation with experiments is shown in Figure 10, and the respective regression coefficient values of 0.99 and 0.98 for the sample temperature (K) and moisture content (wb), respectively, indicated good fit of the model. Thus, the reasonable agreement certifies that the developed model is suitable to track the moisture content of food grains undergoing hybrid solar drying. In addition, it is imperative to highlight that the model can extensively envisage temporal and spatial air and temperature distribution within the dryer, which is otherwise cumbersome to monitor experimentally.
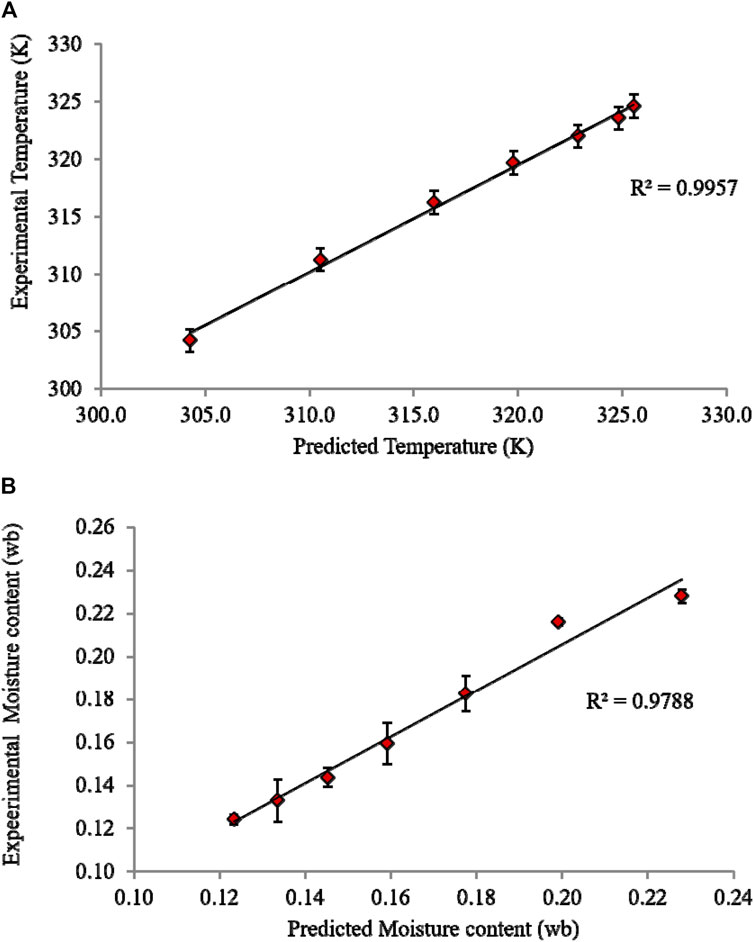
Figure 10. Validation of (A) temperature profile and (B) moisture profile of the paddy sample subjected to hybrid solar drying.
6 Performance and energy effectiveness
6.1 Collector efficiency
No-load experiments were carried out at different thermal intensity levels, i.e., 340, 480, 750, and 950 W/m2, and at varied air velocities of 1.5, 2.5, and 3.5 m/s. The average collector efficiencies at different thermal intensities, i.e., 340, 480, 750, and 950 W/m2, were estimated to be 49.24, 72.57, 81.90%, and 80.85%, respectively, asserting that the collector efficiency increases with an increase in the thermal intensity of the system. Fudholi et al. (2010) have reported the collector efficiency of the indirect-type forced convection solar dryer to be 29%. Similarly, Vijayan et al. (2016) conducted performance analysis of a collector integrated to a thermal storage unit and reported the maximum achievable collector efficiency of 22%. It is noteworthy that the average collector efficiency obtained for the system reported in the present work is approximately twice in comparison to the various conventional solar dryers reported in the literature reports (Mahapatra and Tripathy, 2019b; Vijayavenkataraman et al., 2012; Fudholi et al., 2015). The maximum collector efficiency of developed HSD has been reported to be 81%; on the contrary, the efficiency of collectors reported in the literature ranged between 20% and 40%.
6.2 System performance
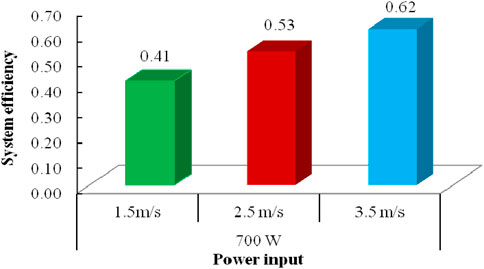
Figure 11 represents the system efficiency of the hybrid solar dryer at different air velocities and at a power level of 700 W. It can be observed that the system efficiency of the developed hybrid solar dryer varied in the range of 40%–65%, and with an increase in the air velocity, the system efficiency also increases. This may be due to the fact that higher air velocity enhances the moisture removal rate from the sample. Similar daily average photovoltaic, dryer, and overall efficiencies of 9.38%, 30.71%, and 16.32%, respectively, have been obtained by Eltawil et al. (2018), in a hybrid solar tunnel dryer assisted with a photovoltaic system to power an axial direct current fan was constructed to dry mint. Fudholi et al. (2015) reported the maximum drying efficiency of 19% for a hybrid electrical solar dryer for drying palm oil fronds. The system efficiency of the proposed hybrid solar dryer was observed to be 47%–52% higher than the abovementioned hybrid electrical and PV powered mixed-mode tunnel dryers. However, Reyes et al. (2014) constructed a thermal storage-type hybrid solar dryer comprising a paraffin wax-based solar energy accumulator unit. It was used to harness energy during sunny hours in addition to the solar collector and support drying in energy-deficient conditions, and a higher overall drying efficiency of 22%–67% was achieved (Reyes et al., 2014).
6.3 Evaluation of SEC, SMER, and evaporative capacity
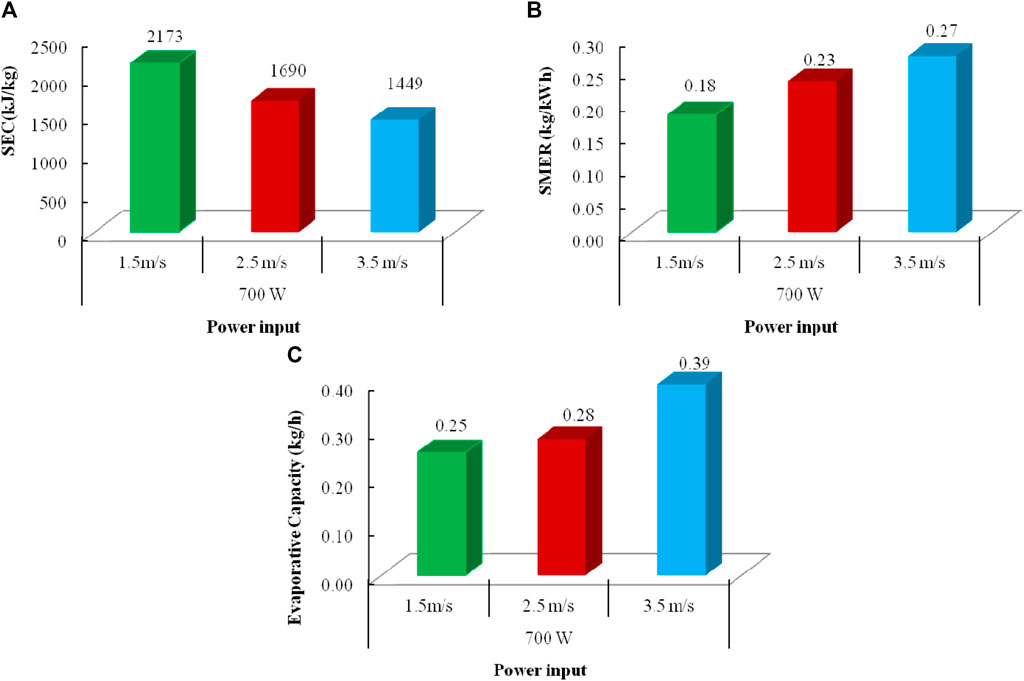
The performance indices such as SEC, SMER, and evaporative capacity of the hybrid solar dryer were estimated at optimum processing parameters (700 W and 3.5 m/s and product moisture content of 12%, wb). Figure 12 represents SEC, SMER, and evaporative capacity of the hybrid solar dryer at different air velocities. The SEC value of the hybrid solar dryer was found to be in the range of 1,450–2,173 kJ/kg. It is evident from Figure 12A that the specific energy consumption reduces with respect to air velocity. Researchers have presented a comparative analysis of SEC for direct-, indirect-, and mixed-mode-type solar dryer for carrot drying and reported the values to be in the range of 12,991–21986 kJ/kg. Lower values of specific energy consumption in the present study indicated that the system is energetically more efficient than the existing direct-, indirect-, and mixed-mode solar dryers. The specific moisture extraction rate is one of the performance indicators, representing the energy effectiveness in terms of the ratio of total moisture removed to the total energy input to the system. It can be quantified as the kilogram of moisture removed per kilowatt-hour of consumed energy; thereby, it gives a detail estimate of total power required by each component of the dryer during the entire drying process. It can be observed from Figure 12B that the SMER value of grain samples in the hybrid solar dryer increased with increasing air velocity at constant power input. The SMER value at 3.5 m/s was found to be 17.39% and 50.0% higher than SMER values obtained at 2.5 m/s and 1.5 m/s, respectively. A similar value of SMER of 0.26 kg/kWh was obtained during drying of tomatoes in a photovoltaic-based desiccant dryer (Dorouzi et al., 2018). Similarly, for a heat pump-assisted hybrid solar dryer, the SMER values were found to be in the range of 0.47 kg/kWh–0.38 kg/kWh (Yahya et al., 2016), whereas, Eltawil et al. (2018) observed SMER values ranging from 28 to 15 kg/kWh of moisture removed during mint drying in a partially PV-assisted solar dryer. Evaporative capacity is another performance index used by researchers to evaluate the dryer potential in terms of the amount of moisture removed per hour in order to evaluate the drying capacity of the system. This performance indicator takes care of humidity of drying air at inlet and exit points of the dryer and, therefore, is independent of the product type. As can be noticed from Figure 12C, the evaporative capacity of the system varied between 0.25 and 0.39 kg/h. The evaporative capacity of the system at an air velocity of 3.5 m/s was found to be 39.38% and 56.0% higher than the respective air velocities of 2.5 and 1.5 m/s. It was also noticed that with an increase in air velocity, the evaporative capacity of the system increases. This was due to the fact that evaporative capacity is directly dependent on the mass flow rate, and the more the dry air supplied, the higher will be the moisture evaporation. Similar values of evaporative capacity were obtained by Khawale et al. (2016) for a double-pass indirect solar dryer where the range varied from 0.15 to 0.24 kg/h and the average value of EC was obtained to be 0.195 kg/h. It was also observed that all the three performance indicators approximately double up at 3.5 m/s in comparison to the air velocity of 1.5 m/s. Hence, it can be said that operating parameters at 700 W and 3.5 m/s were energetically optimum. Moreover, the comparative analysis of performance results with the existing literature proves the HSD to be a robust and energetically efficient system.
6.4 Drying characteristic evaluation in HSD, TD, and MMSD
Figure 13A depicts the dimensionless moisture ratio versus drying time plot for the hybrid solar dryer (HSD), mixed-mode solar dryer (MMSD), and tray dryer (TD) during drying of paddy grains. It can be noticed that to reduce the initial moisture content of grain samples by half, i.e., approximately 50%, TD and MMSD took 33.3% and 50% longer time in comparison to HSD. The drying rate of samples in HSD was found to be in the range of 0.17–0.09 kg/kg.h with an average value of 0.12 kg/kg.h, as depicted in Figure 13B.
The drying rate of samples dried in the tray dryer and mixed-mode solar dryer was found to be in the range of 0.12–0.073 kg/kg.h and 0.073–0.063 kg/kg.h, respectively. The drying rate was observed to be maximum in the initial period of drying in all three cases, followed by a gradual decrease, indicating that majority of the drying process was dominated by the falling rate period. Therefore, the entire drying process was governed internally via an internal diffusion process (Incopera and Dewitt, 2005). The average drying rate of samples subjected to HSD was 36.36% and 84.61% higher than in comparison to TD and MMSD, respectively. The percentage of time saved during drying in a hybrid solar dryer was estimated to be 33% and 25% higher than in comparison to MMSD and TD, respectively. The lower drying rate observed in TD can be attributed to the fact that moisture removal occurred only through the top-most layer exposed directly to the hot air. However, the lower drying rate obtained in MMSD was due to unregulated heat dissipation within the dryer caused by solar hours in contrast to well-monitored drying ambience achievable in HSD via a power level regulator. From the results, it is observed that moisture removal effectiveness of the hybrid solar dryer is higher than the conventional mixed-mode solar dryer and tray dryer.
6.5 Comparative evaluation of performance indicators for HSD, TD, and MMSD
Figure 14 shows comparative analysis of system efficiency, specific energy consumption, and specific moisture extraction rate of HSD, MMSD, and TD, respectively. The system efficiency of MMSD, TD, and HSD was estimated to be 17.2%, 33.4%, and 61.5%, respectively. From the results, it can be seen that the system efficiency of the hybrid solar dryer was approximately 3.5 times higher than the tray dryer and 1.9 times higher than the mixed mode solar dryer. The system efficiency indicates that the energy utilized for removal of moisture in the tray dryer was higher in comparison to that of the solar dryer. Hence, it can be said that solar dryers were less energy-intensive than in comparison to conventional thermal dryers. Subsequently, SEC values of MMSD, TD, and HSD were calculated to be 2,667.1 kJ/kg, 5,162.45 kJ/kg, and 1,448.6 kJ/kg, respectively.
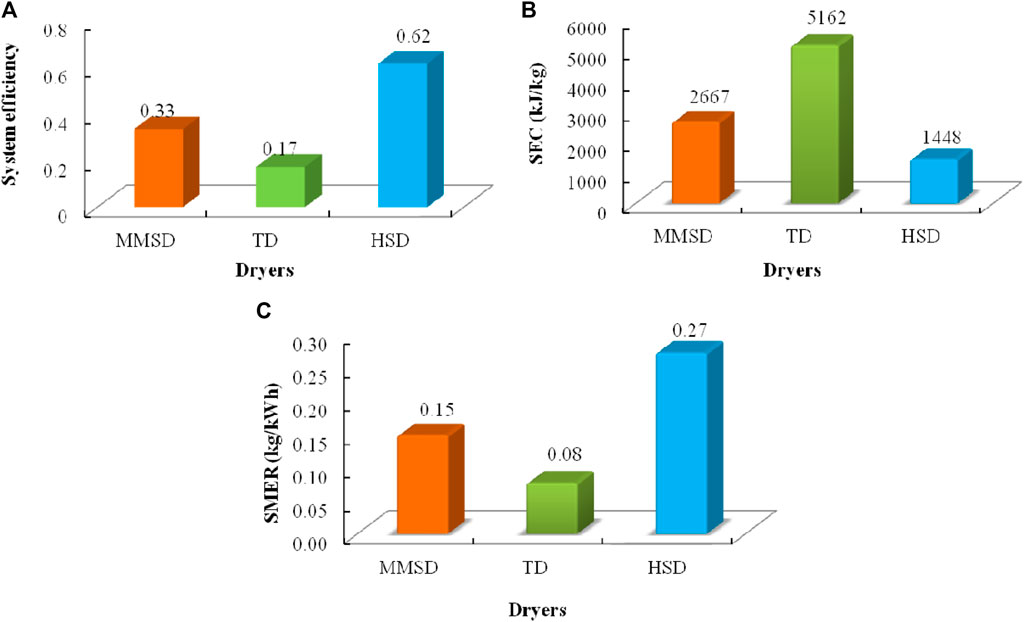
Figure 14. Comparative analysis of (A) system efficiency, (B) specific energy consumption, and (C) specific moisture extraction rate.
As it can be observed from Figure 14B, SEC values of the hybrid solar dryer are significantly less than those of the tray dryer. SEC values of HSD were observed to be approximately 72% less than TD and 46% lower than MMSD. Figure 14C represents the SMER values of paddy samples in HSD, MMSD, and TD to be 0.27, 0.15, and 0.08 kg/kWh, respectively. The SMER values showed that the moisture extraction rate in HSD was approximately 3.3 times higher than the tray dryer and 1.8 times higher than the mixed-mode solar dryer. One of the probable reasons for this may be the fact that in both HSD and MMSD, the drying air cross-flows through the sample; however, in the tray dryer, the air flow pattern was parallel to the sample.
A comprehensive computational finite element model developed for the proposed system can be implemented to pre-plan the drying operations, which will be vital to address the issue of climatic and geographical dependence of a solar dryer and thus will benefit food industries and solar dryer manufacturers.
7 Conclusion
The investigation revealed a positive correlation between the thermal intensity and the increase in air temperature passing through the collector, whereas there was a negative correlation between the air velocity and the decrease in air temperature. The contour plots revealed the presence of small air vortices in the corners of the collecting plate, as well as vertical recirculation and eddy zones where the air flow collided with the bottom wall of the drying chamber. The collector efficiency varied between 49.24% and 81.19% and reached its highest point at a thermal intensity of 750 W/m2. The dryer’s system efficiency varied between 40% and 65%, and it increased as the air velocity increased. The specific energy consumption (SEC) values of the hybrid solar dryer ranged from 1,450 to 2,173 kJ/kg, while the system evaporation rate ranged from 0.25 to 0.39 kg/h. Based on the results, it can be concluded that the hybrid solar dryer demonstrated a higher energy efficiency compared to both the normal mixed-mode solar dryer and the tray dryer for the purpose of drying. It is crucial to highlight that the model successfully predicted the temperature distribution within the flat plate collector and dryer under no-load conditions. Moreover, it is a comprehensive model that can precisely forecast the attributes of the dryer’s temperature profile, moisture profile, and air distribution pattern throughout its operation under load circumstances. The hybrid solar dryer was anticipated to achieve time savings of 33% and 25% more than the mixed-mode solar dryer and tray dryer, respectively, throughout the drying process. This represented a notable enhancement compared to the prior methodologies. To enhance thermal efficiency and prevent stagnant air flow areas, it is recommended to incorporate loops, baffles, or grooves into the design of the flat plate collector.
Data availability statement
The raw data supporting the conclusions of this article will be made available by the authors, without undue reservation.
Author contributions
AJ: conceptualization, formal analysis, investigation, methodology, software, validation, writing–original draft, and writing–review and editing. PT: conceptualization, funding acquisition, project administration, resources, supervision, and writing–review and editing.
Funding
The author(s) declare that financial support was received for the research, authorship, and/or publication of this article. The authors are thankful to the Ministry of Human Resource Development (MHRD), Government of India, for providing financial assistance (Sanction letter number: F. No. 4–25/2013-TS-I) to the first author for carrying out the research work. The authors would also like to acknowledge the Indian Institute of Technology, Kharagpur, India, for providing necessary research facilities for carrying out the present study.
Conflict of interest
The authors declare that the research was conducted in the absence of any commercial or financial relationships that could be construed as a potential conflict of interest.
Publisher’s note
All claims expressed in this article are solely those of the authors and do not necessarily represent those of their affiliated organizations, or those of the publisher, the editors, and the reviewers. Any product that may be evaluated in this article, or claim that may be made by its manufacturer, is not guaranteed or endorsed by the publisher.
References
Akowuah, J. O., Addo, A., and Bart-Plange, A. (2012). Influence of drying temperature and storage duration on fissuring and milling quality of Jasmine 85 rice variety. J. Sci. Technol. (Ghana) 32 (2), 26–33. doi:10.4314/just.v32i2.4
Amer, B. M., Gottschalk, K., and Hossain, M. A. (2018). Integrated hybrid solar drying system and its drying kinetics of chamomile. Renew. Energy 121, 539–547. doi:10.1016/j.renene.2018.01.055
Amer, B. M. A. (2019). Simulation of air characteristics for PV hybrid drying system and drying kinetics of strawberry fruits. J. Agric. Eng. 36 (2), 515–534. doi:10.21608/mjae.2019.94662
Aprajeeta, J., Gopirajah, R., and Anandharamakrishnan, C. (2015). Shrinkage and porosity effects on heat and mass transfer during potato drying. J. Food Eng. 144, 119–128. doi:10.1016/j.jfoodeng.2014.08.004
Aukah, J., Muvengei, M., Ndiritu, H., and Onyango, C. (2020). Optimization of the performance of hybrid solar biomass dryer for drying maize using ANSYS workbench. J. Energy Res. Rev. 4 (1), 50–69. doi:10.9734/jenrr/2020/v4i130119
Daş, M., Alıç, E., and Akpinar, E. K. (2021). Numerical and experimental analysis of heat and mass transfer in the drying process of the solar drying system. Eng. Sci. Technol. Int. J. 24 (1), 236–246. doi:10.1016/j.jestch.2020.10.003
Dorouzi, M., Mortezapour, H., Akhavan, H. R., and Moghaddam, A. G. (2018). Tomato slices drying in a liquid desiccant-assisted solar dryer coupled with a photovoltaic-thermal regeneration system. Sol. Energy 162, 364–371. doi:10.1016/j.solener.2018.01.025
Duffie, J. A., and Beckman, W. A. (1991). Solar engineering of thermal processes. New York: John Wiley and Sons Inc.
Eltawil, M. A., Azam, M. M., and Alghannam, A. O. (2018). Energy analysis of hybrid solar tunnel dryer with PV system and solar collector for drying mint (MenthaViridis). J. Clean. Prod. 181, 352–364. doi:10.1016/j.jclepro.2018.01.229
Fudholi, A., Sopian, K., Alghoul, M. A., Ruslan, M. H., and Othman, M. Y. (2015). Performances and improvement potential of solar drying system for palm oil fronds. Renew. Energy 78, 561–565. doi:10.1016/j.renene.2015.01.050
Fudholi, A., Sopian, K., Ruslan, M. H., Alghoul, M. A., and Sulaiman, M. Y. (2010). Review of solar dryers for agricultural and marine products. Renew. Sustain. Energy Rev. 14 (1), 1–30. doi:10.1016/j.rser.2009.07.032
Fudholi, A., Sopian, K., Yazdi, M. H., Ruslan, M. H., Gabbasa, M., and Kazem, H. A. (2014). Performance analysis of solar drying system for red chili. Sol. Energy 99, 47–54. doi:10.1016/j.solener.2013.10.019
Getahun, E., Delele, M. A., Gabbiye, N., Fanta, S. W., Demissie, P., and Vanierschot, M. (2021). Importance of integrated CFD and product quality modeling of solar dryers for fruits and vegetables: a review. Sol. Energy 220, 88–110. doi:10.1016/j.solener.2021.03.049
Giner, S. A., and Mascheroni, R. H. (2001). PH—postharvest technology: diffusive drying kinetics in wheat, part 1: potential for a simplified analytical solution. J. Agric. Eng. Res. 80 (4), 351–364. doi:10.1006/jaer.2001.0753
Hamdi, I., and Kooli, S. (2018). “Exergy and energy analysis of the solar drying processes of tomatoes in Tunisia,” in 2018 9th International Renewable Energy Congress (IREC), Hammamet, Tunisia, 20-22 March 2018 (IEEE), 1–6.
Incopera, F. P., and Dewitt, D. P. (2005). Fundamentals of heat and mass transfer. Sixth edition. NewYork: Willey, 57–101.
Jha, A., Moses, J. A., and Anandharamakrishnan, C. (2019). Optimizing beverage pasteurization using computational fluid dynamics. Preserv. Preserv. Approaches Beverages 15, 237–271. doi:10.1016/b978-0-12-816685-7.00008-2
Jha, A., and Tripathy, P. P. (2017a). Clean energy technologies for sustainable food security. in The water-food-energy nexus: processes, technologies and challenges (CRC Press, Taylor and Francis Group), 197–219. doi:10.4324/9781315153209
Jha, A., and Tripathy, P. P. (2017b). Thermal performance analysis and simulation studies of a photovoltaic integrated hybrid solar grain dryer. Proc. Int. Conf. Chem. Eng. 5, 20–22.
Jha, A., and Tripathy, P. P. (2019). Heat transfer modeling and performance evaluation of photovoltaic system in different seasonal and climatic conditions. Renew. Energy 135, 856–865. doi:10.1016/j.renene.2018.12.032
Jha, A., and Tripathy, P. P. (2021a). Recent advancements in design, application, and simulation studies of hybrid solar drying technology. Food Eng. Rev. 13 (2), 375–410. doi:10.1007/s12393-020-09223-2
Jha, A., and Tripathy, P. P. (2021b). Optimization of process parameters and numerical modeling of heat and mass transfer during simulated solar drying of paddy. Comput. Electron. Agric. 187, 106215. doi:10.1016/j.compag.2021.106215
Khawale, V. R., Thakare, S. B., and Khawale, R. P. (2016). Performance evaluation of a double pass indirect solar drier for drying of red chili. Int. J. Innovative Emerg. Res. Eng. 3, 514–518.
Kuan, M., Shakir, Y., Mohanraj, M., Belyayev, Y., Jayaraj, S., and Kaltayev, A. (2019). Numerical simulation of a heat pump assisted solar dryer for continental climates. Renew. Energy 143, 214–225. doi:10.1016/j.renene.2019.04.119
Launder, B. E., and Spalding, D. B. (1983). The numerical computation of turbulent flows Pergamon. In Numerical prediction of flow, heat transfer, turbulence and combustion, 96–116. Pergamon.
Madhava, M., and Smith, D. D. (2017). Performance evaluation of PV ventilated hybrid greenhouse dryer under no-load condition. Agric. Eng. Int. CIGR J. 19 (2), 93–101.
Mahapatra, A., and Tripathy, P. P. (2019a). Experimental investigation and numerical modeling of heat transfer during solar drying of carrot slices. Heat Mass Transf. 55 (5), 1287–1300. doi:10.1007/s00231-018-2492-2
Mahapatra, A., and Tripathy, P. P. (2019b). Thermal performance analysis of natural convection solar dryers under no-load condition: experimental investigation and numerical simulation. Int. J. Green Energy 16 (15), 1448–1464. doi:10.1080/15435075.2019.1671417
Maia, C. B., Ferreira, A. G., Cabezas-Gómez, L., Hanriot, S. D. M., and Martins, T. D. O. (2012). Simulation of the airflow inside a hybrid dryer. Int. J. Res. Rev. Appl. Sci. 10 (3), 382–389.
Motevali, A., Minaei, S., Khoshtaghaza, M. H., and Amirnejat, H. (2011). Comparison of energy consumption and specific energy requirements of different methods for drying mushroom slices. Energy 36 (11), 6433–6441. doi:10.1016/j.energy.2011.09.024
Pabis, S., Jayas, D. S., and Cenkowski, S. (1998). Grain drying: theory and practice. John Wiley and Sons.
Rani, P., and Tripathy, P. P. (2020). Drying characteristics, energetic and exergetic investigation during mixed-mode solar drying of pineapple slices at varied air mass flow rates. Renew. Energy 167, 508–519. doi:10.1016/j.renene.2020.11.107
Reyes, A., Mahn, A., and Vásquez, F. (2014). Mushrooms dehydration in a hybrid-solar dryer, using a phase change material. Energy Convers. Manag. 83, 241–248. doi:10.1016/j.enconman.2014.03.077
Rodrigues, L. J., and Basso, D. M. (2020). Hybrid system simulation to supply heated air to a solar food dryer. Eng. Agrícola 40 (2), 154–161. doi:10.1590/1809-4430-eng.agric.v40n2p154-161/2020
Singh, R. P., and Heldman, D. R. (2001). Introduction to food engineering. 4th Edition. California, USA: Academic Press.
Sokhansanj, S., and Bruce, D. M. (1987). A conduction model to predict grain temperatures in grain drying simulation. Trans. ASAE 30 (4), 1181–1184. doi:10.13031/2013.30541
Suherman, S., Djaeni, M., Wardhani, D. H., Dzaki R, M., and N. Bagas F, M. (2018). Performance analysis of solar tray dryer for cassava starch. MATEC Web Conf. 156, 05008. doi:10.1051/matecconf/201815605008
Vijayan, S., Arjunan, T. V., and Kumar, A. (2016). Mathematical modeling and performance analysis of thin layer drying of bitter gourd in sensible storage based indirect solar dryer. Innovative Food Sci. Emerg. Technol. 36, 59–67. doi:10.1016/j.ifset.2016.05.014
Vijayavenkataraman, S., Iniyan, S., and Goic, R. (2012). A review of solar drying technologies. Renew. Sustain. Energy Rev. 16 (5), 2652–2670. doi:10.1016/j.rser.2012.01.007
Yahya, M., Fudholi, A., Hafizh, H., and Sopian, K. (2016). Comparison of solar dryer and solar-assisted heat pump dryer for cassava. Sol. Energy 136, 606–613. doi:10.1016/j.solener.2016.07.049
Yunus, Y. M., and Al-Kayiem, H. H. (2013). Simulation of hybrid solar dryer. IOP Conf. Ser. Earth Environ. Sci. 16 (1), 012143. doi:10.1088/1755-1315/16/1/012143
Zoukit, A., El Ferouali, H., Salhi, I., Doubabi, S., and Abdenouri, N. (2019). Simulation, design and experimental performance evaluation of an innovative hybrid solar-gas dryer. Energy 189, 116279. doi:10.1016/j.energy.2019.116279
Nomenclature
A area (m2)
Cp specific heat capacity (J/kg K)
D diffusion coefficient (m2/s)
d day of the year
DPT dew point temperature (K)
Dr drying rate (kg/kg dry matter.h)
Dt drying time (h)
EC evaporative capacity (kg/h)
FMC final moisture content (wb)
Hamband Hdin absolute humidity of ambient air and drying air at exit, respectively (g of water/kg of dry air)
HSD hybrid solar dryer
ht heat transfer coefficient (W/m2K)
IMC initial moisture content (wb)
IT turbulence intensity
k thermal conductivity (W/mK)
kE turbulence kinetic energy (J/kg)
L characteristic length (m)
LD loading density (kg/m2)
LT turbulent length scale (m)
Lv latent heat of vaporization (J/kg)
M moisture content (kg of water/kg of sample)
ma mass flow rate (kg/s)
MMSD mixed-mode solar dryer
Nu Nusselt number
P power (W)
Pb power required by the blower (kWh)
Pk production of turbulence kinetic energy
Pr Prandtl number
Pvand Pvsat vapor pressure and saturation vapor pressure, respectively
Q heat energy generated per unit time (W)
q inward heat flux (W/m2)
Re Reynolds number
RH relative humidity (%)
SEC specific energy consumption (kJ/kg)
SI solar radiation (W/m2)
SMER specific moisture extraction rate (kg/kWh)
t time (h)
T temperature (°C)
tcon drying time in the tray dryer/mixed-mode solar dryer (h)
TD tray dryer
thsd drying time in the hybrid solar dryer (h)
TI thermal intensity (W/m2)
u velocity of air (m/s)
Uref reference velocity of fluid (m/s)
Wd weight of dry matter (g)
Wo initial weight of the sample (g)
Ws initial weight of the wheat sample (g)
Greek symbols
χ2 chi-square
φ latitude angle
µ dynamic viscosity
µT eddy viscosity
Cε1, Cε2, Cµ adjustable constants for turbulence modeling
k' Boltzmann constant
ɵ volume fraction
α absorptance
βt tilt angle
δ declination angle
ε porosity
εE turbulence dissipation rate
ηhc system efficiency
ρ density
σkand σε adjustable constants for turbulence modeling
τ tortuosity
ϕ relative humidity
Superscript and subscript
abs absorber plate
air ambient air
amb ambient
b bulk
chm chamber
col collector
eff effective
eq equivalent
ext external
f final
glass glass cover
i initial
in inlet
L liquid
max maximum
out outlet
p particle
sat saturation
w water
Keywords: hybrid solar dryer, finite element model, heat and mass transfer, air distribution profile, efficiency, paddy
Citation: Jha A and Tripathy PP (2024) Performance evaluation and finite element modeling of heat, mass, and fluid flow inside a hybrid solar dryer during drying of paddy grains. Front. Food. Sci. Technol. 4:1411956. doi: 10.3389/frfst.2024.1411956
Received: 03 April 2024; Accepted: 06 August 2024;
Published: 21 November 2024.
Edited by:
Hongwei Zhang, Sheffield Hallam University, United KingdomReviewed by:
Yvan Llave, Tokyo University of Marine Science and Technology, JapanMahdi Rashvand, Sheffield Hallam University, United Kingdom
Copyright © 2024 Jha and Tripathy. This is an open-access article distributed under the terms of the Creative Commons Attribution License (CC BY). The use, distribution or reproduction in other forums is permitted, provided the original author(s) and the copyright owner(s) are credited and that the original publication in this journal is cited, in accordance with accepted academic practice. No use, distribution or reproduction is permitted which does not comply with these terms.
*Correspondence: Aprajeeta Jha, YXByYWplZXRhamlpdGtncEBnbWFpbC5jb20=
 Aprajeeta Jha
 P. P. Tripathy
