
94% of researchers rate our articles as excellent or good
Learn more about the work of our research integrity team to safeguard the quality of each article we publish.
Find out more
ORIGINAL RESEARCH article
Front. Food. Sci. Technol., 18 January 2024
Sec. Food Modeling
Volume 3 - 2023 | https://doi.org/10.3389/frfst.2023.1295245
This article is part of the Research TopicResearch and Developments in Cultured Meat ProductionView all 5 articles
 Fernando Cantarero-Rivera1†
 Jaro Camphuijsen2,3†
 Greg Potter4
 Chris Clark5
 Jiajia Chen1
 Simon Kahan5
 Boris Aguilar6*
Highly productive and efficient biomass growth in bioreactors is an essential bioprocess outcome in many industrial applications. Large-scale biomass creation in the cultivated meat industry will be critical given the demand size in the conventional meat and seafood sectors. However, many challenges must be overcome before cultivated meat and seafood become commercially viable, including cost reductions of cell culture media, bioprocess design innovation and optimization, and scaling up in the longer term. Computational modeling and simulation can help to address many of these challenges and can be a far cheaper and faster alternative to performing physical experiments. Computer modeling can also help researchers pinpoint system interactions that matter and guide researchers to identify those parameters that should be changed in later designs for eventual optimization. This work developed a computational model that combines agent-based modeling and computational fluid dynamics to study biomass growth as a function of the operative conditions of stirred-tank bioreactors. The focus was to analyze how the mechanical stress induced by rotor speed can influence the growth of cells attached to spherical microcarriers. The computer simulation results reproduced observations from physical experiments that high rotor speeds reduce cell growth rates and induce cell death under the high mechanical stresses induced at these stir speeds. Moreover, the results suggest that modeling cell death and cell quiescence is required to recapitulate these observations from physical experiments. These simulation outcomes are the first step towards more comprehensive models that, combined with experimental observations, will improve our knowledge of biomass production in bioreactors for cultivated meat and other industries.
Increasing worldwide demand for meat drives the growth of environmentally detrimental factory farming, aquaculture, and mass capture of fish and other marine life (FAO, 2017). Cultivated meat and seafood is a potentially more sustainable alternative to factory farming and fisheries practices that could mitigate land use, disease spread, greenhouse gas emissions, and water contamination (Rubio et al., 2019; Post et al., 2020). However, several challenges must be overcome as a largely pre-commercial technology before cultivated meat is available worldwide. One of the most fundamental challenges in commercializing cell-based meat is producing biomass at a cost lower than that of animal husbandry and slaughter (Post et al., 2020). Currently, the cost of cell culture media and industrial-scale perfusion bioreactor production make cultivated meat orders of magnitude more expensive than the conventional alternatives (Vergeer et al., 2021). Cheaper media formulations of non-animal origin (serum-free) will be necessary to be cost-competitive. Similarly, more economical bioreactor designs and configurations must be developed to overcome the cost hurdle (Vergeer et al., 2021). Unfortunately, there are no operational commercial-scale cultivated meat bioreactors or bioprocesses (>3500 L) in existence (Potter et al., 2020). Cultivated meat bioreactor designs do have parallels in cell therapy and vaccine production bioprocesses, but the cultivated meat use cases are distinctive because of the far greater number of cells that must be produced to create even one serving of meat compared to a therapeutic dose (Allan et al., 2019).
The starter cells are a primary area of focus for cultivated meat bioreactor design and prototyping. These cells can be sensitive to turbulent flow, and the resulting mechanical forces can induce detachment, damage, apoptosis, and untimely differentiation (Stephenson and Grayson, 2018). Therefore, bioreactor design considerations must accommodate starter cell mechanical force sensitivities while achieving sufficient mass transfer, oxygen transfer, and adequate CO2 removal (Allan et al., 2019; Macdonald, 2019). Maintaining a favorable micro and macro-environment for cells without subjecting them to excessive mechanical stress from stirring will require innovation in and optimization of bioreactor designs and processes.
Virtual prototyping and experimentation through computer simulation promises to accelerate and lower the cost of progress (Kahan et al., 2020). Virtual experiments that replicate actual bioreactors and biological behaviors are not currently possible. First, it is necessary to develop predictive models of the bioreactor environment (Kahan et al., 2020). The main challenge in developing a predictive model of cells growing in a bioreactor arises from the complexity of the bioreactor environment and cell behavior. Media flow dynamics, forces, and mixing of media components must be incorporated into the model. Simultaneously, including cells that consume nutrients, excrete waste, proliferate, and die, introduces an additional layer of complexity to the model (Kahan et al., 2020). The high density of cells needed for efficient meat production creates more interactions between cells in the bioreactor and potential aggregation of cells in suspension and microcarrier cultures. Despite prior work using computer modeling and simulation to predict bioreactor behavior for numerous designs and configurations (Kahan et al., 2020), an altogether new multiscale methodology accounting for phenomena at diverse spatial and temporal scales seems necessary to include these cell-cell interactions.
Two well-established computational modeling approaches show considerable promise to encapsulate the complexity of the bioreactor environment and cell behavior - computational fluid dynamics (CFD) and agent-based modeling (ABM). In cultivated meat production, CFD can simulate and help understand the fluid flows in the bioreactors governed by the Navier-Stokes equations (Wilcox, 2006). In biological applications, ABM can be used to track the fate of each cell using rules that determine the conditions under which the cell, for example, grows, moves, adheres, divides, differentiates, and dies as a function of the biochemical and physical environment (Kang et al., 2014).
In this study, we present the first co-application of CFD and ABM as a multiscale modeling methodology for cultivated meat bioreactor and bioprocess design by focusing on a simple configuration of a stirred-tank bioreactor system. Stirred-tank reactors are well-studied and are being pursued in cultivated meat production (Allan et al., 2019). A more recent study developed a scalable process for the expansion of bovine adipose stem cells as precursors for fat and muscle cells (Hanga et al., 2021). Adherent cells specifically can be grown in stirred-tank systems with microcarriers, but microcarrier-bound cells become sensitive to agitation damage by mechanical forces and small intense eddies (Croughan et al., 1987). The research paper of Croughan et al. (1987) provides empirical and theoretical analyses of the influence of stir speed on biomass accumulation and, thus, growth and death rates of FS-4 cells on microcarrier cultures in a stir-rod bioreactor. Our novel modeling methodology represents a simple framework for the concurrent application of CFD and ABM to simulate the biophysical phenomenon of cell response to increasing bioreactor stir speeds. The framework is constructed in a way that enables expansion to include additional knowledge and should be applicable to other bioreactor and bioprocess designs in cultivated meat and allied industries.
In the simulations, the microcarrier cultures were grown in a simple agitated bioreactor setup that was not aerated and had no pH control technology (Figure 1). A cylindrical rod immersed to two-thirds the depth of the liquid and rotated at a constant speed agitated the fluid. Rotational speed was the only parameter that varied in the simulations following the experiments reported by Croughan et al. (1987). All attributes of the bioreactor system described by Croughan et al. (1987) are specified in Supplementary Table S1, including microcarrier type, microcarrier concentration, surface area per volume and media change frequency. In some instances, we needed additional quantities (e.g., microcarrier and cell dimensions) not provided by Croughan et al. (1987), and these were obtained from other sources (Hu, 2020; Cytiva, 2021). The parameters used in the computational simulations are detailed in Supplementary Table S2. An initial inoculation density of 5 cells per microcarrier was chosen as an industry standard value, while the cell doubling time was set at 0.1 s to reduce computational expense and simplify CFD and ABM coupling (see section 2.3.3). The microcarrier concentration was 1 per 100 mL in an effort to further reduce computational time, except for subsequent Lagrangian particle tracking trials (see section 3.3).
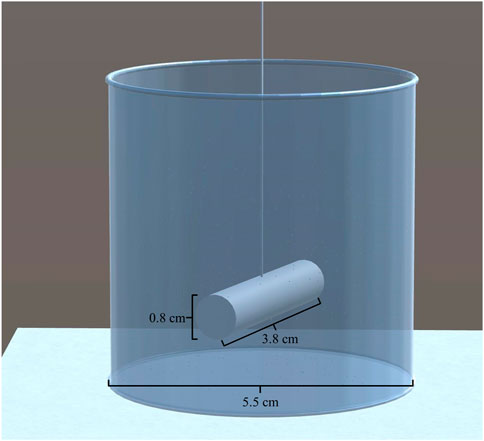
FIGURE 1. 3D drawing of the bioreactor used as boundary conditions in ABM and CFD simulations.
Croughan et al. (1987) studied how growth rate changes as a function of excessive agitation speed. Prior experimental results had established 60 rpm to be roughly a sufficient speed to provide the needed nutrients and oxygen, while higher rates reduced productivity. Croughan et al. (1987) focused on 60 rpm and above. They proposed an analytical model in which growth and death rates are exponential over time, resulting in population graphs that are piecewise linear when on a log scale, as shown in Figure 2. In their model, the cells’ growth (proliferation) rate exponent is assumed to be constant throughout all experiments and the death rate is assumed to change with agitation speed. The rates are calculated based on these assumptions to best fit data sampled from experiments.
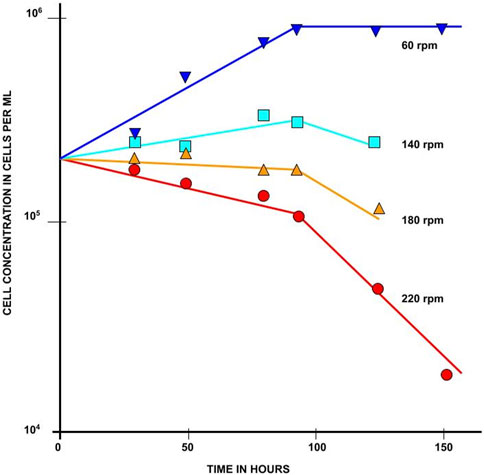
FIGURE 2. Growth of FS-4 cells on microcarriers at various stirring speeds. All cultures contained 3 g/L Cytodex 1 microcarriers in identical 250 mL vessels with 100 mL of media. This figure is a reproduction of Figure 1 from Croughan et al. (1987) and illustrates the set of experiments the simulations in this research are based on. Reprinted from “Hydrodynamic effects on animal cells grown in microcarrier cultures” by Croughan et al., licensed under MIT Libraries’ permissions policy.
The geometry of the CFD model included a 100 mL cylindrical bioreactor and a cylindrical stirring bar (Croughan et al., 1987), as shown in Figure 3. The cylindrical bioreactor had an internal diameter of 5.5 cm, and the rod impeller had a length of 3.8 cm and a diameter of 0.8 cm. The rod impeller was suspended at one-third of the liquid height. The moving mesh technique was used to simulate the rod impeller’s rotation, creating an imaginary domain within the bioreactor. This imaginary domain is only used to assign the corresponding rotational speed in the model.
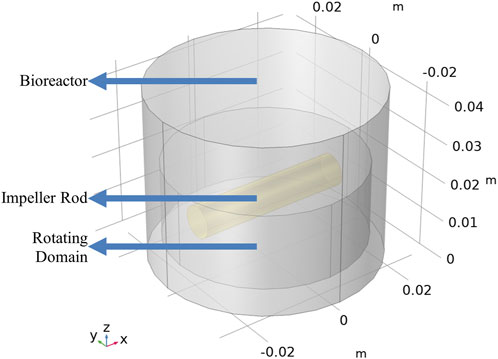
FIGURE 3. Geometry of the bioreactor with a rod impeller.
The fluid flow in the bioreactor was assumed to be transitional to turbulent flow due to the calculated impeller Reynolds number of 1,444 at 60 rpm and 5,294.7 at 220 rpm. The impeller Reynolds number can be calculated as:
where N is the impeller rotations per second, L is the length of the impeller, and v is the kinematic viscosity (Raju et al., 2005). Unlike fluid flow in a pipe where the transition from laminar to turbulent has been clearly defined from 2,100 < Re < 4,000, the transition in stirred vessels depends greatly on impeller type, bioreactor baffles, and any other protrusions that interact with the flow; therefore, a fully turbulent flow can only be guaranteed when Re > 10,000 while a fully laminar flow can only be guaranteed when Re < 10 (Doran, 2013). A Reynolds-averaged Navier-Stokes (RANS) simulation approach with the standard k-ε turbulence model was used to simulate the fluid movement, where k represents the turbulent kinetic energy, and ε represents the dissipation of turbulent kinetic energy. The κ-ε turbulence model introduces two additional transport equations, one for k, the turbulent kinetic energy, and one for ε, the turbulent dissipation rate expressed as:
where Pk is the production term expressed as:
where μT is the turbulent viscosity modeled as:
This model uses five turbulence constants Cμ = 0.09, Cε1 = 1.44, Cε2 = 1.92, σk = 1, and σε = 1.3. These were determined from experimental data in simple flows (Wilcox, 2006). In a batch system, the mixing process is mainly continuous during the cell growth period (∼days), except during media exchanges. The fluid flow eventually reaches a steady-state condition. Therefore, the equations for mass conservation, Newton’s second law, and energy conservation, along with the constitutive laws relating the stress tensor in the fluid to the rate of the deformation tensor, were used to describe the fluid flow process (Wilcox, 2006). Assuming incompressible Newtonian fluid, the Navier-Stokes equations take the following form:
where u is the velocity vector, p is pressure, I is the identity matrix, and F is the volume force vector.
A no-slip boundary condition was applied to the bioreactor walls. This wall condition must be included to compensate for the limitations of the k-ε turbulence model close to the walls.
The material properties of the growth media were assumed to be that of liquid water (ρ = 1,000 kg m−3, µ = 1.003 mPa∙s) and did not change during the whole growing process. These properties were taken from the material library built into the CFD modeling software (COMSOL Multiphysics, RRID: SCR_014767).
In order to study how the mechanical stress, determined by the stirred-tank operative conditions, affects cell biomass, a three-dimensional agent-based model of cells growing on microcarriers moving in the fluid media of the stirred-tank was developed. The model was implemented using the Biocellion agent-based modeling framework (Kang et al., 2014). In the ABM formulation, each cell and microcarrier was represented as a spherical agent propelled by forces calculated from the computed velocity field of the fluid media. By explicitly including the cells and microcarriers, the model allows us to study the relationships between mechanical interactions and essential biological processes such as cell proliferation and death.
Newton’s equations were used to model the dynamics of both cells and microcarriers (Jayathilake et al., 2017):
where.
• mi is the mass of an agent
•
• Fi is the total force exerted on agent i,
• Fc,i is the total force exerted on agent i due to contact with other agents,
• Fb,i is the force on agent i due to contact with the bioreactor boundary,
• Ff,i is the total force exerted on agent i due to fluid flow; this is the so-called drag force, and
• Fg,i is the force due to gravity and buoyancy.
The mass mi is constant for microcarriers and changes during the proliferation cycle for cells, as described in Eq. (14). The mass values and ranges can be found in Supplementary Table S2. The contact force on agent i is the sum of all mechanical forces that act on agent i due to interactions with other agents and with the bioreactor boundary:
where Fij is the force exerted by other agents (cells and microcarriers) that form a bond with agent i. A bond is created between two agents when the distance between their centers becomes smaller than a threshold value δc. Similarly, a bond between two agents is broken when the distance between their centers becomes larger than δd. The force between bonded agents is treated as a spring-bound system and is described by the following equations:
Where dij is the distance between the centers of agents i and j. I and J represent the type of agent
As an approximation for cell deformation when adhering to the microcarrier while using rigid spherical agents, the cell division radius Rdiv was subtracted from the microcarrier radius as given in Supplementary Table S1, resulting in the simulated microcarrier radius Rm as given in Supplementary Table S2. This correction places the cell centers approximately at the original microcarrier surface, making the number of cells that fit on the microcarrier surface more realistic.
The forces on agents due to contact with the bioreactor boundary are modeled with a repulsive interaction force that is proportional to the overlap, δb,i, between the spherical agent i and the bioreactor boundary:
where
In this work, the fluid drag force is based on Stokes flow past a sphere, and it is given by:
where μ is the dynamic viscosity of the fluid, ri is the radius of agent i, and
Finally, the effects of gravity and buoyancy on agents are represented by the following equation:
Where g is the standard acceleration of gravity, ρm is the density of the medium, and ρi is the density of the agent.
Simulations were performed with only microcarrier agents and no cell agents to investigate the particle motion through the bioreactor. The position of all agents at the next timestep was calculated from the force every time step using a Verlet leapfrog integration algorithm.
Previous studies suggested that mechanical stress induces cell death, thus limiting biomass growth on a microcarrier (Croughan et al., 1987). However, other possible factors limit cell growth, such as stress-induced reduction of proliferation capacity. We define quiescence as a cellular state of limited proliferation due to mechanical stress. To study the different causes of reduced cell growth on microcarriers, we consider cell proliferation, cell quiescence, and cell death (Figure 4). Moreover, we model cell state transition due to external mechanical stress only, determined by mechanical stress thresholds σD and σp (Figure 4). The following subsections describe in more detail the three cellular processes included in the model.
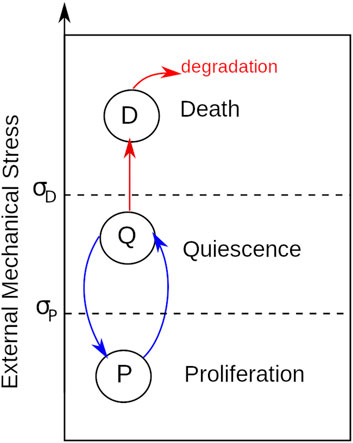
FIGURE 4. Phenotypes and their transitions due to external mechanical stress.
Under our current assumption of abundant nutrients, Hill-type stress-based modulation of the growth rate of cell i was used to model cell growth:
where rmax is the maximum proliferation rate obtained directly from the doubling time, the time it takes for a population of cells to double in size; σi is the mechanical stress on cell i, σp is a parameter that modulates the effect of mechanical stress on the growth rate, and n is an integer that modulates the steepness of the Hill-type equation. Eq. 14 dictates the transition between the normal proliferative cell state and the quiescent state where no proliferation occurs. Cells will stay in quiescence until the experienced stress decreases again below the threshold.
To compute the mechanical stress, we first need to compute the tensor stress (Si) of agent i due to interactions with other agents (Fenley et al., 2014):
where
A cell division event is performed when the cell radius is greater than a user-defined threshold Rdiv. In cell division, a cell i is replaced by two daughter cells; one has a mass of m/2 ± 0.1m (a random value is drawn from a uniform distribution between the two limits), and the other takes the remaining mass to ensure that the total mass is conserved. The two daughter cells are placed in the plane tangential to the microcarrier (sphere) that passes through the center of the mother cell. Only cells that are attached to a microcarrier divide. The direction within the plane in which the two daughter cells are placed is randomly selected. Both daughter cells are placed at a distance (R1 + R2)/4 from the center of the mother cell, where R1 and R2 are the radii of the two daughter cells.
The model of cell death was adapted from Bull et al. (2020). Cells subjected to high mechanical stress die if they remain under high mechanical stress for longer than a threshold time TD. To determine the non-viable cell population induced by high mechanical stress, we test if σi > σD, where σD is a mechanical stress threshold. Each cell is assigned a stress time counter τi, which evaluates when a cell is under mechanical stress and evolves as follows:
where H(x) is the Heaviside step function equal to 1 if x ≥ 0 and 0 otherwise. Cells transition to a cell death state when i > TD. After a transition to the cell death state, it enters a disintegration process in which the cell biomass decays according to:
The cell is removed from the overall population when the cell radius is smaller than 10 μm. Moreover, rD was set to 50% maximum proliferation cell death (rmax).
While biological cell proliferation and cell motion events typically happen on the order of minutes, hours or even days, the timesteps in the fluid dynamics simulation need to be on the order of milliseconds to capture the effect of impeller rotation and small-scale variations. Due to the big discrepancy between biological and physical relevant times, running a tightly coupled simulation with equal real-time timesteps for the biological and physical models is not feasible. A multi-timescale coupling approach is required for the coupled multiscale model to have reasonable simulation times. Due to the random nature of turbulent flow and the statistical relevance of the stress experienced by the cells, the approach of equating a physical model time step to a biological time step was used, even though they do not match up in real-time. In all simulations in this research, a simulation time step constitutes 0.00002 s in the physical coupling of fluid dynamics to cell and microcarrier motion. The doubling time of the biological cells, which for the types of cells of interest is between 12–24 h (Tamm et al., 2013; Shanini et al., 2018), was set to 5,000 simulation steps, equal to ten doublings per second. This scaling, although unrealistic, enables a direct coupling of the dynamical movement of microcarriers and cell experience of fluid forces to the proliferation of the cells. Our preliminary results suggest that increasing the doubling time (from 0.1 to 0.4 s) does not affect the conclusions of this work. The discussion section offers an explanation of this approximation.
To investigate the model sensitivity with respect to its input parameters, we performed a sensitivity analysis according to the method of Morris (1991) with additional improvements by Campolongo et al. (2007). This method, also known as the Elementary Effects Method, is widely used to get an impression of a model’s sensitivity with many parameters and long simulation times (Saltelli, 2008). This method is well suited when the high number of input parameters makes the more thorough variance-based techniques infeasible. It ranks parameters according to their influence on the model output. The method implemented in the SALib library was used to perform the analysis (Herman and Usher, 2017).
The sensitivity analysis was performed for the indicated biomechanical parameters in Supplementary Table S3 since these are the relevant ABM parameters. Sensitivity analysis of the CFD parameters and the physical system was not done in this project but will be explored in future work.
Sampling the parameter space using Morris’ sampling method was done for the indicated parameters from the ranges shown in Supplementary Table S3 using the Elementary Effects sampling method. These ranges were inspired by conversations with industry and literature results and were specified to cover a physically realistic extent. The sampling was conducted with r = 10 trajectories and p = 4 sampling levels. Some parameters were sampled from an exponential distribution, also indicated in Supplementary Table S3.
The steady-state flow behaviors (velocity magnitude, fluid shear stress, and Kolmogorov length) at impeller rotation speeds of 60 and 220 rpm are illustrated in Figure 5. These modest and vigorous rotational speeds induce similar fluid flow patterns but quantitatively different flow metrics. The Reynolds number has been calculated as 1,444 for 60 rpm and 5,294.7 for 220 rpm using Eq. (1).
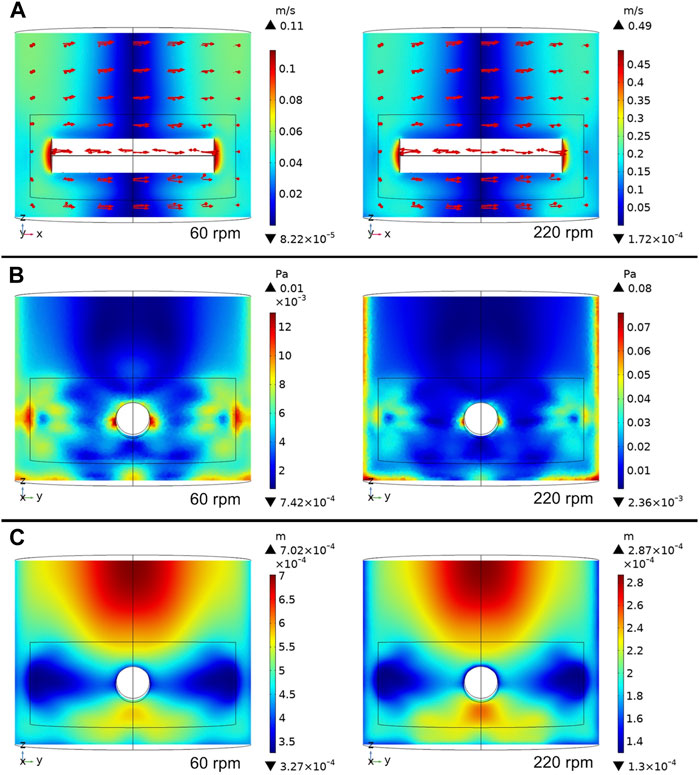
FIGURE 5. Computational fluid dynamic simulations at 60 rpm and 220 rpm. (A) Fluid velocity profile (top), (B) fluid shear stress (middle) and (C) Kolmogorov eddy length scale (bottom).
One can see from the vertical slice cut parallel to the x-z plane that at both rotor speeds, the velocity magnitude is largest near the tips of the impeller and lowest in a vertical cylindrical region at the center (Figure 5). However, as is evident by the relative ranges on the color-coded legends, the velocity magnitude at 220 rpm is about four to five times that at 60 rpm.
The shear stress is a parameter, also displayed in Figure 5, that influences biological processes in bioreactors. Similar to the velocity magnitude profiles, the shear stress shows comparable patterns at 60 and 220 rpm. Generally, higher shear stress exerts more influence on the cells and is observed around the tips of the impellers, similar to the results reported by Ghasemian et al. (2020). The hydrodynamic characteristics within a spinner flask at rotational speeds of 40, 60, 80, and 100 rpm were simulated in that study. Their results show that the shear stress ranged from 0 to about 80 mPa, similar to the shear stress produced in this study at 60 rpm.
Kolmogorov length is another parameter that helps understand the influence of turbulent eddies on cells (Katopodes, 2018). The Kolmogorov length scale states that small-scale motion is a function of the dissipation rate per unit mass and the kinematic viscosity (Ting, 2016). The Kolmogorov scale is typically represented as:
where λ is the characteristic size of the eddies, v is the kinematic viscosity, and ε is the rate of dissipation of turbulent energy (Doran, 2013).
Although the two rotational speeds in this study show similar Kolmogorov length distribution patterns within bioreactors, their Kolmogorov length values are considerably different. Both rotational speeds have lower Kolmogorov length values around the tips of impellers, indicating higher turbulence in this region. The Kolmogorov length scale values at 60 rpm in the whole bioreactor are larger than the microcarrier size of 180 μm, while those of the 220 rpm scenario are either much smaller than or similar in size to the microcarriers. These simulated Kolmogorov length values are similar to those reported by Ghasemian et al. (2020). Croughan et al. (1987) reported that the relative cell growth rate significantly decreased when the Kolmogorov length was smaller than 125 μm and detrimental effects appeared to come into play when the Kolmogorov length dropped below about 100 μm, which was about half of the average microcarrier diameter of 180 μm. In this study, the minimum Kolmogorov length is about 60 μm, which is much smaller than the critical length, indicating potential significant damage to the cells when microcarriers flow into these regions.
Results from simulations of cell growth on a single microcarrier in the absence of fluid movement are presented in this section. These simulations will help to study how cell state transition and growth are affected by interactions between cells, interactions with other cells and those with the microcarrier. In this modeling framework, changes to cell shape and cell deformation are disregarded. The parameters of the simulations are shown in Supplementary Table S2.
For each cell i, stress σi is computed as described in subsection 2.3.2, “Cellular phenotypes.” Compressive forces contribute positively, and tensile forces contribute negatively to the overall mechanical stress sensed by cells. Figure 6A shows a simulation snapshot of cells growing on a microcarrier, and Figure 6B shows a histogram of mechanical stress experienced by cells. The color of each cell represents the magnitude of mechanical stress. Most of the cells in this example experience compressive forces exerted by their neighbors, as indicated by their reddish color (Figure 6A) and the predominantly positive values for net stress on a cell reported in the histogram (Figure 6B). Literature reports describe the prevalence of compressive forces in cell monolayers bound to flat substrates (Chen et al., 2018) and those within circular confinements (Serrano et al., 2019; Blanch-Mercader et al., 2021). This figure suggests that the mechanical stress sensed by the cells on the microcarrier may be rather variable, even in the absence of shear forces. Notably, the distribution of stress profiles experienced by the cell population on the microcarrier is semi-normal (Figure 6B).
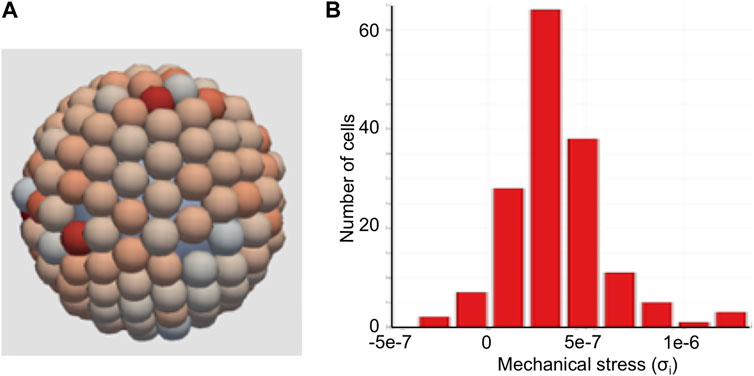
FIGURE 6. Agent-based model of cells on a microcarrier. (A) Cells growing on top of a microcarrier. Red indicates compressive stress and blue indicates tensile stress. (B) Histogram of mechanical stress sensed by the cells growing on the microcarrier.
First, a scenario in which mechanical stress does not induce cell death but reduces cell proliferation capacity was tested, see Eq. (14). Within our modeling approach, this scenario is simulated by setting σD = 1, a very high value according to Figure 6B. Figure 7A shows the number of cells growing on the microcarrier as a function of time for different values of σp and n = 5, while similar results for other values of n are shown in Supplementary Figure S1. The results in Figure 7A show different growth trends for different values of σp. For high values (σp = 10−6), the cell count grows exponentially at first and then deviates from exponential growth; however, it does not reach a constant value. For smaller values of σp, the number of cells reaches a constant value. A second scenario was simulated, in which mechanical stress does not change the proliferation rate but induces cell death, thus limiting the population size. This scenario is simulated by suppressing the transition of cells to the quiescent state, making σD = σp. Figure 7B shows the cell count as a function of time for different values of σD and TD = 0.1τd, while the results of other values of TD are shown in Supplementary Figure S2. Similar to Figures 7A, B shows different growth trends for different values of σD. For σD = 10−5 μN/μm2, the population growth is exponential at the same rate as the unconstrained exponential growth σD = 1 μN/μm2. For smaller values of σD, the population reaches a constant value similar to Figure 6B. It is worth noting that initially, the number of cells grows at the same rate as in the unconstrained growth for the scenario in Figure 7B, whereas the cells can grow at much slower rates for the scenario of Figure 7A and Supplementary Figure S1.
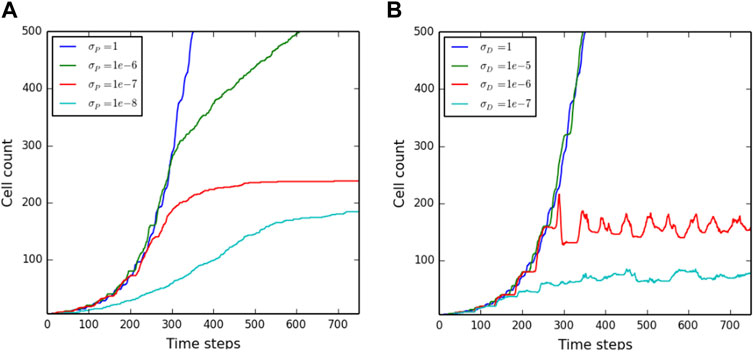
FIGURE 7. Cell population on a single microcarrier as a function of time. The number of cells per microcarrier over time for (A) various values for the proliferation threshold and (B) various values for the cell death threshold.
Simulations with 1,000 microcarrier agents without cells growing on them were performed to assess the distribution of microcarriers throughout the bioreactor at various times with various rotation speeds. The velocity fields from the CFD simulations were used to perform Lagrangian Particle Tracking (LPT) using only the mechanical interactions of the Agent-Based Model as described in Eq. (7). All microcarrier agents started at a random position. Their locations were accumulated over 200,000 simulation time steps to give a relative distribution of microcarriers, as shown in Figure 8. The initial random distribution is still prevalent at early simulation times (e.g., 120,000 simulation steps). However, from 500,000 simulation steps onward, high-density zones become apparent, growing in intensity for longer simulation times as the randomness of the initial conditions disappears. A clear high-density spot appears just above the impeller tip for impeller rotation of 60 rpm, as seen in Figure 5; this corresponds to a high-stress region. Another high-density zone can be seen in the top right corner for the 220 rpm simulations; this zone grows in intensity beyond the scale depicted in the figure colormap.
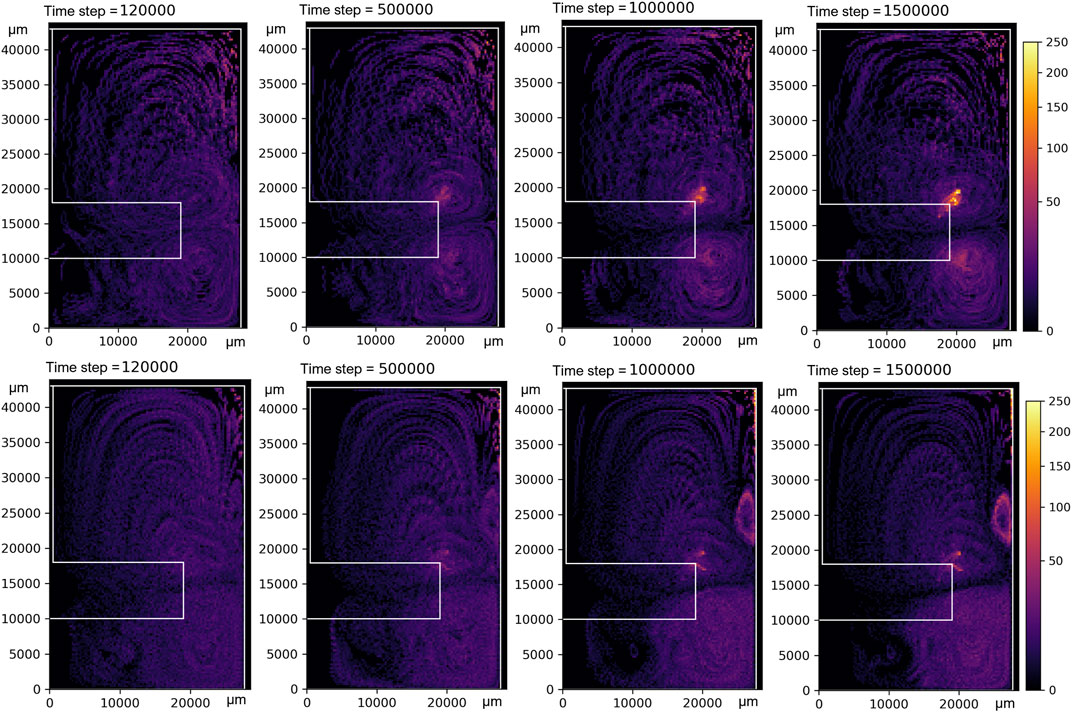
FIGURE 8. Microcarrier density heat maps. Color represents the number of microcarriers accumulated over the whole bioreactor’s radial symmetry and 200,000 simulation time steps in a bin size of 275 μm2. The top row shows heat maps obtained at a rotational speed of 60 rpm, and the bottom row at 220 rpm.
The ABM and CFD methods were combined to simulate how the mechanical stresses inside the stirred-tank bioreactor influence the biomass accumulation of cells attached to spherical microcarriers. In our model, fluid flow influences how individual cells move, grow, and proliferate. Because in CFD simulations, the modeled bioreactor reaches its steady-state flow in just a few seconds, transient flows in the whole-system simulation were ignored. As described in the Methods section, the distribution of fluid velocities at steady state to compute the drag forces Ff,i [Eq. (12)] was used. We explored several values of σD and σp for these simulations, while other parameters are specified in Supplementary Table S2. Moreover, we observed that the fluid could produce cell detachment, especially at 220 rpm; thus, we report only live cells attached to the microcarrier.
Biomass levels for simulations at 60, 180, and 220 rpms were compared. These simulations test whether the model can qualitatively recapitulate the trends observed experimentally by Croughan et al. (1987), described in Methods. They observed that the biomass level in the bioreactor decreases with increasing impeller rotation rate and that high rotor speeds (180 and 220 rpms) induce cell death (Figure 2).
Figure 9 shows how the number of attached cells (solid lines) changes in time at 60 rpm and 220 rpm. Figures 9A,B show simulations for σD = 10−6, σP = 10−7 and σD = 10−7, σP = 10−7, respectively. Other values of σD and σp were also tested; the simulation results can be found in Supplementary Figure S3. As expected, in all the simulations, the number of cells at 220 rpm grows slower than that at 60 rpm. This trend is observed even when the number of dead cells is zero (Left side of Figure 9A). Moreover, when σD = σp = 10−7 the cells at 180 and 220 rpm grow very slowly, but due to regions of high mechanical stress, the number of cells in many simulations went to zero. These simulation results are in good qualitative agreement with those reported by Croughan et al. (1987); increasing rotor speed reduces biomass growth rates, and cell death is induced at very high rotational speeds.
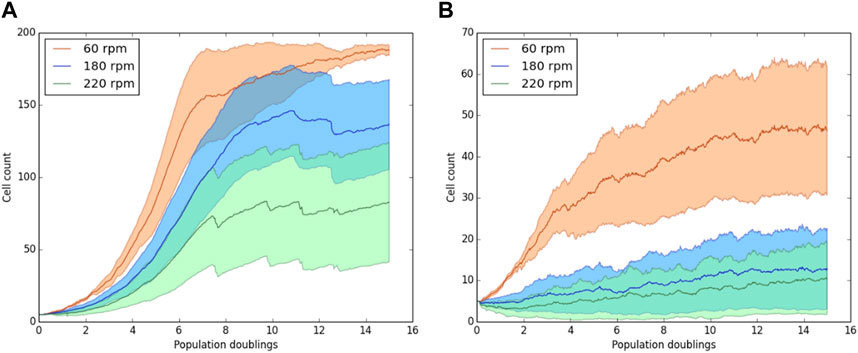
FIGURE 9. Cell population on a single microcarrier as a function of time for 60, 180, and 220 rpm. With cell death thresholds of (A) σD = 10−6, σP = 10−7 and (B) σD = 10−7, σP = 10−7. Solid lines represent live cells attached to the microcarrier. The cell counts are the average over 20 simulations. One time step represents the theoretical doubling time of cells.
Ten replicates of the simulation were run for every parameter sample, and the average output was taken for analysis. The output of the model considered in the sensitivity analysis was set to the value of the number of cells attached to a microcarrier at the 20000th and at the 50000th time step. The latter time step was chosen since many configurations, as shown in Supplementary Figure S3, yielded a steady state at or around that time step. This choice of output potentially influences the measured sensitivity of the model. However, no significant changes in the parameter ranking were found by using the output at later time steps. The results of the sensitivity analysis change significantly when choosing an earlier time step.
The sensitivity analysis results are shown in Figure 10 and indicate that after 50,000 time steps, the highest variation in the output is due to a difference in the parameter that determines the cell-cell bond strength (A_AGENT_BOND_S_CC). However, the uncertainty σ in the elementary effect is large compared to the elementary effect itself.
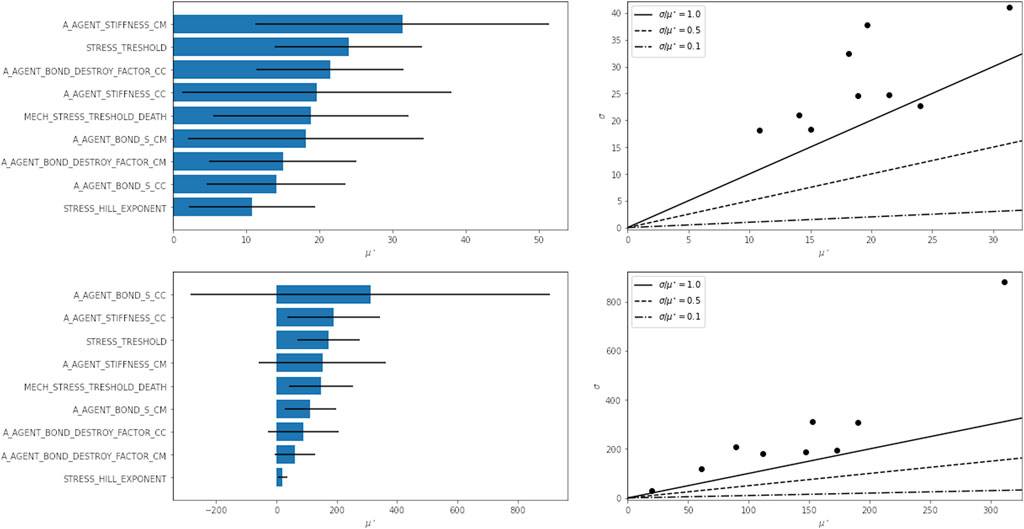
FIGURE 10. Results of sensitivity analysis. Parameters ranked by their elementary effect μ* on the model outcome (left) and the elementary effect plotted against the deviation s of that elementary effect (right). The sensitivity was analyzed for the number of attached cells at simulation step 20,000 (top) and 50,000 (bottom) steps. See Supplementary Table S3 for the description of parameter names.
After 20,000 steps, the results show a stronger dependence on the cell-microcarrier bond stiffness (A_AGENT_STIFFNESS_CM) and the stress threshold (STRESS_THRESHOLD). The uncertainty in elementary effects is also considerably smaller.
Combining multiple modeling approaches in a more comprehensive model can generate novel insights and identify emergent properties in the system under study. Indeed, CFD and ABM have been used together in several diverse multiscale models that simulate disaster responses (Epstein et al., 2011), cell and particle migration through blood vessels (Fullstone et al., 2015; Bhui and Hayenga, 2017; Bhui, 2018; Corti et al., 2020), and movement of zooplankton in complex flow environments (Ozalp et al., 2020). Notably, CFD and ABM per se have never been used together to understand the process dynamics within a bioreactor relevant to cultivated meat. However, combined models for biological and physicochemical dynamics have been used to examine different parallel-plate bioreactor configurations for the growth of tissue (Peng and Palsson, 1996). Here, a unilineage model was employed to describe the replication and differentiation of stem cells, and the physicochemical processes were modeled by the Navier-Stokes and convective-diffusion equations.
Despite the advancements made in prior studies, it is worth reiterating that the present work aims to prototype a new computer modeling methodology for adhesive cell cultures in bioreactors. The new framework was used to qualitatively recapitulate the empirical and theoretical results from Figure 2. Several assumptions and simplifications were made in the novel model.
I. Assumption. The only impact of mechanical stress on cell biology is to slow cell proliferation rate and induce cell death.
II. Assumption. Capturing the relevant fluid dynamics behaviors is accomplished at a much shorter simulation time step than is needed to capture the biological response behaviors of cells.
III. Simplification. Biomass accumulation and microcarrier count do not significantly affect the fluid properties.
IV. Simplification. Cell growth is independent of the concentration of molecules (such as nutrients, oxygen, or H+ ions) in the media.
V. Simplification. Microcarrier and cell densities are smaller than those used and observed in laboratory experiments.
VI. Simplification. By using a RANS approach for CFD, we do not explicitly model small, turbulent eddies and are therefore not taken into account when calculating the mechanical stress.
VII. Simplification. The effect of the fluid on microcarriers and cells was modeled using the Stokes law for drag force.
VIII. Simplification. The Stokes drag force was calculated for every agent (cells and microcarriers), and in this calculation, no shielding by other agents was taken into account.
IX. Assumption. The time-dependent effect of the fluid on the cells will average out in steady-state flow for multiple microcarriers and simulations.
Previous theoretical studies (Croughan et al., 1987) assert that cell death is the main driver of biomass reduction at higher rotor speeds but without providing experimental validation. Our understanding from experimentalists and the literature is that dead cells are difficult to count accurately because they may disintegrate into the surrounding media during the experimental period, evading measurement post-experiment (Sanford et al., 1951). Assumption I introduces the alternative mechanism that mechanical stresses suppress cells’ proliferation rates while disregarding any changes in cell shape. Results in this study (Figure 9) support the hypothesis that this mechanism is also responsible for the overall reduced biomass level observed at higher rotor speeds. The ABM approach, facilitating representation of individual cells and the induced mechanical stresses they experience, thus provides a direct means to answer the question: “Instead of cell death, could a reduction in proliferation rate caused by mechanical stresses due to fluid flow on some cells explain the reduced biomass at higher stir speeds?” Answered in the affirmative for virtual experiments, there is now a stronger case for asking the same question of laboratory experimentalists.
Notably, using the virial stress formulation (Eq. (16)) for spherical cells can give rise to large fluctuations in this measure (Liedekerke et al., 2019). However, this work has continuously accounted for volume change in determining the tensor stress on each agent (Eq. (15)), which is more accurate than a constant volume assumption in the application of virial stress determinations for atomistic stress (Fenley et al., 2014). Despite the apparent variability (Figure 6A), the mechanical stress distribution for cells on the microcarrier is semi-normal (Figure 6B), which mirrors the influence of compressive stress in tumor spheroid environments (Liedekerke et al., 2019). Furthermore, cells growing on the surface of microcarriers typically grow in a single layer, which results in lower virial stress fluctuations per cell overall than in a spheroid system.
Assumption II and Simplifications III and IV simplify integration of ABM and CFD in this early modeling approach. Simplification III implies that fluid properties are independent of the cell and microcarrier population, and therefore, a CFD simulation performed on a bioreactor with only media suffices to predict fluid velocities. Simplification IV means that cell ingestion and secretion rates, as well as mixing, are irrelevant so that simulations can be performed on a homogeneous fluid. Because steady-state is reached in under 10 s of bioreactor operation, Assumption II permits a steady-state fluid flow to be used at all biological time steps.
Assumption VI, although discrepant with the to-be-tested eddy length hypothesis mentioned by Croughan et al. (1987), allowed for simulating the whole bioreactor domain. Doing this with Direct Numerical Simulation or Large Eddy Simulation with a mesh on the scale of the individual cells would have made the simulation unachievable due to the large domain. Simplification VII was chosen as an approximation for calculating the drag force on both cells and microcarriers. This approach was taken since a similar method has been used and validated in other microcarrier modeling efforts (Berry et al., 2016). This simplification also implies that hydrodynamical lift forces (e.g., Magnus effect) were not taken into account. We consider this a reasonable assumption since the agents are spherical bodies that move freely with the fluid with small velocity relative to the fluid and no significant spin. Simplification VIII allows the use of a single force to calculate both microcarrier movement and agent stress. Rather than calculating the total drag force of a packed microcarrier, which would have been more accurate for the microcarrier movement, we chose this approach to be able to simulate the effect of fluid velocity gradients on the cells attached to microcarriers.
Regarding the sensitivity analysis, overall, it seems that the uncertainties of the elementary effects are large. This issue can probably be solved by running more or larger (more microcarriers) simulations per parameter set, so the output will statistically be steadier. However, as a first parameter space exploration, the sensitivity analysis gives essential information for further research. Notably, the strength and uncertainty of the elementary effect of the cell-cell bond strength parameter becomes very high while the other effects remain ranked in a similar order with comparable variance. Therefore, a variance-based exploration of the top three or four parameters with more simulations per parameter set will be a logical next step.
It is important to describe some of the current limitations of the model. In the model, fluid dynamics and cell behavior are modeled independently. However, it is possible that changes in biomass could affect fluid dynamics, which would require recomputing the CFD model. Moreover, despite the simplifications and assumptions listed above, the model cannot bridge the discrepancy in biomechanics and biological time scales. Namely, a cell can move from one end of the bioreactor to the other in seconds, whereas its division into 2 cells takes about a day. Furthermore, simulating the millions of microcarriers and billions of cells in even small bioreactors, while possible using supercomputers, is beyond the computational capability of the desktop computers and small cloud clusters we have readily available. The workarounds are Assumption IX, to perform simulation using unrealistic proliferation rates in the time scale of seconds, and Simplification V, to use considerably fewer microcarriers than typically used in experiments. Our preliminary results (Supplementary Figure S4) suggest that qualitative trends observed in Figures 7, 9 are not expected to change due to these simplifications. Further refinements will be needed to model the bioreactor system at realistic temporal and spatial time scales. Another important limitation is that the two considered processes, cell proliferation and cell death, can be impacted by factors other than mechanical stress. Nutrients, oxygen availability, and rupture of bubbles are some factors that would need to be incorporated into a more comprehensive computational model. Another important process not considered in the model is cell deformation that, according to previous studies, can impact the cell density on microcarriers and the strength of cell microcarrier attachment.
Despite the assumptions, limitations, and simplifications, this unified CFD and ABM model recapitulated the experimental observation that increasing rotational speeds in stirred-tank bioreactors reduces biomass growth rates. Thus, this model promises to offer an enhanced understanding of microcarrier-based stirred-tank bioreactors, which was impossible with the analysis conducted by Croughan et al. (1987). The damaging effects due to the formation of turbulence are of special interest for further investigation. Researchers investigating turbulence have noticed that eddy size determines its effect on solid particles (Kuboi et al., 1974; Glasgow and Luecke, 1980; Petenate and Glatz, 1983). These studies indicate that larger eddies tend to carry microcarriers along without causing damage, while smaller, sharper eddies can apply distorting forces. The eddy-length model proposes that damage occurs to cells when the Kolmogorov eddy length is below a critical value (Croughan et al., 1987). Given the single-cell size spatial resolution that is possible with ABM and the turbulence modeling capability of CFD, this novel computer modeling methodology should make it possible to assess the validity of the eddy-length model theory.
Croughan et al. (1987) also observed that fluctuating fluid velocity components around a microcarrier change rapidly with time and position as it moves throughout a stirred-tank bioreactor. They propose a “time-average” analysis model, where the position-dependent time-average flow profile around a microcarrier is tracked as it circulates through various time-averaged velocity fields in a stirred-tank bioreactor. Realistically, this oversimplifies the dynamics within the bioreactor environment and neglects to capture how this fluid flow variability will manifest across a cell population. Here, the combined CFD-ABM model could offer more detailed information. Whereas previous modeling efforts for microcarrier cultures in stirred-tank bioreactors used Euler-Euler or Euler-Lagrange approaches (Chu et al., 2005; Berry et al., 2016), and achieved results that are in agreement with experiments, these approaches are limited by the simplicity and continuous representation of the microcarriers and cells. When cell-cell interactions become more prevalent due to increased density, these approaches will not suffice. Combining CFD with ABM enables cell-scale resolution results and the explicit addition of mechanical and biological interaction between cells and their environment. In this way, the CFD-ABM approach can reveal detailed information regarding cell population heterogeneity, where this “cell-state spread” should be a proxy for bioreactor/bioprocess efficacy.
The combined modeling approach described in this paper effectively investigates the effect of various mechanisms in the bioprocess on several relevant scales, from full bioreactor fluid flow profiles and microcarrier distributions to single-cell experience of mechanical forces. Future research will focus on refining the coupling between CFD and ABM and the different spatial and temporal scales to make the overall framework better suited for simulating larger bioreactors. The next steps in developing whole-system models include adding additional physical and biological mechanisms. Some mechanisms that could be added include aeration and heat and mass transfer for CFD; and nutrient consumption, oxygen utilization, cell deformation, gene regulation and cell signaling for ABM.
Beyond adding other physical and biological mechanisms, further work must also refine existing models, such as the adhesion model for agents. In this case, the current tanh-based adhesion model, as described in the Methods, has proven useful (Aguilar et al., 2018), but it is a non-realistic representation of the actual biomechanics. Ongoing investigations around this topic take into account several adhesion modeling approaches (JKR, Lennard-Jones, integrin-based model) (Chu et al., 2005; Van Liedekerke et al., 2015; Liedekerke et al., 2019).
Another aim of ongoing work is to verify the implemented mechanisms and parameters of the modeling framework in a simple experimental configuration that can be controlled precisely. Such a configuration, the IBIDI computerized pump system (Ibidi GmbH, Martinsried/Munich, Germany), has been identified and is being used in several labs by collaborators to refine the effect of various shear stress time profiles on proliferation rate, migration, detachment and induced cell death. A further intent of this work is to translate as many relevant model parameters as possible to measurable experimental parameters so that experimental setups can be directly or nearly translated to the computer model. Additional verification studies should also refine the cell agent response to compressive and tensile profiles, potentially using experimental results from monolayer stress microscopy (Serrano et al., 2019), and help incorporate cell shape changes and deformation dynamics.
Experiments to validate the whole-system stirred-tank bioreactor model are also being set up in collaboration with cultivated meat companies and research groups that use these bioreactors. The ultimate intention is that each partner can examine specific parameters of the whole-system models using controlled experiments, after which the framework can be used to analyze and optimize their production setup. In this way, the modeling framework is intended to replace many expensive lab experiments that these companies would have to run to test and optimize their large-scale meat production facilities.
Finally, future work will incorporate simulations based on experimental data acquired from cell lines relevant to cultured meat production. The current model based on data from the FS-4 cell line is meant to be a framework only, and the CMMC is actively pursuing collaborations with cultivated meat companies to obtain data for lamb and fish cells, to name a few.
The original contributions presented in the study are included in the article/Supplementary Materials, further inquiries can be directed to the corresponding author.
FC-R: Writing–original draft, Writing–review and editing. JC: Writing–original draft, Writing–review and editing. GP: Writing–original draft, Writing–review and editing. CC: Writing–original draft. JC: Writing–original draft. SK: Writing–original draft. BA: Writing–original draft, Writing–review and editing.
The author(s) declare financial support was received for the research, authorship, and/or publication of this article. Merck KGaA provided programmatic funding, Lipiferm Scientific provided consulting services, and Biocellion SPC provided software for the project. Additional funding was provided through a grant from The Good Food Institute.
This work is an initiative by the Cultivated Meat Modeling Consortium (www.thecmmc.org). The authors would like to thank the other members for engaging and informative discussions.
The authors declare that the research was conducted in the absence of any commercial or financial relationships that could be construed as a potential conflict of interest.
All claims expressed in this article are solely those of the authors and do not necessarily represent those of their affiliated organizations, or those of the publisher, the editors and the reviewers. Any product that may be evaluated in this article, or claim that may be made by its manufacturer, is not guaranteed or endorsed by the publisher.
The Supplementary Material for this article can be found online at: https://www.frontiersin.org/articles/10.3389/frfst.2023.1295245/full#supplementary-material
Aguilar, B., Ghaffarizadeh, A., Johnson, C. D., Podgorski, G. J., Shmulevich, I., and Flann, N. S. (2018). Cell death as a trigger for morphogenesis. PLOS ONE 13, e0191089. doi:10.1371/journal.pone.0191089
Allan, S. J., De Bank, P. A., and Ellis, M. J. (2019). Bioprocess design considerations for cultured meat production with a focus on the expansion bioreactor. Front. Sustain. Food Syst. 3, 44. doi:10.3389/fsufs.2019.00044
Berry, J. D., Liovuc, P., Sutalo, I. D., Stewart, R. L., Glattauer, V., and Meagher, L. (2016). Characterisation of stresses on microcarriers in a stirred bioreactor. Appl. Math. Model. 40, 6787–6804. doi:10.1016/j.apm.2016.02.025
Bhui, R. (2018). A multiscale model of leukocyte transendothelial migration during atherogenesis. Available at: https://utd-ir.tdl.org/handle/10735.1/6583.
Bhui, R., and Hayenga, H. N. (2017). An agent-based model of leukocyte transendothelial migration during atherogenesis. PLOS Comput. Biol. 13, e1005523. doi:10.1371/journal.pcbi.1005523
Blanch-Mercader, C., Guillamat, P., Roux, A., and Kruse, K. (2021). Quantifying material properties of cell monolayers by analyzing integer topological defects. Phys. Rev. Lett. 126, 028101. doi:10.1103/PhysRevLett.126.028101
Bull, J. A., Mech, F., Quaiser, T., Waters, S. L., and Byrne, H. M. (2020). Mathematical modelling reveals cellular dynamics within tumour spheroids. PLOS Comput. Biol. 16, e1007961. doi:10.1371/journal.pcbi.1007961
Campolongo, F., Cariboni, J., and Saltelli, A. (2007). An effective screening design for sensitivity analysis of large models. Environ. Model. Softw. 22, 1509–1518. doi:10.1016/j.envsoft.2006.10.004
Chen, T., Saw, T. B., Mège, R.-M., and Ladoux, B. (2018). Mechanical forces in cell monolayers. J. Cell Sci. 131, jcs218156. doi:10.1242/jcs.218156
Chu, Y.-S., Dufour, S., Thiery, J. P., Perez, E., and Pincet, F. (2005). Johnson-kendall-roberts theory applied to living cells. Phys. Rev. Lett. 94, 028102. doi:10.1103/PhysRevLett.94.028102
Corti, A., Chiastra, C., Colombo, M., Garbey, M., Migliavacca, F., and Casarin, S. (2020). A fully coupled computational fluid dynamics – agent-based model of atherosclerotic plaque development: multiscale modeling framework and parameter sensitivity analysis. Comput. Biol. Med. 118, 103623. doi:10.1016/j.compbiomed.2020.103623
Croughan, M. S., Hamel, J.-F., and Wang, D. I. C. (1987). Hydrodynamic effects on animal cells grown in microcarrier cultures. Biotechnol. Bioeng. 29, 130–141. doi:10.1002/bit.260290117
Cytiva (2021). Microcarrier cell culture principles and methods. Marlborough, MA: Cytiva handbook. Available at: https://www.cytivalifesciences.com/en/us/support/handbooks (Accessed November 1, 2021).
Doran, P. M. (2013). Bioprocess engineering principles. 2nd ed. Amsterdam Heidelberg: Elsevier Academic Press.
Epstein, J. M., Pankajakshan, R., and Hammond, R. A. (2011). Combining computational fluid dynamics and agent-based modeling: a new approach to evacuation planning. PLoS One 6, e20139. doi:10.1371/journal.pone.0020139
FAO (2017). The future of food and agriculture: trends and challenges. Rome. Food and Agriculture Organization of the United Nations. Available at: https://www.fao.org/3/i6583e/i6583e.pdf.
Fenley, A. T., Muddana, H. S., and Gilson, M. K. (2014). Calculation and visualization of atomistic mechanical stresses in nanomaterials and biomolecules. PLoS ONE 9, e113119. doi:10.1371/journal.pone.0113119
Fullstone, G., Wood, J., Holcombe, M., and Battaglia, G. (2015). Modelling the transport of nanoparticles under blood flow using an agent-based approach. Sci. Rep. 5, 10649. doi:10.1038/srep10649
Ghasemian, M., Layton, C., Nampe, D., zur Nieden, N. I., Tsutsui, H., and Princevac, M. (2020). Hydrodynamic characterization within a spinner flask and a rotary wall vessel for stem cell culture. Biochem. Eng. J. 157, 107533. doi:10.1016/j.bej.2020.107533
Glasgow, L. A., and Luecke, R. H. (1980). Mechanisms of deaggregation for clay-polymer flocs in turbulent systems. Industrial Eng. Chem. Fundam. 19, 148–156. doi:10.1021/i160074a003
Hanga, M. P., de la Raga, F. A., Moutsatsou, P., Hewitt, C. J., Nienow, A. W., and Wall, I. (2021). Scale-up of an intensified bioprocess for the expansion of bovine adipose-derived stem cells (bASCs) in stirred tank bioreactors. Biotechnol. Bioeng. 118, 3175–3186. doi:10.1002/bit.27842
Hartmann, R., Singh, P. K., Pearce, P., Mok, R., Song, B., Díaz-Pascual, F., et al. (2019). Emergence of three-dimensional order and structure in growing biofilms. Nat. Phys. 15, 251–256. doi:10.1038/s41567-018-0356-9
Herman, J., and Usher, W. (2017). SALib: an open-source Python library for Sensitivity Analysis. J. Open Source Softw. 2, 97. doi:10.21105/joss.00097
Hu, W.-S. (2020). Cell culture bioprocess engineering. 2nd Edn. Boca Raton, FL: CRC Press. doi:10.1201/9780429162770
Jayathilake, P. G., Gupta, P., Li, B., Madsen, C., Oyebamiji, O., González-Cabaleiro, R., et al. (2017). A mechanistic Individual-based Model of microbial communities. PLoS ONE 12, e0181965. doi:10.1371/journal.pone.0181965
Kahan, S., Camphuijsen, J., Cannistra, C., Potter, G., Consenza, Z., and Shmulevich, I. (2020). Cultivated meat modeling Consortium. Inaugural Meeting Whitepaper. doi:10.22541/au.158057683.31004563
Kang, S., Kahan, S., McDermott, J., Flann, N., and Shmulevich, I. (2014). Biocellion: accelerating computer simulation of multicellular biological system models. Bioinformatics 30, 3101–3108. doi:10.1093/bioinformatics/btu498
Katopodes, N. D. (2018). Free-surface flow: environmental fluid mechanics. Kidlington: Butterworth-Heinemann.
Kriebitzsch, S. H. L., van der Hoef, M. A., and Kuipers, J. A. M. (2013). Drag force in discrete particle models-Continuum scale or single particle scale? AIChE J. 59, 316–324. doi:10.1002/aic.13804
Kuboi, R., Komasawa, I., and Otake, T. (1974). Fluid and particle motion in turbulent dispersion—II: influence of turbulence of liquid on the motion of suspended particles. Chem. Eng. Sci. 29, 651–657. doi:10.1016/0009-2509(74)80179-x
Liedekerke, P. V., Neitsch, J., Johann, T., Alessandri, K., Nassoy, P., and Drasdo, D. (2019). Quantitative cell-based model predicts mechanical stress response of growing tumor spheroids over various growth conditions and cell lines. PLOS Comput. Biol. 15, e1006273. doi:10.1371/journal.pcbi.1006273
Macdonald, G. J. (2019). Bioreactor design adapts to biopharma's changing needs. GEN 39, 38–42. doi:10.1089/gen.39.07.11
Morris, M. D. (1991). Factorial sampling plans for preliminary computational experiments. Technometrics 33, 161–174. doi:10.1080/00401706.1991.10484804
Ozalp, M. K., Miller, L. A., Dombrowski, T., Braye, M., Dix, T., Pongracz, L., et al. (2020). Experiments and agent based models of zooplankton movement within complex flow environments. Biomimetics (Basel) 5, 2. doi:10.3390/biomimetics5010002
Peng, C. A., and Palsson, B. Ø. (1996). Cell growth and differentiation on feeder layers is predicted to be influenced by bioreactor geometry. Biotechnol. Bioeng. 50, 479–492. doi:10.1002/(SICI)1097-0290(19960605)50:5<479::AID-BIT2>3.0.CO;2-C
Petenate, A. M., and Glatz, C. E. (1983). Isoelectric precipitation of soy protein. II. Kinetics of protein aggregate growth and breakage. Biotechnol. Bioeng. 25, 3059–3078. doi:10.1002/bit.260251220
Post, M. J., Levenberg, S., Kaplan, D. L., Genovese, N., Fu, J., Bryant, C. J., et al. (2020). Scientific, sustainability and regulatory challenges of cultured meat. Nat. Food 1, 403–415. doi:10.1038/s43016-020-0112-z
Potter, G., Smith, A. S. T., Vo, N. T. K., Muster, J., Weston, W., Bertero, A., et al. (2020). A more open approach is needed to develop cell-based fish technology: it starts with zebrafish. One Earth 3, 54–64. doi:10.1016/j.oneear.2020.06.005
Raju, R., Balachandar, S., Hill, D. F., and Adrian, R. J. (2005). Reynolds number scaling of flow in a stirred tank with Rushton turbine. Part II — eigen decomposition of fluctuation. Chem. Eng. Sci. 60, 3185–3198. doi:10.1016/j.ces.2004.12.040
Rubio, N., Datar, I., Stachura, D., Kaplan, D., and Krueger, K. (2019). Cell-based fish: a novel approach to seafood production and an opportunity for cellular agriculture. Front. Sustain. Food Syst. 3, 43. doi:10.3389/fsufs.2019.00043
Saltelli, A. (2008). Global sensitivity analysis: the primer. Chichester, England; Hoboken, NJ: John Wiley.
Sanford, K. K., Earle, W. R., Evans, V. J., Waltz, H. K., and Shannon, J. E. (1951). The measurement of proliferation in tissue cultures by enumeration of cell nuclei. JNCI J. Natl. Cancer Inst. 11, 773–795. doi:10.1093/jnci/11.4.773
Serrano, R., Aung, A., Yeh, Y.-T., Varghese, S., Lasheras, J. C., and del Álamo, J. C. (2019). Three-dimensional monolayer stress microscopy. Biophysical J. 117, 111–128. doi:10.1016/j.bpj.2019.03.041
Shahini, A., Vydiam, K., Choudhury, D., Rajabian, N., Nguyen, T., Lei, P., et al. (2018). Efficient and high yield isolation of myoblasts from skeletal muscle. Stem Cell Res. 30, 122–129. doi:10.1016/j.scr.2018.05.017
Stephenson, M., and Grayson, W. (2018). Recent advances in bioreactors for cell-based therapies. F1000Res. 7, F1000. doi:10.12688/f1000research.12533.1
Tamm, C., Pijuan Galitó, S., and Annerén, C. (2013). A comparative study of protocols for mouse embryonic stem cell culturing. PLOS ONE 8 (12), e81156. doi:10.1371/journal.pone.0081156
Ting, D. (2016). Basics of engineering turbulence. London, U.K: Academic Press is an imprint of Elsevier.
Van Liedekerke, P., Palm, M. M., Jagiella, N., and Drasdo, D. (2015). Simulating tissue mechanics with agent-based models: concepts, perspectives and some novel results. Comp. Part. Mech. 2, 401–444. doi:10.1007/s40571-015-0082-3
Vergeer, R., Sinke, P., and Odegard, I. (2021). “TEA of cultivated meat,” in Future projections of different scenarios (Delft: CE Delft). Available at: https://cedelft.eu/wp-content/uploads/sites/2/2021/02/CE_Delft_190254_TEA_of_Cultivated_Meat_FINAL_corrigendum.pdf.
Keywords: agent-based modeling, computational fluid dynamics, biomechanics, bioreactor, microcarrier, cultivated meat
Citation: Cantarero-Rivera F, Camphuijsen J, Potter G, Clark C, Chen J, Kahan S and Aguilar B (2024) Modeling the biomechanics of cells on microcarriers in a stirred-tank bioreactor: an ABM-CFD coupling approach. Front. Food. Sci. Technol. 3:1295245. doi: 10.3389/frfst.2023.1295245
Received: 15 September 2023; Accepted: 06 December 2023;
Published: 18 January 2024.
Edited by:
Erika Jorge, Federal University of Minas Gerais, BrazilReviewed by:
Petra Hanga, University College London, United KingdomCopyright © 2024 Cantarero-Rivera, Camphuijsen, Potter, Clark, Chen, Kahan and Aguilar. This is an open-access article distributed under the terms of the Creative Commons Attribution License (CC BY). The use, distribution or reproduction in other forums is permitted, provided the original author(s) and the copyright owner(s) are credited and that the original publication in this journal is cited, in accordance with accepted academic practice. No use, distribution or reproduction is permitted which does not comply with these terms.
*Correspondence: Boris Aguilar, Ym9yaXMuYWd1aWxhckBzeXN0ZW1zYmlvbG9neS5vcmc=
†These authors have contributed equally to this work and share first authorship
Disclaimer: All claims expressed in this article are solely those of the authors and do not necessarily represent those of their affiliated organizations, or those of the publisher, the editors and the reviewers. Any product that may be evaluated in this article or claim that may be made by its manufacturer is not guaranteed or endorsed by the publisher.
Research integrity at Frontiers
Learn more about the work of our research integrity team to safeguard the quality of each article we publish.