 Ervehe Rrucaj
 Serena Carpentieri
 Francesco Siano
 Giovanna Ferrari
 Gianpiero Pataro
- 1Department of Industrial Engineering, University of Salerno, Fisciano, Italy
- 2ProdAl Scarl, University of Salerno, Fisciano, Italy
- 3Institute of Food Science, National Research Council (CNR), Avellino, Italy
Introduction: Cherry juice production generates substantial cherry processing by-products, presenting a significant environmental challenge. The valorization of these by-products can not only reduce management costs but also enhance profitability by recovering valuable intracellular compounds.
Methods: This study aimed at the extraction of bioactive compounds with potent antioxidant activity from sweet cherry press cake using Pulsed Electric Fields (PEF)-assisted extraction. PEF pre-treatment, carried out using a predetermined field strength (E = 3 kV/cm) and total specific energy input (WT = 10 kJ/kg), was applied to the cherry press cake prior to the subsequent solid-liquid extraction (SLE) stage. To optimize the SLE process for both untreated and PEF-treated samples, Response Surface Methodology (RSM) was employed to determine the most effective extraction parameters, including extraction temperature (20–50°C), solvent concentration (0–50% ethanol in water), solid-liquid ratio (0.05–0.2 g/mL), and diffusion time (30–360 min). The objective was to maximize key response variables: total phenolic content (TPC), flavonoid content (FC), total anthocyanin content (TAC), and antioxidant activity (FRAP). The extracts obtained from both untreated and PEF-treated samples under optimal conditions underwent HPLC-DAD analysis.
Results and discussion: The results revealed that, under optimized SLE conditions (50°C, 50% ethanol-water mixture, 0.2 g/mL solid-liquid ratio, and 360 min extraction time), PEF pre-treatment significantly enhanced the extractability of high-value compounds. This resulted in notable increases in TPC (+26%), FC (+27%), TAC (+42%), and antioxidant activity (+44%) compared to conventional SLE. Additionally, the application of PEF reduced extraction time (by 5–18 min) and solvent usage (by 2%). HPLC analysis identified cyanidin-3-O-rutinoside as the predominant phenolic compound in both untreated and PEF-treated extracts, with a remarkable increase (+2.3-fold) after PEF application. These findings underscore the potential of PEF-assisted extraction as a promising approach to maximize the recovery of valuable compounds from sweet cherry press cake, contributing to food waste reduction and enhanced value generation from by-products.
1 Introduction
The sweet cherry (Prunus avium L.), a fleshy non-climacteric stone fruit, finds extensive cultivation in temperate climates, particularly in regions like the Mediterranean (Bastos et al., 2015). Turkey is the world’s greatest producer of cherries with an annual production that was over 8,74,000 tons in 2022. Europe is the second largest producer, with output forecast to rise up to 727,000 tons, with Italy being one of the top three leading countries (USDA, 2020). In particular, the Apulia region is the leading sweet cherry producer in Italy, producing almost 40,800 tons of cherries, mainly of the “Ferrovia” cultivar (Tricase et al., 2017).
Sweet cherries are an excellent source of many nutrients and bioactive compounds that possess substantial antioxidant and health beneficial properties (Budak, 2017; Blando and Oomah, 2019; Soares Mateus et al., 2023). Among mature cherries, the highest concentration of phytochemicals is found in the edible thin protective exocarp (skin), in contrast to the considerably lower levels present in the fleshy mesocarp (Usenik et al., 2015). Phenolic compounds, including anthocyanins, flavonols, and hydroxycinnamic acids, are the primary bioactive compounds found in sweet cherries. Anthocyanins are natural pigment mainly accumulated in the skin of red cherries, with cyanidin-3-O-glucoside and cyanidin-3-O-rutinoside being the most abundant, while peonidin-3-O-rutinoside, pelargonidin-3-O-rutinoside, and peonidin-3-O-glucoside are present at lower extent (Ballistreri et al., 2013; Blando and Oomah, 2019). The main phenolics in sweet cherries consist of hydroxycinnamic derivatives primarily neo-chlorogenic, caffeoylquinic, p-coumaroylquinic, and chlorogenic acids (González-Gómez et al., 2010), while the flavonols consist predominantly of kaempferol 3-O-rutinoside, quercetin 3-O-rutinoside, and quercetin (Martini et al., 2017; Nawirska-Olszańska et al., 2017). Numerous studies have documented the health benefits linked to the consumption of cherry fruits. These benefits arise from the diverse biological activities of their bioactive compounds, which have the potential to mitigate the risks of cardiovascular disease, cancer, and diabetes. Moreover, these compounds also show promise in alleviating pain related to arthritis and gout (Khoo et al., 2017; Soares Mateus et al., 2023).
Although sweet cherries are primarily consumed as fresh fruits, their seasonal availability and a short shelf-life of 7–10 days (Wani et al., 2014) have led to an increasing tendency to process them into various food products like jam, marmalade, fruit juice, and canned goods. However, this processing generates substantial by-products and wastes, including stems, pits, and press cake residues primarily composed of skins and seeds (Chockchaisawasdee et al., 2016). Currently, these residues are frequently directed toward applications like animal feed, composting, or straightforward disposal, which consequently pose environmental concerns for fruit processing companies. Nevertheless, it is worth noting that these residues constitute a rich source of valuable compounds such as anthocyanins and polyphenols. When effectively reclaimed, these compounds can serve as natural colorants, nutraceuticals, and antioxidants for the food, pharmaceutical, and cosmetic industries (Milea et al., 2019; Soares Mateus et al., 2023). Traditional solvent extraction methods typically involve energy-intensive pre-processing steps, such as comminution and drying (Galanakis, 2012; Pataro et al., 2018). Moreover, these techniques may require excessive use of organic solvents, including but not limited to ethanol, methanol, acetone, and acetonitrile, either in their pure forms or as aqueous mixtures, with concentrations ranging from 50% to 100%. The choice of solvent concentration depends on the polarity of the target compounds. Additionally, these methods often demand long extraction times, lasting up to 24 h, and high temperatures, which can range from 20 °C to as high as 70 °C (Gil-Chávez et al., 2013; Khoddami et al., 2013; Rajbhar et al., 2015; Martín et al., 2017; Bitwell et al., 2023). Consequently, these methods can potentially degrade phenolics compounds and anthocyanins, and increase downstream processing costs (Luengo et al., 2013; Galanakis, 2015). This is motivating scientists to explore the use of cell disruption pre-treatment of plant-based biomass. These methods encompass a range of approaches, including physical methods like bead milling, high-pressure homogenization, ultrasonication, microwave, high-voltage electrical discharge, and pulsed electric fields, as well as chemical methods involving solvents, acids, and alkali. Additionally, enzymatic methods utilizing cellulases, glycosidases, amylases, peptidases, and lipases are also being explored (Martínez et al., 2020). The overall goal is to intensify the extractability of specific intracellular compounds while simultaneously reducing the need for solvents, time, and energy (Carpentieri et al., 2021b).
In this frame, pulsed electric fields (PEF) technology emerges as a promising, gentle, and efficient method for cell disintegration (Arshad et al., 2020; Carpentieri et al., 2021b). PEF serves two primary purposes: firstly, it effectively deactivates microbial cells to preserve liquid foods. Secondly, it enhances the permeability of eukaryotic cells, thereby significantly improving mass transfer processes in a wide range of food applications such as extraction, drying, and freezing (Raso et al., 2016). When integrated into the process to boost mass transfer efficiency during subsequent solid-liquid extraction (SLE), PEF treatment typically involves subjecting plant tissue to repetitive short-duration pulses (μs - ms) of moderate electric field strength (0.5–10 kV/cm) and relatively low specific energy input (1–20 kJ/kg). This treatment leads to the electroporation of cell membranes, which, in turn, facilitates the entry of solvents into the cells and promotes the enhanced transfer of dissolved compounds (Raso et al., 2016; Carpentieri et al., 2021b). This technique has shown promise in intensifying the recovery of natural pigments and bioactive compounds from various food processing by-products such as blueberry press cake, cocoa bean shell, coffee silverskin, grape pomace, potato peels, apricot kernel, and sweet and sour cherry pomace (Bobinaitė et al., 2017; Pataro et al., 2017a; Pataro et al., 2017b; Barbosa-Pereira et al., 2018; Frontuto et al., 2019; Carpentieri et al., 2022; Makrygiannis et al., 2023), while reducing energy costs, solvent consumption, extraction temperature, and diffusion time (Frontuto et al., 2019; Martín-García et al., 2020; Carpentieri et al., 2021a; Carpentieri et al., 2022).
Despite these advantages, there is limited research on using PEF technology to enhance the extraction efficiency of phenolic compounds from sweet cherry by-products, particularly cherry press cake. Indeed, only in the studies conducted by Bobinaite et al. (2017) and Pataro et al. (2017b) it has been shown that subjecting fresh cherry fruit tissues to PEF treatment resulted in the formation of pores in cell membranes. This phenomenon not only boosted the juice’s extraction yield and antioxidant properties when obtained through pressing, but also simplified the recovery of bioactive compounds, such as phenolics and anthocyanins, from the remaining cherry press cake using solvent-based extraction methods. Furthermore, it is crucial to underline that, even though PEF technology is scalable and readily integrable into established industrial processing facilities, it may necessitate adjustments to conventional processing parameters, such as solvent extraction conditions, to maximize its beneficial effects on extraction yield and purification. However, few studies have systematically addressed the optimization of these variables for the extraction of bioactive compounds from red fruit residues assisted by emerging technologies (Caldas et al., 2018; Carpentieri et al., 2023) but specific optimization for cherry press cake has not been explored.
The objective of this study is to investigate the potential of PEF technology to intensify the extractability of intracellular valuable compounds, such as total phenolic compounds, flavonoids, and anthocyanins from cherry press cake left after juice production, and to optimize parameters of conventional solid-liquid extraction (SLE) process. In particular, the response surface methodology (RSM) was employed to fine-tune the SLE process for extracting the desired bioactive compounds from cherry press cake. This involved a comprehensive exploration of variables like extraction temperature, ethanol concentration, solid-liquid ratio, and diffusion time, both within conventional extraction and the PEF-assisted extraction approach. Furthermore, the effect of the optimized SLE and PEF-assisted extraction processes on the phenolic profile of the extracts was evaluated using HPLC-DAD analyses.
2 Materials and methods
2.1 Raw materials and chemicals
Fresh sweet cherries of the “Ferrovia” variety at their peak ripeness, were obtained from a local producer during the 2022 cherry season. The samples were promptly transported to the laboratory and stored under refrigerated conditions (T = 4 °C) until further use. To prepare the press cake used for PEF-assisted extraction experiments, cherry fruits were cut in four-halves with a knife, pitted, and then subjected to pressing at a constant pressure of 520 kPa for 8 min using a laboratory-scale homemade press, as previously detailed by Pataro et al. (2017b). Subsequent to the juice extraction and press cake production, PEF-assisted extraction experiments were conducted. The experimental procedure, encompassing pressing, PEF pre-treatment, and solvent extraction experiments, is outlined schematically in Figure 1.
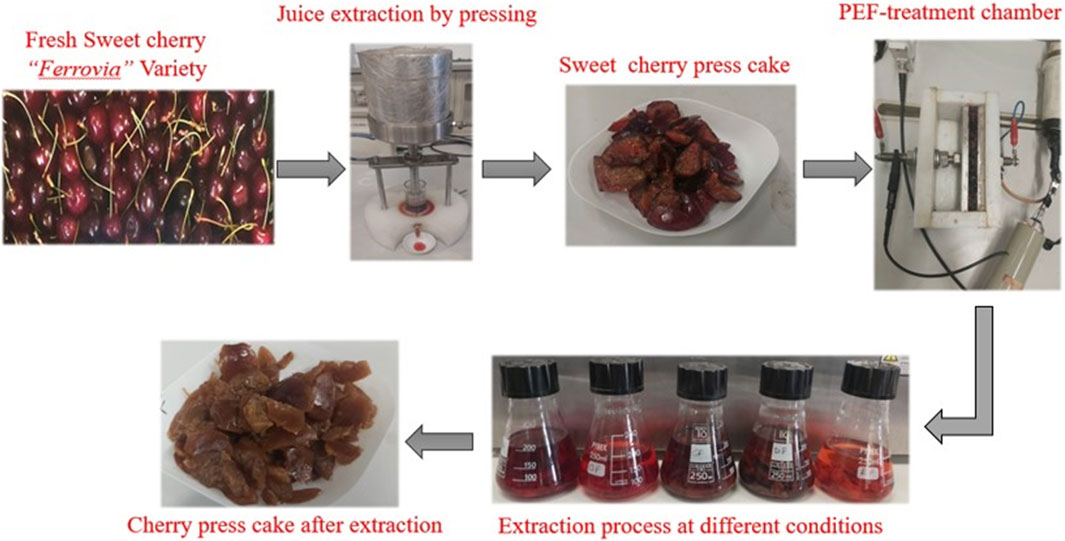
FIGURE 1. Schematic representation of the experimental procedure including pressing, PEF pre-treatment, and solvent extraction steps.
For the analyses, ethanol, reagents, and standards were purchased from Sigma Aldrich (Steinheim, Germany).
2.2 PEF system
PEF pre-treatments of cherry press cake before the solvent extraction process were conducted using a laboratory-scale batch system, which has been previously described elsewhere (Donsì et al., 2010). Briefly, the system consisted of a high voltage pulsed power generator (Modulator PG, ScandiNova, Uppsala, Sweden) capable of delivering monopolar square wave pulses with varying pulse widths (3–25 μs) and frequencies (1–450 Hz) through the plant tissue placed in a batch treatment chamber. This chamber comprised two plane parallel stainless steel electrodes separated by a Teflon spacer. The distance (gap) between the two electrodes was 2 cm, with an area of 75 cm2. To monitor the voltage and current signals at the treatment chamber, a high voltage probe (Tektronix, P6015A, Wilsonville, OR, United States) and a Rogowsky coil (2–0.1, Stangenes, Inc., United States) connected to a 300 MHz oscilloscope (Tektronix, TDS 3034B, Wilsonville, OR, United States) were employed. The maximum electric field intensity (E, in kV/cm) and the total specific energy input (WT, in kJ/kg of plant tissues) were evaluated following the method reported by Carpentieri et al. (2022).
2.3 PEF-assisted extraction tests
As depicted in Figure 1, immediately following the pressing procedure, approximately 80 g of sweet cherry press cake was introduced into the treatment chamber. This press cake was then subjected to PEF pre-treatment under well-established optimal conditions (Eopt = 3 kV/cm, WT,opt = 10 kJ/kg), as previously defined by Pataro et al. (2017b). After the electro-permeabilization treatment, the samples were promptly transferred into 200 mL Pyrex flasks where an ethanol-water mixture was added. The flasks were then placed in an orbital incubator S150 (PBI International Milan, Italy) with constant shaking at 160 rpm, where the SLE process was conducted under different temperatures, ethanol concentrations, solid-liquid ratios, and diffusion times, as described in the subsequent experimental design section.
The untreated (control) cherry press cake underwent conventional SLE without the application of PEF pre-treatment but using the same experimental design and extraction conditions.
Upon completion of the diffusion step, the extracts from both untreated and PEF-treated samples were centrifuged at 15,600xg (5417 R Centrifuge, Eppendorf, Hamburg, Germany) for 10 min at 5 °C to separate the supernatants. The final extracts were then stored at 4 °C until further analysis.
2.4 Experimental design
Response Surface Methodology (RSM) was employed to establish the relationship between the response variables and independent factors, as well as to identify optimal conditions for the SLE process that could yield the highest extraction of total phenolic content (TPC), flavonoid content (FC), total anthocyanin content (TAC), and antioxidant activity (FRAP) from both untreated (control) and PEF-treated sweet cherry press cake extracts.
For this purpose, a four-factor face-centered central composite design (FC-CCD) was chosen, featuring five center points. The study investigated the impact of extraction temperature (X1, 20°C–50 °C), ethanol concentration (X2, 0%–50%, v/v), solid-liquid ratio (S/L) (X3, 0.05–0.2 g/mL), and extraction time (X4, 30–360 min) on the response variables: total phenolic content (Y1), flavonoid content (Y2), total anthocyanins content (Y3), and antioxidant activity (Y4) of the extracts from both untreated and PEF-treated samples. In total, the experimental design encompassed 29 distinct runs, as detailed in Tables 1, 2.
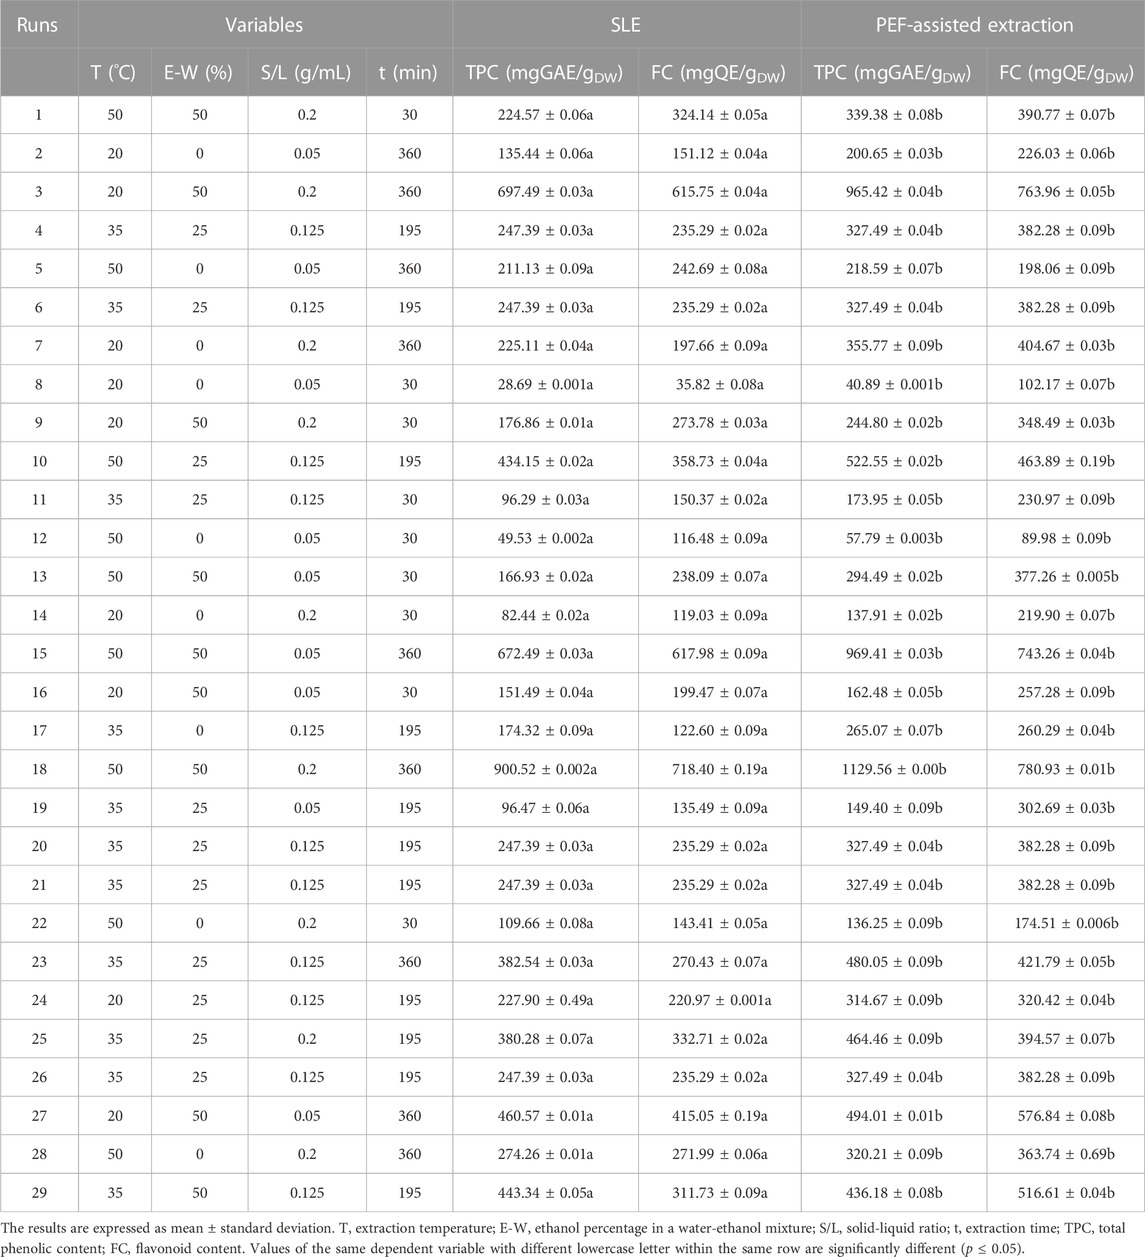
TABLE 1. Actual values of the four independent variables investigated and responses of the dependent variables (TPC and FC) in cherry press cake extracts from either conventional SLE or PEF (3 kV/cm, 10 kJ/kg) -assisted extraction process.
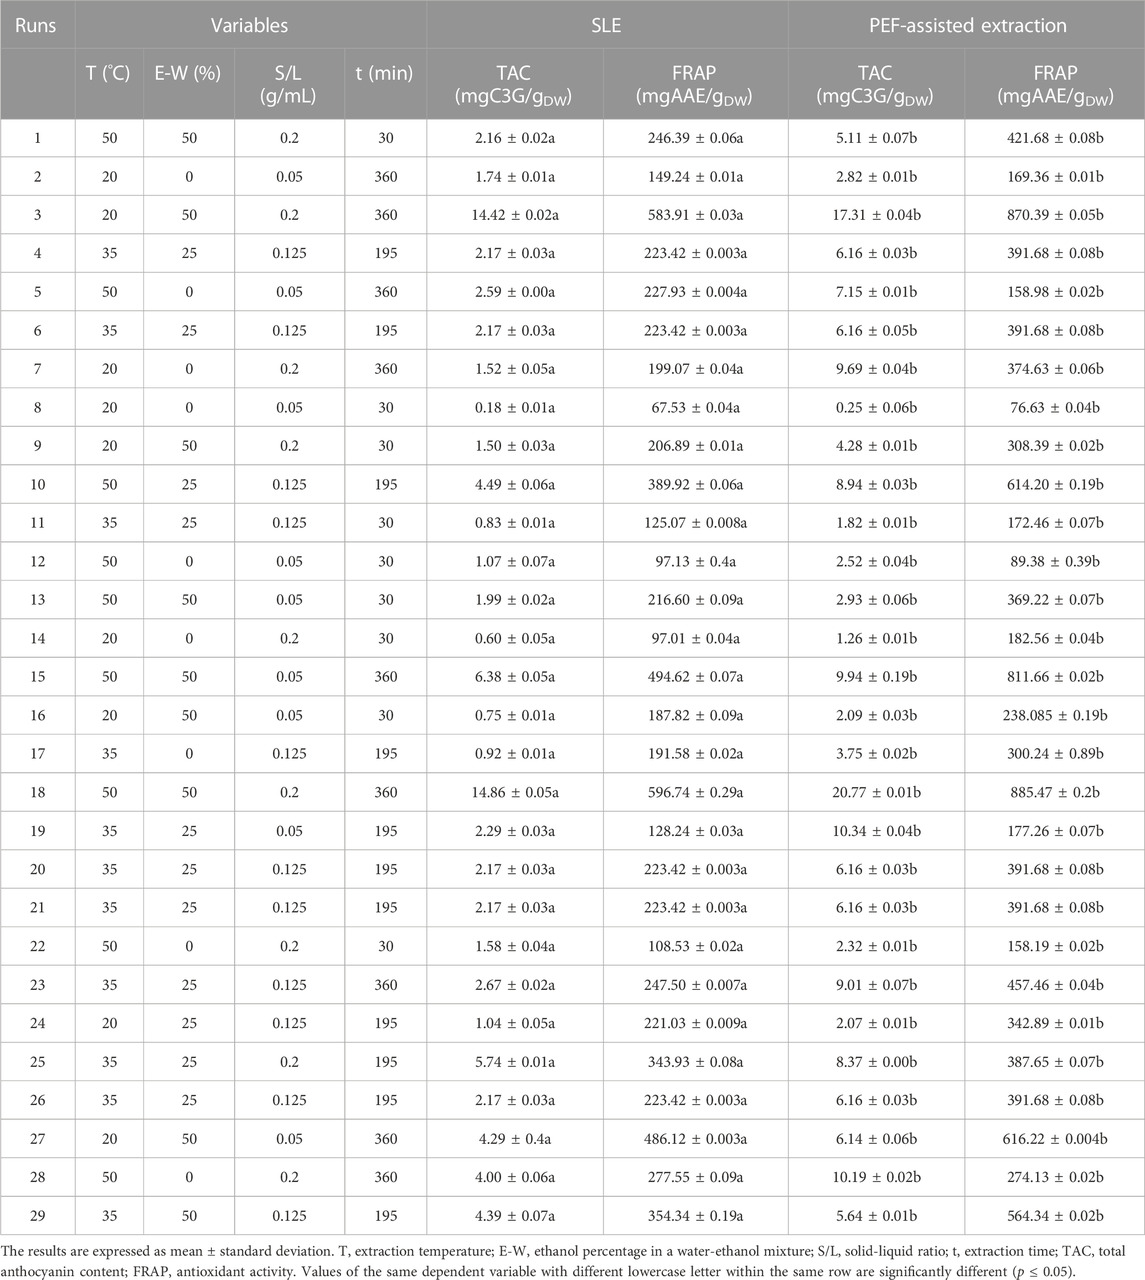
TABLE 2. Actual values of the four independent variables investigated and responses of the dependent variables (TAC and FRAP values) in cherry press cake extracts from either conventional SLE or PEF (3 kV/cm, 10 kJ/kg) -assisted extraction process.
To predict these response variables based on the studied independent factors, a second-order polynomial model, represented by Eq. 1, was employed.
where Yk is the predicted response variable; Xi and Xj are the independent variables; β0, βi, βii, and βij are the intercept, and regression coefficients of the linear, quadratic, and interaction terms of the model, respectively.
2.5 Chemical characterization of the sweet cherry press cake extracts
2.5.1 Determination of total phenolic content (TPC)
The TPC of the obtained extracts was determined using the Folin–Ciocalteau assay following the methodology reported by Carpentieri et al. (2023). The absorbance of the reacting mixtures containing the diluted samples (dilution factor of 4) was measured at 765 nm using a UV/Vis spectrophotometer (V-650, Jasco Inc. Easton, MD, United States). Gallic acid dissolved in ethanol/water mixtures (ranging from 0% to 50%, v/v) was used as the standard for the calibration curve in a concentration range of 10–100 mg/L. Results were expressed in mg of gallic acid equivalent per g of dry matter of sweet cherry press cake (mg GAE/gDW).
2.5.2 Determination of flavonoid content (FC)
The determination of FC in extracts obtained from both untreated and PEF-treated samples was performed using the aluminum-chloride colorimetric assay, a method previously outlined by Carpentieri et al. (2023). To prepare standard solutions of quercetin within the concentration range of 20–100 μg/mL, ethanol/water mixtures with varying compositions (ranging from 0% to 50%, v/v) were employed. Subsequently, the absorbance of the appropriately diluted samples (with a dilution factor of 4) was measured at 510 nm against the reagent blank using the V-650 spectrophotometer. The quantified FC values were expressed as mg of quercetin equivalent per g of dry matter of the sweet cherry press cake (mg QE/gDW).
2.5.3 Determination of total anthocyanin content (TAC)
For the determination of TAC of the obtained extracts, the pH differential method, outlined by Carpentieri et al. (2023), was employed. Briefly, each extract from untreated and PEF-treated samples was used to create two distinct mixtures. In the first mixture, a sample was diluted by a factor of 10 using a pH 1.0 buffer (0.19% w/v potassium chloride in water). For the second mixture, the same dilution factor was applied, but this time with a pH 4.5 buffer (5.44% w/v sodium acetate in water). The absorbance of these resulting solutions was then measured at wavelengths of 520 nm and 700 nm using the V-650 spectrophotometer. The concentration of the anthocyanin pigments, expressed as mg of C3G equivalent (cyanidin-3-O-glucoside) per g of dry matter of sweet cherry press cake (mg C3G/gDW) was determined by using Eq. 2:
where:
MW = molecular weights of cyanidin-3-O-glucoside; DF = dilution factor; ε = molar extinction coefficient; DW = dry weight of sweet cherry press cake; 103 = conversion factor from g to mg; L/S = liquid-to-solid ratio.
2.5.4 Determination of ferric reducing antioxidant power (FRAP)
The FRAP assay of cherry press cake extracts was performed following the methodology outlined by Carpentieri et al. (2023). The change in absorbance resulting from the reduction of the ferric-tripyridyltriazine (Fe III-TPTZ) complex by the antioxidants present in the diluted extracts (with a dilution factor of 10) was continuously measured at a wavelength of 593 nm using the V-650 spectrophotometer. Ascorbic acid dissolved in ethanol/water mixtures (0%–50%, v/v) was used as the standard for the calibration curves in a concentration range comprised between 0 and 2 mmol/L. The antioxidant capacity was expressed as mg of ascorbic acid equivalent per g of dry matter of the sweet cherry press cake (mg AAE/gDW).
2.5.5 HPLC-DAD analyses of the extracts
Following the methodology outlined by Magri et al. (2023), the phenolic compounds present in extracts from both untreated and PEF-treated samples were separated using a Agilent HP 1100 modular chromatographer (Agilent Technologies, Paolo Alto, CA, United Staes). This setup was equipped with a Jupiter C18 reverse-phase column measuring 250 × 2.1 mm inner diameter and a particle diameter of 4 mm (Phenomenex, Torrance, CA, United States). The column was thermostatically maintained at 37 °C using an oven. Separations were performed at a constant flow rate of 0.2 mL/min, employing a solvent B gradient (acetonitrile/0.1% trifluoroacetic acid) as follows: 0–4 min: 0% B; 4–14 min: 0%–14% B; 14–30 min: 14%–28% B; 30–34 min: 28% B; 34–42 min: 28%–60% B; 42–45 min: 60%–80% B; 45–50 min: 80%–100% B. Solvent A consisted of 0.1% trifluoroacetic acid in HPLC-grade water. Each analysis involved the injection of 10 mL of the extract. High-performance liquid chromatography (HPLC) separations were monitored by capturing UV-visible spectra every 2 s within the 190–650 nm range using a diode array detector (DAD). The wavelengths λ = 520, 360, 320, and 280 nm were recorded. The acquired data were processed using ChemStation software version A.10 (Agilent Technologies, CA, United States). Peak identification was established by comparing retention times with those of pure standards. For the quantification of phenolic compounds, calibration curves were generated from standard solutions (with R2 > 0.99 in all cases). These standards were prepared at six different concentrations ranging from 5 to 250 mg/kg in methanol, and subsequently ten-fold diluted with 0.1% trifluoroacetic acid before injection. The resulting outcomes were expressed as mg of the target compound per g of fresh sweet cherry press cake.
2.5.6 Statistical analysis
All experiments and analyses were performed in triplicate, and the outcomes were presented as means ± standard deviations. The model adequacies were checked in terms of the values of the determination coefficient (𝑅2), the Root Mean Square Error (RMSE) values (Jha and Sit, 2021). To ascertain statistically significant differences (p < 0.05), one-way analysis of variance (ANOVA) and Tukey’s test were executed employing the SPSS 20 statistical package (IBM, Chicago, United States). The FC-CCD was implemented alongside its corresponding data analysis using Design Expert Version 12 software (Minneapolis, MN). To confirm the validity of the models, verification of optimized conditions and predicted values was performed in triplicate. Furthermore, the strength of the relationship between response variables was assessed by calculating the Pearson correlation coefficient (r).
3 Results and discussion
3.1 Effect of PEF-assisted extraction on the recovery of bioactive compounds from cherry press cake
3.1.1 Impact of SLE parameters on response variables and model fitting
In this work, the experimental design (FC-CCD) reported in Tables 1, 2, was constructed to investigate the influence of four independent factors, such as extraction temperature, ethanol concentration, solid-liquid (S/L) ratio, and diffusion time, on TPC, FC, TAC, and FRAP of sweet cherry press cake extracts, obtained from either conventional SLE or PEF-assisted extraction process.
In general, the results obtained emphasize the significant impact of four independent factors on all the response variables under investigation. Specifically, regardless of the application of PEF pre-treatment, the highest levels of response variables were achieved at the highest extraction temperature (50 °C), ethanol concentration (50%, v/v), S/L ratio (0.2 g/mL), and diffusion time (360 min) investigated. These findings align with prior research findings achieved for red grape pomace (Carpentieri et al., 2023). Furthermore, the results also show that the permeabilization effect induced upon the application of PEF pre-treatment (E = 3 kV/cm, WT = 10 kJ/kg) significantly enhanced the extractability of bioactive compounds with antioxidant properties from cherry press cake. This enhancement resulted in a 26% increase in TPC, a 9% increase in FC, a 40% increase in TAC, and a 48% increase in FRAP values compared to the control samples.
The data obtained from the FC-CCD for all the response variables (Tables 1, 2) were fitted to a second-order polynomial model (Eq. 1). The values and significance of the regression coefficients of the polynomial model, along with the associated p-values and lack of fit, as well as the determination coefficient (R2), and the Root Mean Square Error (RMSE) for each variable, are reported in Tables 3, 4.
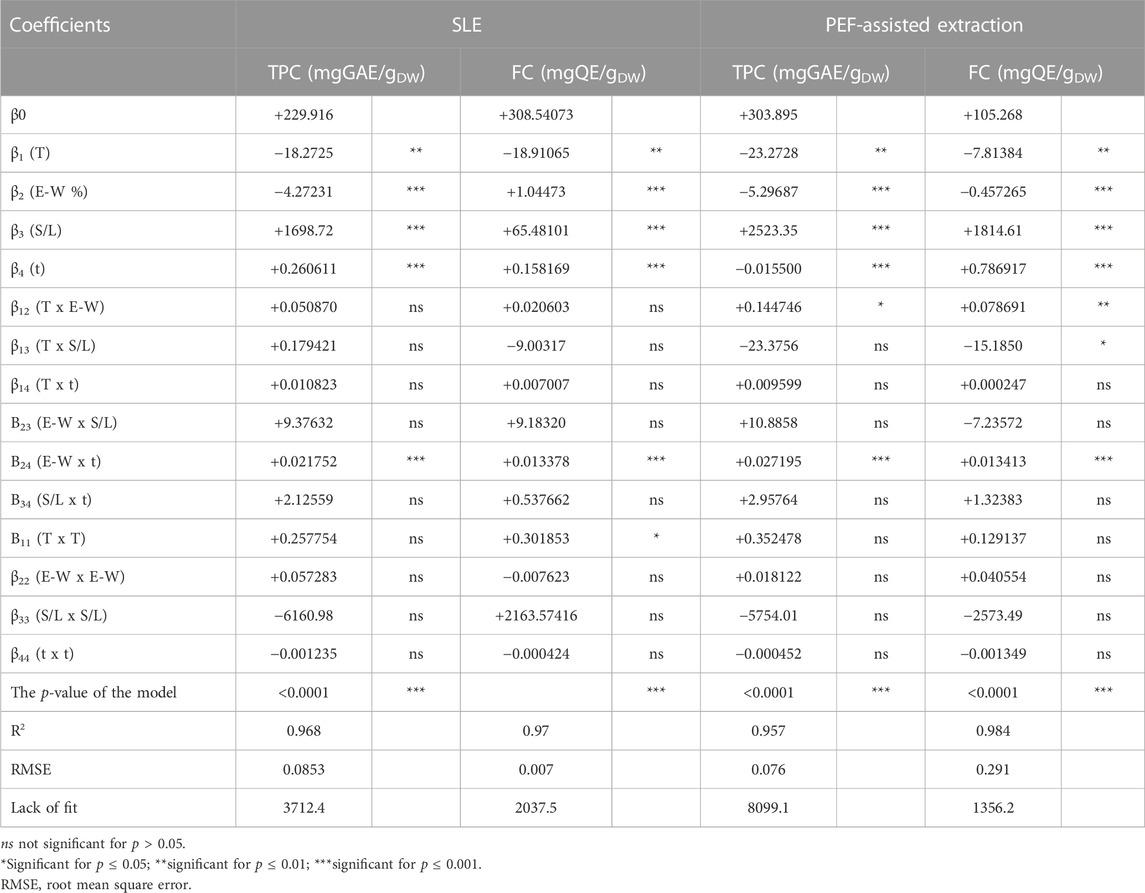
TABLE 3. Analysis of variance (ANOVA) of the quadratic model for the TPC and FC in press cake cherry extracts from conventional SLE or PEF (3 kV/cm, 10 kJ/kg) -assisted extraction process.
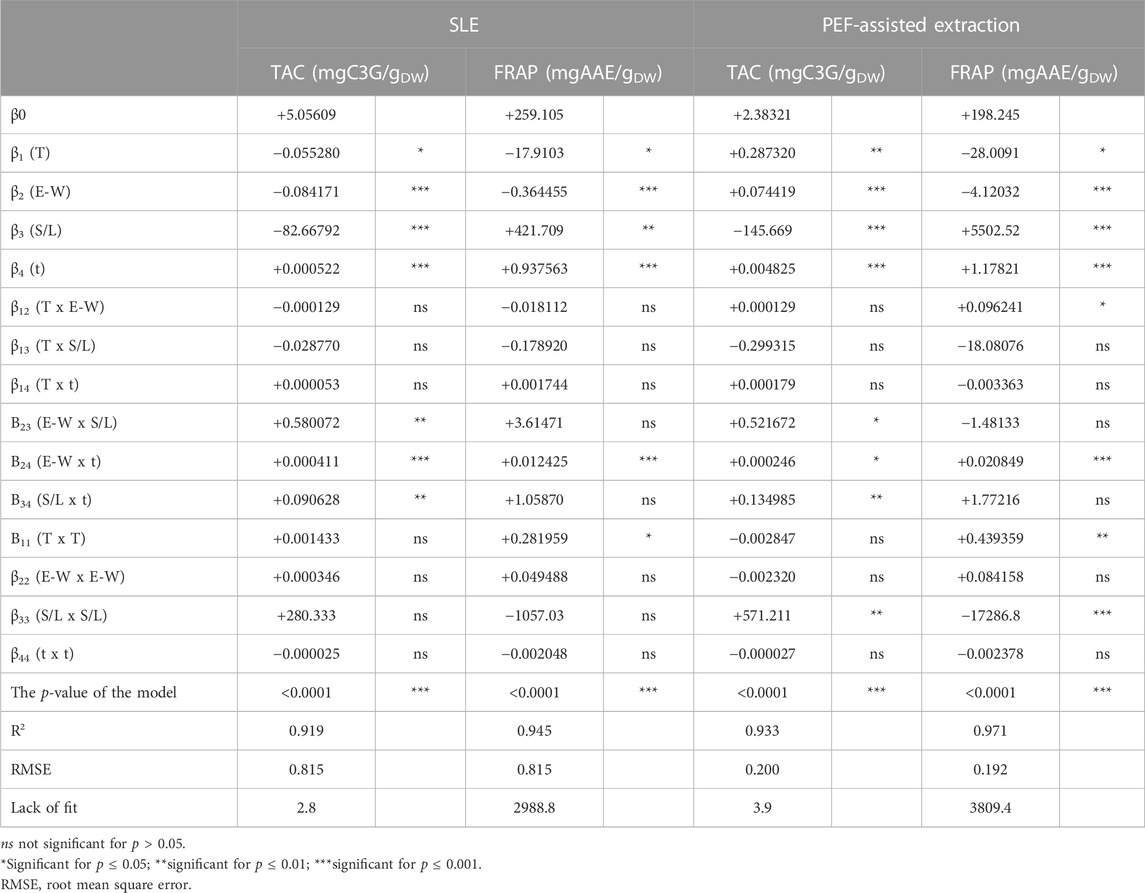
TABLE 4. Analysis of variance (ANOVA) of quadratic models for the TAC, and antioxidant activity (FRAP) in press cake cherry extracts from conventional SLE or PEF (3 kV/cm, 10 kJ/kg)-assisted extraction process.
Results show that, for the extracts of either untreated or PEF-treated samples, the significance of the different factors on the investigated response variables (TPC, FC, TAC, and FRAP) appeared similar, with only little exceptions. Specifically, all the factors under investigation exhibited statistically significant linear effects on all response variables for both untreated and PEF-treated cherry press cake extracts. However, with respect to the interactions between individual factors, regardless of the PEF pre-treatment, only the dependence between ethanol concentration and extraction time had a significant impact on all response variables. In contrast, the relationship between the S/L ratio and extraction time or temperature was found to be significant only for TAC. Regarding TPC, FC, and FRAP, the interaction between temperature and ethanol concentration in PEF-treated samples was the sole significant interaction. This implies that, in the investigated variables domain, PEF pre-treatment amplified the interaction of extraction temperature and ethanol concentration on the extractability of TPC, FC, and the resulting antioxidant activity, with respect to the untreated samples. Furthermore, it is worth noting that, compared to conventional extraction, PEF pre-treatment notably intensified the impact of extraction temperature on the S/L ratio, specifically for FC. On the other hand, a statistically significant effect was observed for quadratic terms of temperature in the case of FRAP values for both untreated and PEF-treated samples, as well as for FC values of untreated samples. Additionally, a significant quadratic effect of the S/L ratio was detected for TAC and FRAP in the case of PEF-treated samples. Notably, the negative quadratic term for the S/L ratio in FRAP values revealed a parabolic trend, suggesting the existence of an optimal response value at a specific S/L ratio. This finding aligns with earlier studies conducted by researchers such as Rajha et al. (2014), who utilized RSM to investigate the impact of various factors, including solvent-to-solid ratio ranging from 2.31 mL/g to 8.69 mL/g. In their study, they identified that the optimal values for all response variables were achieved at an intermediate value of 3 mL/g.
Overall, the investigated factors exerted a highly significant linear effect on all the response variables with respect to the interaction between single factors and quadratic effects. Moreover, regardless of the application of PEF, only the dependence of the ethanol concentration on the diffusion time was highly significant for all the responses. However, in the case of TAC, PEF pre-treatment reduced the influence of ethanol concentration on diffusion time, in comparison with the untreated samples.
The ANOVA results, as presented in Tables 3, 4, indicate that the RMSE values fell within the range of 0.07–0.815. Additionally, the determination coefficient (R2) values for the relationship between response variables and the extraction parameters ranged from 0.919 to 0.984. These findings suggest a strong correlation between the observed and predicted data. Moreover, the analysis of variance confirmed that the model employed was highly significant (p ≤ 0.0001) for all response variables and the lack of fit test was not significant (p > 0.05), thus confirming the validity of the model to describe the experimental data.
3.1.2 RSM analysis and optimization of the extraction process
The response surface plots presented in Figures 2–5 depicts the influence of the extraction temperature (20°C–50 °C), ethanol concentration (0%–50%), and diffusion time (30–360 min), at a fixed S/L ratio (0.2 g/mL), on the level of TPC, FC, TAC and FRAP values of extracts from both untreated (control) and PEF-treated cherry press cake. Similar outcomes were observed for the other investigated S/L ratios (data not shown). It can be seen that, within the whole investigated domain, the behaviour of all response variables appeared similar, which is consistent with previous findings (Carpentieri et al., 2023). Additionally, the application of PEF pre-treatment to cherry press cake substantially increased the recovery yield of bioactive compounds and antioxidant activity, as compared with control extraction. In the following section, the influence of the extraction parameters on the response variables will be discussed in detail.
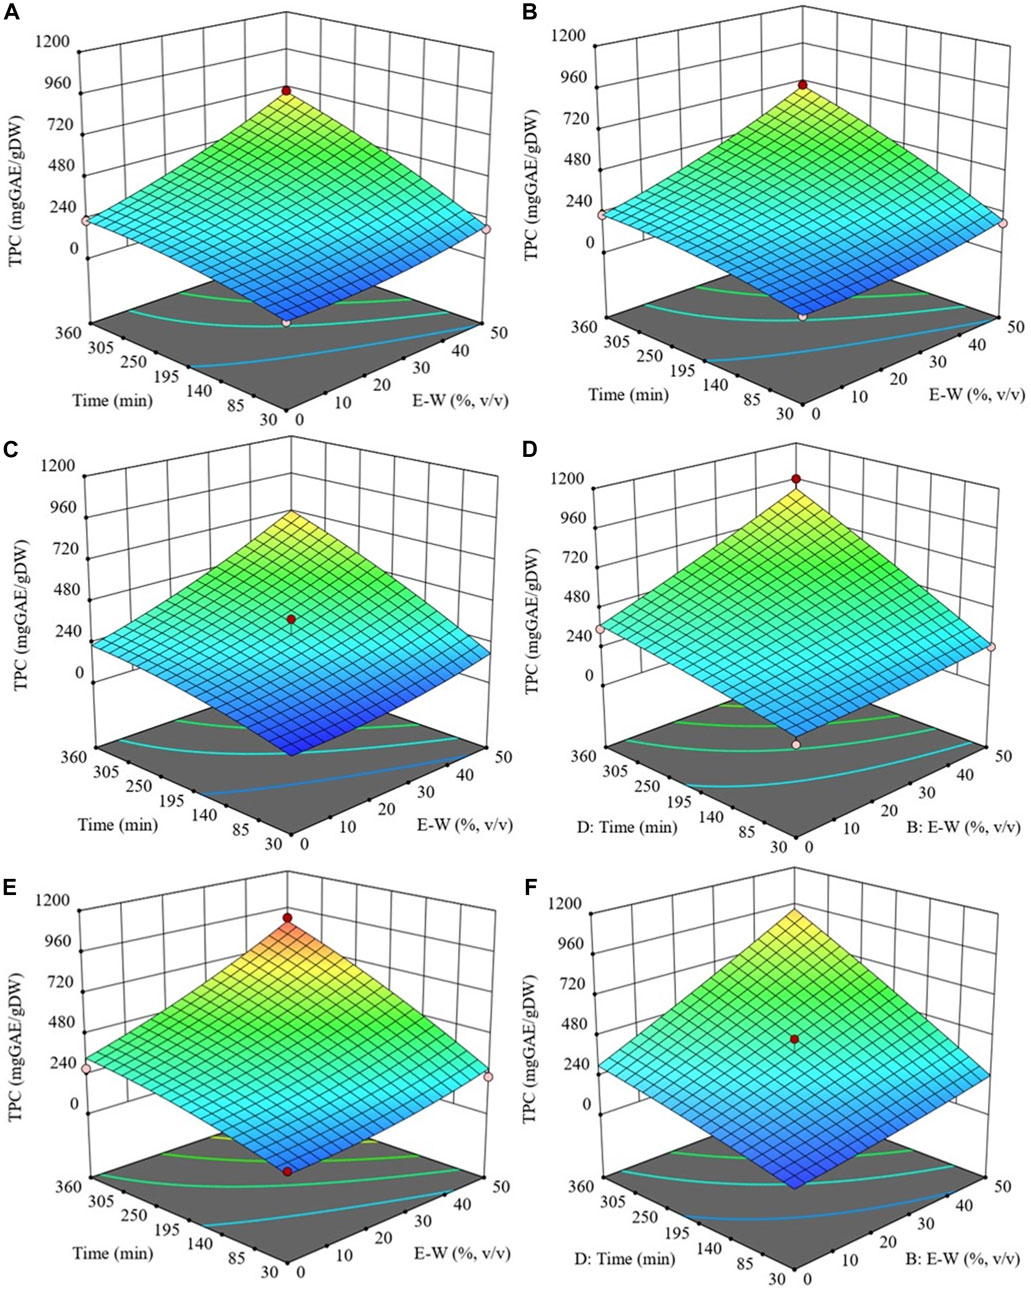
FIGURE 2. Response surfaces for TPC of extracts obtained from untreated (Control) (A, C and E) and PEF-treated (E = 3 kV/cm, WT = 10 kJ/kg) (B, D and F) cherry press cake as a function of extraction time and ethanol concentration, with the extraction temperature set at 20°C (A and B), 35 °C (C and D), 50 °C (E and F), and S/L ratio set at 0.2 g/mL.
3.1.2.1 Effect of the extraction parameters on TPC
Figure 2 presents a response surface plot illustrating the interaction between extraction temperature, ethanol concentration, and diffusion time, all while maintaining a constant S/L ratio. This plot provides insight into how these factors collectively influence the level of TPC in the extraction process. Regardless of whether PEF treatment is applied, the data reveals that both diffusion time and solvent concentration have a notable linear impact on TPC extraction yield, particularly when the processing temperature exceeds 20°C.
Specifically, increasing the extraction temperature, up to 50°C, results in a higher recovery yield of phenolic compounds. This increase is more noticeable already at temperatures above 20°C for PEF-treated samples, while it is more evident at temperatures above 35°C for untreated samples. The improved extractability of phenolic compounds at moderate temperatures can be explained by considering that higher temperature improves the mass transfer efficiency by enhancing the solubility and diffusivity of intracellular compounds in the solvent while reducing its surface tension and viscosity (Drevelegka and Goula, 2020). It is likely that the combined effect of improved diffusivity properties at moderate temperatures and the permeabilization effect induced by PEF pre-treatment intensified the extractability of phenolic compounds, as depicted in Figure 2. The positive influence of the extraction temperature on the recovery of phenolic compounds from cherry pomace, as observed in this study, is corroborated by findings previously reported by other scientists. These prior investigations encompassed a range of conventional SLE methods and innovative extraction techniques distinct from PEF treatment. Nevertheless, similar to our findings, it has been observed that extraction temperatures ranging from 47°C to 56°C maximized phenolic compound concentration in extracts derived from plant residues, including cherry pomace.
The impact of ethanol concentration on TPC can be attributed to its influence on solvent polarity, enabling the solubilization of phenolic compounds with a wide range of polarities (Do et al., 2014; Frontuto et al., 2019; Carpentieri et al., 2023). Additionally, ethanol can alter cell membrane integrity, facilitating solvent penetration into cells and mass transfer of solubilized intracellular compounds (Gurtovenko and Anwar, 2009). In this study, ethanol concentration exhibited a positive effect on TPC, with an increase observed as the ethanol percentage in water reached up to 50% (v/v). This result was expected since ethanol-water mixtures enhance extraction rates more effectively than single-component systems (Zhang et al., 2007). Furthermore, the results achieved in the present work are consistent with those found by other scientists, who demonstrated that ethanol concentrations between 50% and 59% maximize phenolic compound extractability from various food residues, such as grape pomace (Carpentieri et al., 2022; Carpentieri et al., 2023), cherry pomace (Yılmaz et al., 2015), and cherry seeds (Dulyanska et al., 2022).
Regarding diffusion time, the data in Figure 2 indicate that longer extraction times positively affect TPC, with maximum values achieved at the highest investigated extraction time of 360 min. This aligns with the findings of Carpentieri et al. (2022), Carpentieri et al. (2023), who also observed an increase in total phenolics from white and red grape pomace with longer extraction times, up to 300 min.
Finally, variations in the S/L ratio showed that decreasing it from 0.2 g/mL to 0.05 g/mL resulted in decreased extraction yields (Table 1). This is in line with the findings of other scientists, who reported that further increasing the S/L ratio led to reduced extraction yields of phenolic compounds (Kaderides et al., 2019; Drevelegka and Goula, 2020). It is likely that increased solvent quantity limits cell wall breakage and hinders the efficient leaching of phenolic compounds.
The optimal extraction parameters that maximized TPC, as determined by the model, were found to be 50°C extraction temperature, 50% ethanol concentration, 0.2 g/mL S/L ratio, and a 360 min extraction time for both untreated and PEF-treated cherry press cake. Under these conditions, TPC values were 879.5 mgGAE/gDW for the control sample and 1107.1 mgGAE/gDW for PEF-treated samples. This indicates a 26% increase in total polyphenols with PEF treatment compared to the control extraction. This increase can be attributed to electroporation induced by PEF on the cytoplasmic membrane of cells in the cherry press cake, facilitating solvent penetration and subsequent mass transfer of intracellular phenolic compounds (Luengo et al., 2014). These findings corroborate results from Pataro et al. (2017b) and Bobinaite et al. (2017), who also demonstrated the efficacy of PEF (3 kV/cm, 10 kJ/kg)-assisted extraction in increasing total phenolics in sweet and sour cherry press cake extracts, respectively. Specifically, Pataro et al. (2017b) reported a 22% increase, while Bobinaite et al. (2017) observed an 18% increase in methanolic extracts compared to control samples.
3.1.2.2 Effect of the extraction parameters on FC
The process of extracting flavonoids has been observed to be influenced by various factors, including temperature, ethanol concentration, S/L ratio, time, and the number of extraction cycles (Dulyanska et al., 2022). In this study, it has been found that the behaviour of FC closely mirrored that of TPC when assessing the impact of the examined independent variables on its recovery (Figure 3).
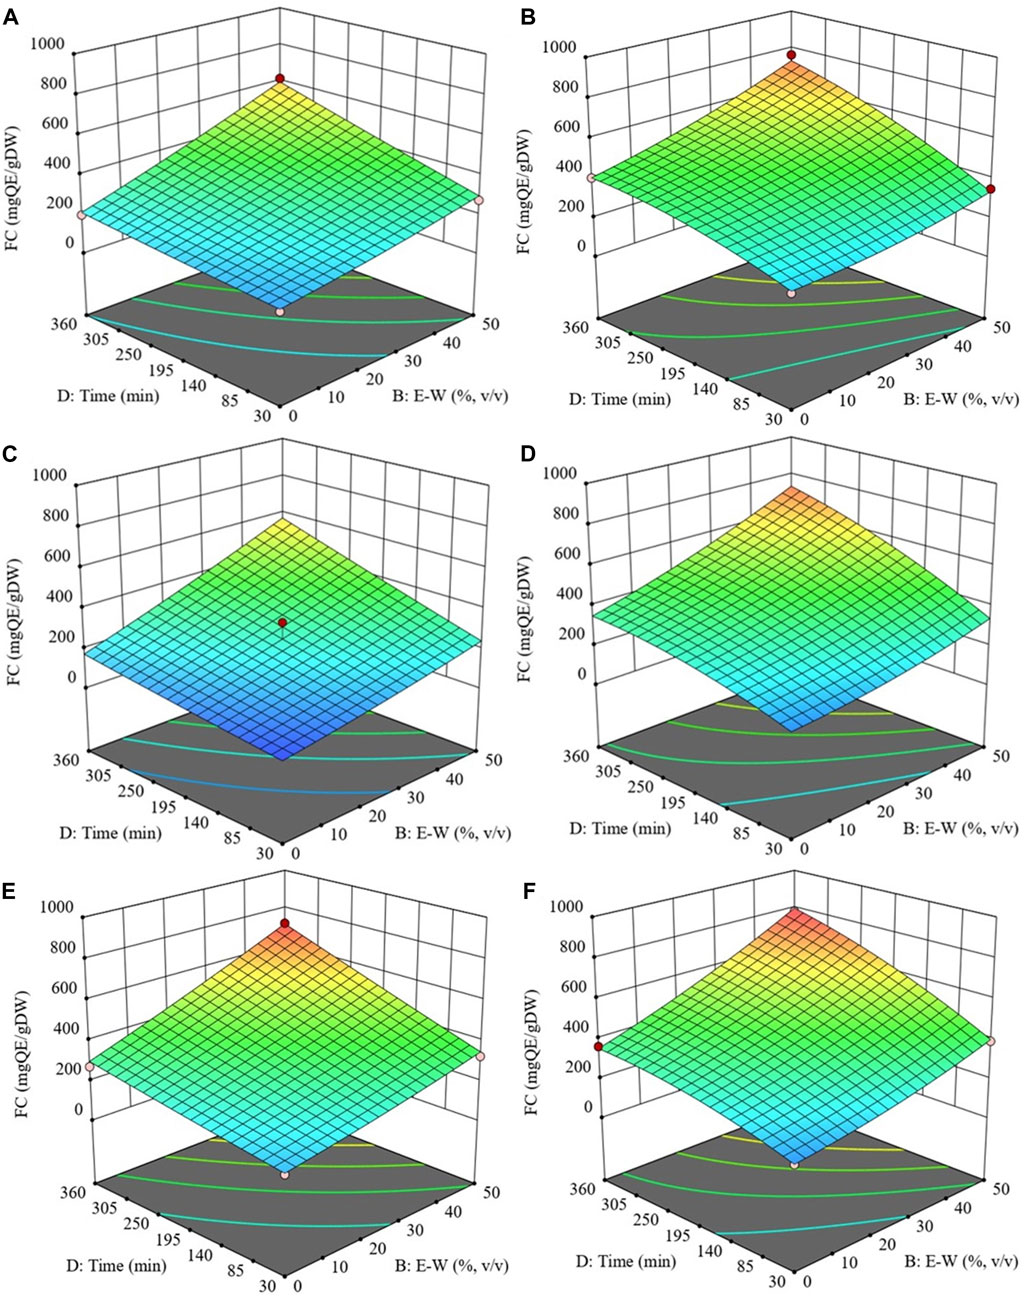
FIGURE 3. Response surfaces for FC of extracts obtained from untreated (Control) (A, C and E) and PEF-treated (E = 3 kV/cm, WT = 10 kJ/kg) (B, D and F) cherry press cake as a function of extraction time and ethanol concentration, with the extraction temperature set at 20 °C (A and B), 35 °C (C and D), 50 °C (E and F), and S/L ratio set at 0.2 g/mL.
Specifically, regardless of the application of PEF pre-treatment, results show a positive linear relationship between temperature and FC, with the maximum value reached at 50°C. Although the effect of temperature was less pronounced compared to other independent variables, it can be explained by its ability to reduce solvent viscosity and enhance molecular movement, thus aiding in the diffusion of intracellular compounds (Chaves et al., 2020). These results align with those reported by Carpentieri et al. (2023) in their investigation of temperature’s impact on flavonoid extractability from red grape pomace.
Similarly, ethanol concentration exerted a significant linear effect on flavonoid levels in both untreated and PEF-treated samples, increasing as ethanol concentration reached 50%.
Concerning extraction time, our findings indicated that, at room temperature, FC was minimally affected by diffusion time, but a slight increase was observed at higher temperatures. Notably, longer extraction times resulted in significantly higher flavonoid concentrations, especially in extracts from PEF-treated samples compared to the control, which is consistent with previous observations in grape pomace extracts (Carpentieri et al., 2023).
Interestingly, a slight parabolic trend emerged from the surface graph depicting the combined effects of extraction time and ethanol concentration on FC in extracts obtained from PEF-treated cherry press cake at 50 °C (Figure 3F). This trend suggested that at the highest temperature (50 °C), prolonged extraction times led to a slight FC decrease, with the maximum value achieved after 355 min of extraction. This findings are consistent with the results obtained by Carpentieri et al. (2022), who reported that PEF pre-treatment enhanced FC extraction yield in white grape pomace (+31%) and reduced diffusion time.
Consequently, the optimal conditions for maximizing FC (897.8 mg QE/gDW) from PEF-treated cherry press cake were identified as 50 °C, 50% (v/v) ethanol concentration, S/L of 0.2 g/mL, and 355 min of diffusion time. For the untreated sample, the highest FC value (706.2 mg QE/gDW) was achieved under the same conditions except for a slightly longer 360 min diffusion time. Overall, the application of PEF pre-treatment improved flavonoid extraction yield (+27%) while simultaneously reducing diffusion time by 5 min compared to the control sample.
3.1.2.3 Effect of the extraction parameters on TAC
As depicted in Figure 4, the examined extraction parameters had a similar effect on TAC as observed for TPC. Specifically, TAC exhibited an upward trend with increasing processing temperature, ethanol concentration, and diffusion time, ultimately reaching its peak at 50 °C, 50% (v/v), and 360 min, maintaining a constant S/L ratio of 0.2 g/mL for both untreated and PEF-treated samples.
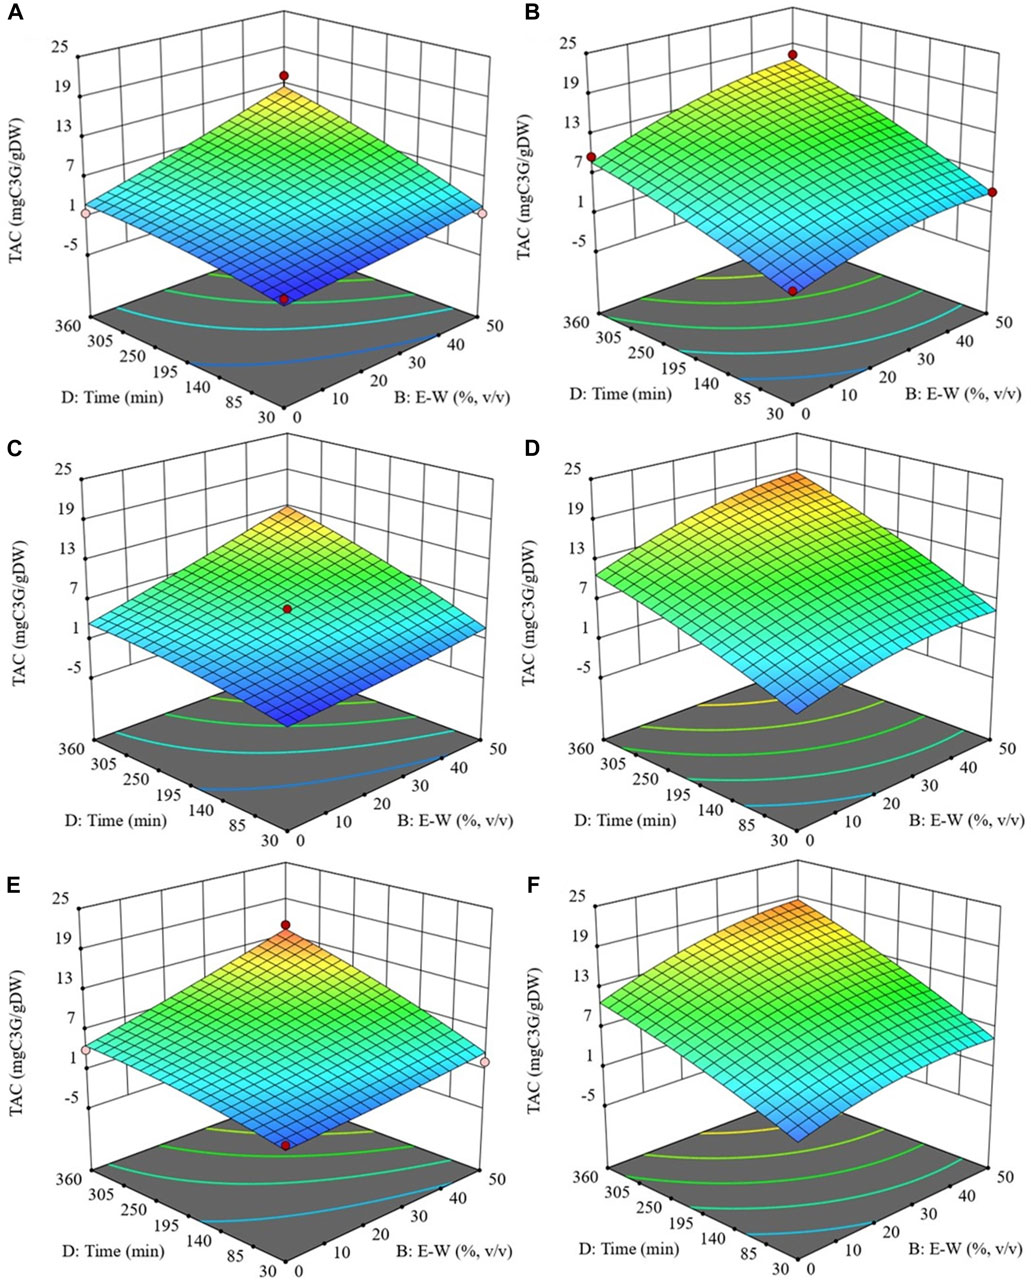
FIGURE 4. Response surfaces for Total anthocyanin content (TAC) of extracts obtained from untreated (Control) (A, C and E) and PEF-treated (E = 3 kV/cm, WT = 10 kJ/kg) (B, D and F) cherry press cake as a function of extraction time and ethanol concentration, with the extraction temperature set at 20 °C (A and B), 35 °C (C and D), 50 °C (E and F), and S/L ratio set at 0.2 g/mL.
Regardless the application of PEF pre-treatment, the extraction temperature played a pivotal role in anthocyanin recovery, particularly when elevated from 20°C to 35°C. The rise in temperature promoted the extractability of anthocyanins by influencing both the diffusion coefficient and the solubility of these intracellular compounds (Le Thu Thao et al., 2015). This aligns with the findings of other researchers (Melo et al., 2015; Carpentieri et al., 2023), who observed that peak TAC levels in extracts from various grape pomace varieties were achieved at the highest temperatures tested.
Similarly, ethanol played a crucial role in the extraction process by enhancing the solubility and diffusivity of anthocyanins and affecting cell permeability through interactions with biological membrane phospholipid bilayers. These interactions could disrupt membrane structures, enhancing the release of anthocyanins from cells and thereby improving extraction efficiency (Le Thu Thao et al., 2015). Indeed, the results demonstrated that ethanol was effective in extracting anthocyanins from sweet cherry pomace, following the same trend as TPC, until reaching its maximum at 50% ethanol concentration. These findings are consistent with those reported by Yilmaz et al. (2015), who demonstrated an initial increase in the extraction yield of total anthocyanin content (TAC) from sour cherry pomace with increasing ethanol concentration, peaking at 44.4%, after which the yield began to decline.
It is also important to note that, in contrast to the other response variables investigated, TAC was significantly influenced by the S/L ratio. Specifically, the S/L ratio and extraction time had a significant interactive effect on TAC for both control and PEF-treated samples (Table 4). Additionally, the S/L ratio exhibited a significant quadratic effect on TAC in the case of PEF-treated samples. Similar effects of the S/L ratio were observed by Yilmaz et al. (2015) and Anuar et al. (2013) in their studies on the extractability of anthocyanins from sour cherry pomace and Melastoma malabathricum fruit, respectively.
Therefore, under the optimal extraction conditions selected (50 °C, 50% v/v ethanol concentration, S/L ratio of 0.2 g/mL, 360 min), which maximized anthocyanin recovery from cherry press cake, PEF pre-treatment enabled the achievement of a maximum TAC value of 19.3 mg C3G/gDW. This value was 42% higher than the TAC value of the control sample (13.6 mg C3G/gDW). The effectiveness of PEF pre-treatment in enhancing the extractability of valuable intracellular compounds, including anthocyanins, from cherry pomace is supported by the findings of Pataro et al. (2017b) and Bobinaitė et al. (2017), who demonstrated significant increases in TAC levels (+31% and +44%, respectively) in sweet and sour cherry press cake, respectively, following PEF application compared to untreated press cake.
3.1.2.4 Effect of the extraction parameters on the antioxidant activity (FRAP) of the extracts
Figure 5 illustrates the response surfaces for the FRAP of extracts obtained from both untreated and PEF-treated cherry press cake. These surfaces show how FRAP is influenced by the extraction temperature, ethanol concentration, and treatment time while keeping the S/L ratio constant at 0.2 g/mL.
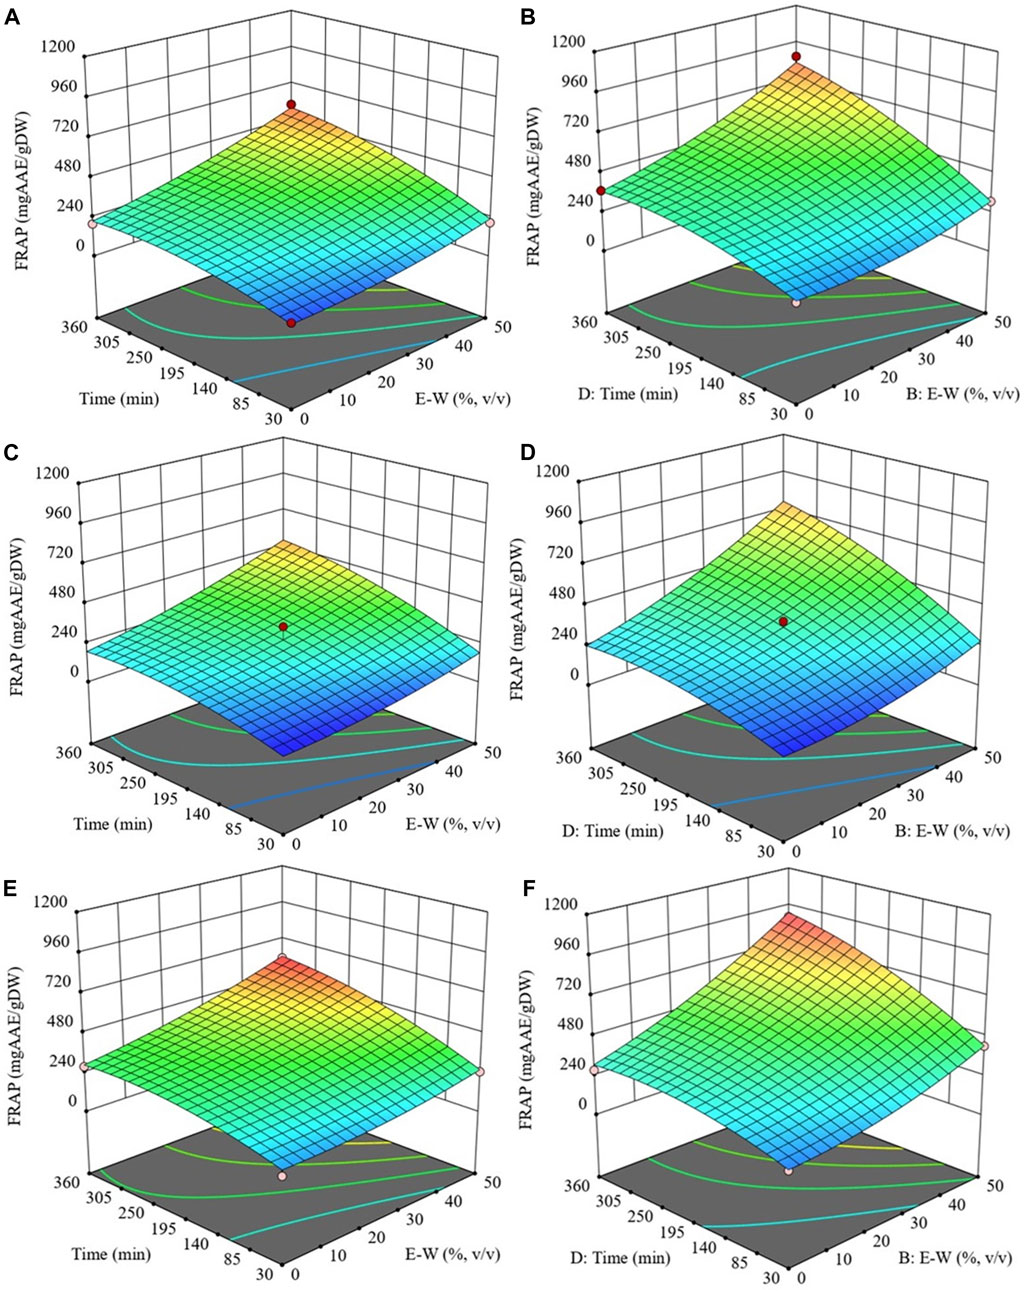
FIGURE 5. Response surfaces for antioxidant activity (FRAP) of extracts obtained from untreated (Control) (A, C and E) and PEF-treated (E = 3 kV/cm, WT = 10 kJ/kg) (B, D and F) cherry press cake as a function of extraction time and ethanol concentration, with the extraction temperature set at 20 °C (A and B), 35 °C (C and D), 50 °C (E and F), and S/L ratio set at 0.2 g/mL.
Notably, regarding the extraction temperature, this factor had a significant quadratic effect on the antioxidant activity of both untreated and PEF-treated samples (Table 4). However, the quadratic effect was more pronounced (p ≤ 0.01) for the extracts from PEF-treated cherry press cake. This suggests that to achieve the maximum antioxidant activity, an extraction temperature lower than 50 °C is required when employing PEF-assisted extraction. Therefore, the optimal temperatures for maximizing antioxidant activity were determined to be 50 °C for the control sample and 48 °C for the PEF-treated one.
Similar to TPC, FC, and TAC values, the antioxidant activity of the extracts increased with increasing ethanol concentration, particularly up to 50%. This trend was more pronounced in the case of extracts from PEF-treated cherry press cake (Figures 5B, D, F). These findings are consistent with a study by Kashyap et al. (2022), which reported that ethanol concentrations between 50%–60% resulted in higher TPC and antioxidant activity in cherry pomace extracts compared to other concentrations.
Furthermore, regarding the effect of diffusion time on FRAP values, a slight parabolic trend was evident in the surface graph (Figure 5F) for extracts from PEF-treated cherry press cake. The maximum antioxidant activity was achieved after 342 min of extraction. This suggests that FC present in the cherry press cake extract likely contributes significantly to its antioxidant activity. These results align with the findings of Carpentieri et al. (2022), who observed that PEF pre-treatment reduced the diffusion time (by 103 min) of phenolic compounds with high antioxidant activity in grape pomace.
The S/L ratio also played a role, and its negative quadratic effect on antioxidant activity became highly significant (p ≤ 0.05) for extracts from PEF-treated samples (Table 4). This indicates the existence of an optimum S/L ratio value (0.17 g/mL) that maximizes the antioxidant activity.
In conclusion, optimization analysis revealed that the optimal conditions for PEF-assisted extraction, which maximized FRAP values (857.9 mg AAE/gDW), were found to be 48 °C, 50% (v/v) ethanol concentration, an S/L ratio of 0.17 g/mL, and 342 min of extraction. Conversely, for untreated samples subjected to conventional SLE, the optimal conditions such as 50 °C, 50% (v/v) ethanol concentration, S/L ratio of 0.2 g/mL, and 360 min, resulted in the highest antioxidant activity of the extracts (596.2 mg AAE/gDW). Thus, the application of PEF pre-treatment to cherry press cake led to the production of extracts with higher antioxidant activity (+44%), along with reduced extraction temperature (by 2°C), time (by 18 min), and S/L ratio (by 0.03 g/mL) compared to the untreated samples. These outcomes are consistent with those reported by Pataro et al. (2017b) and Bobinaite et al. (2017), who found increased antioxidant power in extracts from electroporated cherry press cake compared to untreated samples (+18% and +23%, respectively).
Furthermore, these results align with previous observations, indicating a strong positive correlation between TPC, FC, TAC, and the antioxidant activity of the extracts. The Pearson correlation coefficients ranged from 0.96 to 0.97 for TPC, 0.96 to 1 for FC, and 0.79 to 0.88 for TAC, highlighting that the overall antioxidant activity of cherry press cake extracts is primarily attributed to the analyzed bioactive compounds, consistent with prior research (Corrales et al., 2008; Donsì et al., 2010).
3.1.3 Optimal PEF-assisted extraction conditions
The response surface methodology study discussed in the preceding sections has enabled to identify the optimal extraction conditions for maximizing the extractability of high-antioxidant bioactive compounds in extracts obtained through both SLE and PEF-assisted extraction processes. Table 5 provides a summary of the selected optimal extraction conditions for each response variable, as well as the concentrations of TPC, FC, TAC, and antioxidant activity in extracts from untreated and PEF-treated samples (E = 3 kV/cm, WT = 10 kJ/kg) achieved under the optimized SLE conditions predicted by the experimental model.
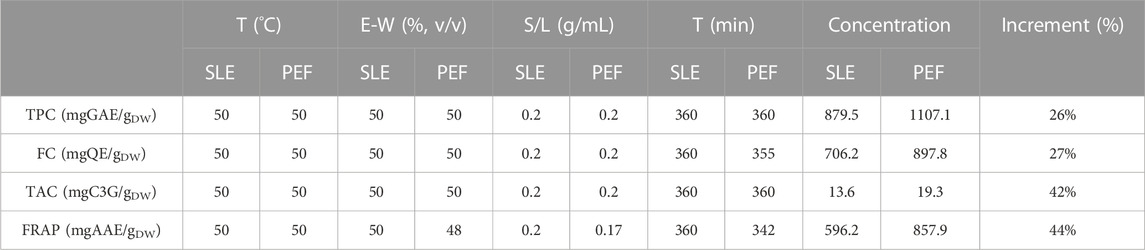
TABLE 5. Response variables for both untreated (control) and PEF-treated (E = 3 kV/cm, WT = 10 kJ/kg) cherry press cake at the optimal extraction conditions.
In line with the findings regarding phenolic compounds in extracts from PEF-treated cherry press cake (which were 26% higher than in the control), the extraction yields of flavonoids and anthocyanins following PEF-assisted extraction were significantly greater than those obtained through SLE. Specifically, flavonoids showed a 27% increase, while anthocyanins exhibited a remarkable 42% increase compared to control samples.
The potential health benefits associated with the bioactive compounds present in cherry pomace are primarily linked to their ability to shield molecules from oxidative stress, thanks to the heightened antioxidant activity observed in PEF-assisted extraction (44% higher than in the control). These findings underscore the potential use of these natural extracts as ingredients in natural cosmetics or functional foods.
Based on the results achieved so far, additional experiments and HPLC-DAD analysis were conducted to quantify the major phenolic compounds recovered in extracts from both untreated and PEF-treated (E = 3 kV/cm, WT = 10 kJ/kg) cherry press cake. The SLE processing conditions were set at their optimal values, specifically 50°C, 50% (v/v) ethanol concentration, S/L ratio of 0.2 g/mL, and a 360 min extraction time. These conditions represented the minimum requirements for enhancing the release of all identified phenolic compounds with higher antioxidant activity.
3.2 Quantification of the main phenolic compounds via HPLC-DAD analysis
The composition of extracts derived from cherry press cake, both untreated and subjected to PEF treatment, was assessed using HPLC-DAD analysis, employing the previously optimized SLE conditions (50 °C, 50% ethanol concentration, S/L ratio of 0.2 g/mL, and 360 min). Figure 6 illustrates the resulting chromatogram profiles, while Table 6 presents the concentrations of the identified phenolic compounds.
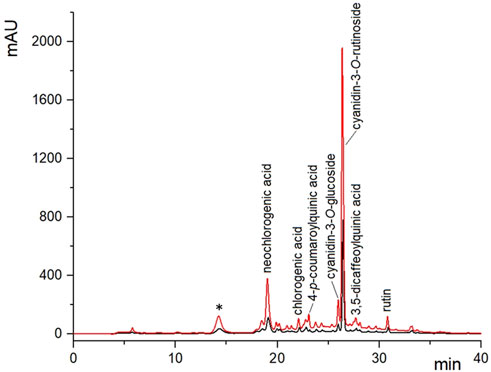
FIGURE 6. HPLC/DAD chromatograms of 50% (v/v) ethanol-water extracts obtained at 50°C and S/L ratio of 0.2 g/mL, after 360 min of extraction from untreated (black curve) and PEF-treated (E = 3 kV/cm, WT = 10 kJ/kg) (red curve) cherry press cake. * caffeic acid dimer not quantified.
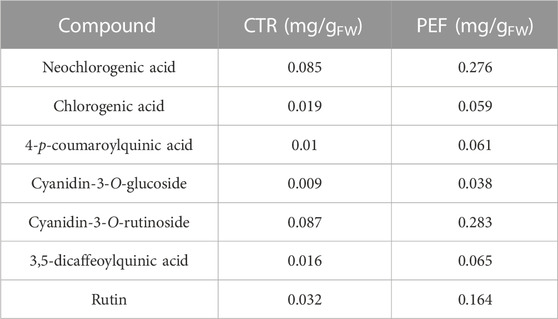
TABLE 6. Concentrations (mg/gFW) of the phenolic compounds detected (HPLC/DAD analysis) in the extracts obtained from untreated and PEF-treated cherry press cake.
The analysis revealed that, regardless of whether PEF pre-treatment was applied, the extracts predominantly contained three phenolic compounds: cyanidin-3-O-rutinoside, neochlorogenic acid, and rutin. Additionally, the extracts contained smaller amounts of chlorogenic acid, 4-p-coumaroylquinic acid, 3,5-dicaffeoylquinic acid, and cyanidin-3-O-glucoside. Notably, the phenolic profiles of the PEF-treated and untreated cherry press cake extracts were similar, indicating that the mild PEF treatment conditions used did not result in degradation or alteration of specific phenolic components (Figure 6). This finding aligns with previous research on phenolic compound extraction from various plant sources, including cherry pomace (Luengo et al., 2013; Bobinaitė et al., 2017; Pataro et al., 2017b; Frontuto et al., 2019; Carpentieri et al., 2022; Carpentieri et al., 2023).
Despite variations in cherry varieties, growing conditions, and ripeness, our results are consistent with earlier studies indicating that sweet cherries are rich in hydroxycinnamic acid derivatives, particularly chlorogenic acid derivatives, which are the predominant colorless polyphenols in sweet cherry fruit (Tomás-Barberán et al., 2013; Magri et al., 2023). Specifically, the major hydroxycinnamic acids in sweet cherries are neochlorogenic acid and 4-p-coumaroylquinic acid, which also contain quercetin derivatives such as rutin, followed by chlorogenic acid (Serradilla et al., 2015). Coherently, the HPLC-DAD analysis results shown in Table 6 indicate that the concentrations of neochlorogenic acid, chlorogenic acid, 4-p-coumaroylquinic acid, 3,5-dicaffeoylquinic acid, and rutin in ethanol-water extracts of untreated samples were 0.085, 0.019, 0.010, 0.016, and 0.032 mg/gFW, respectively. Notably, the application of PEF pre-treatment significantly enhanced the recovery yield of these compounds, leading to concentration increases of 225%, 211%, 510%, 306%, and 412%, respectively.
Regarding anthocyanins found in sweet cherries, the major ones include cyanidin-3-O-rutinoside (resulting in a red-purple color) and cyanidin-3-O-glucoside (producing an orange-red color), followed by peonidin-3-O-rutinoside (also giving an orange-red color) (Serradilla et al., 2015). Consistently, our study revealed that the most abundant anthocyanin identified in both untreated and PEF-treated samples was cyanidin-3-O-rutinoside, followed by cyanidin-3-O-glucoside. The concentrations were 0.087 and 0.009 mg/gFW for untreated samples, and 0.283 and 0.038 mg/gFW for PEF-treated samples, representing increases of 225% for cyanidin-3-O-rutinoside and 322% for cyanidin 3-O-glucoside compared to the control samples. This aligns with findings by Pataro et al. (2017b), who demonstrated that PEF pre-treatment on cherry press cake significantly enhanced the extraction yield of individual anthocyanins, with cyanidin-3-O-rutinoside being the major anthocyanin, followed by cyanidin-3-O-glucoside.
Therefore, these results confirm that the application of PEF treatment to cherry press cake prior to SLE under optimized conditions, effectively enhances the extraction yields of individual phenolic compounds compared to untreated samples.
4 Conclusion
In this study, a novel extraction process employing PEF (E = 3 kV/cm, WT = 10 kJ/kg) pre-treatment was used to valorise cherry processing by-products. The RSM coupled with FC-CCD experimental design was used to systematically optimize traditional extraction parameters, including extraction temperature, ethanol concentration, solid-liquid ratio, and diffusion time. The final goal was to maximize the extraction of bioactive compounds (TPC, FC, TAC, and FRAP values) from sweet cherry press cake.
The results revealed the significance of the independent variables, and a second-order polynomial model accurately predicted the response variables. The optimized PEF-assisted extraction conditions (50 °C, 50% v/v ethanol concentration, S/L of 0.2 g/mL, and 360 min extraction time) significantly enhanced the extraction of high-added value compounds, leading to a notable increase of TPC (+26%) and TAC (+42%) compared to control samples. Furthermore, PEF pre-treatment boosted the yield of FC extraction yield (+27%) and antioxidant power (+44%), while reducing extraction time (by 5–18 min) and solvent consumption (by 2%) compared to conventional SLE.
HPLC-DAD analyses confirmed that the phenolic composition of the control extracts remained consistent after PEF pre-treatment, yet notably displayed significantly higher concentrations of all identified individual polyphenols. Specifically, the results showcased the presence of a diverse array of phenolic compounds, with cyanidin-3-O-rutinoside emerging as the predominant anthocyanin compound. Additional identified compounds included neochlorogenic acid, chlorogenic acid, 4-p-coumaroylquinic acid, cyanidin-3-O-glucoside, 3,5-dicaffeoylquinic acid, and rutin within the cherry press cake extracts.
These promising outcomes underscore the potential of PEF technology for valorizing cherry processing residues, facilitating the extraction of high-value compounds suitable for applications as food ingredients or natural additives in cosmetic formulations. Furthermore, our study emphasizes the necessity of optimizing associated processing parameters, particularly solvent extraction conditions, when implementing this innovative extraction method. Such optimization not only maximizes the advantageous impact of PEF on the extraction yield of valuable compounds but also contributes to time and solvent savings.
Data availability statement
The raw data supporting the conclusion of this article will be made available by the authors, without undue reservation.
Author contributions
ER: Data curation, Formal Analysis, Investigation, Writing–original draft. SC: Data curation, Formal Analysis, Investigation, Writing–original draft. FS: Formal Analysis, Writing–original draft, Methodology. GF: Conceptualization, Funding acquisition, Supervision, Writing–review and editing. GP: Conceptualization, Funding acquisition, Supervision, Writing–review and editing.
Funding
The author(s) declare financial support was received for the research, authorship, and/or publication of this article. This work was supported by the research project ValICET, Valorise foods and Improve Competitiveness through Emerging Technologies applied to food by-products within the circular economy framework (Section 2 Funded PRIMA projects 2020, Agri-Food Value Chain), funded in Italy by the Ministry of University and Research (MUR) (B45F20003170005).
Conflict of interest
The authors declare that the research was conducted in the absence of any commercial or financial relationships that could be construed as a potential conflict of interest.
The author(s) declared that they were an editorial board member of Frontiers, at the time of submission. This had no impact on the peer review process and the final decision.
Publisher’s note
All claims expressed in this article are solely those of the authors and do not necessarily represent those of their affiliated organizations, or those of the publisher, the editors and the reviewers. Any product that may be evaluated in this article, or claim that may be made by its manufacturer, is not guaranteed or endorsed by the publisher.
References
Anuar, N., Mohd Adnan, A. F., Saat, N., Aziz, N., and Mat Taha, R. (2013). Optimization of extraction parameters by using response surface methodology, purification, and identification of anthocyanin pigments in Melastoma malabathricum fruit. Sci. World J. 10547, 810547. doi:10.1155/2013/810547
Arshad, R. N., Abdul-Malek, Z., Ahmad, M. H., Buntat, Z., Nawawi, Z., Pavan Kumara, C. L. G., et al. (2020). Coaxial treatment chamber for liquid food treatment through pulsed electric field. Indones. J. Electr. Eng. Comput. Sci. 19, 1169–1176. doi:10.11591/ijeecs.v19.i3.pp1169-1176
Ballistreri, G., Continella, A., Gentile, A., Amenta, M., Fabroni, S., and Rapisarda, P. (2013). Fruit quality and bioactive compounds relevant to human health of sweet cherry (Prunus avium L.) cultivars grown in Italy. Food Chem. 140, 630–638. doi:10.1016/j.foodchem.2012.11.024
Barbosa-Pereira, L., Guglielmetti, A., and Zeppa, G. (2018). Pulsed electric field assisted extraction of bioactive compounds from cocoa bean shell and coffee silverskin. Food Bioproc Tech. 11, 818–835. doi:10.1007/s11947-017-2045-6
Bastos, C., Barros, L., Dueñas, M., Calhelha, R. C., Queiroz, M. J. R. P., Santos-Buelga, C., et al. (2015). Chemical characterisation and bioactive properties of Prunus avium L.: the widely studied fruits and the unexplored stems. Food Chem. 173, 1045–1053. doi:10.1016/j.foodchem.2014.10.145
Bitwell, C., Indra, S. S., Lukec, C., and Kakoma, M. K. (2023). A review of modern and conventional extraction techniques and their applications for extracting phytochemicals from plants. Sci. Afr. 19, e01585. doi:10.1016/j.sciaf.2023.e01585
Blando, F., and Oomah, B. D. (2019). Sweet and sour cherries: origin, distribution, nutritional composition and health benefits. Trends Food Sci. Technol. 86, 517–529. doi:10.1016/j.tifs.2019.02.052
Bobinaitė, R., Pataro, G., Visockis, M., Bobinas, Č., Ferrari, G., and Viškelis, P. (2017). Potential application of pulsed electric fields to improve the recovery of bioactive compounds from sour cherries and their by-products. FOODBALT, 70–74. doi:10.22616/foodbalt.2017.029
Budak, N. H. (2017). Bioactive components of Prunus avium L. black gold (red cherry) and Prunus avium L. Stark gold (white cherry) juices, wines and vinegars. J. Food Sci. Technol. 54, 62–70. doi:10.1007/s13197-016-2434-2
Caldas, T. W., Mazza, K. E. L., Teles, A. S. C., Mattos, G. N., Brígida, A. I. S., Conte-Junior, C. A., et al. (2018). Phenolic compounds recovery from grape skin using conventional and non-conventional extraction methods. Ind. Crops Prod. 111, 86–91. doi:10.1016/j.indcrop.2017.10.012
Carpentieri, S., Ferrari, G., and Pataro, G. (2022). Optimization of pulsed electric fields-assisted extraction of phenolic compounds from white grape pomace using response surface methodology. Front. Sustain. Food Syst. 6, 854968. doi:10.3389/fsufs.2022.854968
Carpentieri, S., Ferrari, G., and Pataro, G. (2023). Pulsed electric fields-assisted extraction of valuable compounds from red grape pomace: process optimization using response surface methodology. Front. Nutr. 10, 1158019. doi:10.3389/fnut.2023.1158019
Carpentieri, S., Mazza, L., Nutrizio, M., Jambrak, A. R., Ferrari, G., and Pataro, G. (2021a). Pulsed electric fields- and ultrasound-assisted green extraction of valuable compounds from Origanum vulgare L. and Thymus serpyllum L. Int. J. Food Sci. Technol., 1–9. doi:10.1111/IJFS.15159/v2/response1
Carpentieri, S., Soltanipour, F., Ferrari, G., Pataro, G., and Donsì, F. (2021b). Emerging green techniques for the extraction of antioxidants from agri-food by-products as promising ingredients for the food industry. Antioxidants 10, 1417. doi:10.3390/antiox10091417
Chaves, J. O., de Souza, M. C., da Silva, L. C., Lachos-Perez, D., Torres-Mayanga, P. C., Machado, A. P. da F., et al. (2020). Extraction of flavonoids from natural sources using modern techniques. Front. Chem. 8, 507887. doi:10.3389/fchem.2020.507887
Chockchaisawasdee, S., Golding, J. B., Vuong, Q. V., Papoutsis, K., and Stathopoulos, C. E. (2016). Sweet cherry: composition, postharvest preservation, processing and trends for its future use. Trends Food Sci. Technol. 55, 72–83. doi:10.1016/j.tifs.2016.07.002
Corrales, M., Toepfl, S., Butz, P., Knorr, D., and Tauscher, B. (2008). Extraction of anthocyanins from grape by-products assisted by ultrasonics, high hydrostatic pressure or pulsed electric fields: a comparison. Innov Food Sci Emerg Technol 9, 85–91. doi:10.1016/j.ifset.2007.06.002
Do, Q. D., Angkawijaya, A. E., Tran-Nguyen, P. L., Huynh, L. H., Soetaredjo, F. E., Ismadji, S., et al. (2014). Effect of extraction solvent on total phenol content, total flavonoid content, and antioxidant activity of Limnophila aromatica. J. Food Drug Anal. 22, 296–302. doi:10.1016/j.jfda.2013.11.001
Domínguez-Rodríguez, G., García, M. C., Marina, M. L., and Plaza, M. (2021). Pressurized liquid extraction combined with enzymatic-assisted extraction to obtain bioactive non-extractable polyphenols from sweet cherry (Prunus avium L.) pomace. Nutrients 13, 3242. doi:10.3390/nu13093242
Donsì, F., Ferrari, G., Fruilo, M., and Pataro, G. (2010). Pulsed electric field-assisted vinification of Aglianico and Piedirosso grapes. J. Agric. Food Chem. 58, 11606–11615. doi:10.1021/jf102065v
Drevelegka, I., and Goula, A. M. (2020). Recovery of grape pomace phenolic compounds through optimized extraction and adsorption processes. Chem. Eng. Process 149, 107845. doi:10.1016/j.cep.2020.107845
Dulyanska, Y., Cruz-Lopes, L. P., Esteves, B., Ferreira, J. V., Domingos, I., Lima, M. J., et al. (2022). Extraction of phenolic compounds from cherry seeds: a preliminary study. Agronomy 12, 1227. doi:10.3390/agronomy12051227
Frontuto, D., Carullo, D., Harrison, S. M., Brunton, N. P., Ferrari, G., Lyng, J. G., et al. (2019). Optimization of pulsed electric fields-assisted extraction of polyphenols from potato peels using response surface methodology. Food Bioprocess Technol. 12, 1708–1720. doi:10.1007/s11947-019-02320-z
Galanakis, C. M. (2015). Food waste recovery: processing technologies and industrial techniques. Waltham: United States of America: Imprint of Elsevier Press.
Galanakis, C. M. (2012). Recovery of high added-value components from food wastes: conventional, emerging technologies and commercialized applications. Trends Food Sci. Technol. 26, 68–87. doi:10.1016/j.tifs.2012.03.003
Gil-Chávez, G. J., Fernando Ayala-Zavala, J., Heredia, B., Sepulveda, D., Yahia, E. M., González-Aguilar, G. A., et al. (2013). Technologies for extraction and production of bioactive compounds to be used as nutraceuticals and food ingredients: an overview. Compr. Rev. Food Sci. Food Saf. 12, 5–23. doi:10.1111/1541-4337.12005
González-Gómez, D., Lozano, M., Fernández-León, M. F., Bernalte, M. J., Ayuso, M. C., and Rodríguez, A. B. (2010). Sweet cherry phytochemicals: identification and characterization by HPLC-DAD/ESI-MS in six sweet-cherry cultivars grown in Valle del Jerte (Spain). J. Food Compost Anal. 23, 533–539. doi:10.1016/j.jfca.2009.02.008
Gurtovenko, A. A., and Anwar, J. (2009). Interaction of ethanol with biological membranes: the formation of non-bilayer structures within the membrane interior and their significance. J. Phys. Chem. B 113, 1983–1992. doi:10.1021/jp808041z
Iglesias-Carres, L., Mas-Capdevila, A., Bravo, F. I., Mulero, M., Muguerza, B., and Arola-Arnal, A. (2019). Optimization and characterization of Royal Dawn cherry (Prunus avium) phenolics extraction. Sci. Rep. 9, 17626. doi:10.1038/s41598-019-54134-w
Jha, A. K., and Sit, N. (2021). Comparison of response surface methodology (RSM) and artificial neural network (ANN) modelling for supercritical fluid extraction of phytochemicals from Terminalia chebula pulp and optimization using RSM coupled with desirability function (DF) and genetic algorithm (GA) and ANN with GA. Ind. Crops Prod. 170, 113769. doi:10.1016/j.indcrop.2021.113769
Kaderides, K., Papaoikonomou, L., Serafim, M., and Goula, A. M. (2019). Microwave-assisted extraction of phenolics from pomegranate peels: optimization, kinetics, and comparison with ultrasounds extraction. Chem. Eng. Process 137, 1–11. doi:10.1016/j.cep.2019.01.006
Kashyap, P., Riar, C. S., and Jindal, N. (2022). Effect of extraction methods and simulated in vitro gastrointestinal digestion on phenolic compound profile, bio-accessibility, and antioxidant activity of Meghalayan cherry (Prunus nepalensis) pomace extracts. Food Sci. Technol. 153, 112570. doi:10.1016/j.lwt.2021.112570
Khoddami, A., Wilkes, M. A., and Roberts, T. H. (2013). Techniques for analysis of plant phenolic compounds. Molecules 18, 2328–2375. doi:10.3390/molecules18022328
Khoo, H. E., Azlan, A., Tang, S. T., and Lim, S. M. (2017). Anthocyanidins and anthocyanins: colored pigments as food, pharmaceutical ingredients, and the potential health benefits. Food Nutr. Res. 61, 1361779. doi:10.1080/16546628.2017.1361779
Le Thu Thao, N., Thoa, D. T. K., Thang, L. P., Xi, T. T. U., Mai, D. S., and Tram, N. T. N. (2015). Effect of ethanol on the anthocyanin extraction from the purple rice of Vietnam. J. Food Nutr. Sci. 3, 45. doi:10.11648/j.jfns.s.2015030102.18
Luengo, E., Álvarez, I., and Raso, J. (2013). Improving the pressing extraction of polyphenols of orange peel by pulsed electric fields. Innov. Food Sci. Emerg Technol. 17, 79–84. doi:10.1016/j.ifset.2012.10.005
Luengo, E., Condón-Abanto, S., Álvarez, I., and Raso, J. (2014). Effect of pulsed electric field treatments on permeabilization and extraction of pigments from Chlorella vulgaris. J. Membr. Biol. 247, 1269–1277. doi:10.1007/s00232-014-9688-2
Magri, A., Malorni, L., Cozzolino, R., Adiletta, G., Siano, F., Picariello, G., et al. (2023). Agronomic, physicochemical, aromatic and sensory characterization of four sweet cherry accessions of the Campania Region. Plants 12, 610. doi:10.3390/plants12030610
Makrygiannis, I., Athanasiadis, V., Bozinou, E., Chatzimitakos, T., Makris, D. P., and Lalas, S. I. (2023). Combined effects of deep eutectic solvents and pulsed electric field improve polyphenol-rich extracts from apricot kernel biomass. Biomass 3, 66–77. doi:10.3390/biomass3010005
Martín, J., Navas, M. J., Jiménez-Moreno, A. M., and Asuero, A. G. (2017). “Anthocyanin pigments: importance, sample preparation, and extraction,” in Phenolic compounds” in phenolic compound-natural sources, importance and applications. Editors M. Soto-Hernández, M. Palma-Tenango, and R. García-Mateos (InTech). 978-953-51-2958-5.
Martínez, J. M., Delso, C., Álvarez, I., and Raso, J. (2020). Pulsed electric field-assisted extraction of valuable compounds from microorganisms. Compr. Rev. Food Sci. Food Saf. 19, 530–552. doi:10.1111/1541-4337.12512
Martín-García, B., Tylewicz, U., Verardo, V., Pasini, F., Gómez-Caravaca, A. M., Caboni, M. F., et al. (2020). Pulsed electric field (PEF) as pre-treatment to improve the phenolic compounds recovery from brewers’ spent grains. Innov. Food Sci. Emerg. Technol. 64, 102402. doi:10.1016/j.ifset.2020.102402
Martini, S., Conte, A., and Tagliazucchi, D. (2017). Phenolic compounds profile and antioxidant properties of six sweet cherry (Prunus avium) cultivars. Food Res. Int. 97, 15–26. doi:10.1016/j.foodres.2017.03.030
Melo, P. S., Massarioli, A. P., Denny, C., Dos Santos, L. F., Franchin, M., Pereira, G. E., et al. (2015). Winery by-products: extraction optimization, phenolic composition and cytotoxic evaluation to act as a new source of scavenging of reactive oxygen species. Food Chem. 181, 160–169. doi:10.1016/j.foodchem.2015.02.087
Milea, A. S., Vasile, A. M., Cîrciumaru, A., Dumitrascu, L., Barbu, V., Râpeanu, G., et al. (2019). Valorizations of sweet cherries skins phytochemicals by extraction, microencapsulation and development of value-added food products. Foods 8, 188. doi:10.3390/foods8060188
Nawirska-Olszańska, A., Kolniak-Ostek, J., Oziembłowski, M., Ticha, A., Hyšpler, R., Zadak, Z., et al. (2017). Comparison of old cherry cultivars grown in Czech Republic by chemical composition and bioactive compounds. Food Chem. 228, 136–142. doi:10.1016/j.foodchem.2017.01.154
Pataro, G., Bobinaitė, R., Bobinas, Č., Šatkauskas, S., Raudonis, R., Visockis, M., et al. (2017a). Improving the extraction of juice and anthocyanins from blueberry fruits and their by-products by application of pulsed electric fields. Food Bioproc Tech. 10, 1595–1605. doi:10.1007/s11947-017-1928-x
Pataro, G., Carullo, D., Bakar Siddique, M. A., Falcone, M., Donsì, F., and Ferrari, G. (2018). Improved extractability of carotenoids from tomato peels as side benefits of PEF treatment of tomato fruit for more energy-efficient steam-assisted peeling. J. Food Eng. 233, 65–73. doi:10.1016/j.jfoodeng.2018.03.029
Pataro, G., Carullo, D., Bobinaite, R., Donsì, G., and Ferrari, G. (2017b). Improving the extraction yield of juice and bioactive compounds from sweet cherries and their by-products by pulsed electric fields. Chem. Eng. Trans. 57, 1717–1722. doi:10.3303/CET1757287
Rajbhar, K., Dawda, H., and Mukundan, U. (2015). Polyphenols: methods of extraction. Sci. Rev. Chem. Commun. 5, 1–6. Retrieved from www.sadgurupublications.com.
Rajha, H., El Darra, N., Hobaika, Z., Boussetta, N., Vorobiev, E., Maroun, R. G., et al. (2014). Extraction of total phenolic compounds, flavonoids, anthocyanins and tannins from grape by-products by response surface methodology. Influence of solid-liquid ratio, particle size, time, temperature and solvent mixtures on the optimization process. Food Nutr. Sci. 5, 397–409. doi:10.4236/fns.2014.54048
Raso, J., Frey, W., Ferrari, G., Pataro, G., Knorr, D., Teissie, J., et al. (2016). Recommendations guidelines on the key information to be reported in studies of application of PEF technology in food and biotechnological processes. Innov. Food Sci. Emerg. Technol. 37, 312–321. doi:10.1016/j.ifset.2016.08.003
Serradilla, M. J., Hernández, A., López-Corrales, M., Ruiz-Moyano, S., de Guía Córdoba, M., and Martín, A. (2015). “Composition of the cherry (prunus avium L. And prunus cerasus L.; rosaceae),” in Nutritional composition of fruit cultivars. Editors M. S. J. Simmonds, and V. R. Preedy (Massachusetts, United States: Academic Press). 978-0-12-408117-8.
Shirsath, S. R., Sable, S. S., Gaikwad, S. G., Sonawane, S. H., Saini, D. R., and Gogate, P. R. (2017). Intensification of extraction of curcumin from Curcuma amada using ultrasound-assisted approach: effect of different operating parameters. Ultrason. Sonochem. 38, 437–445. doi:10.1016/j.ultsonch.2017.03.040
Simsek, M., Sumnu, G., and Sahin, S. (2012). Microwave assisted extraction of phenolic compounds from sour cherry pomace. Sep. Sci. Technol. 47, 1248–1254. doi:10.1080/01496395.2011.644616
Soares Mateus, A. R., Pena, A., Sendón, R., Almeida, C., Nieto, G. A., Khwaldia, K., et al. (2023). By-products of dates, cherries, plums and artichokes: a source of valuable bioactive compounds. Trends Food Sci. Technol. 131, 220–243. doi:10.1016/j.tifs.2022.12.004
Tomás-Barberán, F. A., Ruiz, D., Valero, D., Rivera, D., Obón, C., Sánchez-Roca, C., et al. (2013). in “7 health benefits from pomegranates and stone fruit, including plums, peaches, apricots and cherries” in bioactives in fruit: health benefits and functional foods. Editors M. Skinner, and D. Hunter (New Jersey, United States: John Wiley & Sons, Ltd). 9781118635551.
Tricase, C., Rana, R., Andriano, A. M., and Ingrao, C. (2017). An input flow analysis for improved environmental sustainability and management of cherry orchards: a case study in the Apulia region. J. Clean. Prod. 156, 766–774. doi:10.1016/j.jclepro.2017.04.088
United States Department of Agriculture Foreign Agricultural Service (2020). Fresh peaches and cherries: world markets and trade. Available at: https://public.govdelivery.com/accounts/USDAFAS/subscriber/new (Accessed September, 2020).
Usenik, V., Stampar, F., Petkovsek, M. M., and Kastelec, D. (2015). The effect of fruit size and fruit colour on chemical composition in “Kordia” sweet cherry (Prunus avium L). J. Food Compost. Anal. 38, 121–130. doi:10.1016/j.jfca.2014.10.007
Wani, A. A., Singh, P., Gul, K., Wani, M. H., and Langowski, H. C. (2014). Sweet cherry (Prunus avium): critical factors affecting the composition and shelf life. Food packag. Shelf Life. 1, 86–99. doi:10.1016/j.fpsl.2014.01.005
Yılmaz, F. M., Karaaslan, M., and Vardin, H. (2015). Optimization of extraction parameters on the isolation of phenolic compounds from sour cherry (Prunus cerasus L.) pomace. J. Food Sci. Technol. 52, 2851–2859. doi:10.1007/s13197-014-1345-3
Zhang, Z. S., Li, D., Wang, L. J., Ozkan, N., Chen, X. D., Mao, Z. H., et al. (2007). Optimization of ethanol-water extraction of lignans from flaxseed. Sep. Purif. Technol. 57, 17–24. doi:10.1016/j.seppur.2007.03.006
Keywords: pulsed electric fields, green extraction, sweet cherry by-products, valuable compounds, response surface methodology, HPLC-DAD
Citation: Rrucaj E, Carpentieri S, Siano F, Ferrari G and Pataro G (2023) Optimizing the solvent extraction process for high-value compounds from sweet cherry press cake treated with pulsed electric fields using response surface methodology. Front. Food. Sci. Technol. 3:1273243. doi: 10.3389/frfst.2023.1273243
Received: 05 August 2023; Accepted: 27 October 2023;
Published: 09 November 2023.
Edited by:
Laetitia Picart palmade, Université de Montpellier, FranceReviewed by:
Alifdalino Sulaiman, Putra Malaysia University, MalaysiaPedro Elez-Martinez, Universitat de Lleida, Spain
Kemal Aganovic, German Institute of Food Technologies, Germany
Copyright © 2023 Rrucaj, Carpentieri, Siano, Ferrari and Pataro. This is an open-access article distributed under the terms of the Creative Commons Attribution License (CC BY). The use, distribution or reproduction in other forums is permitted, provided the original author(s) and the copyright owner(s) are credited and that the original publication in this journal is cited, in accordance with accepted academic practice. No use, distribution or reproduction is permitted which does not comply with these terms.
*Correspondence: Gianpiero Pataro, Z3BhdGFyb0B1bmlzYS5pdA==