
94% of researchers rate our articles as excellent or good
Learn more about the work of our research integrity team to safeguard the quality of each article we publish.
Find out more
ORIGINAL RESEARCH article
Front. Food. Sci. Technol., 20 December 2023
Sec. Food Process Design and Engineering
Volume 3 - 2023 | https://doi.org/10.3389/frfst.2023.1258713
 Søren Espersen Schrøder1*
 David San Martin2
 Giuseppe Foti2Monica Gutierrez2
 Bruno Iñarra Chastagnol2
 J. Rasmus Nielsen1Erling Larsen1
Introduction: New EU regulations for increased sustainability and better utilization of side-streams are pushing the European mussel farming and processing industry to adapt to new regulations regarding their wastewater production, which leads to incentives for optimizing methods for better utilization of this side-stream resource. In this study, one such European company is faced with a choice of a filtration system out of three possible options, to invest in and achieve the option with the best balance between economic gain and environmentally sound production.
Method: For this, a specialized Analytical Hieratical Processes (AHP) tool was utilized together with a supplementary Debias Your Decisions (DYD) tool to visualize the local best choice for the company.
Results: Based on the generated user weights from the company it was apparent that the user weights were biased towards certain criteria in the AHP tool, which meant that half of the tool’s criteria had greatly diminished influence on the tool’s scores. This brought into question the objectivity of the Performance index (Pi) score results from the AHP tool when the user weights were applied, since these Pi scores deviated significantly from the expert Pi scores. The supplement tool DYD was found to be able to identify the dominant decision biases influencing the user weights in the current case, which enabled the implementation of relevant debiasing techniques to correct for the overweighted user weights from the company. With these corrections and the case company’s input data, the optimum alternative suggested for the case company is membrane filtration based on the final Pi scores for all weight sets.
Discussion: This process and final debiased results further validated the AHP tools results as objectively grounded due to their convergence with the experts’ scoring results. This study also served as further validation for the new supplement DYD tool as the current sensitivity analysis showed the tool’s robustness to be high.
This case study is based on the decision context of one European mussel farming and processing company that is faced with an investment choice between three new alternatives for the management of a highly polluted side stream that, currently, the company cannot discharge into nearby water bodies. This investment choice is important for the company because of its potential for increasing the utilization of the company’s side-stream resources, by extracting protein concentrates from its production waste cooking water. The aim of the company is to improve both their economic performance and environmental profile after new European Union (EU) regulations have made their previous methods of wastewater disposal obsolete. To assist in and validate which investment choice the company should objectively make, this study utilizes a new methodology, Debias Your Decision (DYD), to achieve this. The current study accordingly also serves as a validation of this new methodology. In the following, we outline the overall decision context that the company is faced with, for which this method is applied.
Why are the EU’s regulations on production waste increasing and how does this influence the European mussel aquaculture and processing industry?
In the European Union, water and wastewater are regulated by 2000/60/EC and 91/271/CEE directives. Since its approval, pollution has increased and technology has improved. To better adapt these rules to the objectives of the Union’s climate policy, the European Commission, in 2022, proposed a new European Directive, which is now being studied by the Environment Commission (European Commission, 2022). In general, the new directive establishes stricter rules and obligations. In addition, one of the main objectives of the new directive is to convert wastewater treatment into a resource center for water, energy, and the recovery of by-products. Securing affordable and sustainable food sources for the rising world population is one of the current challenges that most societies are facing worldwide (Schubel and Thompson, 2019; Costello et al., 2020; Van der Meer, 2020; Farmery et al., 2021; Van der Meer et al., 2023).
In general, the food processing sector is defined by the high efficiency of its exploitation of its raw resources and side streams. For instance, the processing of beef cattle has a near to 100% utilization rate (businessinsider, 2017).
Conversely, in the food processing sector, involved in the utilization of aquatic living resources, this efficiency is significantly lower. Here, the utilization of resources is impeded by inefficiency. In some cases, up to 60%–70% of the resources end up as production waste that are discarded or considered low-value products (FAO, 2020; Coppola et al., 2021; Siddiqui et al., 2023). Such waste and low-value products constitute the so-called side streams of seafood production. This often leaves the industry and society with a poorly utilized resource biomass, which, in many cases, could be used for higher-value purposes, such as securing affordable protein sources for food and feed applications or developing bioactive peptides for nutraceutical and pharmaceutical production (Shahidi et al., 2019; Coppola et al., 2021; Schrøder et al., 2023; Siddiqui et al., 2023).
To meet this global and societal challenge and the goals set by the EU “Green Deal” and “Blue Bioeconomy” (EUR-Lex, 2019), the rules and regulations on the disposal of production waste set by the EU have been expanded and made more restrictive in general (EUR-Lex, 2021). The aim of these new EU regulations is, in part, to achieve the UN SDGs of “Zero hunger (SDG 2),” “Climate action (SDG 13),” and “life under water (SDG 14),” while, at the same time, providing the best conditions to support the seafood industry in achieving “decent work and economic growth (SDG 8)” (European Commission, 2022).
These new EU regulations are meant to challenge the “business as usual” context (European Commission, 2022), and European seafood companies, as a result, are facing increasing disruption to their existing waste management approaches in relation to their side-stream resources.
One such disruption is occurring in the European mussel farming industry. In this industry, the new EU regulations have posed a challenge to the economic sustainability of the involved companies due to their greater focus on securing environmental sustainability in the industry. These new regulations have been introduced on top of an industry that is already struggling with decreasing profitability since 2016 due to low and stagnant prices in the EU market, import of cheaper products from outside the EU, and increases in the production cost per unit produced (Avdelas et al., 2021; EUMOFA, 2022). These factors have led to a decrease in production for an industry which, in 2016, produced approximately 519,000 tons of mussels, which, in 2020, had dropped to 431,000 tons of mussels produced by European mussel farmers (EUMOFA, 2022).
A disruption caused by the new regulations can be observed with respect to the disposal of mussel shells. Mussel shells that were previously used as a liming agent in earthworks and roads are now regulated against, since the shells are being classified as a pollutant (EUR-Lex, 2008; BOE, 2022). This has limited mussel farmers’ ability to dispose of their shell waste in an economically viable way. Another disruption is seen in the management of the cooking water from primary mussel production, which, following an EU regulation in 2018 (EUR-Lex, 2021), has observed a ban on the industry practice of dumping the mussel cooking water back into the sea. This is due to the practice’s eutrophication effect, with increased nutrient loads in coastal waters.
Therefore, how does one comply with the new regulations aiming toward higher environmental sustainability, while maintaining one’s economic sustainability in an industry that is already experiencing reduced profitability (Avdelas et al., 2021; EUMOFA, 2022) is a question that remains for these companies.
In other words, “It is a tough shell to crack.”
On request by the case company of this study, the reference to the company has been labeled as “Case Company” throughout the study.
Due to the EU regulations, the case company in this study needs to filter and decanter their cooking water side-stream resource before leading it back into the sea or to the local sewage system. On many occasions, the company’s cooking water volume exceeds their capacity to filter and decanter it. On these occasions, the cooking water is transported to a local water treatment plant in the nearby town, which incurs a waste management cost of 6,700 Euros every quarter for the case company. This has been described as a significant cost by the company which they would like to reduce by exploiting this side-stream resource and potentially gaining an income from this.
The side stream originates from the main production of deshelled boiled mussels that are produced by the case company. Depending on the harvest year, the company produces approximately 1,400–1,700 tons annually for the main production of deshelled mussels. The main production approximately requires 140,100 m3 of seawater per year to process farmed mussels. The amount of cooking water left from the main production varies according to the seasonal harvest, the processing steaming rate, and filtration, but on average, 3.4% of the total waste seawater is left as a side stream. Therefore, an annual production of 1,400–1,700 tons of mussels creates an annual average of 4,840 m3 of mussel cooking water for the company.
The costs of filtering the cooking water are rather significant for the company, totaling to 60 Euros per production hour in energy cost and necessary consumables. This cost together with the waste management cost to the local water treatment plant is negatively affecting the company’s profit generation, and they are already operating on a tight and decreasing profit margin (Avdelas et al., 2021; EUMOFA, 2022).
Due to these costs and following the company philosophy of “closing the cycle,” according to their sustainability objectives, the company is interested in developing their side-stream resources themselves through self-production. The mussel cooking water is envisioned as a new business segment centered on the extraction of protein concentrates, which the company wants to sell in the form of raw extracts to pharmaceutical companies.
The major reason for mussel cooking water being the focus of the company is that it is rich in fatty acids and proteins and also glucagon, which is a valuable extract used in medical products, such as insulin, to regulate blood sugar levels (Petersen et al., 2018). For now, it is only the protein concentrates that the company is interested in, but the other two extracts are viewed as potential future revenue sources too.
On this basis, the company has framed the investment and expansion of their filtering operations through extraction focus as an overall economic gain scenario. Previous pilot projects with different extraction methods in the company, such as ozone, evaporation, and biological depuration, have been considered. These options have shown varying efficiencies and production results (personal communication, case company). Presently, this makes it unclear for the company on which option to choose to make an optimal investment for this side-stream resource. Their consideration is a fine balance between securing both economic sustainability and compliance with the new environmental regulations. Currently, three alternatives are being considered.
• Membrane nanofiltration is a physical separation method that is characterized by the ability to separate molecules of different sizes and characteristics
• Flocculation is a chemical separation method whereby small particles in suspension are caused to aggregate, creating large clusters (flocs) that are much more easily separated than the original particles
• pH shift is a separation process based on protein recovery in either acidic or alkaline conditions
To increase visibility in such an evaluation and decision process, the case company has employed the use of a Multi-Criteria Decision-Making (MCDM) tool to assist them in making the most objective choice to solve this decision scenario. A specialized AHP tool has specifically been developed for the case company (please see Supplementary Material S3) by the Spanish research institute AZTI (AZTI.es), which the case company is using to validate their decisions. The AHP tool is one of the many available MCDM tool variants, and one of its strengths in the current context is that it is a relatively low-effort-demanding decision support system for untrained users to work with (Kulakowski, 2020). In addition, the AHP methodology acknowledges some elements of cognitive psychology to explain and account for the cognitive bias, Confirmation bias, and this bias’s influence in a decision process (Deniz, 2020; Rezaei et al., 2021). However, the AHP methodology does lack an active framework for identifying and correcting for other cognitive biases beyond the Confirmation bias, which has other further reaching implications for the decision process than the Confirmation bias and may cause inconsistencies in the AHP tool’s ratings (Deniz, 2020; Melnik-Leroy and Dzemyda, 2021; Dhurkari, 2023). A major inconsistency is that such cognitive biases can cause a reduction in the objectivity of the recommended choice that the AHP tool recommends (Deniz, 2020; Schrøder et al., 2023). Due to the potential inconsistency in the tool, the case company wants to have a supplementary tool added to the AHP tool to account for any potential company-specific biases and to ensure the objectivity of the choice that the AHP tool recommends.
This study aims to evaluate the current decision context of one European mussel farming company, which seeks new utilization for their side-stream resource, mussel cooking water. In this process, one objective is to validate the specialized AHP tool’s results with an additional debiasing tool (DYD) to reduce the influence of any subjective biases that may influence the AHP tool’s results and to objectively ensure the best extraction option for the case company. This best option is defined as the option that secures the best balance between economic gain and environmentally sustainable production according to the AHP tool.
Furthermore, in addition to providing the case company with validation for their AHP results based on the debiasing method described in the study by Schrøder et al. (2023), an objective of the current study is also to further validate that method among others by applying the DYD method.
A final objective is to test and evaluate the ability of the two methods for a broader application across case studies.
• Null hypotheses: Debiasing techniques will not adjust the user results of the case company to be similar to the experts’ weights in the AHP tool
• The results of the debiasing techniques (AHP and DYD) will not change the decisions significantly; i.e., they will not adjust the case company’s user weight to be similar to the experts’ weights in the AHP tool
Initially, a subset of the debiasing methods designed for use with MCDM methods, such as the AHP methodology, were reviewed, leading to the final method selection for application in the current case study. There exists a number of bias-correcting methods in the current AHP literature that were considered as the final method for this study. In Buchanan and Corner’s (1997) method, the focus is on the impact which the Anchoring effect has on the evaluation of alternatives, probability assessments, and rank ordering of objectives and on how to reduce their influence in the MCDM methodology. In the work of Almashat et al. (2008), the method details debiasing procedures for the framing effect to prevent this effect from influencing the decision-making process, along with the formulation of the AHP problem hierarchy and the evaluation of alternatives.
Ma et al. (2017) extended the AHP method to handle cognitive limitations, such as the Sunk-cost fallacy, Affect heuristic, and first impressions, and, as such, reduced the influence of those limitations on the posed MCDM problem using a DS/AHP approach. In Qian et al.’s (2019) method, the Loss aversion bias is considered and corrected for when a decision is being made with incomplete information using a BOCR-uRTODIM solution method. Deniz’s (2020) method considers and corrects for the Loss aversion and Status quo bias through a combined AHP and Technique for Order of Preference by Similarity to Ideal Solution (TOPSIS) setting. Last, Schrøder et al. (2023) developed a new generic method, DYD, which can identify cognitive biases from interview data and, thus, enable the implementation of relevant debiasing techniques found in the general debiasing literature to correct for these in a combined AHP and TOPSIS setting.
Commonly, all, except one of the above bias-correcting methods, do not provide a framework for identifying the bias for which they provided correction. This reduces their applicability in real-world case studies, and in addition, these methods only provide a debiasing technique for one or two cognitive biases in general, further limiting their case-specific applicability. Given the emphasis that was placed on ensuring the objectivity of the AHP results using relevant debiasing techniques to correct for company-specific biases, this limits the final method selection to Schrøder et al. (2023). The reason for this is that it is the only method in scientific peer-reviewed literature that provides a unified framework for identifying and correcting for cognitive biases.
In the current case study, we will consequently follow the seven-action workflow through the application of the DYD method, as developed and described in detail in the work of Schrøder et al. (2023), to identify any possible biases that may influence the AHP tool’s results. Should any biases be identified, the appropriate debiasing techniques described in the work of Montibeller and Von Winterfeldt (2015) and other relevant literature (Buchanan and Corner, 1997; Deniz, 2020) will be utilized to debias the AHP tool’s results in that specific case study. The seven-action flow in the new DYD tool, as described in the work of Schrøder et al. (2023), comprises the following stepwise process, as shown in Table 1.
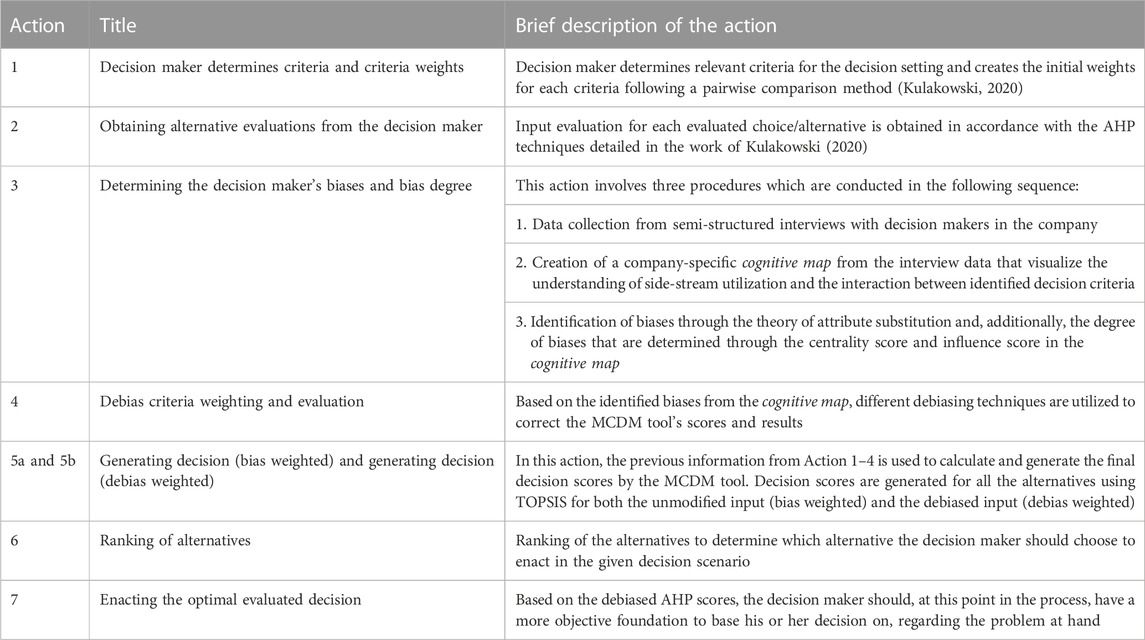
TABLE 1. Seven-action workflow of the debiasing procedure in DYD.
Each of these seven actions will be applied in detail for the case company; they are activated and presented in Results.
To evaluate the debiasing method DYD and the results for the case company, a graphical method-based sensitivity analysis of the input values from the user was conducted (Frey and Patil, 2002). In this analysis, the initial user weights from the case company, in Table 5, was changed by +20%. This was carried out for one weight at a time while keeping the other weights constant. The deviation in the Performance index (Pi) scores between the new debiased weights and the original debiased weights was then compared to test the robustness of the results. A threshold of ± 0.01 in deviation was set as an acceptable deviation level for this study. This analysis is conducted as part of Discussion.
• Interview data from key decision makers in the given seafood farming and processing company on side-stream utilization and the criteria for sustainable development are given here, preferably from the same decision makers who will also be the ones using the MCDM tool. The template of the collected interviews and the interview guidelines are detailed in the work of Schrøder et al. (2023) (please see Supplementary Material S1).
• The AHP score data were obtained using the AHP tool based on the user’s decision criteria, decision weights, and alternative evaluations that the user has generated using the tool.
• Recording device for interviews
• Microsoft excel or equivalent data compilation and analysis software
• The MCDM tool: In this study, we utilized a specialized AHP tool developed by AZTI (please see Supplementary Material S3)
Following the process described in Table 1 and Schrøder et al. (2023), Action 1 is initialized by the case company, outlining the six criteria that they would like the AHP tool to account for. These six criteria and their associated units of measurement are shown in Table 2.
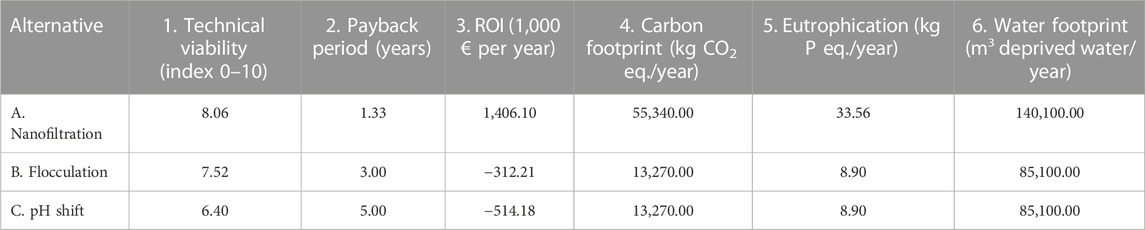
TABLE 2. Company decision makers’ valuation of each alternative that is being evaluated based on the six appointed criteria by the case company.
The company then assigned weights to each of the criterion, respectively, following the pairwise comparison approach outlined in the work of Saaty (1980) and Kulakowski (2020) and with scores within the 0.1 inconsistency limit set (see Supplementary Material S2 for the calculation). This approach created the following weights for the different criteria: 0.41, 0.19, 0.28, 0.04, 0.04, and 0.04.
Here, we can observe that the case company will primarily base their decision on the technical and economic viability criteria, while the environmental viability criteria will have only little influence on the result scores. This already hints at a biased decision process, since the current weighting indicates a greater focus on securing economic sustainability rather than compliance with the new environmental regulations. This also goes against the expressed aim of securing a fine balance between both economic viability and compliance with the new environmental sustainability aims and regulations and accordingly indicates an intention–behavior gap in the decision-making process of the case company.
Next, in the workflow, we have Action 2, where the case company supplies the AHP tool with the relevant data needed to obtain the AHP scores for each of the alternatives that are evaluated. The generated scores are displayed in Table 2.
The Technical viability criteria take the quantitative result (i.e., storage capacity, protein content, and amount of raw material) as input and return an output score of between 0 (lowest possible viability) and 10 (highest viability). The economic criteria Payback period and Return On Investment (ROI) are generated from a 10-year projection of the basic costs and incomes based on the yearly amount of the by-product and additional user-defined inputs (i.e., depreciation period, percentage of own funds, percentage of bank–public loan, and loan interests). As the output, it calculates an estimate of the Payback period and the ROI. In general, the score for the Payback period should be as low as possible and the score for the ROI should be as high as possible and should be a positive value.
The environmental criteria of the Carbon footprint, Water footprint, and Eutrophication are based on a Life Cycle Assessment (LCA) that considers the amount of material used for packaging, energy and water consumption, and the generated waste to calculate the Carbon and Water footprint and the Eutrophication factor. In general, the scores for all three criteria should be as low as possible. The details on how the AHP values were generated in the current case are described in Supplementary Material S3.
From Table 2, it appears that alternative A has the best scores for criteria 1–3. Meanwhile, both alternative B and C scores are significantly better for criteria 4–6, but have negative scores for criteria 3, which means that the case company would be adding more costs to their operation than generating revenue with these methods. The negative score for criteria 3 in alternatives B and C also means that these alternatives cannot self-finance the investment and that the case company needs to allocate additional financial resources to pay off the investment. In this study, we work under the assumption that the case company would be able to pay back the initial investment cost in 3 years for alternative B and 5 years for alternative C. Based on this factor and the generated initial user weights from Action 1, it is already possible to conclude that alternative A with a high certainty will be the preferred choice for the case company when it comes to the user ranking in Action 6.
Once the AHP scores are obtained for each alternative, Action 3 in the workflow is initialized to identify any potential biases that might reduce the objectivity of the AHP tool and its scores for each of the alternatives. This involves constructing a cognitive map from the interview and then subjecting this map to an attribute substitution analysis, as described in the work of Schrøder et al. (2023).
The complete cognitive mapping analysis is presented in Supplementary Material S4, S5 and shows the Thematic analysis, Centrality analysis, Domain analysis, and Givens–Means–Ends (GME) analysis that constitute the cognitive map. The result of the cognitive mapping analysis generates the case-specific cognitive map in Figure 1, which is also summarized in Table 3.
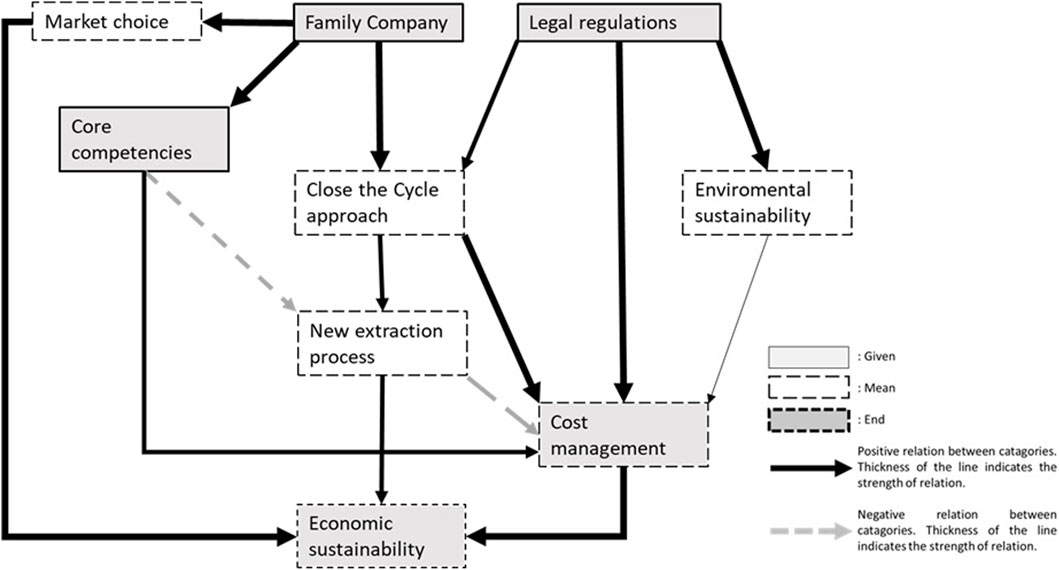
FIGURE 1. Cognitive map of the case company. The flow is kept unidirectional. The Givens, which represent the underlying variables central to a decision maker’s view of a situation, are able to influence the Ends, which represent the goals of the decision maker. The Means act as moderators for the Givens in this influence process. For a more extensive version, please see Supplementary Material S6.
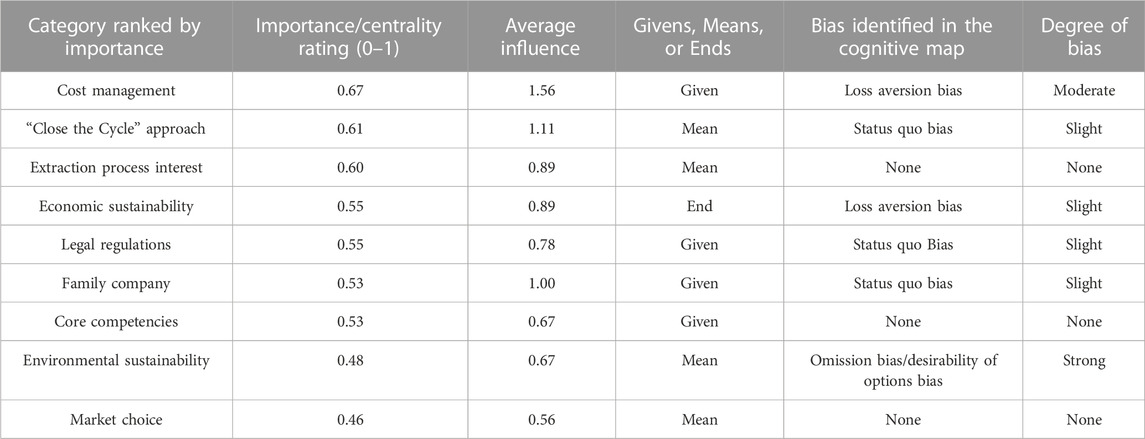
TABLE 3. Identified biases from the cognitive map of the case company. Importance/centrality covers how influential a category is on the decision-making process. The higher the score (0–1), the more important the category is. Average influence covers the influence that the category has on the other categories in the cognitive map. The higher the score, the higher influence of the category in the cognitive map.
From Figure 1, the idiographic causality for the company’s decisions in relation to sustainable development can be observed and ordered as Givens, Means, and Ends. From the cognitive map, it is evident that the economic aspect of sustainable development is the focus, as shown with the two Ends categories of cost management and economic sustainability. From the cognitive map, it can be further observed that the Means category’s new extraction process is primarily economic in its scope, due to its connections to the two Ends categories and it shares one indirect relationship with the Mean category, environmental sustainability.
The cognitive map further indicates that the case company is more economic in its foci than being environmental-oriented. This indicates a tendency of the case company to react more to an economic framing of gains and losses than to an environmental framing of gains and losses.
Furthermore, the lack of a direct relationship between the two Means categories of environmental sustainability and the new extraction process indicates an omission of environmental sustainability in the decision-making process on investing in a new extraction system.
The subsequent Attribute Substitution analysis visualized, in Figure 2, in the following expands on this.
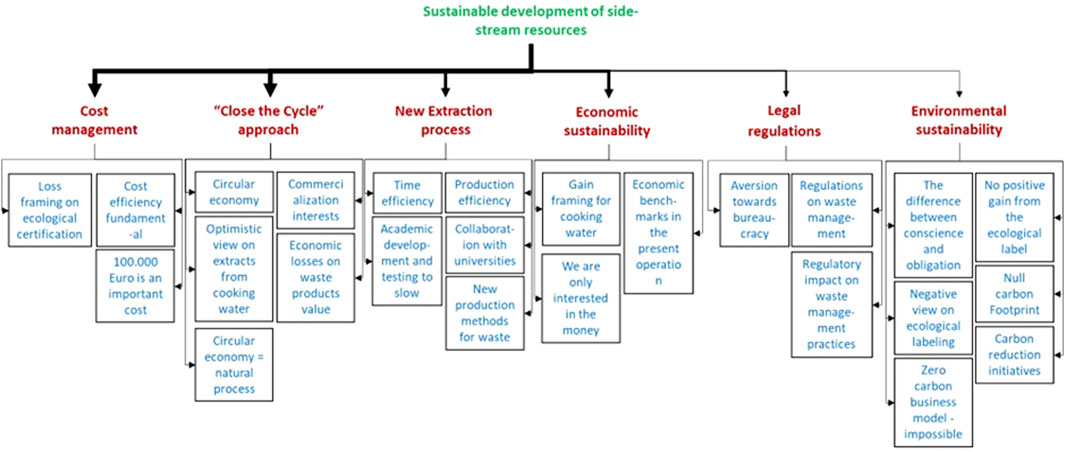
FIGURE 2. Attribute substitution of the case company. Green letters are the target attributes, red letters are the heuristic attributes, and blue letters are the sub-attributes. For a more extensive version, please see Supplementary Material S7.
In Figure 2, the case company’s attribute substitution can be defined as follows: the target attribute is the sustainable development of side-stream resources. The heuristic attribute is that the company understands the target attribute through cost management, “Close the Cycle” approach, new extraction process, economic sustainability, legal regulations, and environmental sustainability. The sub-attributes are the concepts that constitute the heuristic attributes, e.g., the sub-attributes of the heuristic attribute cost management are loss framing on ecological certification, cost efficiency fundamental, etc. The thickness of the lines indicates the relative importance of the heuristic attribute and the sub-attributes according to the importance score of these categories from Table 3. This analysis shows the same trend as the cognitive map of the economic aspect of sustainable development being the dominant focus of the company. From this, it is now possible to start the identification of the case company’s cognitive biases.
From Figure 2, it further appears that the decision maker primarily views the sustainable development of side-stream resources with an economic focus, which is based on the heuristic attributes of cost management, “Close the Cycle” approach, new extraction process, and economic sustainability. These heuristic attributes also include sub-attributes that are primarily economic in their foci. For instance, the “Close the Cycle” approach includes the sub-attributes “commercialization interest” and “economic loss on waste products’ value.” This is also exemplified in the interview data:
“Interviewer: Is one hundred per cent of the shell utilized?”
Company: We recycle one hundred percent of the shell, but we do not sell it, we pay for it. It is a big cost.
Interviewer: Is it big? How much is it in proportion to the annual turnover?
“Company: It is 30 euros per ton of grinded shells. Approximately 15 euros are paid to the recycling plant and the transport costs another 15” (Supplementary Material S4, lines: 50–54).
While some focus was on the other aspects, such as legal regulations and environmental sustainability, which were observed through a focus on reducing wastewater, it was clarified through the interview that this focus was primarily motivated by economic reasons rather than environmental reasons due to the new EU regulations being introduced to the industry:
“Interviewer: In the case that the water coming to the WaSeaBi project and what is being carried out in AZTI cause the marketable nutrients to be extracted with the technology that AZTI is developing, would you take part in that business opportunity? Or would you only like to get rid of and pay for the water because it has value at the end?
“Company: It depends on the business…Mussels are secondary; we are only interested in the money, everything else…” (Supplementary Material S4, lines: 371–375).
This has caused the case company to focus more on the economic aspects of the investment decision than on the environmental aspects. The focus on the economic aspects is primarily driven by a motivation to reduce the economic costs that new waste management regulations have caused the company, which have made them more sensitive to loss framings in a decision:
“Interviewer: We have one last question, a clarification question. When you are making decisions regarding your side-streams (shells, water, bad quality shells … ) the main factors determining if you are using this commercially is that there is a market demand? Or a law that is restricting how you can get rid of this side stream.”
Company: Now, we only have one decision, to go through a recycling plant; legally, there is no other option. I cannot … I mean this for the shells; for the cooking water, there are more options. As there is no, let’s say, technology that is within the reach of the company, I mean … a certain type of technology that the company can afford, so the cheapest way is to throw it in the sewerage system.
The ideal would be the re-utilization of it, and there are companies that are interested in it; they want this cooking water/broth.
I mean, we want an affordable re-utilization process, even though is not a re-utilization; I mean, we want to manage it in a correct way but also that the company can afford it; see there was someone who made a wild investment, around 600,000€, into a biological depuration that’s not working, it’s stopped; others used an ultra-filtration system that’s not working as well (Supplementary Material S4, lines: 346–358).
This insight from the analysis matches the description of the Loss aversion bias that is shown in Supplementary Material S8, Table 13 and indicates that the case company would be inclined to the overweight criteria related to the economic focus. This is also supported by the resulting importance and influence scores in Table 3, where the economic categories were the most important and the most influential categories for the case company.
In Figure 2, it can be observed that the company under the heuristic attribute of the “Close the Cycle” approach has preferences for how to run their practices. Together with the heuristic attribute, legal regulations, it reveals that the company primarily has an aversion toward changing its business practices, since it is viewed as either adding more bureaucracy or complicating the existing waste management processes that previously worked well:
“Interviewer: And has this always been a part of your business approach, trying to have a circular economy where the carbon emissions are as low as possible, or is this a new approach?
Company: The mussel cycle is a natural process by itself, you don’t have to use food, you don’t pollute, like a fish hatchery where you have to feed the fish and pollutes more. The mussel cookers used to manage waste in other ways, how did we do that? We used the waste products in crops, forest tracks/trails … It always seemed a better idea to me to use the product firmly … Imagine you are in a quarry, where you extract stone, it can be used in two ways; the heavy machinery undoes the forest tracks/access roads, then you throw mussel shells and is embedded in the mud and stabilizes it, preventing landslides. The other option, in the quarries, where stone is extracted, at least in Galicia, quarries are obliged to regenerate the land, so you use shell, soil, shell, soil … and at the end you can plant vegetation to recover the land. Then, all of this, with the European law … At least for me, I do not have pretty much more to say!” (Supplementary Material S4, lines: 263–274).
This insight from the analysis matches the description of the Status quo bias shown in Supplementary Material S8; Table 13 and indicates that the case company could be inclined to overvalue alternatives that they have had experience or success with before. However, the importance and influence scores in Table 3 show that this influence is only minor and, therefore, should not be influential in the company’s decision-making process, as the company, in general, shows a great willingness to change their existing practices if a gain scenario is deemed feasible in relation to the heuristic attribute, “Close the Cycle” approach:
“Company: […] We also tried an electrolysis system, but it is like a toy that … after we tried with ozone, but it is unstable, it is too unstable to measure … I mean, I do not understand so much about ozone, I had here several ozone machines but ended up in the trash. What I saw is that you have an ozone system, but you never see if the system is working unless you do constant trials. You are not able to measure the quantity of ozone; is too unstable, it is quickly evaporated or lost as soon as it acts against organic matter. And here there are lots of dissolved organic matter. What is the problem of the cooking water? It has the protein dissolved in the water, like if we dissolved sugar in the water, how the hell you do to … I tried with an evaporation tower, as if it was a distillate. But the issue with distillate is that it explodes up in terms of cost” (Supplementary Material S4, lines: 209–216).
It appears from Figure 2 that the company does not factor in the heuristic attribute, environmental sustainability, in their decisions, as it is either seen as something impossible to achieve or as simply being economically infeasible to pursue:
“Company: Our idea would be that the company in that sense would accomplish a null carbon footprint… but that is almost impossible. We have solar panels… but also a difficulty; we work with fuel, but we want to change into gas, but despite there is gas in the area it’s not transported here” (Supplementary Material S4, lines: 260–262).
“Interviewer: I was just wondering, when it then comes to sustainable development is it contingent on certain factors in the sense that if a certain factor is not present then you are not doing sustainable development? When it comes to sustainable development in your business, and the production; is there certain factors that have to be in place in order for you to consider this or do you always consider sustainable development?
Company: Truth is that I do not know; I have not been worried about this” (Supplementary Material S4, lines: 277–281).
“Interviewer: Then what is it that makes it ecological? What is the factor about being ecological?
Company: Nah… Paperwork.
Interviewer: Yes? Is it the same mussel?
Company: Yes, it is the same mussel. I mean; it is a bullshit, a bad business” (Supplementary Material S4, lines: 309–312).
This insight from the analysis matches the description of the Omission bias, shown in Supplementary Material S8, Table 13, and indicates that the company tends to ignore criteria related to environmental sustainability in their decision process. This is also supported by the resulting importance and influence scores, shown in Table 3, where the environmental category was amongst the least important categories for the company. However, the Omission bias does not account for why the decision maker would be inclined to underweight these criteria that are related to the environmentally focused category. In addition, since these environmental criteria are already a part of the tool, using debiasing techniques, such as probing, to incentivize the user to include more omitted criteria related to environmental sustainability, seems redundant. This is also evident when factoring in that the initial user weights generated in Action 1, which show underweighting of these criteria.
Instead, there is a need to draw on a bias that is associated to the Omission bias from the work of Montibeller and von Winterfeldt (2015), the Desirability of options bias. This bias accounts for how a decision maker’s intuitive preference can lead to over- or underweighting of certain attributes or criteria. The concept of environmental sustainability is a rather new concept for the case company to base their decisions upon, and it has been shown in Table 3 as a category that does not have a high level of centrality or influence compared to the technical or economically focused categories. On this basis, it is argued that this is the associated bias that is causing the extreme disparity in the generated initial user weights from Action 1.
Based on the above analysis, it can be concluded that the case company’s decisions might be affected by the biases of Loss aversion, Status quo, Omission, and the associated Desirability of options bias. However, since only the Loss aversion bias and Omission bias have a degree of bias that is moderate or strong, only these two biases will be corrected for in Action 4, given as follows.
Action 4 covers the establishment of debias criteria weighting, as described in the work of Schrøder et al. (2023). It comprises applying the appropriate debiasing techniques to correct the initial user weights for the associated biases.
According to the results of Action 3, debiasing techniques for the Loss aversion bias will be used to correct the user weights for the economic super-criterion that was created by the experts from AZTI, and it is based on two criteria, the ROI and Payback period.
Based on the work of Deniz (2020), debiasing for an identified Loss aversion bias follows two stages.
1. Adjusting the weight of other criteria using the following formula:
Here, Wdi = debiased weight, Win = initial user weight of each criterion (i to n), Wmax = highest user weight, and W2 = second highest user weight.
2. Setting the highest user weight according to the second highest user weight: The reason for this practice is to continue acknowledging the importance that the decision maker has assigned to it.
Based on the work of Montibeller and Von Winterfeldt (2015), there are several techniques of debiasing for an identified Omission bias. The common theme for these techniques is to prompt the user to include the missing criteria in their evaluation. However, because these criteria have been included in the tool already, these techniques cannot be applied. Instead, a debiasing technique used to reduce the associated Desirability of the options bias will be utilized, since from the initial user weights in Action 1 and the results from Action 3, we can observe a clear over- and underweighting of certain criteria by the case company.
This technique is focused on reducing the extremities between the higher-rated criteria and the lower-rated criteria to ensure that the decision maker’s attention is distributed in a more balanced way (Montibeller and Von Winterfeldt, 2015). Beyond this description, no direct technique for the implementation of MCDM tools is detailed in the literature to our knowledge. Therefore, in the current study, we propose that this debiasing technique is conducted through a direct weight redistribution based on the following conditions:
• IF the majority of overweighted criteria are <1.66 compared to the expert weight and the majority of underweighted criteria are >0.33 compared to the expert weight, THEN 0.05 is subtracted from the weights of the overweighted criteria and 0.05 is added to each of the underweighted criteria
• IF the majority of overweighted criteria are >1.66 compared to the expert weight and the majority of underweighted criteria are <0.33 compared to the expert weight, THEN 0.1 is subtracted from the weights of the overweighted criteria and 0.1 is added to each of the underweighted criteria
In the initial user weights, only one of the overweighted criteria, ROI, exceeds this threshold with a weight of 1.70. In addition, the super-criterion that the criterion ROI is part of only exceeds with a weight of 1.41. Therefore, there are no majority of overweighted criteria exceeding the threshold of 1.66. In addition, none of the underweighted criteria exceed the underweighted threshold of 0.33; the same applies to their super-criterion. Thus, the direct weight correction that is applied when debiasing for the Desirability of options bias is 0.05.
Based on these two debiasing techniques, the debiased weights can be generated. The calculation for the debiased weight is shown in Table 4.
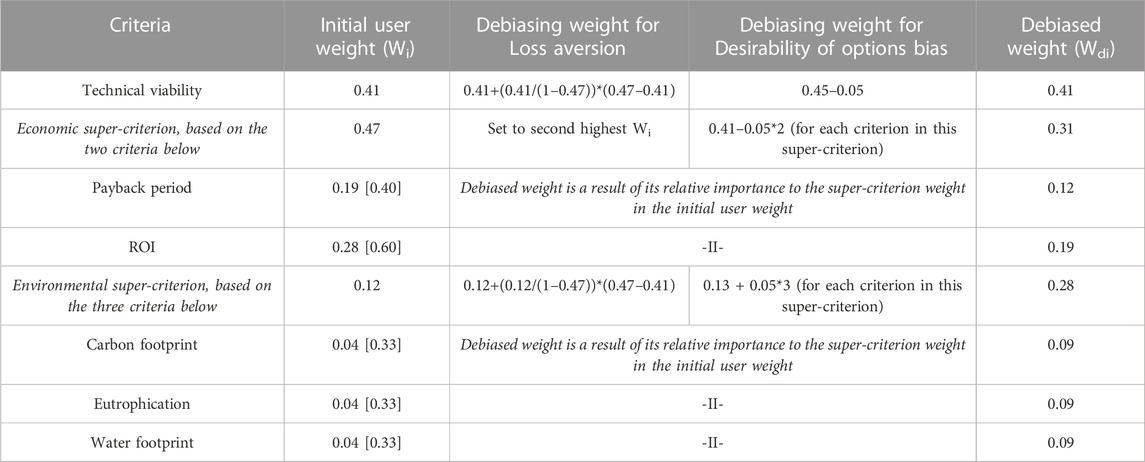
TABLE 4. Debiasing the initial user weights for the identified Loss aversion bias and Desirability of options bias from the cognitive map of the case company. The factions shown in [] are the weights relative importance to the super-criterion weight.
As such, the debiased user weights are generated in Action 4.
Actions 5a and 5b in the workflow of Schrøder et al. (2023) are the generation of the weighted bias and the debiased decision, using TOPSIS calculations based on the alternative inputs from Table 2 and the weights from Table 5 (Hwang and Yoon, 1981; Zulqarnain et al., 2020). The following calculations feature the expert weights only, but each calculation step is repeated for both the user weights and the debiased user weights (see Supplementary Material S9 for the detailed calculations).
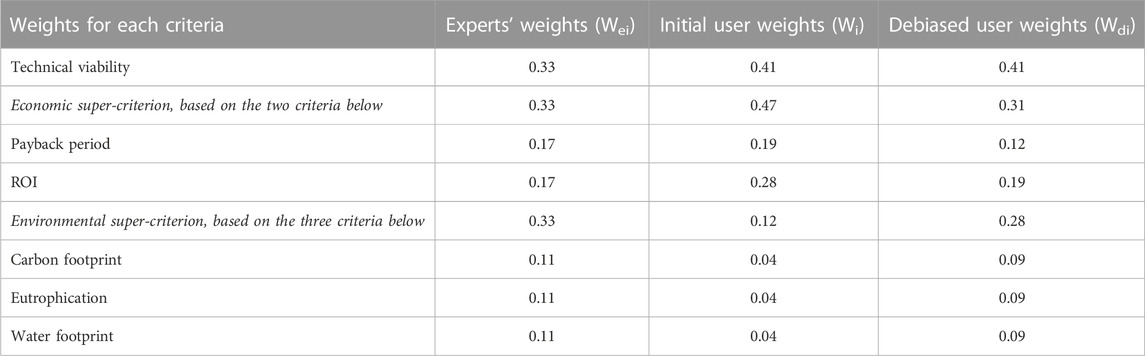
TABLE 5. Criteria weight sets by experts’ weights, the initial user weights, and debiased user weights following a Loss aversion and Desirability of options debiasing process for the case company.
First, in the TOPSIS approach (Zulqarnain et al., 2020), the normalized matrix (
This resulted in the normalized decision matrix, which is shown in Table 6.
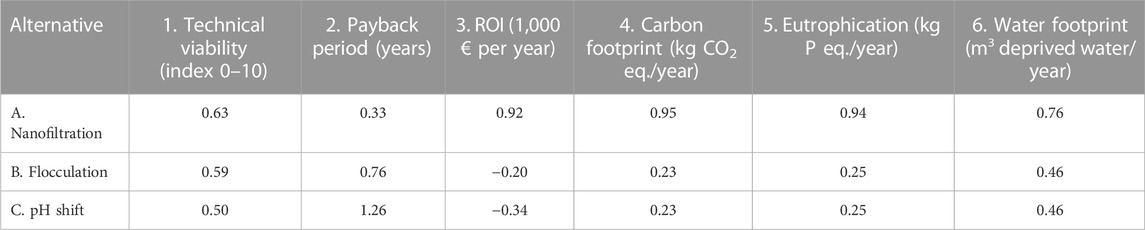
TABLE 6. Normalized decision matrix for the case company. The normalized scores range from −1 to 1. The normalized scores follow the same logic as outlined in Section 3.2. That is, a high normalized score for criteria 1 and 3 is preferred, while a low score for criteria 2 and 4–6 is preferred.
The next step was the assignment of the ideal best and ideal worst value for each criterion followed by the calculation of the weighted normalized matrix (Vij). These ideal best and ideal worst values are dependent on the criteria. That is, for the criterion ROI, a high score (Vmax) would be the ideal best value, but for the criterion eutrophication, a low score (Vmin) would be the ideal best value since lower eutrophication levels are preferred due to the regulations that the case company needs to be compliant with. This provided the following logic for the ideal best value for criteria.
• Tech viability, highest index score (Vmax score)
• Eco viability Payback period, lowest payback period in years (Vmin score)
• ECO viability ROI, highest 1,000 € per year (Vmax score)
• ENVIRO Carbon footprint, lowest kg CO2 eq./year (Vmin score)
• ENVIRO Eutrophication, lowest kg P eq./year (Vmin score)
• ENVIRO Water footprint, lowest m3 deprived water/year (Vmin score)
To define the ideal worst value for the six criteria, a reverse logic was applied (Zulqarnain et al., 2020). Based on this logic, the weighted normalized decision matrix (Vij) was calculated based on the values in Table 6, using the following formula:
From this, the Euclidean distance from the ideal best value (Si+) was calculated with the following formula:
Then, the Euclidean distance from the ideal worst value (Si−) was calculated with the following formula:
With the ideal best and ideal worst values, the calculated Pi score for each alternative was finally calculated using Formula 6, resulting in the weighted normalized decision matrix given in Table 7.
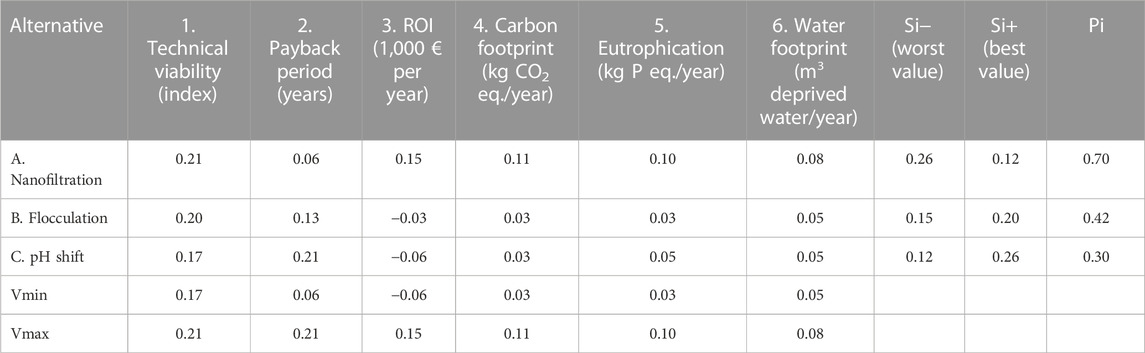
TABLE 7. Weighted normalized decision matrix for the case company with a calculated Pi that ranges from 0–1 of each alternative (A–C) based on their
Under Action 6 of the process in the work of Schrøder et al. (2023), the actual ranking of the alternatives is conducted based on their Pi rating from Table 7. This covers each of the investigated alternatives from Table 2 and enables us to conclude which alternative would be the optimal local evaluated decision for the case company to choose in this case-specific application. The results for each of the alternatives are shown in Table 8.
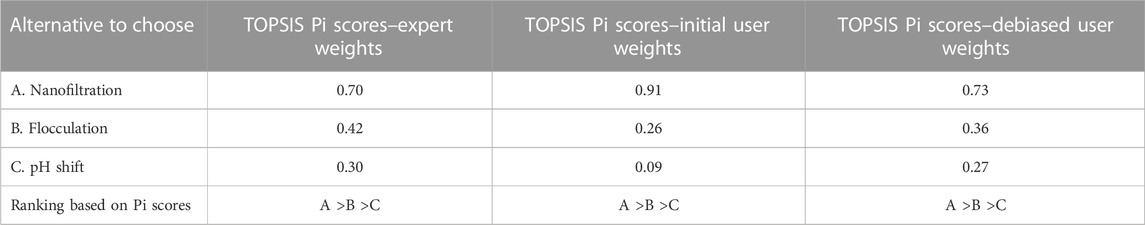
TABLE 8. Final AHP score matrix using expert weights, initial user weights, and debiased user weights for the case company. Pi stands for the Performance index.
Action 7, which is the final action of the process, provides the results of the optimal evaluated decision for the case company, as shown in Table 8, based on the Pi scores of the expert weights, initial user weights, and debiased user weights.
Based on these results, the optimal local evaluated decision for the decision maker to enact to achieve the best environmental and economic option for production in the case company is alternative A, which is the nanofiltration option.
Based on the actual input data and comprehensive information from the case company and the final Pi scores in Action 7, the optimum alternative suggested for the case company is alternative A for all weight sets. Despite arriving at the same Pi rank conclusion, the impact of the debiasing method becomes apparent when reviewing the Pi scores in Table 8.
When using the Pi rating based on the expert weights as a benchmark for validating this method, it generates Pi scores of 0.70, 0.42, and 0.30 for alternatives A–C, respectively. This means that alternative A should be enacted as the recommended choice for the case company according to this Pi rating. When the initial user weights are applied instead of the expert weights, they generate Pi scores of 0.91, 0.26, and 0.09, respectively. While these Pi scores still confirm that alternative A is the recommended choice which should be enacted, these Pi scores also show the influence of the biased weights on the AHP tool results. While alternative B and C have worse input values for Technical viability, Payback period, and ROI, as shown in Table 2, their input values for the three environmental criteria are better than those for alternative A. In the case of criteria 4 (the carbon footprint), alternative B and C are approximately four times better than alternative A. However, with the initial user weights, these input values are made less influential on the Pi score and, thereby, fail to capture the positive gains of the stronger environmental profile of alternatives B and C compared to alternative A when applying the initial user weights in the Pi scores.
When the debiased weights are applied, it corrects Pi scores and generates the Pi scores of 0.73, 0.36, and 0.27, respectively. Alternative A is still the recommended choice to enact, but now, with some degree of confidence, we can say that Pi scores are more objectively based than before. These Pi score correction results are similar to the theoretical simulation correction results found in the work of Denis (2020) and Schrøder et al. (2023), where biased weights also caused a deviation from the benchmark before corrections were achieved through the application of appropriate debiasing techniques. However, given the lack of “in situ,” real-world case studies in the debiasing literature related to MCDM methods and, in particular, the AHP with TOPSIS, we were not able to compare this case study’s Pi score correction results with other studies. This is due to the research within this area being currently focused on how MCDM methods either enable or enhance different cognitive biases (Rezaei, 2020; Melnik-Leroy and Dzemyda, 2021; Rezaei et al., 2021; Rezaei, 2022; Dhurkari, 2023).
To evaluate the debiasing method, DYD, and the results of the case company, a graphical method-based sensitivity analysis of the input values from the user was conducted (Frey and Patil, 2002). The sensitivity analysis and resulting Figure 3 were created in Microsoft Excel using the Visual Basic Application programming language and the data for the six new weight sets (expert/initial user/debiased weight 2–7), which can be viewed in Supplementary Material S10.
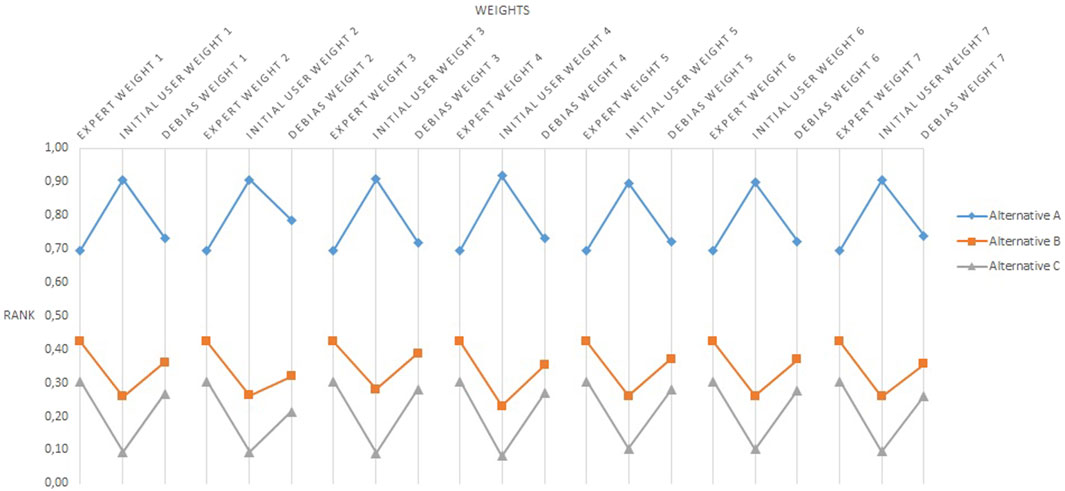
FIGURE 3. Sensitivity analysis. The sensitivity analysis is based on the Pi scoring results when changing the initial user weights one at a time by +20%. The expert weights from Table 5 are the benchmark that the debiased weights are compared to. In addition, debiased weight 1 is another benchmark for the analysis to observe how much deviation is caused compared to the original results in Table 8.
From Figure 3, it is evident that the debiasing method performs well. In five out of the six instances, the debiased Pi score results for alternative A are nearly similar to the experts’ Pi score results and only deviate by ± 0.01 compared to the unmodified Pi score of debiased user weight 1. An exception is observed for the weight set “Initial user weight 2,” as shown in Figure 3. Here, the new and increased weight for the criterion Technical viability are causing an issue for the debiasing method, which causes a deviation of +0.06 compared to the debiased user weight 1 for alternative A.
The latter seems to originate from the debiasing technique for the Loss aversion bias. This technique is reliant on the weight criteria associated with the bias, which is also the highest weight value, as this criterion will receive the largest downward weight correction. As the weight value for Technical viability is increased, two issues occur: 1) In Eq. 1, Technical viability is the second highest weight, meaning that it has a fixed value for W2. After a 20% increase, the W2 level is now higher than Wmax, which results in an increase in the weight value for the debiased weight of Technical viability. 2) The economic super-criterion is set to W2 in order to respect the importance of the criteria for the user. In this instance, the weight value for the super-criterion is not lowered but instead increases due to the increase in W2. While the method is still able to correct for this, due to the debiasing technique for the Desirability of the options bias, it shows that the debiasing technique for the Loss aversion bias is sensitive to interventions that change the relationship between W2 and Wmax in Eq. 1.
In the next two tests, where the initial user weights that constitute the economic super-criterion are changed, the debiasing technique for Loss aversion performs as expected. This underlines the specific application of the debiasing techniques for the Loss aversion bias to be highly contingent with the associated weight also being the highest value.
This is also highlighted in the work of Deniz (2020), where it is advised against utilizing this technique if the weight associated with the biased criteria is not able to be set as the highest among all the weight values. In the current case study, there is no argument on associating a Loss aversion bias with the criterion Technical viability, as the analysis in Action 3 only provides evidence for this bias as being associated with the economic super-criterion. Therefore, no adjustment was made to test how the Pi result would change if the weight for Technical viability was set as Wmax in Eq. 1. Although, given the logic of Eq. 1, it would be expected to reduce deviation in this instance. However, this condition of the weight, associated with the biased criteria that must always be the highest weight value, limits the debiasing technique’s application range. In the hypothetical but plausible situation, where the weight associated with the biased criteria cannot be set to Wmax, the debiasing technique will seize to perform as expected. A similar concern is also found in the work of Melnik-Leroy and Dzemyda (2021), where it is noted that the technique would fail to correct a Loss aversion bias in a criteria, showing that weight-wise, it was less important than the other weights in the set. This means that there is a need for the development and testing of a new debiasing technique for the Loss aversion bias, for the instances where the associated weight cannot be set to Wmax.
For alternatives B and C, the trend is the same. Similar to alternative A, the deviation compared to the unmodified Pi score in debiased user weight 1 is high, with −0.04 for alternative B and −0.06 for alternative C when using the weight set “Initial user weight 2.” However, for the other weight sets, the debiasing techniques significantly reduce the deviation between the initial user weight Pi score results and the expert weight Pi score results through the debiased Pi score results in five of the six instances.
Consequently, it is reasonable to assume that the debiasing method is robust and that company B can choose alternative A as the original results, as shown in Table 8.
In relation to the strengths, the results from this case study show that the method can correct the final Pi scoring results for the influence of biased weights, to be more in line with the experts’ Pi scoring results.
Furthermore, the method does not overcorrect the Pi scores, which could lead to a different ranking of alternatives than the one generated in Table 8. This means that the method does not generate biased results that favor a particular input or weight criteria, adding to the objectivity claim of this method.
With respect to the limitations, the bias identification from Action 3 is a potential limitation of the results. In this action, there is a large responsibility that is placed on the conductor of the analysis to handle the qualitative data correctly and to analyze these as objectively as possible. To account for this responsibility, a large emphasis was placed on enhancing the Internal viability and Construct viability to reduce any potential Researcher bias during Action 3 (Brinkmann and Tanggaard, 2020).
The current study attempted to improve the Internal viability by utilizing Explanation building to build explanations for the case that is fundamental in a Theoretical explanation (Yin, 2014; Brinkmann and Tanggaard, 2020). This was achieved by utilizing pattern matching with the theoretical definitions of cognitive biases for reoccurring themes from the interview with the case company and documenting their match (for this, see Supplementary Material S4–S8). The study’s Construct validity was sought to be improved by the following procedure: multiple sources of evidence (interviews, legal documents, annual reports, industry reports, etc.) were used to maintain the chain of evidence, organize the data, and document the data appropriately, as shown in Supplementary Material S4–S8.
This reliance on the conductor of the analysis means that it may be difficult to achieve the same bias identification result from Action 3 in a reproduction. As suggested by Schrøder et al. (2023), an automated self-Q method, where the role of the conductor of the analysis is reduced in favor of a cognitive map and attribute substitution being generated by the respondents themselves, is a step in the direction of the further development of the method that should be encouraged.
The debiasing technique, used in the study for the Desirability of the options bias, is novel to this study and has not been documented in other studies to our knowledge. While the technique was made operational based on the description found in the work of Montibeller and Von Winterfeldt (2015), further testing through applications (both real-world and simulated) of the proposed technique, beyond what was carried out in this study, is needed to further validate the general applicability of this technique.
The current study represents only one comprehensive investigation with data from one “in situ” real-world company in the European mussel farming and processing industry. While the debiasing method is verified in this case study with specific real-world applications, it remains to be verified if the method shows the same robustness when applied to other European mussel farming and processing companies and, for that matter, to other business settings (Runkel and McGrath, 1972). This has an impact on the method’s generalization claim, as it has not yet been fully explored through statistical testing of whether the debiasing techniques of the method can produce the same results in different decision contexts and for other types of companies in other contexts to support the generic applicability and robustness of the results (Runkel and McGrath, 1972).
The application of the debiasing methodology, DYD, to this “in situ,” real-world case study shows the method’s strengths by being able to identify and determine the degree of cognitive biases that the decision makers in the case company are influenced by. In addition, the method was able to correct for those identified cognitive biases without causing an overcorrection of the Pi results. While the final ranking of the alternatives in this study did not change, the implemented debiasing techniques into the AHP tool are still able to correct the overweighted user weights, so the significant deviations in the underlying Pi scores to the expert weights are reduced, thereby improving the quality and performance of the tool and the results from applying this. This leads us to reject the two null hypotheses.
This study provided the case company with an objective input for their decision process on which filtration system to invest in and use. Here, the recommendation is to choose alternative A over B and C, given that this alternative fulfills the condition of having the best balance between economic gains and more environmentally sustainable production with the cooking water side stream.
Furthermore, this study suggests a new computational design for the debiasing technique for the Desirability of options bias. The current limitation of this study’s results is that this is a novel debiasing technique developed for the DYD method. We, therefore, emphasized the need for further testing and validation of this debiasing technique’s general applicability through its application and testing in other case studies or theoretical simulations.
Another potential limitation of the DYD method’s general applicability that needs further development is the bias identification from Action 3. We advocate for further development toward a more automated process that reduces the involvement of the conductor of analysis when identifying and determining the degree of cognitive biases. One promising approach to investigate for this is found in the work of Pandey and Jessica (2018). In that study, an Item Response theory approach is utilized together with a unidimensional graded response model to automate the analysis of a decision maker’s responses to a 14-item scale that measures eight specific predefined cognitive biases (Pandey and Jessica, 2018). Such an approach would be worth testing in the DYD framework, as it may provide a more automated process for bias identification during Action 3. Furthermore, there is a need for the development and testing of a new debiasing technique for the Loss aversion bias in the instances where the associated weight cannot be set to Wmax.
Given that this is the first real-world “in situ” case study with the debiasing method DYD, its general applicability still needs to be established through further case study applications that can enable statistical testing, which can either support or question the generic applicability of the method and its debiasing techniques (Runkel and McGrath, 1972).
The original contributions presented in the study are included in the article/Supplementary Material; further inquiries can be directed to the corresponding author.
Written informed consent was obtained from the individual(s) for the publication of any potentially identifiable images or data included in this article.
SS: conceptualization, data curation, formal analysis, methodology, software, validation, writing–original draft, and writing–review and editing. DS: data curation, software, and writing–review and editing. GF: data curation, software, and writing–review and editing. MG: data curation, software, and writing–review and editing. BI: data curation, software, and writing–review and editing. JN: conceptualization, methodology, supervision, validation, and writing–review and editing. EL: conceptualization, methodology, supervision, validation, and writing–review and editing.
The authors declare that financial support was received for the research, authorship, and/or publication of this article. This work was conducted under the EU H2020 WASEABI project, which received funding from the Bio-based Industries Joint Undertaking (JU) under grant agreement no. 837726. This communication reflects only the author’s view and the JU is not responsible for any use that may be made of the information it contains.
The authors declare that the research was conducted in the absence of any commercial or financial relationships that could be construed as a potential conflict of interest.
All claims expressed in this article are solely those of the authors and do not necessarily represent those of their affiliated organizations, or those of the publisher, the editors, and the reviewers. Any product that may be evaluated in this article, or claim that may be made by its manufacturer, is not guaranteed or endorsed by the publisher.
The Supplementary Material for this article can be found online at: https://www.frontiersin.org/articles/10.3389/frfst.2023.1258713/full#supplementary-material
Almashat, S., Ayotte, B., Edelstein, B., and Margrett, J. (2008). Framing effect debiasing in medical decision making. Patient Educ. Couns. 71, 102–107. doi:10.1016/j.pec.2007.11.004
Avdelas, L., Avdic-Marble, E., Borges Marques, A. C., Cano, S., Capelle, J. J., Carvalho, N., et al. (2021). The decline of mussel aquaculture in the European Union: causes, economic impacts and opportunities. Rev. Aquac. 13 (1), 91–118. doi:10.1111/raq.12465
BOE (2022). BOLETÍN OFICIAL DEL ESTADO. Available at: https://www.boe.es/boe/dias/2022/04/09/pdfs/BOE-A-2022-5809.pdf.
Borrero, S., and Henao, F. (2017). Can managers be really objective? Bias in multicriteria decision analysis. Acad. Strategic Manag. J. 39 (1), 244–259.
Brinkmann, S., and Taanggaard, L. (2020). Kvalitative metoder – en grundbog (3). Copenhagen: Hans Reitzels Forlag. ISBN-13: 9788741277264.
Buchanan, J. T., and Corner, J. L. (1997). The effects of anchoring in interactive MCDM solution methods. Comput. Oper. Res. 24, 907–918. doi:10.1016/S0305-0548(97)00014-2
Businessinsider (2017). Businessinsider.com. Available at: https://www.businessinsider.com/surprising-everyday-products-made-from-cow-parts-2017-10?r=US&IR=T.
Coppola, D., Lauritano, C., Palma Esposito, F., Riccio, G., Rizzo, C., and de Pascale, D. (2021). Fish waste: from problem to valuable resource. Mar. drugs 19 (2), 116. doi:10.3390/md19020116
Costello, C., Cao, L., Gelcich, S., Cisneros-Mata, M. Á., Free, C. M., Froehlich, H. E., et al. (2020). The future of food from the sea. Nat. 588, 95–100. doi:10.1038/s41586-020-2616-y
Deniz, N. (2020). Cognitive biases in MCDM methods: an embedded filter proposal through sustainable supplier selection problem. J. Enterp. Inf. Manag. 33 (5), 947–963. doi:10.1108/JEIM-09-2019-0285
Dhurkari, R. K. (2023). Improving the prescriptive power of analytic hierarchy process. IEEE Trans. Eng. Manag., 1–11. doi:10.1109/TEM.2023.3281402
EUMOFA (2022). Organic aquaculture in the EU. Luxembourg: Publications Office of the European Union. doi:10.2771/327564
EUR-Lex (2008). DIRECTIVE 2008/98/EC OF THE EUROPEAN PARLIAMENT AND OF THE COUNCIL of 19 November 2008 on waste and repealing certain Directives. Available at: https://eur-lex.europa.eu/legal-content/EN/TXT/PDF/?uri=CELEX:32008L0098&from=EN.
EUR-Lex (2019). Communication from the commission - the European green deal. Available at: https://eur-lex.europa.eu/legal-content/EN/TXT/?qid=1576150542719&uri=COM%3A2019%3A640%3AFIN.
EUR-Lex (2021). Communication from the commission to the European parliament, the council, the European economic and social committee and the committee of the regions empty. Available at: https://eur-lex.europa.eu/legal-content/EN/TXT/HTML/?uri=CELEX:52021DC0236&rid=2.
European Commission (2022). The EU blue economy report 2022. Luxembourg: Publications Office of the European Union. doi:10.2771/793264
FAO (2020). The state of the world fisheries and aquaculture: sustainability in action. Rome; European Commission. doi:10.4060/ca9229en
Farmery, A. K., Alexander, K., Anderson, K., Blanchard, J. L., Carter, C. G., Evans, K., et al. (2021). Food for all: designing sustainable and secure future seafood systems. Rev Fish Biol Fish. 32, 101–121. doi:10.1007/s11160-021-09663-x
Frey, C. H., and Patil, S. R. (2002). Identification and review of sensitivity analysis methods. Risk Analysis 22 (3), 553–578. doi:10.1111/0272-4332.00039
Hwang, C. L., and Yoon, K. (1981). Multiple attribute decision making: methods and applications. New York: Springer-Verlag.
Kulakowski, K. (2020). Understanding the analytic hierarchy process. 1. New York: Chapman and Hall/CRC Press. doi:10.1201/b21817
Ma, W., Luo, X., and Jiang, Y. (2017). Multicriteria decision making with cognitive limitations: a DS/AHP-based approach. Int. J. Intell. Syst. 32, 686–721. doi:10.1002/int.21872
Melnik-Leroy, G. A., and Dzemyda, G. (2021). How to influence the results of MCDM? —evidence of the impact of cognitive biases. Math. 9 (2), 121. doi:10.3390/math9020121
Montibeller, G., and Von Winterfeldt, D. (2015). Cognitive and motivational biases in decision and risk analysis. Risk Analysis 35 (7), 1230–1251. doi:10.1111/risa.12360
Pandey, R., and Jessica, V. M. (2018). Measuring behavioural biases affecting real estate investment decisions in India: using IRT. Int. J. Hous. Mark. Analysis 11 (4), 648–668. doi:10.1108/IJHMA-12-2017-0103
Petersen, K. M., Bøgevig, S., Holst, J. J., Knop, F. K., and Christensen, M. B. (2018). Hemodynamic effects of glucagon: a literature review. J. Clin. Endocrinol. Metabolism 103 (5), 1804–1812. doi:10.1210/jc.2018-00050
Qian, X., Fang, S. F., Huang, M., and Wang, X. (2019). Winner determination of loss-averse buyers with incomplete information in multiattribute reverse auctions for clean energy device procurement. Energy 177, 276–292. doi:10.1016/j.energy.2019.04.072
Rezaei, J. (2020). Anchoring bias in eliciting attribute weights and values in multi-attribute decision-making. J. Decis. Syst. 30 (1), 72–96. doi:10.1080/12460125.2020.1840705
Rezaei, J. (2022). “The balancing role of best and worst in best-worst method,” in Advances in best-worst method. BWM 2021. Lecture notes in operations research. Editors J. Rezaei, M. Brunelli, and M. Mohammadi (Cham: Springer). doi:10.1007/978-3-030-89795-6_1
Rezaei, J., Arab, A., and Mehregan, M. (2021). Equalizing bias in eliciting attribute weights in multiattribute decision-making: experimental research. J. Behav. Decis. Mak. 35 (2). doi:10.1002/bdm.2262
Runkel, P. J., and McGrath, E. J. (1972). Research on human behavior: a systematic guide to method. New York: Holt, Rinehart and Winston, Inc.
Schrøder, S. E., San Martin, D., Foti, G., Gutierrez, M., Chastagnol, I., Nielsen, J. R., et al. (2023). Making the objectively best choice for side-stream resources—verification of a debiasing method based on cognitive maps and attribute substitution. Front. Food. Sci. Technol., Sec. Food Process Des. Eng. 3. doi:10.3389/frfst.2023.1068974
Schubel, J. R., and Thompson, K. (2019). Farming the sea: the only way to meet humanity's future food needs. GeoHealth 3, 238–244. doi:10.1029/2019GH000204
Shahidi, F., Varatharajan, V., Peng, H., and Senadheera, R. (2019). Utilization of marine by-products for the recovery of value-added products. J. Food Bioact. 6. doi:10.31665/JFB.2019.6184
Shepon, A., Eshel, G., Noor, E., and Milo, R. (2016). Energy and protein feed-to-food conversion efficiencies in the US and potential food security gains from dietary changes. Environ. Res. Lett. 11 (10), 105002. doi:10.1088/1748-9326/11/10/105002
Siddiqui, S. A., Schulte, H., Pleissner, D., Schönfelder, S., Kvangarsnes, K., Dauksas, E., et al. (2023). Transformation of seafood side-streams and residuals into valuable products. Foods 12 (2), 422. doi:10.3390/foods12020422
Van der Meer, J. (2020). Limits to food production from the sea. Natura Food 1, 762–764. doi:10.1038/s43016-020-00202-8
Van der Meer, J., Callier, M., Fabi, G., Luc van Hoof, , Rasmus Nielsen, J., and Raicevich, S. (2023). The carrying capacity of the seas and oceans for future sustainable food production: current scientific knowledge gaps. Food Energy Secur. 12. doi:10.1002/fes3.464
Keywords: case-specific cognitive biases, decision support systems, Debiasing Your Decision techniques, European mussel aquaculture and processing industry, modeling of food processing, side-stream utilization, sustainability in food processing, wastewater treatment
Citation: Schrøder SE, San Martin D, Foti G, Gutierrez M, Iñarra Chastagnol B, Nielsen JR and Larsen E (2023) Validation of a debiasing addition to Analytical Hieratical Process tools to increase the effects of side-stream utilization and the choice of the filtration system in the European mussel aquaculture and processing industry. Front. Food. Sci. Technol. 3:1258713. doi: 10.3389/frfst.2023.1258713
Received: 14 July 2023; Accepted: 27 November 2023;
Published: 20 December 2023.
Edited by:
Agbotiname Lucky Imoize, University of Lagos, NigeriaReviewed by:
Rui M. S. Cruz, Universidade do Algarve, PortugalCopyright © 2023 Schrøder, San Martin, Foti, Gutierrez, Iñarra Chastagnol, Nielsen and Larsen. This is an open-access article distributed under the terms of the Creative Commons Attribution License (CC BY). The use, distribution or reproduction in other forums is permitted, provided the original author(s) and the copyright owner(s) are credited and that the original publication in this journal is cited, in accordance with accepted academic practice. No use, distribution or reproduction is permitted which does not comply with these terms.
*Correspondence: Søren Espersen Schrøder, c29zY0BhcXVhLmR0dS5kaw==
Disclaimer: All claims expressed in this article are solely those of the authors and do not necessarily represent those of their affiliated organizations, or those of the publisher, the editors and the reviewers. Any product that may be evaluated in this article or claim that may be made by its manufacturer is not guaranteed or endorsed by the publisher.
Research integrity at Frontiers
Learn more about the work of our research integrity team to safeguard the quality of each article we publish.