 Hanyu Chen
 Carmen I. Moraru
 Vladimir V. Protasenko2*
94% of researchers rate our articles as excellent or good
Learn more about the work of our research integrity team to safeguard the quality of each article we publish.
Find out more
ORIGINAL RESEARCH article
Front. Food. Sci. Technol., 30 October 2023
Sec. Food Modeling
Volume 3 - 2023 | https://doi.org/10.3389/frfst.2023.1223829
This article is part of the Research TopicAdvancing Food Processing: Novel Technologies and Modeling TechniquesView all 4 articles
We propose a special design enclosure device that promotes isotropic distribution of germicidal UV-C light for the effective disinfection of difficult to reach surfaces. We used experimental and computational approaches to investigate the disinfection efficacy of this device against Escherichia coli and Listeria innocua. Stainless steel, Copper metal, and a Copper polymer were used as solid substrates of varying roughness and hydrophobicity. Bacteria reductions of up to 6.9 log CFU were achieved at various locations relative to the UV-C source after 3 min of treatment (20–990 mJ/cm2 cumulative fluence depending on the location). Inactivation kinetics was nonlinear and followed the Weibull model (0.77 ≤ R2 ≤ 0.97). Optical ray tracing simulation was used to generate maps of spatial light distribution, which were then coupled with microbial inactivation kinetics to create spatial maps of inactivation. The modeling approach used accurately predicted microbial inactivation at various locations, with only small discrepancies (±8%) between predicted and experimental data. These findings demonstrate that the proposed device is suitable for disinfecting various hard to reach surfaces, with numerous possible applications in the food and healthcare industries. Additionally, the modeling approach used here can be used to aid in the design of a highly effective Ultraviolet treatment system.
Equipment, instruments and various other surfaces in food processing, food service, as well as clinical and healthcare environments, can become colonized with harmful microbes, which facilitates the transmission of infections and increased risk of illness and even death in consumers or patients (Allegranzi et al., 2011; Dewey-Mattia et al., 2018). Cross-contamination from surfaces in food production and processing environments is an important source of food spoilage microorganisms and foodborne bacterial pathogens (Fung et al., 2018), and is an important cause of foodborne illnesses, which were estimated to sicken 600 million people and kill about 420,000 people every year (World Health Organization, 2016). Chemical sanitization is the most commonly used method for surface disinfection to prevent cross-contamination and spread of pathogenic microorganisms. However, while some surfaces are easy to clean and sanitize, instruments, computers, and other small equipment pose a sanitation challenge due to irregular shapes, hard-to-reach surfaces, and possible chemical sensitivity of electronic components. Cleaning of such surfaces requires a different strategy.
Ultraviolet (UV) light, particularly at a wavelength of 254 nm, is highly effective in inactivating microorganisms in various environmental conditions (Guridi et al., 2019; Cheng et al., 2020). UV-C disinfection is nonthermal, non-toxic, and leaves no chemical residue, making it useful as an alternative disinfection method to chemical sanitation in food and healthcare industries (Koca et al., 2018). The effectiveness of UV-C treatment depends on factors such as delivery of light (Kowalski, 2009), substrate properties (Cheng et al., 2020), distance between lamp and target, and type of microorganism targeted (Bintsis et al., 2000). UV-C treatments have been reported to achieve anywhere between <1 and >5 log reduction depending on these factors (Liltved and Landfald, 2000; Wright et al., 2000; Jeon and Ha, 2018; Prado et al., 2019). Another major limitation of UV-C treatment is its small penetration depth into organic matter, which limits its effectiveness on bacteria present deeper than the surface layer in both solids and liquids. Stirring or turbulent flow facilitate a uniform exposure to light in treating liquids with UV-C, thus improving treatment effectiveness (Bintsis et al., 2000; Sastry et al., 2000; Guerrero-Beltrán et al., 2005; Akgün et al., 2017; Prado et al., 2019). However, fewer options exist for improving the effectiveness of UV-C on solid surfaces. To address this need, this study proposes an isotropic, all-directional special design UV-C system to target microorganisms from all distances and angles. The goal of our design was to achieve uniform irradiance distribution inside the unit, preventing under-exposure and over-exposure of treated materials and equipment. This was obtained by increasing the number of non-absorbing scattering light pathways using a highly reflective enclosure lining, which minimizes shadowing effects and thus maximizes the overall disinfection performance.
The design of this unit was facilitated by the use of numerical methods. Different numerical models have been used before to simulate fluence rate distributions in UV systems, including the point source summation (PSS) (Jacobm and Dranoff, 1970) or the line source integration model (Blatchley, 1997). However, these models provide inaccurate estimates of fluence rates close to the light source, because of the simplified geometry they represent, and because they do not account for the effects of reflection or refraction. To overcome these limitations, this work explores the use of ray tracing as a tool for simulation of fluence rate fields in the proposed UV system. Ray tracing simulates the behavior of electromagnetic radiation emitted from one or more sources as many individual rays; the fate of radiant energy along the path of each ray can be accurately simulated using the fundamental laws of optics, which allows to account for refraction, reflection, absorbance, and shadowing (Lau et al., 2012).
Overall, this study aims to maximize the disinfection performance of 254 nm UV-C light by using a special design unit, whose effectiveness was evaluated using both experimental and computational methods. The specific objectives are to: 1) develop kinetic models to characterize UV-C inactivation of Escherichia coli ATCC 25922 (as a surrogate for pathogenic E.coli O157: H7) and Listeria innocua (as a surrogate for the pathogenic Listeria monocytogenes) at different locations inside the special design UV-C unit; 2) investigate the UV-C disinfection efficiency on multiple solid substrates typically encountered in food processing, food handling, and food service environments; 3) predict the spatial germicidal light distribution and microbial inactivation at multiple locations using ray tracing simulations; and 4) validate the numerical predictions using experimental data.
Listeria innocua FSL C2-008 (environmental isolate from a smoked fish plant) and E. coli ATCC 25922 (American Type Culture Collection, Manassas, VA) were stored in glycerol stock solution at −80°C before use. Culture reactivation was conducted by first streaking the frozen culture on Trypticase Soy Agar (TSA; BD Difco, Franklin Lakes, NJ) then incubate it at 37°C for 24 h to obtain isolated colonies, followed by loop-inoculation in 3 mL Tryptic Soy Broth (TSB; BD Difco, Franklin Lakes, NJ) for passage one (37°C, 24 h), and passing 30 μL of grown passage one culture to fresh 3 mL TSB for passage two (37°C, 16 h). To replace TSB with phosphate buffer, the resulting early stationary phase cultures were centrifuged (5000 RPM, 10 min, 21°C) and resuspended in sterile Butterfield Phosphate Buffer (BPB, pH 7.2). This wash step was repeated two more times to ensure minimal remnants of TSB in the final bacterial suspension. The final concentration of bacteria suspended in the BPB was about 109 CFU/mL, for both strains.
A custom-made UV-C enclosure unit (93 cm × 69 cm × 183 cm) was used to perform all inactivation experiments (Figure 1). The apparatus delivers monochromatic 254 nm UV-C light via two cylindrical low-pressure (LP) mercury (Hg) lamps (145 cm length × 1.9 cm diameter, Strahler NNI300/147 XL, Heraeus, Hanau, Germany) placed near the back wall of the unit, with the power output of each lamp being ∼65.5 W (see configuration in Figure 1C). The vent tube on top of the enclosure unit was connected to the air exhaust system to maximize airflow during treatments and avoid ozone accumulation inside the unit. The entire UV-C treatment unit was lined with highly reflective aluminum polyester material (7538T12, McMaster-Carr, Elmhurst, IL) to maximize the light reflection pathways inside and eliminate any potential disturbance from ambient light (see Figure 1C). Inactivation experiments were also performed using fabric curtain material with low reflectivity as a liner, to determine the effect of light reflection on the inactivation efficacy.
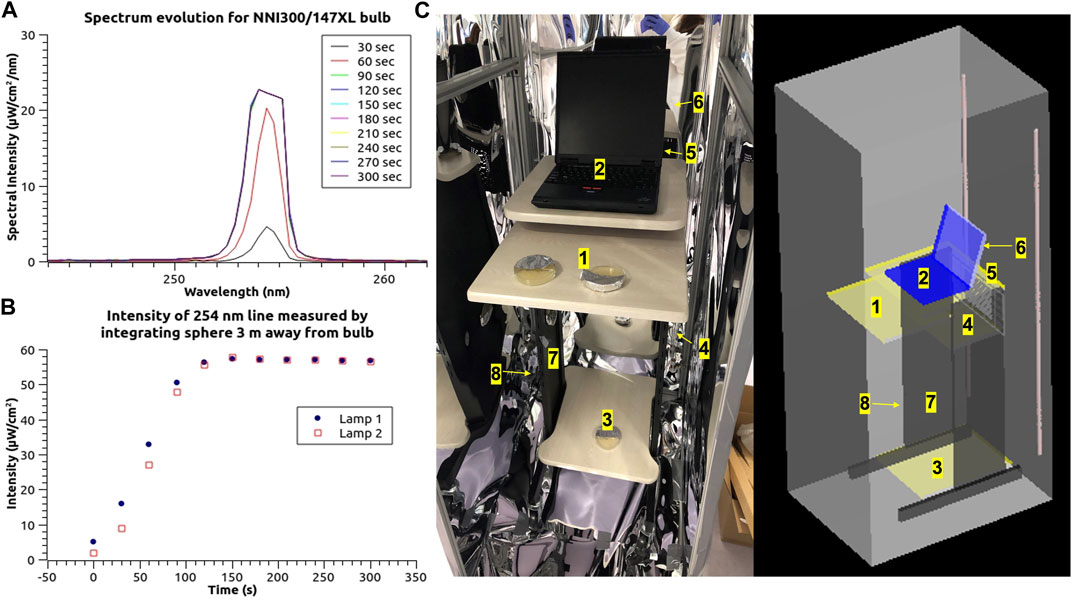
FIGURE 1. Peak emission spectrum (A) and light intensity evolution (B) of the 254 nm UV-C mercury lamps used in this study during the first 300s operation time duration. (C) Photo of the UV-C enclosure unit setup with two 254 nm LP Hg lamps used for the inactivation experiments and 3D computer-aided design (CAD) construction of unit setup with testing locations marked.
To mimic a real-life instrument disinfection scenario, a mobile desk with a laptop on top was placed at the center of the UV-C unit. Different solid substrates were surface inoculated with bacteria and placed at various locations in the unit, followed by exposure to UV-C treatment. Figures 1A, B show the light spectrum and the actual intensity of the 254 nm light, which was measured with an Ocean Optics JAZ USB2000 spectrophotometer/integrating sphere (FOIS-1, Ocean Insight, Rochester, NY). Preliminary measurements of lamp power output were conducted using both the integrating sphere and a Thorlabs PM100USB/S120VC photodiode (Thorlabs, Newton, NJ) (Supplementary Figures S5, S6). After cross-calibration, the integrating sphere was found to produce most accurate readings when capturing the narrow bandwidth light intensity output at 254 nm wavelength, due to its low directional sensitivity for incoming light, and spectroscopic capabilities. The time evolution of the UV spectrum in the wavelength range 230–900 nm was monitored for up to 300 s, to determine the warmup time of the LP Hg lamps (Supplementary Figure S6).
Quantitative inactivation experiments were conducted with samples placed at three distinct locations inside the unit. These locations were strategically chosen to represent varying degrees of exposure to direct UV-C light from the lamps. The first location, designated as #4, was situated on the middle desktop, below the laptop plane, at a considerable distance from the UV lamps and with significant shielding of light due to the desk geometry. The second location, labeled #2, was positioned in the center of the laptop keyboard, with a moderate proximity to the UV lamp. Lastly, the third location, identified as #6, was placed at the back of the laptop screen, in very close proximity to the UV lamp (as depicted in Figure 1C). Several treatment durations were chosen to deliver different cumulative doses of UV-C light: 30, 60, 90, 120, 150, 180 s, corresponding to cumulative fluences of: 3, 7, 10, 13, 16, 20 mJ/cm2 at #4 location; 73, 146, 219, 292, 365, 437 mJ/cm2 at #2 location; and 165, 330, 495, 660, 825, 990 mJ/cm2 at #6 location. All UV-C cumulative fluences were rounded to the nearest digits for subsequent calculations.
Both E. coli and L. innocua cultures were streaked in two parallel lines on tryptic soy agar (TSA) plates of 100 mm diameter. Half of each plate was covered with aluminum foil to divide the surface of the plate and the bacterial streaks into an “Exposed” section and a ‘Covered’ section (Figure 2), followed by exposure to UV-C light for 3 min at locations #1–8, as indicated in Figure 1C. After the UV-C treatment, the plates were incubated at 37°C for 24 h for qualitative evaluation of bacteria inactivation.
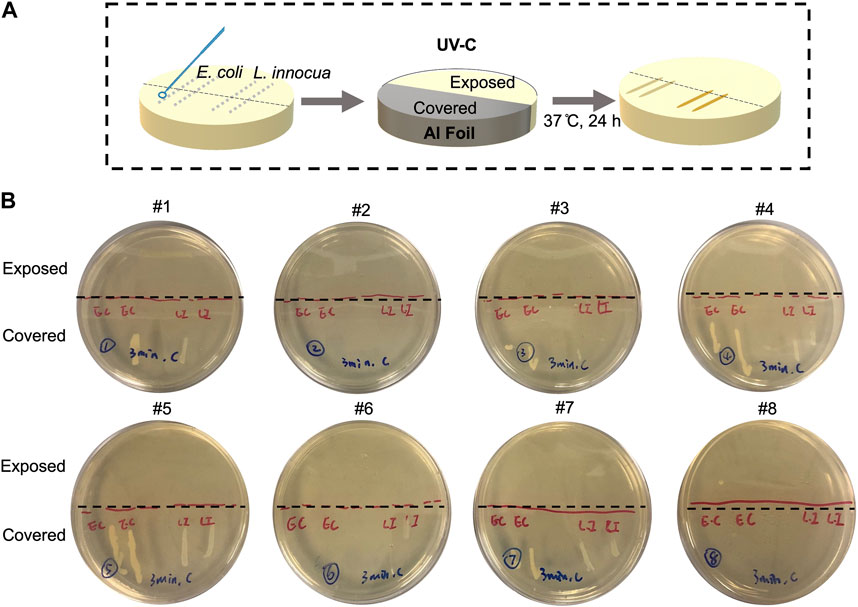
FIGURE 2. Qualitative evaluation of 254 nm UV-C inactivation of Escherichia coli and Listeria innocua at various locations inside the enclosure on TSA agar plates, which mimic nutrient-rich surfaces. (A) Schematic flow chart of the experimental steps. (B) Photos of the agar plates exposed to 3 min of UV-C light at #1-8 test locations after 24 h incubation, showing the differential growth patterns of bacteria streaks with and without UV-C light exposures. The agar area below the black dashed-line was covered by reflective aluminum lining during the UV-C treatment.
Rectangular coupons of the following materials were used as solid substrates: food-grade 304 stainless steel (SS) coupons with a glass bead-blasted finish (50 mm × 100 mm, Fountain Valley, CA), medical-grade 99.999% copper (Cu) metal sheets (30 mm × 40 mm, Puratronic® Alfa Aesar, MA), and copper deposited polymer (CuPoly) sheets (50 mm × 100 mm). These substrates were selected based on their use in food and healthcare industries. Stainless steel is one of the most common contact surface materials in food processing plants (Zaffora et al., 2021), medical-grade copper is usually used in electrical copper-coated devices and components (i.e., wires and cables) (Kumar V. et al., 2021), while copper deposited polymer plastic sheets are often used as cover materials for high touch areas (i.e., protective covers on keyboards) in both food handling and healthcare environments (Kumar A. et al., 2021). Prior to inoculation, all coupons were sequentially sonicated (40 kHz, Branson 1210 Ultrasonic Cleaner, Branson Ultrasonics, Danbury, CT) in acetone (95%, Fisher Scientific, Rochester, NY), ethyl alcohol (95%), and deionized water, for 15 min at each step, to remove any physical, chemical, or microbial contaminants. The cleaned coupons were then rinsed with sterile deionized water and dried at room temperature in a biosafety cabinet. A total of 1 mL bacteria suspension was aliquoted as 20 evenly spaced droplets of 50 µL each on the coupon surfaces. The inoculated coupons were placed in sterile polystyrene Petri dishes (Fisher brand, Pittsburgh, PA) and left in the laminar flow hood (23°C, hood relative humidity = 17%) for 3 h to equilibrate and reach a constant weight without excessive drying (Cheng et al., 2020).
To recover the surviving bacteria from the treated surfaces without affecting their viability, all treated coupons were individually placed in sterile WhirlPak® bags with 99 mL BPB and sonicated for 5 min at 40 kHz (Branson 1210 Ultrasonic Cleaner, Branson Ultrasonics, Danbury, CT) (Bjerkan et al., 2009). Samples were then taken from the resulting BPB, in which the recovered cells were suspended. This cell recovery method has been reported before and was proven to result in minimal recovery losses, with no statistical difference (p > 0.05) among materials (Woodling and Moraru, 2005; Cheng et al., 2020; Chen et al., 2023; Chen and Moraru, 2023). This indicates that any differences in inactivation among the different substrates cannot be attributed to the recovery method, but to the UV-C treatment itself. After sonication, the BPB that contained the recovered cells was subjected to serial ten-fold dilutions with sterile BPB, and enumerated using the standard plate counting method on TSA agar. Plates were incubated at 37°C for 24 h, after which survivors were enumerated, and results were reported as CFU/mL. The control followed the same inoculation, equilibration (3 h at 23°C, and a hood relative humidity of17%), recovery, and enumeration procedures, but did not include the UV-C treatment. Log reduction was calculated using the following equation:
where N0 and N are bacterial counts (in colony forming units per mL of suspension) before and after the UV-C treatment, respectively. When plate counts fell below 25 CFU/plate, a lower dilution was used. Technical duplicates were performed for each coupon, while all UV-C treatments were performed in triplicate, with independently grown bacterial cultures.
The kinetics of microbial inactivation by the 254 nm UV-C treatment was modeled using the Weibull model (Uesugi and Moraru, 2009; Chen and Moraru, 2023):
where N/N0 represents the ratio of survivors after treatment over the initial population, α is the scale parameter, which describes the magnitude of log10 change; and β the shape factor, which describes the shape (i.e., concavity) of the inactivation curves. The α and β were evaluated from the intercept (i.e., log(α)) and slope (i.e., β) of the linear regression of the linearized dataset (i.e.,
Water contact angle measurements on the cleaned and sterilized coupons were performed using a Ramé-Hart 500 Advanced Goniometer/Tensiometer (Ramé-Hart Inc., Succasunna, NJ) with reagent grade deionized water at room temperature, as described before (Woodling and Moraru, 2005). Data was analyzed using the instrument’s DROPimage software. Measurements were performed in triplicate for each material, and average values of contact angles were used as a measure of surface hydrophobicity. Contact angle values smaller than 65° indicate a hydrophilic surface, and values larger than 65° indicate a hydrophobic surface (D. kyun Kim and Kang, 2020). Surface hydrophobicity was used to evaluate the tendency for surface spreading of the liquid inoculum.
Surface roughness of the substrates was measured using a Keyence VK-X260 Laser-Scanning profilometer at the Cornell Center for Materials Research (Ithaca, NY). The following roughness parameters were determined: Sa, the extension of Ra (arithmetical mean height of a line) to a surface, which expresses the average roughness, and represents the difference in height of each point compared to the arithmetical mean; and Sq, the sum of the largest peak height value and the largest pit depth value within the defined area. Measurements were conducted on a 5 mm length of the sample, scanned with an applied stylus force of 4.47 mg. Triplicate measurements were performed for each material.
Ray tracing simulations were conducted using the commercial FRED Optical Engineering Software (Photon Engineering, LLC, AZ). FRED employs a 3D probabilistic ray tracing method to predict the location and direction of ray emanation, and the direction of reflection and transmissions. The software also features a built-in CAD system that enables the user to create and modify the source geometry, and the geometry of the system’s components with which radiation will interact. The simulation tracked the direction and intensity of UV-C rays as they underwent reflection, transmission, and scattering within the unit. Fluence at a given surface was determined by subtracting the energy loss of each ray prior to interacting with that surface from the number of rays reflected. For the ray tracing simulations conducted in this study, FRED Optical Engineering Software relied on the Rendering Equation as the governing equation for integral calculations, which provided a fundamental framework for geometric optics approximations (Kajiya, 1986):
where
Briefly, the UV-C unit design was first geometrically defined in CAD, and simulation was carried out using the forward path tracing method, with rays generated starting from the light sources and bouncing around the objects in system. A total of 100,000 randomly distributed point light sources were assigned to each Hg lamp, with each point light source generating rays in 50 random directions, which resulted in a total of 5 million rays originating from each Hg lamp at the start of the simulation. Surfaces of interest were optically meshed according to the size and location within the unit, typically by 201 × 201 or 101 × 101 pixel sizes, according to the software technical recommendation. The ray tracing calculations modeled the jackets of the UV-C lamps as non-absorbing quartz tubes with a refractive index of 1.5. Figure 6A depicts how light interacted inside the mercury lamp quartz jackets. After light exited the lamp jackets, rays were multiplied by the number of allowed reflection, transmission, and splitting interactions depending on the material properties of the objects that encountered the light rays. Control settings for ray tracing were specified for light generated inside and outside of the lamp jackets (See Supplementary Figure S1 for examples of control). The scattering effect of light rays within the unit was negligible in our calculations, since the inclusion of scattering showed minimal change (p > 0.05) in the ray tracing results during preliminary trials. The objects in the disinfection unit (i.e., desk and computer) were user-defined by specifying their dimensions and reflection coefficients (6.1%–13.4%) (Supplementary Figure S2). The aluminum (Al) unit support beams had a high reflection coefficient (83.9%), which was also accounted for during the simulations. All reflection coefficients were measured using the Cary 5000 UV-VIS-IR spectrophotometer (Cornell University, Cornell Center for Material Research, Ithaca, NY) with triplicate measurements performed for each material. The reflection and absorption properties of the Al polyester linings were characterized using the refractive index of Al at 254 nm wavelength (
To verify the accuracy of the ray tracing simulations, the predicted fluence rate profile was compared with experimental measurements at multiple test locations. An inactivation map was then generated based on the predicted irradiance profile and Weibull inactivation kinetics obtained from the inactivation experiments. The adequacy of the model was evaluated by computing the regression coefficient (R2), root mean square (RMSE), and accuracy factor (Af), as described before (Hsu and Moraru, 2011a). R2 was used to assess how well the model fit the data, with higher values indicating better adequacy and a perfect fit corresponding to R2 = 1. RMSE measured the average deviation between the observed and fitted values, with smaller values indicating a better fit. Af provided a measure of the average difference between observed and predicted values, with Af = 1 indicating a perfect fit and larger values indicating less accuracy.
Mean values of data were obtained from three independent trials, each with technical duplicates (6 values in total). Analyses of variance and post hoc Tukey’s HSD were used to evaluate differences in log reduction, Weibull kinetic parameters, and physical properties among substrate materials and different treatment levels. A confidence level of 95% was adopted for all statistical tests. Multivariate analysis using a stepwise regression model was performed to determine the independent effect of each measured surface physical property on the cumulative inactivation results. All statistical analyses were performed using Minitab software release 20 and MATLAB 2021b (MathWorks, Natick, MA, United States).
The effectiveness of UV-C treatments using the proposed disinfection system in reducing the culturable population of E. coli and L. innocua cells on nutrient-rich agar surfaces is shown in Figure 2. Detailed descriptions of the different test locations shown in Figure 2C can be found in Table 2. A visible decrease in viable bacterial cells was achieved within 3 min of UV-C exposure for both strains, as revealed by the gradual decline in the density of colonies comprising the streaks after incubation. After 3 min of continuous UV-C exposure, no visible L. innocua colonies were observed on the exposed side (not covered by Al foil), and the only visible E. coli colonies on the exposed side were observed at location #8, suggesting possible slower inactivation at this location compared to the others. On the covered side, both strains grew into dense, continuous stripes along the streaking traces, indicating that any cell death observed in the uncovered sections of the plates were due to the UV-C treatment. At selective locations, a slightly fewer colonies were observed near the border between exposed and covered sides, possibly due to partial penetration of UV-C under the edge of the aluminum foil. These qualitative inactivation data on nutritive agar offered useful insights into the disinfection efficacy of the UV-C unit against E. coli and L. innocua. This verification of disinfection performance is important, particularly in the context of the proposed UV-C unit prototype, as it lays the foundation for future commercial applications. A comprehensive analysis on the UV-C disinfection efficacy on various substrates as well as quantitative inactivation data are presented in the following sections.
Three locations were selected for quantitative evaluation of disinfection performance inside the treatment unit, based on their position relative to the UV-C lamps. The central location on the laptop computer keyboard (#2) represented a middle distance from the lamp (∼80 cm spatial proximity), the location on the middle drawer desktop (#4) represented the far distance from the lamp (∼150 cm spatial proximity), and the location on the back of the computer screen (#6) represented the near distance from the lamp (∼40 cm spatial proximity). As shown in Figure 3, significant reduction of both E. coli and L. innocua (p < 0.05) was obtained with increasing cumulative fluences, at all locations, with a slight difference in inactivation levels between the two bacteria. At the furthest location (#4), L. innocua was more readily inactivated than E. coli, and an average of 4.8 ± 0.1 log reduction was achieved after 3 min of treatment (20 mJ/cm2 cumulative fluence), almost double of the level achieved for E. coli (2.7 ± 0.2 log reduction), for the same treatment duration. At the middle location (#2), E. coli and L. innocua demonstrated similar susceptibility to the incident UV-C light, both achieving 6.0 ± 0.4 log reductions after 3 min of continuous treatment (437 mJ/cm2 cumulative fluence). At the nearest location (#6), E. coli reached a higher level of final inactivation, with a 6.9 ± 0.7 log reduction compared with 5.6 ± 0.1 log reduction for L. innocua after 3 min treatment (cumulative fluence of 990 mJ/cm2).
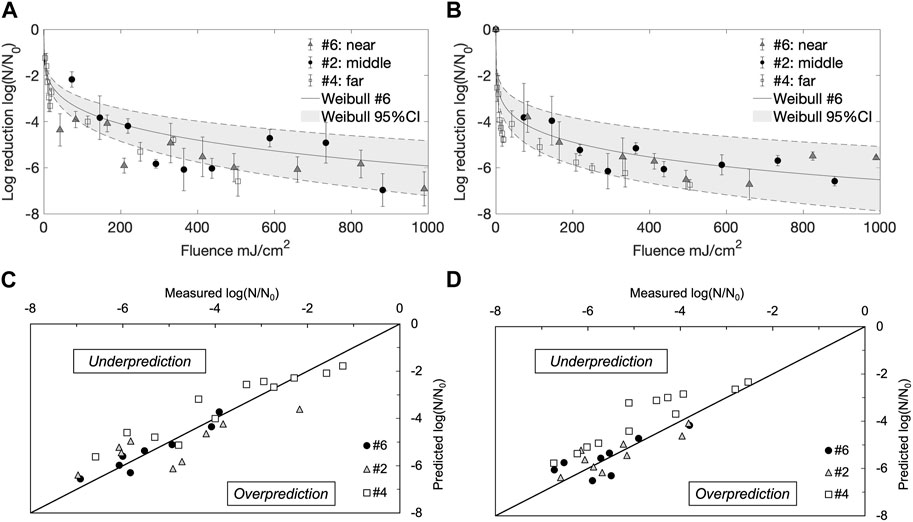
FIGURE 3. 254 nm UV-C inactivation kinetics of Escherichia coli (E.C) and Listeria innocua (L.I) suspended on SS substrates at different distances from lamps: far (#4), middle (#2), and near (#6) locations. Error bars represent standard deviations. Weibull fitted vs. measured plots for (A) Escherichia coli, and (B) Listeria innocua. Fitted vs. measured plots for Escherichia coli (C) and Listeria innocua (D), highlighting the goodness-of-fit for each situation.
Next, the treatment time for locations #4 and #2 were extended beyond 3 min, which resulted in inactivation patterns comparable to the near lamp location (#6). Overall, inactivation curves at all three locations showed a fast initial reduction followed by a gradual plateau around 300 mJ/cm2 cumulative fluence, with similar final reductions reached by both E. coli and L. innocua. The most extensive inactivation data set (at location #6) was fitted with the nonlinear Weibull model to obtain the inactivation kinetics parameters at this location (0.77 ≤ R2 ≤ 0.97, among experimental triplicates). Since similar inactivation patterns were observed across the three locations, the 95% confidence interval (CI) of the Weibull curve was used to describe inactivation kinetics at the other two locations (#4 and #2). Overall, the experimental inactivation data at locations #4 and #2 fit within the 95% CI of the Weibull curve, as seen in Figures 3C, D. However, both Figures 3C, D show that the Weibull model tended to underestimate the inactivation levels at location #4. Some of the possible reasons for the Weibull model underestimation of the inactivation data at #4 location will be discussed next.
To investigate the impact of different substrate materials on the disinfection performance of the UV-C device, E. coli and L. innocua were spot inoculated on two additional solid substrates besides SS: pure copper metal (Cu), and copper deposited polymer plastic sheets (CuPoly), which were then exposed to UV-C light in the middle position of the unit, at location #2 (Figure 4). Significant reduction levels of both bacteria were observed on all substrates, at each applied fluence level (p < 0.05). However, different responses to the germicidal UV-C light were found among the substrates, with the final inactivation effectiveness ranked as follows: SS > Cu > CuPoly. Escherichia coli exhibited higher inactivation variability on the different substrates compared with L. innocua. The reduction of E. coli on SS and Cu showed an almost linear inactivation trend, and reached >6 log reduction after 3 min of treatment, without a visible plateau of the inactivation curve (Figure 4). Conversely, the reduction of E. coli on CuPoly showed a visible plateau after the first 90 s of treatment (219 mJ/cm2 cumulative fluence) and reached a maximum 3.1 ± 0.1 log reduction after 3 min. In line with the visible differences in inactivation patterns on different surfaces, the goodness of fit (R2) with the nonlinear Weibull model also varied among substrates (0.72 ≤ R2 ≤ 0.97) with the lowest fit observed on CuPoly. As shown in Figure 4B, less data variability was seen for inactivation of L. innocua among substrates, with inactivation patterns on different substrates showing similar trends, with a fast initial reduction followed by a gradual plateau. The maximum inactivation levels for L. innocua on SS, Cu, and CuPoly were 6.1 ± 0.3, 5.3 ± 0.3, and 4.5 ± 0.1 log, respectively. Listeria innocua data presented a better conformity with the Weibull model (0.78 ≤ R2 ≤ 0.99) compared with E. coli. The Weibull model parameters for both bacterial strains are shown in Table 1.
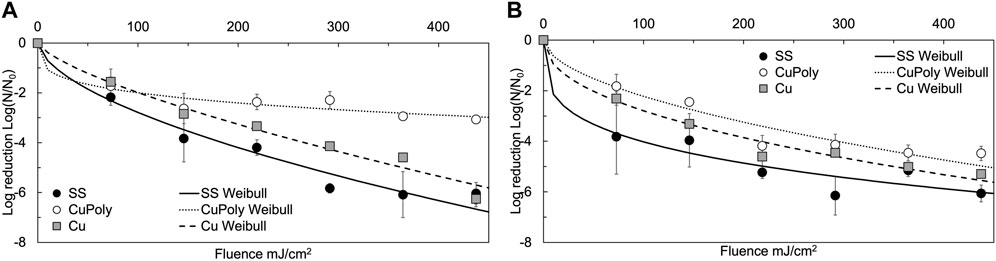
FIGURE 4. 254 nm UV-C inactivation kinetics of (A) Escherichia coli (E.C) and (B) Listeria innocua (L.I) suspended on stainless steel (SS), copper polymer films (CuPoly), and 99.999% pure copper metal (Cu) solid substrates at middle from lamps location (#2). Error bars represent standard deviations.
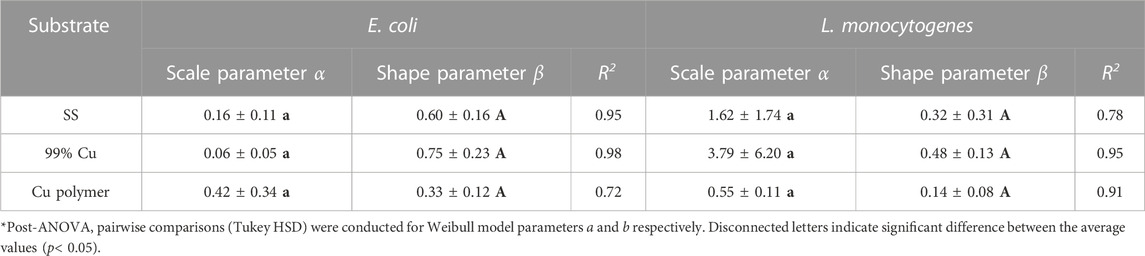
TABLE 1. Weibull model parameters for the UV-C inactivation kinetics of Listeria innocua and Escherichia coli on various solid substrates. *Values represent means ± standard deviations from three replicates.
One important aspect considered in the design and optimization of the UV-C device is how the disinfection responses vary on different solid substrates. We measured the water contact angles and roughness values of the substrates and performed a stepwise multiple regression with these values as independent variables and the experimental inactivation results as dependent variables. As shown in Table 2, the roughness values of CuPoly were the highest (Sa = 1.51 μm and Sq = 16.74 μm), followed by SS (Sa = 1.03 μm and Sq = 11.27 μm), and Cu (Sa = 0.74 μm and Sq = 5.64 μm). Water contact angles followed the order of CuPoly (108.57°) > Cu (88.50°) > SS (31.30°). Differences among materials for both water contact angles and roughness parameters were significant (p < 0.05). A negative correlation was found between surface hydrophilicity and roughness values on one hand and the disinfection efficacy of the 254 nm UV-C light on E. coli and L. innocua on the other hand. A stepwise multiple regression model was used to analyze the impact of solid substrate physical properties on UV-C inactivation, with the cumulative log reduction as the dependent variable and surface physical property parameters as independent variables (Table 2). The results showed that surface physical properties had a significant impact on inactivation in the UV-C disinfection unit used here, with the following decreasing order of R2: for E. coli, Sa > Sq > water contact angle, and for L. innocua: Sq > Sa > water contact angle.

TABLE 2. Left: Measured surface physical properties of the solid substrates including roughness parameters (Sa and Sq in μm) and water contact angles (°). Values represent means ± standard deviations from three replicates. Right: Stepwise multiple regression of the effects of measured surface physical parameters on the accumulative inactivation by 254 nm UV-C treatments for Escherichia coli and Listeria innocua.
The UV-C unit was optimized to maximize light reflection pathways by using an Al polyester lining material with 90.0% ± 1.6% reflectivity, to promote isotropic light propagation and exposure to light from all directions. To quantify the impact of increased light reflection pathways on disinfection performance, control inactivation experiments were conducted using a low reflectivity lining material. Fabric curtains with a reflectivity of 4.1% ± 0.2% were chosen as a control lining material for this purpose. Using the Al lining led to a 150% increase in average light irradiance received by bacteria at location #2 compared to the fabric lining. Which led to differences in inactivation results. As shown in Figure 5, log reduction of E. coli and L. innocua increased by 113%–271% after 3 min UV-C treatment in the presence of the reflective Al lining, demonstrating that increasing light reflection had a substantial strengthening effect on the disinfection performance of the UV-C unit. It is also important to note that the increase in inactivation levels reached by both bacteria were not linearly proportional to the total light irradiance increase received by the sample using Al lining, possibly due to different interactions of bacteria with the complex light distribution patterns (i.e., combination of direct and reflected light rays) inside the unit.

FIGURE 5. Comparison of inactivation of Escherichia coli and Listeria innocua by 254 nm UV-C light on SS substrate at #2 location with different lining materials for the UV-C unit: highly reflective aluminum polyester film, and hospital curtain cloth material.
Figure 6B shows the predicted fluence distribution at multiple locations and the distribution patterns within the unit, with lower predicted fluence in the shaded areas and higher predicted fluence in the more directly exposed areas. To assess the accuracy of the simulation, predicted fluence values at locations #1-8 were compared with experimental fluence measurements, and the differences are shown in Table 3. The predicted fluence values ranged from 0.10 to 5.91 mJ/cm2 at various locations, due to different light absorption, reflection, and scattering interaction patterns with materials within the unit. Previous studies focused on numerical estimation of fluence reported relatively good agreement with experimental data, with deviations of 10%–20% depending on the simulation approach used (Ahmed et al., 2018; Wilde et al., 2020). In this study, better agreement between the predicted and measured fluence were obtained, with deviation averages range between 1.37%–9.15%, depending on the tested location (Table 3). This suggests that ray tracing simulations have potential advantages for fluence modeling relative to other modeling approaches (Ahmed et al., 2018; Wilde et al., 2020).
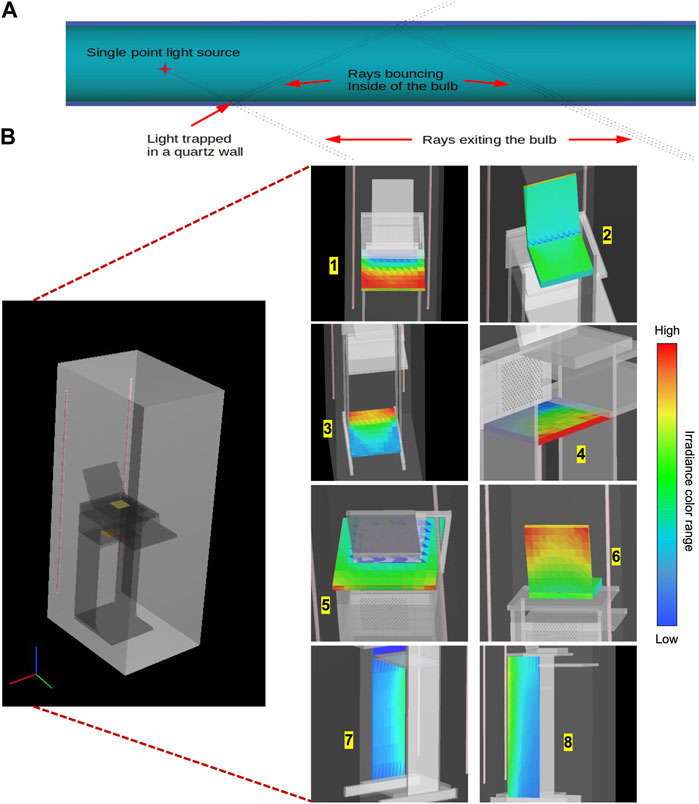
FIGURE 6. (A) Example of multiplication of ray paths inside a LP Hg lamp, surrounded by a quartz jacket. (B) Ray tracing simulation predicted 3D light irradiance distributions at different locations inside the UV-C unit. Blue color indicates lower received fluences at a location, red color indicates higher received fluences.
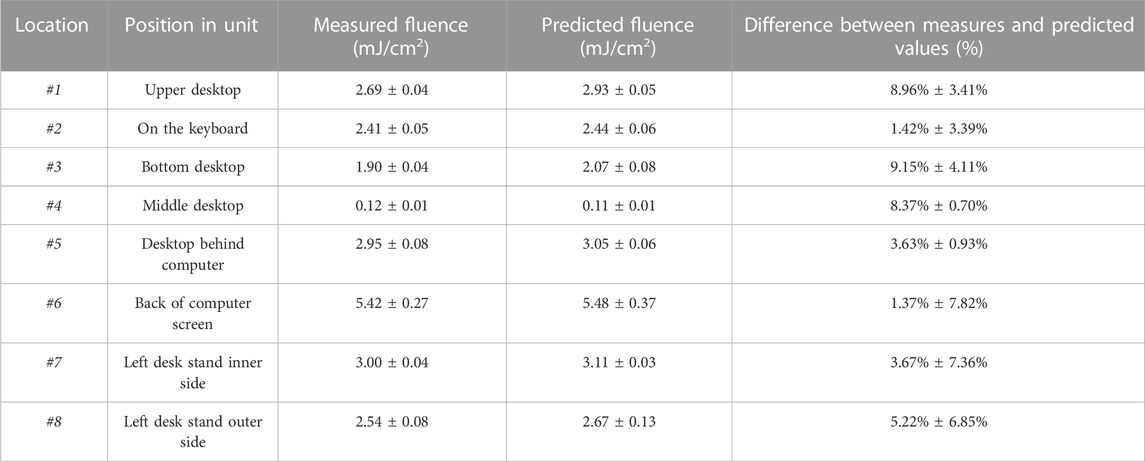
TABLE 3. Experimentally measured and ray tracing simulation predicted light fluence distributions at #1-8 locations inside the UV-C unit. Values represent means ± standard deviations from three replicates.
The light propagation pattern inside the LP Hg UV lamp jackets were also included in the simulation to increase the accuracy of overall emission predictions inside the UV unit. Figure 6A illustrates an example of interactions of rays within the lamp arc, showing that rays emanating from the UV arc within the Hg lamp encounter refraction/Fresnel reflection reactions through the inner and outer surfaces of the lamp, the air/quartz (i.e., inner) surface of the sleeve, and through the quartz/air (i.e., outer) surface of the sleeve. Reflective and transmissive properties of each material in the lamp jackets were specified according to lamp configuration.
In the current study, we ran preliminary tests with different approaches to simulate the ray emissions from the UV source, and selected the emission mechanism that yielded the closest estimates of fluence predictions compared with experimental measurements. The specific parameters used in FRED ray tracing control of light propagation inside the lamp jackets are shown in Supplementary Figure S1. Other efforts were made to reduce the potential deviation of ray tracing simulation from the experimental fluence measurements, such as validating the actual lamp power output during treatment time and crosschecking the direct light ray energy distribution by simulating a luminophore at 3 m away from the UV source. Details of these calculations are explained in Supplementary Figures S3, S4.
With both the spatial distribution of fluence and the Weibull inactivation kinetics known, it was possible to calculate the average microbial inactivation that can be expected for bacteria exposed to a given UV dose (fluence) during the disinfection treatment. First, numerical ray tracing fluence simulations were performed at locations #2, #4, and #6, with a UV treatment time of 120 s, which was chosen to minimize the effect of lamp output fluctuations in the first 90 s of operation. Next, the microbial inactivation kinetics equation (Eq. (2)), was coupled with the predicted fluence values and used to generate 3D inactivation maps at each location for both E. coli and L. innocua (Figure 7). As shown in Figure 7, the reduction levels decreased as vertical distance from the lamps increased and as shading effects from physical objects inside the unit increased. Additionally, the level of inactivation varied along the x- and y-axes, even when the target analytical surface material stayed constant, which was a direct artifact of uneven spatial distribution of fluence. The highest levels of inactivation at all locations, represented by the deep blue color, occurred in the area with easiest access to direct light exposure (i.e., on the open keypad area of the laptop). The yellow and green colors in the inactivation map indicated lower inactivation levels in areas that experienced a lower dose of total light energy due to shading and potential energy loss during light propagation inside the unit. Interestingly, the variability in the inactivation was less pronounced along the y-axis as compared to the x-axis, at all three locations, highlighting the importance of sample location based not only on absolute distance from the lamp, but also on their position relative to the optical center of the lamp.

FIGURE 7. Examples of 3D side and top views of ray tracing simulation predicted inactivation distribution map of Escherichia coli at three tested locations (#2: on the keyboard, #4: middle desktop, #6: back of computer) over the ray tracing simulation area of 25 cm × 30 cm size at continuous UV-C light treatment time of 120 s. Dark blue indicates higher level of log reductions, yellow and green indicates lower levels of log reductions. Red dashed areas indicate the target analytical surface areas in each simulation.
The accuracy of the predicted inactivation data was validated at all three locations by comparing the calculated volumetric inactivation averages with the experimentally determined inactivation data. Figure 8 shows such a comparison. The accuracy parameters of the predictive model were determined, and for E. coli at different locations R2 = 0.87–0.97, RMSE = 0.13–0.52 and Af = 1.00–1.02, while for L. innocua at different locations the values of these parameters were R2 = 0.85–0.95, RMSE = 0.21–0.59 and Af = 1.01–1.02. The average deviation between predictive and experimental measured inactivation levels was within
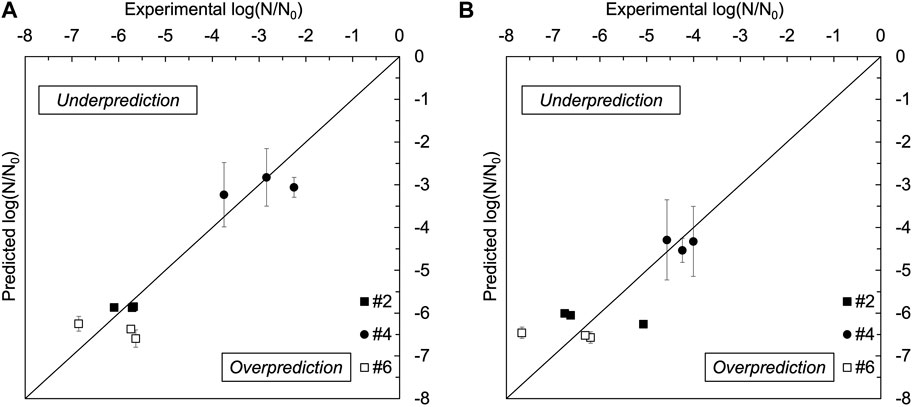
FIGURE 8. Experimental vs. simulation predicted log reductions by UV light treatment for Escherichia coli (A) and Listeria innocua (B) suspended on stainless steel coupons at #2, #4, and #6 locations. Error bars represent one standard deviation of the data.
This study demonstrates that the disinfection performance of the 254 nm UV-C light can be maximized using our special design unit, in which all-directional germicidal light pathways were constructed by employment of highly reflective unit linings. Both experimental and simulation approaches facilitated the design of the unit, and verified the unit effectiveness in deactivating E. coli and L. innocua across diverse substrates and locations. Gram-positive bacteria like Listeria are generally recognized as more resistant to UV-C radiation compared with Gram-negative bacteria in the literature, due to the presence of thicker cell walls that could impede UV light penetration (D.-K. Kim et al., 2017). However, this study did not reveal consistent trends in bacterial susceptibility to UV-C light comparing across various locations. Gram-negative E. coli was proven to be more susceptible than Gram-positive L. innocua at #6 location where most UV-C light originated from direct lamp exposure, consistent with literature trends. However, interestingly, Gram-positive L. innocua exhibited greater susceptibility to UV-C light compared to Gram-negative E. coli at location #4, where most of the UV-C light came from reflected sources. This observation suggests the delivery format (i.e., direct vs. indirect) of germicidal light could potentially influence bacterial susceptibility to the UV-C treatment. Comprehensive future studies with a range of Gram-positive and Gram-negative bacteria, particularly pathogenic strains, are needed to assess if the all-directional UV-C exposure with both direct and indirect light has an impact on bacterial susceptibility.
In the inactivation experiments at various locations, most inactivation data at #4 and #2 locations aligned well within the 95% CI of the Weibull model developed based on experimental inactivation data from #6 location, suggesting similar kinetic behaviors of bacterial inactivation levels and the treatment consistency across locations. However, it is important to acknowledge the deviation observed in the Weibull model’s fitting, particularly the underestimation of the inactivation levels achieved at location #4. This underestimation could be attributed to the unique multi-directional light distribution patterns within the unit, where the desk configuration partially obstructed direct light from the Hg lamps at location #4. Consequently, inactivation at this location was predominantly due to exposure to reflected light from various angles within the unit, potentially enhancing the inactivation effect beyond what the Weibull model accounted for. The substantial bacterial inactivation achieved at #4 location, despite limited direct light access, exemplifies the disinfection enhancement achieved by our all-directional light distribution approach.
It has been previous reported that different solid surface physical properties may impact the disinfection responses in UV-C germicidal treatments (D. kyun Kim and Kang, 2020). In this study, a negative correlation was found between surface hydrophilicity and roughness values as independent variables and the disinfection efficacy of the 254 nm UV-C light on E. coli and L. innocua on the dependent variables. Differing hydrophobicities were shown to influence bacterial aggregation and distributions on surfaces, with hydrophobic surfaces causing bacterial stacking and shading effects, thus slowing inactivation rates (Woodling and Moraru, 2005). The more hydrophilic SS substrate facilitated even spreading of the bacterial suspension during inoculation, and thus a more uniform light exposure of the bacteria, resulting in the highest inactivation of E. coli and L. innocua on this substrate. Conversely, the lowest and slowest inactivation of both bacteria occurred on the most hydrophobic CuPoly surfaces.
Surface roughness is another physical property that affects the disinfection performance by light treatments, since crevices and cracks on a surface can provide hiding places for microorganisms, blocking the access of light. Therefore, surfaces with low roughness values are generally considered more hygienic (Woodling and Moraru, 2005). In line with the literature evidence, we found a negative correlation between surface roughness and UV-C inactivation of E. coli and L. innocua. As the roughness increased in the order CuPoly, Cu, and SS, the bactericidal effect by UV-C light gradually increased in the same order. The stepwise regression data further suggested that surface roughness and water contact angles both affect inactivation patterns, but roughness parameters were suggested to be better predictors of UV-C inactivation performance than the surface hydrophobicity characteristics (i.e., water contact angle) tested in this study. However, further experiments are needed to test and validate this hypothesis rigorously, potentially involving a range of substrates with varying roughness and hydrophobicity to assess their impact on UV-C disinfection performance comprehensively.
In practical applications, the necessary UV-C treatment duration is usually determined based on the lowest fluence values at the most shaded location of the treatment area to ensure sufficient treatment effectiveness. However, this process can be time-consuming and challenging, especially in shaded or hidden locations. Hence computational methods can be very useful for predicting fluence levels and distribution inside a light-based treatment system (Hsu and Moraru, 2011a; Hsu and Moraru, 2011b). In our study, alterations in light distribution patterns, due to multiple reflection pathways within the UV-C unit, challenged the conventional decay pattern of fluence with distance from the UV lamp, making fluence distribution complex and its prediction challenging.
To address this complexity, we employed the ray tracing simulation to predict the fluence distribution within the UV-C unit, while considering the reflective lining, the laptop and desk configuration, and the specifics of the LP Hg lamps. There are potential sources of error, such as UV lamp power fluctuations during warmup periods, shape of integration sphere detector influencing fluence measurement in some locations (Supplementary Figure S5), and small gaps between Al lining and unit frames, could affect simulation accuracy. However, it should be noted that several measures were taken to ensure the high accuracy of the ray tracing predictions in this study. One such effort was accounting for potential shadow effects throughout the ray tracing simulation, as rays blocked by shadowing surfaces (e.g., support structures) were forced to find a new emanation point. Another effort was to accurately model light propagation inside the LP Hg UV lamp jackets. It is worth noting that most fluence rate numerical models do not explicitly model the UV lamp arc. For example, the commonly used Discrete Ordinates model for radiation intensity calculations focuses solely on radiation from the sleeve’s outer surface, omitting lamp geometry, the air annulus, or the quartz sleeve’s thickness (Ahmed et al., 2018). Other numerical models may account for the interaction of rays through the quartz sleeve surface (i.e., air/quartz), but still disregard the actual dimensions and the physical features of the lamp (Ahmed et al., 2018).
The ray tracing results demonstrated promising potential of using a numerical tool to make light distribution predictions within the unit, thus offering processors and manufacturers the ability to anticipate disinfection outcomes based on fluence predictions. The accuracy of inactivation predictions was cross-checked using multiple accuracy parameters (i.e., R2, RMSE, Af), revealing small deviations between experimental inactivation data and predicted inactivation data across different locations (Figure 8). This alignment underscored the reliability of the ray tracing fluence simulation method and the numerical inactivation predictions for both bacteria tested, with no systematic trend of over- or underestimation noted. Nevertheless, it is important to note that light reflection patterns may vary depending on the instruments and equipment treated within the UV unit, and different light sources used (i.e., LP Hg lamp vs. LED panels). Therefore, ray tracing simulations should be tailored to the specific characteristics of the disinfection system. Additionally, increasing the dataset size could further enhance prediction accuracy. These findings offer valuable insights to improve the unit design and enhance its applicability in the food and healthcare industries.
This research highlights the promising application of an all-directional UV-C exposure disinfection unit operating at 254 nm for food processing, food handling, and healthcare environments. The unique isotropic design of the UV-C unit enabled a more uniform distribution of light energy during treatment, which led to improved antimicrobial outcomes. Our results also demonstrated the feasibility and the advantage of using numerical methods to predict the level and distribution of UV inactivation inside the treatment chamber, by considering the spatial distribution of fluence and inactivation kinetics for specific microorganisms and substrates. The ray tracing simulation demonstrated high accuracy in predicting fluence distribution with complex light propagation patterns, which led to reliable numerical prediction of the disinfection outcomes within the UV unit. Further refinement of the predictive model with more complex unit setups, including curved surfaces and with different light sources, is necessary to optimize the UV-C unit and prepare its employment in practical settings.
The raw data supporting the conclusions of this article will be made available by the authors, without undue reservation.
HC, VP, and CM conceptualized and designed the experiments. HC and VP conducted the experiments. HC analyzed the data and wrote the manuscript. HC, VP, and CM edited and revised the manuscript. All authors contributed to the article and approved the submitted version.
This project was made possible by funding from the National Science Foundation (NSF PFI 1919203).
The authors would like to thank Ryan Irvin and staff at Photon Engineering LLC for providing the license to use the FRED optical simulation software free of charge, and their technical assistance during the optical simulations. This work made use of the Cornell Center for Materials Research Shared Facilities which are supported through the NSF MRSEC program (DMR-1719875). The authors also acknowledge Dr. S. M.Islam, who contributed to the initiation of the project.
The authors declare that the research was conducted in the absence of any commercial or financial relationships that could be construed as a potential conflict of interest.
All claims expressed in this article are solely those of the authors and do not necessarily represent those of their affiliated organizations, or those of the publisher, the editors and the reviewers. Any product that may be evaluated in this article, or claim that may be made by its manufacturer, is not guaranteed or endorsed by the publisher.
The Supplementary Material for this article can be found online at: https://www.frontiersin.org/articles/10.3389/frfst.2023.1223829/full#supplementary-material
Ahmed, Y. M., Jongewaard, M., Li, M., and Blatchley, E. R. (2018). Ray tracing for fluence rate simulations in ultraviolet photoreactors. Environ. Sci. Technol. 52 (8), 4738–4745. doi:10.1021/acs.est.7b06250
Akgün, M. P., Pelvan, M., and Ünlütürk, S. (2017). Effects of ultraviolet light emitting diodes (LEDs) on microbial and enzyme inactivation of apple juice. Int. J. Food Microbiol. 260, 65–74. doi:10.1016/j.ijfoodmicro.2017.08.007
Allegranzi, B., Bagheri Nejad, S., Combescure, C., Graafmans, W., Attar, H., Donaldson, L., et al. (2011). Burden of endemic health-care-associated infection in developing countries: systematic review and meta-analysis. Lancet 377 (9761): 228–241. doi:10.1016/S0140-6736(10)61458-4
Bintsis, T., Litopoulou-Tzanetaki, E., and Robinson, R. K. (2000). Existing and potential applications of ultraviolet light in the food industry - a critical review. J. Sci. Food Agric. 80(6):637-645. doi:10.1002/(SICI)1097-0010(20000501)80:6<637::AID-JSFA603>3.0.CO;2-1
Bjerkan, G., Witso, E., and Bergh, K. (2009). Sonication is superior to scraping for retrieval of bacteria in biofilm on titanium and steel surfaces in vitro. Acta Orthop. 80 (2), 245–250. doi:10.3109/17453670902947457
Blatchley, E. R. (1997). Numerical modelling of UV intensity: application to collimated-beam reactors and continuous-flow systems. Water Res. 31 (9): 2205–2218. doi:10.1016/S0043-1354(97)82238-5
Chen, H., Cheng, Y., and Moraru, C. I. (2023). Blue 405 nm LED light effectively inactivates bacterial pathogens on substrates and packaging materials used in food processing. Sci. Rep. 13, 15472. doi:10.1038/s41598-023-42347-z
Chen, H., and Moraru, C. I. (2023). Exposure to 222 Nm far UV-C effectively inactivates planktonic foodborne pathogens and inhibits biofilm formation. Innovative Food Sci. Emerg. Technol. 87, 103411. doi:10.1016/j.ifset.2023.103411
Chen, H., and Moraru, C. I. (2023). Synergistic effects of sequential light treatment with 222-nm/405-nm and 280-NM/405-nm wavelengths on inactivation of foodborne pathogens. Appl. Environ. Microbiol. 13, 15472. doi:10.1128/aem.00650-23
Cheng, Y., Chen, H., Sánchez Basurto, L. A., Protasenko, V. V., Bharadwaj, S., Islam, M., et al. (2020). Inactivation of Listeria and E. Coli by deep-UV LED: effect of substrate conditions on inactivation kinetics. Sci. Rep. 10, 3411. doi:10.1038/s41598-020-60459-8
Dewey-Mattia, D., Manikonda, K., Hall, A. J., Wise, M. E., and Crowe, S. J. (2018). Surveillance for foodborne disease outbreaks - United States, 2009-2015. Morb. Mortal. Wkly. Rep. Surveillance Summ. 67 (10), 1–11. doi:10.15585/mmwr.ss6710a1
Fung, F., Wang, H.-S., and Menon, S. (2018). Food safety in the 21st century. Biomed. J. 41 (2): 88–95. doi:10.1016/j.bj.2018.03.003
Guerrero-Beltrán, J. A., and Barbosa-Cánovas, G. V. (2005). Reduction of Saccharomyces cerevisiae, Escherichia coli and Listeria innocua in apple juice by ultraviolet light. J. Food Process Eng. 28, 437–452. doi:10.1111/j.1745-4530.2005.00040.x
Guridi, A., Sevillano, E., de la Fuente, I., Mateo, E., Eraso, E., and Quindós, G. (2019). Disinfectant activity of A portable ultraviolet C equipment. Int. J. Environ. Res. Public Health 16 (23), 4747. doi:10.3390/ijerph16234747
Hsu, L., and Moraru, C. I. (2011a). A numerical approach for predicting volumetric inactivation of food borne microorganisms in liquid substrates by pulsed light treatment. J. Food Eng. 105 (3): 569–576. doi:10.1016/j.jfoodeng.2011.03.025
Hsu, L., and Moraru, C. I. (2011b). Quantifying and mapping the spatial distribution of fluence inside a pulsed light treatment chamber and various liquid substrates. J. Food Eng. 103 (1): 84–91. doi:10.1016/j.jfoodeng.2010.10.002
Jacobm, S. M., and Dranoff, J. S. (1970). Light intensity profiles in a perfectly mixed photoreactor. AIChE J. 16 (3): 359–363. doi:10.1002/aic.690160309
Jeon, M.-J., and Ha, J.-W. (2018). Efficacy of UV-A, UV-B, and UV-C irradiation on inactivation of foodborne pathogens in different neutralizing buffer solutions. LWT 98, 591–597. doi:10.1016/j.lwt.2018.09.030
Kajiya, J. T. (1986). The rendering equation. SIGGRAPH Comput. Graph. 20 (4), 143–150. doi:10.1145/15886.15902
Kim, D.-k., and Kang, D.-H. (2020). Effect of surface characteristics on the bactericidal efficacy of UVC LEDs. Food control. 108, 106869. doi:10.1016/j.foodcont.2019.106869
Kim, D-K., Kim, S-J., and Kang, D-H. (2017). Bactericidal effect of 266 to 279nm wavelength UVC-LEDs for inactivation of gram positive and gram negative foodborne pathogenic bacteria and yeasts. Food Res. Int. 97: 280–287. doi:10.1016/j.foodres.2017.04.009
Koca, N., Urgu, M., and Saatli, T. E. (2018). “Ultraviolet light applications in dairy processing,” in Technological approaches for novel applications in dairy processing. doi:10.5772/intechopen.74291
Kumar, A., Choudhary, A., Kaur, H., Mehta, S., and Husen, A. (2021). Metal-based nanoparticles, sensors, and their multifaceted application in food packaging. J. Nanobiotechnology 19 (1), 256. doi:10.1186/s12951-021-00996-0
Kumar, V., Pandita, S., Singh Sidhu, G. P., Sharma, A., Khanna, K., Kaur, P., et al. (2021). Copper bioavailability, uptake, toxicity and tolerance in plants: a comprehensive review.” Chemosphere 262: 127810. doi:10.1016/j.chemosphere.2020.127810
Lau, J., Bahnfleth, W., Mistrick, R., and Kompare, D. (2012). Ultraviolet irradiance measurement and modeling for evaluating the effectiveness of in-duct ultraviolet germicidal irradiation devices. HVAC\&R Res. 18 (4), 626–642. doi:10.1080/10789669.2011.611575
Liltved, H., and Landfald, B. (2000). Effects of high intensity light on ultraviolet-irradiated and non-irradiated fish pathogenic bacteria. Water Res. 34, 481–486. doi:10.1016/S0043-1354(99)00159-1
Prado, D. B. D., Szczerepa, M. M. D. A., Capeloto, O. A., Astrath, N. G. C., Santos, N. C. A. D., Previdelli, I. T. S., et al. (2019). Effect of ultraviolet (UV-C)radiation on spores and biofilms of alicyclobacillus spp. in industrialized orange juice. Int. J. Food Microbiol. 305, 108238. doi:10.1016/j.ijfoodmicro.2019.108238
Sastry, S. K., Datta, A. K., and Worobo, R. W. (2000). Ultraviolet light. J. Food Sci. 65, 90–92. doi:10.1111/j.1750-3841.2000.tb00623.x
Uesugi, A. R., and Moraru, C. I. (2009). Reduction of Listeria on ready-to-eat sausages after exposure to a combination of pulsed light and nisin. J. Food Prot. 72 (2), 347–353. doi:10.4315/0362-028x-72.2.347
Ward, G. J. (1994). “The RADIANCE lighting simulation and rendering system” in Proceedings of the 21st Annual Conference on Computer Graphics and Interactive Techniques, New York, NY, USA: Association for Computing Machinery, 459–472. SIGGRAPH ’94. doi:10.1145/192161.192286
Wilde, J. P., Baer, T. M., and Hesselink, L. (2020). Modeling UV-C irradiation chambers for mask decontamination using zemax OpticStudio. Appl. Opt. 59 (25), 7596–7605. doi:10.1364/AO.402603
Woodling, S. E., and Moraru, C. I. (2005). Influence of surface topography on the effectiveness of pulsed light treatment for the inactivation of Listeria innocua on stainless-steel surfaces. J. Food Sci. 70 (7), m345–m351. doi:10.1111/j.1365-2621.2005.tb11478.x
World Health Organization (2016). Food-borne disease burden epidemiology reference group. FOODBORNE DISEASE BURDEN EPIDEMIOLOGY REFERENCE GROUP 2007-2015. doi:10.1007/978-3-662-43978-4_3884
Wright, J. R., Sumner, S. S., Hackney, C. R., Pierson, M. D., and Zoecklein, B. W. (2000). Efficacy of ultraviolet light for reducing Escherichia coli O157:H7 in unpasteurized apple cider. J. Food Prot. 63, 563–567. doi:10.4315/0362-028X-63.5.563
Keywords: UV-C disinfection, microbial inactivation, ray tracing simulation, Weibull kinetics, E. coli, Listeria
Citation: Chen H, Moraru CI and Protasenko VV (2023) Maximizing the disinfection effectiveness of 254 nm UV-C light with a special design unit: simulation and experimental approaches. Front. Food. Sci. Technol. 3:1223829. doi: 10.3389/frfst.2023.1223829
Received: 16 May 2023; Accepted: 18 October 2023;
Published: 30 October 2023.
Edited by:
Aldonza Jaques, Federico Santa María Technical University, ChileReviewed by:
Manreet Singh Bhullar, Kansas State University Olathe, United StatesCopyright © 2023 Chen, Moraru and Protasenko. This is an open-access article distributed under the terms of the Creative Commons Attribution License (CC BY). The use, distribution or reproduction in other forums is permitted, provided the original author(s) and the copyright owner(s) are credited and that the original publication in this journal is cited, in accordance with accepted academic practice. No use, distribution or reproduction is permitted which does not comply with these terms.
*Correspondence: Carmen I. Moraru, Y2ltMjRAY29ybmVsbC5lZHU=; Vladimir V. Protasenko, dnZwN0Bjb3JuZWxsLmVkdQ==
Disclaimer: All claims expressed in this article are solely those of the authors and do not necessarily represent those of their affiliated organizations, or those of the publisher, the editors and the reviewers. Any product that may be evaluated in this article or claim that may be made by its manufacturer is not guaranteed or endorsed by the publisher.
Research integrity at Frontiers
Learn more about the work of our research integrity team to safeguard the quality of each article we publish.