
94% of researchers rate our articles as excellent or good
Learn more about the work of our research integrity team to safeguard the quality of each article we publish.
Find out more
ORIGINAL RESEARCH article
Front. Food. Sci. Technol., 22 December 2023
Sec. Food Process Design and Engineering
Volume 3 - 2023 | https://doi.org/10.3389/frfst.2023.1154305
 Viviane De Buck1
 Mihaela I. Sbarciog1,2
 Jef Cras1
 Satyajeet S. Bhonsale1
 Monika Polanska1
 Jan F. M. Van Impe1*
Biorefinery systems that are embedded in their local setting provide an attractive framework for the valorisation of locally available food- and other bio-waste streams. They can aid in the provision of local bio-waste processing facilities as well as the targeted revalorisation of local bio-waste feedstocks by converting them in locally desired biorefinery products. Since food- and other bio-waste feedstocks are often diffuse feedstocks, small-scale biorefineries that are tailored for their local setting are the most suitable biorefining system for their processing. Whereas small-scale biorefineries cannot rely on the economy-of-scale to be an economic sustainable endeavour, they need to be meticulously optimised according to multiple sustainability objectives. These objectives can be of economic, societal, or environmental nature. A commonly used optimisation criterion in these problems is the energy requirements of the entire biorefinery system. For many commonly used biorefinery processes mass balance models are available (which are often mechanistic models), however, energy balances are difficult to obtain. Chemical process simulators, like Aspen Plus, provide an extensive toolkit to easily model the mass- and energy balances of a multitude of chemical processes. However, especially in the context of multi-objective optimisation, the obtained white-box models are too complex to simulate the considered processes efficiently consecutively. Therefore, in this contribution, a critical analysis is presented of the use of white-box versus the black-box models in the context of the multi-objective optimisation of a small-scale biorefinery. An in-house developed biorefinery network is re-modelled in Aspen Plus and used as a digital twin for the development of a surrogate model. Eventually, the modelled biorefinery network is optimised using both models and a comprehensive evaluation is drafted.
Historically, the necessity for (local) biorefinery systems has been justified using the argument of climate change (Aristizábal-Marulanda et al., 2021; Solarte-Toro and Cardona Alzate, 2021; Kaur et al., 2022). Climate change, and its increasingly more present implications on the environment, supplies and services, and our lifestyles, has forced the global community to look for novel and sustainable ways to provide for our current needs in resources whilst simultaneously reducing their impact on the planet and future generations. Biorefineries allow for converting the dense structure of lignocellulosic biomass into value-added and desirable products. By doing so, the need for extracting additional raw fossil materials is being avoided. The (historic) intensive usage of fossil raw materials by humankind has caused our climate to become hotter and more unpredictable (IPCC, 2021). Supplying novel methods to support the world’s energy and material requirements without further contributing to continued heating of the climate is one of the most important tasks to tackle climate change in the long run (Solarte-Toro and Cardona Alzate, 2021). The further development of biowaste biorefineries would enable communities to revalorise their available biowaste-streams, allowing them to provide themselves in the local needs of biorefinery products (e.g., biogas, compost, fertiliser) without needing to extract additional fossil carbon (Kolfschoten et al., 2014; Moretti et al., 2022).
Furthermore, biowaste biorefineries would allow (local) authorities to become increasingly more self-sufficient regarding their energy- and resource provision, decoupling their prosperity from that of the limited number of oil- and gas-producing countries in the world (Kolfschoten et al., 2014; Clauser et al., 2016). Moreover, as the proposed biorefinery would use a waste stream as its main feedstock, the plant in question would also contribute to local waste management (Leong et al., 2021). The initially considered target region is the densely populated region of Flanders, Belgium. In 2020, 674,588 tonnes of lignocellulosic biowaste have been collected in the considered region. Since 2013, the average total amount of annually collected lignocellulosic biowaste amounted to 699,285 ± 24,634 tonnes per year, most of which is being composted (OVAM, 2021). Although composting is already a commonly-used biowaste biorefining process, there are a multitude of further biorefining processes available to convert lignocellulosic biowaste into a legion of biorefining products (Clauser et al., 2016; De Buck et al., 2020; Aristizábal-Marulanda et al., 2021).
As a result of their obvious potential benefits regarding local self-sufficiency and climate change mitigation, the field of study on biorefineries has gradually increased the past decade(s) (De Visser and Van Ree, 2016; Leong et al., 2021). One of the most commonly cited challenges regarding biorefineries is their overall energy consumption. When the energy consumption of the biorefinery exceeds the energy it is creating, the climate change mitigatory effect of the biorefinery is nullified. Nonetheless, few energy models of biorefinery (unit operations) are available in literature. The development of energy models, in order to be able to perform in-depth performance analysis and optimisations of proposed biorefinery layouts, has often been coined as an essential next step in this field of study.
In addition to a limited overall energy consumption, it is equally essential for a biorefinery design to be economically viable, i.e., the returned profit exceeds the (fixed) costs that are paired with the operation of the plant (Solarte-Toro and Cardona Alzate, 2021; di Chen et al., 2018; Senthil Rathi et al., 2022). Given that these two objectives, i.e., the minimisation of the plant’s energy consumption and the maximisation of the generated profit, must be simultaneously considered, the optimal design of an energy efficient and simultaneously profitable biorefinery should be considered as a multi-objective optimisation problem.
In this contribution, the multi-objective optimisation of a small-scale and flexi-feed biorefinery is considered. The considered biorefinery design was previously presented by Sbarciog et al. (2022) and is specifically tailored for the considered Flemish setting. Small-scale biorefineries outperform their large-scale counterparts by being specifically designed for the (small) local area they serve. However, because of their limited production scale and, thus, incapability of processing high quantities of feedstock, it is crucial they are operated as optimally as possible to maximally increase profit-margins. A profitable (SS)BR (or any process for that matter) is one that produces the best quality and quantity of products, whilst consuming the least amount of energy and other consumables. This bivalent goal is translated in this contribution to two objectives that are being considered simultaneously: i) minimising the consumed energy of the proposed SSBR, and ii) maximising the generated profit. One of the main challenges, however, is modelling the energy consumption of proposed biorefinery design (De Buck et al., 2020; Aristizábal-Marulanda et al., 2021). In order to be able to make a sufficiently accurate assessment of the consumed energy of the proposed biorefinery design, an Aspen Plus model is developed. The considered biorefinery network was previously presented in Sbarciog et al. (2022) is re-considered in this contribution. The Aspen Plus (A+) model is based on the mass-balance models presented in Sbarciog et al. (2022) and, in combination with the latter, will allow for simultaneously modelling the biorefinery’s mass yields as well as its energy consumption. Notwithstanding major efforts have already been made in the context of modelling the energy consumption of a multitude of biorefinery designs (e.g., Davis et al. (2016) developed an Aspen Plus model of an algal biorefinery; Humbird et al. (2011); Davis et al. (2015) developed Aspen Plus models for the dilute-acid and enzymatic treatment of lignocellulosic biomass; Nguyen (2014) developed an Aspen Plus model of the anaerobic digestion process (which is considered in the studied biorefinery network)), a thorough literature review did not reveal any energy, or Aspen Plus models, of the additional processes of the considered biorefinery network.
Even though A+ is capable of approximating the energy consumption of a modelled design, it also displays two major drawbacks. Firstly, the usage of A+ (or any other proprietary software) as a simulation platform limits the application potential of the obtained energy-model as it can only be used within the A+ software environment. Although it is possible to access an Aspen Plus model from an optimisation platform like MATLAB or Python, using communication software like INPROP, as presented in Muñoz López et al. (2018), major hurdles still occur when considering licensing. Moreover, A+ and other chemical simulation platforms are notorious for being slow. Especially when there is a need for a high number of consecutive simulations of the same process, being it with different control settings, the overall simulation time can easily increase to an unpractical amount. In consideration of both of these drawbacks, the second part of this contribution focusses on the initial steps towards the development of a surrogate model of the developed Aspen Plus energy-model. The surrogate model is developed based on data obtained from the original Aspen Plus model. As it is being developed away from the Aspen Plus environment, it has no need for the dedicated simulation environment and is simultaneously considerably faster. The effectiveness of the developed surrogate models will be illustrated by repeating the same multi-objective optimisation problem and comparing the obtained results with those obtained when using the original Aspen Plus model.
As an extension of the introduction, Section 1.1 briefly re-introduces the in-house developed biorefinery network, which was initially presented in Sbarciog et al. (2022). Section 1.2 discusses the concept of black-box modelling and its application in (bio-)chemical process engineering, whereas Section 1.3 introduces the general definitions of a multi-objective optimisation problem. Section 2 focusses on the used software and methods. Finally, Section 3 discusses the obtained results regarding: i) The development of the comprehensive, digital twin, of the considered biorefinery network in Aspen Plus; ii) the development of a surrogate, black-box model of one of the considered biorefinery unit-operations, and iii) the extensive discussion and comparison of the multi-objective optimisation of the biorefinery network using both the comprehensive model as well as the newly developed black-box model.
The considered biorefinery network is represented in Figure 1 (Sbarciog et al., 2022). The selection of the processes is based on expert knowledge considering the most common lignocellulosic biowaste streams in Flanders and/or commonly requested biorefinery products in that area. The depicted biorefinery network serves as an all-encompassing design for a biorefinery in Flanders. Note that, depending on the local requirements and/or locally available lignocellulosic biowaste feedstock streams, the applicability of the presented biorefinery network should be thoroughly assessed. In the following, each unit operation (shown in red in Figure 1) will be briefly discussed. The interested reader is referred to Sbarciog et al. (2022) for a more detailed explanation of each unit operation, the underlying mass balance equations, as well as initial simulation results.
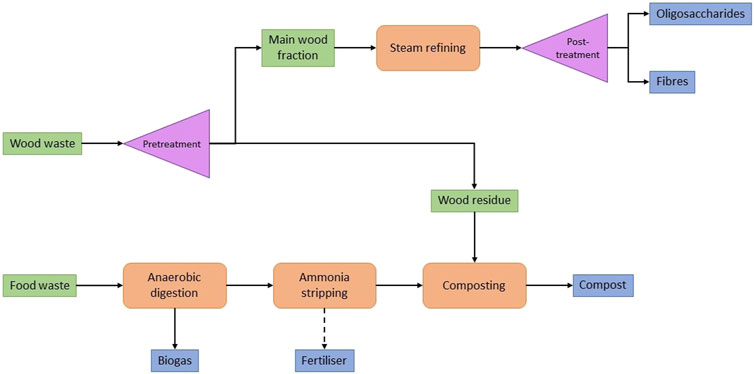
FIGURE 1. Outline of the modelled biorefinery network (adapted from Sbarciog et al. (2022), licensed under CC-BY 4.0).
The considered biorefinery network can be subdivided into two independent production lines: i) the steam refining production line, processing the bulk of the collected wood waste, and ii) the anaerobic digestion production line, processing the collected food waste through a concatenation of several processes following an anaerobic digestion process. Considering the steam refining production line, the collected wood waste is converted into fibres and oligosaccharides by injecting wood chips and steam into a batch milling-reactor. The mass balance equations of this process where modelled by Borrega et al. (2011a,b). While food waste does not require as rigorous processing as the crystalline lignocellulosic matrix of wood (Pastor-Poquet et al., 2018), it was opted to process food waste using the anaerobic digestion (AD) process. During the AD process, the feedstock stream is converted into a (liquid) digestate stream and a methane-rich biogas stream. The mass balances of the anaerobic digestion process are, most commonly known, modelled by the ADM1-model, developed by Batstone et al. (2002). However, in this contribution, the ADM1-model adaptation for the AD of food waste, presented by Nguyen (2014) is employed. As food waste contains a high amount of protein (Banks et al., 2008), the liquid digestate stream rendered by the AD process still contains a high amount of under-valorised ammonia. Hence, it was opted to include an ammonia stripping step a posteriori the anaerobic digestion process to strip this excess ammonia from the digestate stream. In a subsequent scrubbing process, this gaseous ammonia could be captured into solid N-fertiliser. The ammonia stripping process is modelled by Değermenci et al. (2012); Değermenci and Yildiz (2021). Lastly, in order to fully utilise the collected feedstock streams, a composting process was added to the biorefinery network. Unlike the anaerobic digestion and ammonia stripping processes, the composting process is again a batch process. In several composting cells, a mixture of the leftover wood waste and stripped digestate stream is converted into compost. The considered composting model was developed by Martalò et al. (2020).
In this contribution, the biorefinery network presented by Sbarciog et al. (2022) will be modelled in Aspen Plus to obtain a comprehensive mechanistic biorefinery model. As illustrated in the above, mechanistic (white-box) models modelling the mass balances of the selected biorefinery process are already available in literature. Energy models, however, are not as easily available. Chemical process simulators, like Aspen Plus, provide a straightforward method to model similar (bio-)chemical process, enabling the user not only to simulate the mass balances of the considered unit operations, but additionally its energy balances too. Combining the mechanistic kinetic models sourced from literature together with the built-in energy models of Aspen Plus, will render an all-encompassing model of the studied biorefinery network.
The kinetic models presented in Section 1.1 are so-called white-box or mechanistic models (see Figure 2). They rely on a prior insight in the underlying mechanisms of the to-be-modelled system. This dependence on a priori knowledge on the system enables them to accurately model the considered system, within certain feasibility boundaries. However, they can be extremely cumbersome to develop, especially when there is no detailed understanding of the studied systems or when the system is very complex and there are no well-established modelling paradigms available. Contrarily, black-box models do not require prior insight knowledge on the considered system but instead rely on a well-designed and -spread dataset containing input/output data of the concerned system’s aspect. Combined with a well-defined experimental design, black-box models only rely on the provided input/output data to define the model framework, structure, and parameters (Gernaey et al., 2004; Almquist et al., 2014; Lo-Thong et al., 2020; Shokry et al., 2020; Mora-Mariano and Flores-Tlacuahuac, 2022).
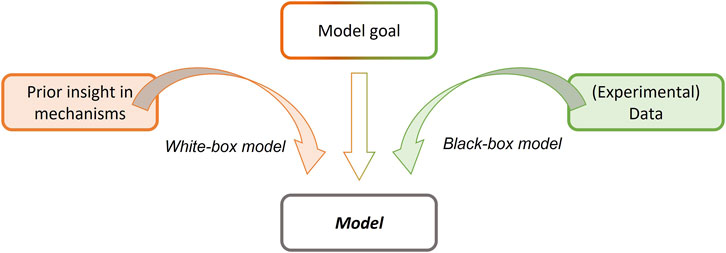
FIGURE 2. Graphical representation of the modelling exercise and the different focusses and modelling approaches of white-box versus black-box modelling (Based on Spriet and Vansteenkiste (1982)).
Surrogate models could be considered as a special type of black-box models, bridging the gap between both black-box and white-box models: Surrogate models are in essence black-box in the sense that they map the relationship between a certain process input and output whitout much attention to system’s inner workings. However, the input/output dataset that they are fed and trained with is not directly sourced from experiments, but rather from a distinctively more complex (and often white-box) model of the considered system (Koziel et al., 2011; McBride and Sundmacher, 2019). This more complex process model, that is used to generate the data needed to draft the surrogate model, is often referred to as the digital twin of the considered process (Lopez et al., 2020; Lave et al., 2021). The most commonly used examples of surrogate model frameworks are polynomials, kriging, and artificial neural networks. As these modelling frameworks are noticeable by their speed, the eventually obtained surrogate model, capable of estimating the desired output for a valid input vector (i.e., within the scope of the model), is usually significantly less computationally expensive than the original full process model (Koziel et al., 2011; McBride and Sundmacher, 2019). The associated decrease in simulation time and cost have made surrogate models of (complex) (chemical) processes especially popular in the context of process optimisation.
This, so-called, surrogate optimisation of chemical processes is already commonly applied in the field of chemical process engineering and optimisation. Quirante et al. (2015); Quirante and Caballero (2016) have applied surrogate models on the optimisation of distillation and stripping columns, respectively, whereas, amongst others, Caballero and Grossmann (2008); Boukouvala and Ierapetritou (2013) have applied surrogate optimisation in the context of flowsheet optimisation. Lin et al. (2017) have applied surrogate modelling techniques specifically in the context of optimising the production of hydroxymethylfufural (HMF), levulic acid (LA) and formic acid (FA) from glucose obtained from biomass, i.e., a biorefinery process. Lin et al. (2017) have already applied surrogate models for estimating the yield of a biorefinery process, whereas Huntington et al. (2023) clearly indicated the power of the usage of surrogate models in the context of the techno-economic analysis of biorefineries.
In this contribution, the newly developed comprehensive Aspen Plus small-scale biorefinery model will be employed as a digital twin for generating an input/output database for training a surrogate energy model of the steam refining process. Subsequently, both models will be employed in the context of a multi-objective optimisation of the considered unit operation, after which the obtained results of both approaches will be discussed and compared to assess the applicability of surrogate models within the context of optimising small-scale biorefineries. The main goal is to enable a more thorough optimisation of the considered process as the number of generated solutions and iterations of the optimisation algorithm will not be affected as much anymore by technical constraints.
As already mentioned before, the bivalent design goals of biorefineries (i.e., mitigating the effects of climate change whilst still being an economically viable enterprise) demand for optimising any proposed design considering both these objectives simultaneously, rendering a multi-objective optimisation problem (Tay et al., 2011; Geraili and Romagnoli, 2015; Punnathanam et al., 2016; Rodríguez Carpio et al., 2021; Riveros-Gomez et al., 2022).
Multi-objective optimisation is the area of research that considers the optimisation of a process whilst considering multiple optimisation objectives simultaneously (Logist et al., 2010). In process engineering, these objectives are either of economic, environmental, or societal nature (Sharma and Rangaiah, 2013). Due to the fact that these objectives are often conflicting, a multi-objective optimisation problem (MOOP) does not possess one unique optimal solution but, alternatively, an infinite set of equally optimal trade-off solutions: the so-called Pareto front. When the decision maker (DM) changes the settings of their process from one Pareto-optimal solution to another, a trade-off occurs, meaning that whilst certain objectives will improve, others will inevitably worsen (Hashem et al., 2017; De Buck et al., 2021). Mathematically, a MOOP can be defined as (Das and Dennis, 1997):
With:
The solution set of a MOOP is the Pareto set (PS) which contains all the Pareto-optimal solutions that satisfy (1). When solving a MOOP, the main goal is to approximate the Pareto set PS as closely and efficiently as possible. A multitude of highly tailored multi-objective optimisation algorithms are available. In this contribution, the in-house developed tDOM-II algorithm will be employed for tackling the multi-objective optimisation of the proposed small-scale biorefinery design (De Buck et al., 2021).
The comprehensive Aspen Plus (A+) model, presented in this contribution, will be used in the context of a multi-objective optimisation of the considered biorefinery network, as well as the surrogate model based on the A+ model, with regard to the total amount of consumed energy and the total amount of profit that is generated.
Aspen Plus V10 (A+) was used for developing the Aspen Plus (energy) model of the proposed small-scale biorefinery. MATLAB R2021a was used as the optimisation platform, as well as a modelling platform. The in-house developed INPROP interface (Muñoz López et al., 2018) was used as the communication platform between MATLAB and A+. All simulations were run on a 64-bit Windows 10 system, equipped with an Intel Core i7-8665U CPU at 1.90 GHz–2.11 GHz and with 32 GB of RAM installed.
The mass balances of each of the considered biorefinery processes were taken from literature and implemented in MATLAB. For the steam refining process of the wood waste, the kinetic models developed by Borrega et al. (2011a,b) were employed. The mass balances of the anaerobic digestion process were simulated using the ADM1-adaptation proposed by Nguyen (2014) (i.e., an adaptation of the ADM1-model, originally proposed by Batstone et al. (2002), for the anaerobic digestion of household kitchen waste). Next, the ammonia stripping process of the ammonia-rich digestate stream is modelled using the ammonia-removal-efficiency model developed by Değermenci et al. (2012); Değermenci and Yildiz (2021). Finally, the aerobic degradation of the ammonia-poor digestate stream and the remaining wood waste using a composting process is modelled using the kinetic models developed by Martalò et al. (2020). For a more in-depth discussion of the considered biorefinery unit operations, see section 1.1 and Sbarciog et al. (2022).
The multi-objective optimisation algorithm that will be employed in the context of this contribution is the in-house developed tDOM-algorithm, developed by De Buck et al. (2021). The tDOM-algorithm is a genetic algorithm which main framework is based on the Non-dominated Sorting Genetic Algorithm-II(NSGA-II) developed by Deb et al. (2002).
From the MATLAB environment, the A+ model of the SSBR was repeatedly run for different process control settings. In the context of this contribution, only the steam refining process was considered for the development of a surrogate model (SM). Based on the unit operation’s lower and upper boundaries, a set of test-points is developed. Although surrogate modelling is often coupled with low simulation/high information density sampling methods like Latin Hypercube sampling, in this contribution a sampling technique with a higher sampling density is used. More specifically, the range of the temperature control of the steam refining process is subdivided into a set of uniformly spread sample points, while the range of the time control is subdivided into a set of unevenly spread sampling points, following a logarithmic spread with a high density of sampling points close to the lower boundary, and a decreased density of sampling points close to the upper boundary of the time control.
The obtained dataset is used to model a response surface, the expression of which can be used as a surrogate model of the system. The total energy consumption and total generated profit are modelled separately. The response surface is modelled in MATLAB using a grid-based linear interpolation technique.
The initial focus of this section will be on the developed Aspen Plus model. In section 3.1, each unit operation will be discussed in detail. Subsequently, in Section 3.2, the A+ model of the steam refining process will be applied as a digital twin for developing a surrogate model (SM). Finally, in section 3.3, the multi-objective optimisation problem for optimising the considered SSBR regarding its energy consumption and generated profit will be drafted. In an initial optimisation problem, the comprehensive A+ model, drafted in Section 3.1, will be used in its entirety to simulate and calculate the objective costs of the optimisation problem. In a second optimisation problem, the steam refining process specifically will be re-considered for a multi-objective optimisation, however, this time the performance of the original A+ model versus the newly developed SM will be compared and discussed in detail.
One of the major hurdles in the considered SSBR design was the presence of both continuous (AD and ammonia stripping) and batch process (steam refining and composting) that were run in sequence of each other. While continuous processes produce a steady process output in function of time, batch processes do not. The latter are only commencing when a sufficient amount of feedstock is available. Only once finished, the process output can be harvested. While a continuous process requires a continuous flow of feedstock into the system, and products out of the system, batch process require them to accumulate over a certain amount of time. This causes issue in the continuity of any production line that contains both types of processes, so, in order to run them in sequence of each other, a decoupling method between both process streams was developed.
Firstly, as the steam refining process makes up a separate production line by itself (its products do not feed into another process), there is no need for a decoupler. The composting process, however, is fed using the ammonia-poor digestate stream coming from the anaerobic digestion and ammonia stripping processes. As both of these processes are operated continuously, a decoupler is needed between them. In practice, a decoupler often is a holding tank that is placed between the two processes whose feedstock-/product flows need to be decoupled from each other. In the case of the presented biorefinery network, the continuous process’ constant outflow of product is collected in a holding tank. Once the holding tank is full, its content is transferred into the batch reactor, after which the batch process can be started. The empty holding tank can be refilled with the, still, constant output flow of the continuous reactor. In the optimisation problem, defined in Section 3.3, much attention has been paid to coordinate the volumes of the holding tanks, the volumes of the batch reactors, and the size of the flows between them, in order to obtain a semi-continuous process.
The overall runtime of the considered SSBR is set to 1 year, more specifically 364 days. During that time, the anaerobic and ammonia stripping process are run continuously whereas several batches of the steam refining process will be run. Figure 3 represents a more detailed flowsheet of the operation of the considered SSBR, focussing on the steam refining process. During the modelling and optimisation exercise presented in this contribution, it is assumed that all the wood waste is collected annually, i.e., at the start of the 364 days operating time frame, mw kg of wood waste is available for processing. During the operating time frame, the wood waste feedstock will be depleted, following a discontinuous, gradually decreasing, step function.
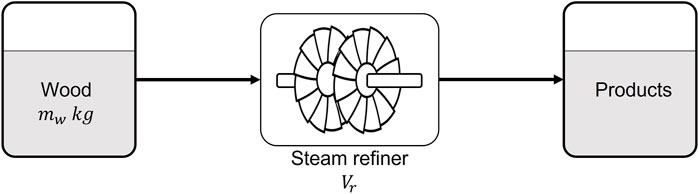
FIGURE 3. Flowsheet of the steam refining process, with mw the mass of the collected wood and Vr the steam refining reactor volume.
To allow for more control over both continuous processes, the anaerobic digestion process and the ammonia stripping process are decoupled from each other via another holding tank (see Figure 4). The flow rates of the input (and, thus, output flows) through both processes can be optimised separately from each other. Moreover, as the holding tank is assumed to be a reaction-free environment and considered to be perfectly mixed, the feedstock stream of the ammonia stripping process has a consistent composition, facilitating the fine-tuning of the ammonia stripping process controls. Regarding the anaerobic digestion process, its feedstock is the biweekly collected household kitchen waste. Although this could be seen as a limiting factor for operating the anaerobic digestion process, the highly perishable household kitchen waste cannot be stored for a long time regardless (Degueurce et al., 2020). The biweekly collected amount of household kitchen waste mk is continuously processed via the anaerobic digestion process until the supply is depleted, ideally coinciding with a new collection round.
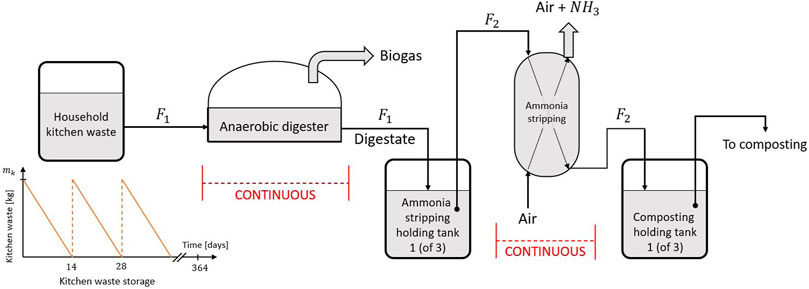
FIGURE 4. Flowsheet of the anaerobic and ammonia stripping process.
The digestate stream coming from the anaerobic digestion process feeds into a first holding tank, which is considered to be reaction-free and perfectly mixed. Once this first holding tank is full, the content is continuously fed into the ammonia stripping process, whilst the digestate stream fills into a second, parallel, holding tank. The ammonia-poor digestate coming from the ammonia stripper feeds into a first holding tank to decouple the continuous ammonia stripping process from the batch composting process. This time, once this holding tank is full, its content is immediately fully transferred to a composting cell, after which the batch composting process can start. By installing multiple, parallel composting cells (and holding tanks), a semi-continuous composting process is obtained: several batch processes are performed in parallel, avoiding a hold-up in the production line due to the unavailability of a reactor.
The Aspen Plus model is developed starting from the “solids template”, included in the Aspen Plus software, and this using metric units (global unit set:
Figure 5 displays the Aspen Plus flowsheet of the steam refining production pipeline. The
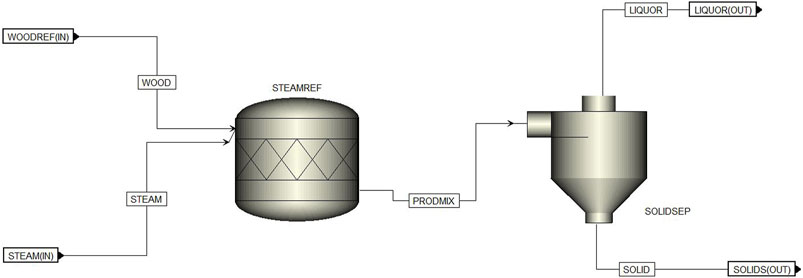
FIGURE 5. Aspen Plus flowsheet of the steam refining production pipeline.
The steam refining reactor is modelled using an
In Section 3.2, a surrogate model will be drafted of this specific production pipeline, which will be used in the context of a multi-objective optimisation problem in Section 3.3.
Figure 6 displays the Aspen Plus flowsheet of the anaerobic digestion production pipeline. Similar to the steam refining production pipeline, the mass balances of the anaerobic digestion reactor are modelled in the MATLAB environment using the kinetic model developed by Nguyen (2014). The wide range of different components of the anaerobic digestion process, as specified by Nguyen (2014), makes it difficult to model all the reaction equations immediately in Aspen Plus as many of the considered components are not available in the Aspen Plus component libraries, not even in more specialised component databases like the one developed by Wooley and Putsche (1996). The anaerobic digestion reactor is modelled using an
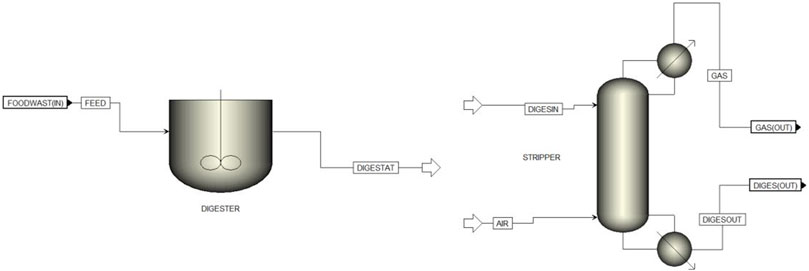
FIGURE 6. Aspen Plus flowsheet of the anaerobic digestion production pipeline.
As mentioned in 3.1.1, the digestate stream coming from the anaerobic digestion process is fed into a storage tank which is considered to be i) reaction-free, and ii) perfectly mixed. By doing so, the ammonia stripping process is decoupled from the anaerobic digestion process. This allows for a greater amount of freedom over the control of both processes, enabling a more tailored (multi-objective) optimisation of both processes. The storage tanks are modelled in the MATLAB environment using the mass balances obtained from the kinetic models, equally modelled in the MATLAB environment.
The ammonia stripping process, unlike the previously discussed unit operations, is entirely modelled in Aspen Plus employing a
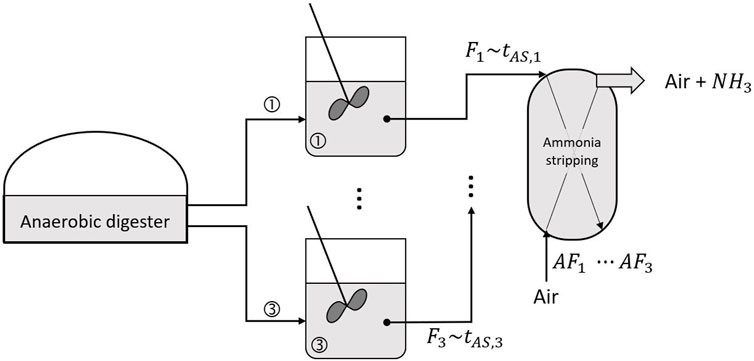
FIGURE 7. Exploitation of the ammonia stripping process decoupled from the anaerobic digestion process using three storage tanks (see Table 1 for the definition of the controls).
The output of the ammonia stripping process is, again, collected in storage tanks. This time to ensure the decoupling between a continuous and batch process operated in sequence of each other. Three collection tanks are being considered, which are filled in sequence. As for the storage tanks located between the anaerobic digestion process and the ammonia stripping process, the collection tanks are considered to be reaction-free and perfectly mixed.
As soon as the first collection tank is full, its content is transferred to the first composting cell. In Aspen Plus, the composting cell is modelled using an
The A+ model of the proposed biorefinery could be used as a source of experimental data for developing a new, surrogate model that can mimic the behaviour of the original, full model but without it being too computationally expensive. To indicate the potential power of surrogate models in the context of the optimisation of (biorefinery) flowsheet models, a surrogate model is developed for the steam refining production pipeline that is considered in the studied biorefinery network. Subsequently, the developed surrogate model will be used for the multi-objective optimisation of the steam refining production pipeline (for energy and profit) and the obtained results are compared to the results obtained with the original A+ model (see Section 3.3).
As indicated by Eq. 3, the severity R0 of the steam refining process is influenced by two input variables: the temperature T of the reactor/steam that is injected in the system, and the residence time t of the wood waste inside the reactor. Based on literature, the lower and upper boundaries of both input variables have been set to [180°C − 240°C] for the reactor temperature, and [10 min −1,440 min] for the residence time. In order to create a sample data set for developing the surrogate model of the output of the A+ model of the steam refining production pipeline, i.e., the energy consumption of the boiler and the reactor, and the profit generated from the produced fibres and oligosaccharides, the input ranges of both input variables T and t are subdivided into an (un-)evenly spread of sampling points. Even though surrogate modelling is often coupled with sampling techniques like Latin Hypercube Sampling, the chosen approach here is to generate a sampling dataset that covers the entire range of the two input variables as densely as possible. Given the relatively limited cost of one simulation of the steam refining production pipeline using the A+ model (i.e., compared to the entire biorefinery flowsheet), a sampling data set with a similarly high degree of coverage is attainable from a computational point of view.
Based on literature, a steam refining process with a small residence time is preferred over one with a higher residence time. To reflect this preference in the sampling data set, the input range of the residence time is subdivided into unevenly spread sampling points following a logarithmic scale with a higher sample point density close to the lower boundary of the residence time t input range (Janzon et al., 2014; Hagel and Saake, 2020; Hagel et al., 2021). The temperature T range, however, is subdivided into an evenly spread number of sampling points. For each combination of sampling points, the A+ model of the steam refining process is run and the overall energy consumption and generated profit are being recorded, rendering a gridded sampling dataset.
The obtained datasets of both the total energy consumption and the generated profit are presented in Figures 8A, B, respectively. From Figure 8A, it can be clearly seen that the evolution of the energy consumption of the steam refining production pipeline follows a linear behaviour (i.e., with increasing temperatures and residence time, the energy consumption increases). The generated profit, however, follows a more logarithmic behaviour with regard to time: when the residence time surpasses a certain threshold, the generated profit decreases drastically and remains negligible for any remainder of time. It was opted to model the behaviour of both the energy consumption and the generated profit via a response surface which was generated using linear interpolation. This was deemed to be acceptable as the input/output database was sufficiently dense in both the T as well as the t directions.
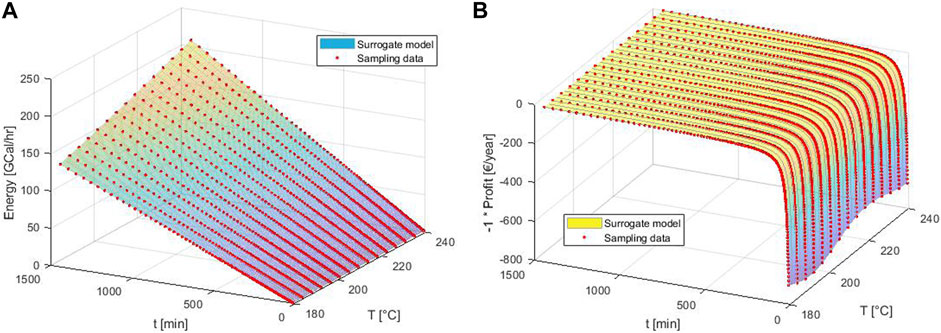
FIGURE 8. Surrogate models of the total energy consumption (A) and generated profit (B) of the modelled steam refining process.
As can be seen from Figure 8, the obtained interpolating functions closely match the sampling points. Since it can be used to calculate the energy/profit at query points within the sampled input ranges, it can effectively be used as a surrogate model of the energy consumption/generated profit of the steam refining process. In the following section, the obtained surrogate models will be used in the context of the multi-objective optimisation of the steam refining production pipeline. Their performance in this context will be compared to the performance of the original full A+ model.
The Aspen Plus model of the SSBR, presented in section 3.1, allows for estimating the energy requirements of each separate unit operation in the considered SSBR network and, thus, the entire SSBR plant, depending on the settings of each unit operation. As one of the key design aspects of a (small-scale) biorefinery is sustainability, it is essential that the energy consumption of the biorefinery does not exceed the (potential) energy content of its products. Nonetheless, the biorefinery needs to remain sustainable from an economic point of view too. Generally, when simultaneously optimising a process’s energy consumption and profit, the optimal outcomes for the two separate objectives are not in accordance with each other, rendering a multi-objective optimisation problem. The optimisation problem can be summarised as follows:
With.
The energy consumption of the considered SSBR network is summed in objective J1, whereas J2 is the summation of all the profitable output streams of the biorefinery: oligosaccharides (OS) and fibres (F) obtained from the steam refining process, biogas from the anaerobic digestion (AD) process, ammonia (NH3) from the ammonia stripping process, and compost. Eq. 4 shows that the multi-objective optimisation problem is formulated as a minimisation problem (as per convention), thus whilst the profit objective J2 is supposed to be maximised, the entire objective function is multiplied by −1.
The controls of the optimisation problem are summarised in Table 1, together with their lower- and upper boundaries, defining the decision variable space C. Additionally, Table 1 displays the reference settings for each control variable, the value of which were sourced from literature. In total, 16 controls and 1 fixed parameter are defined. In order to keep the number of controls, and the total number of required simulations, to a minimum, the number of controls for the continuous anaerobic digestion process and ammonia stripping process are kept at 3 and 6, respectively.
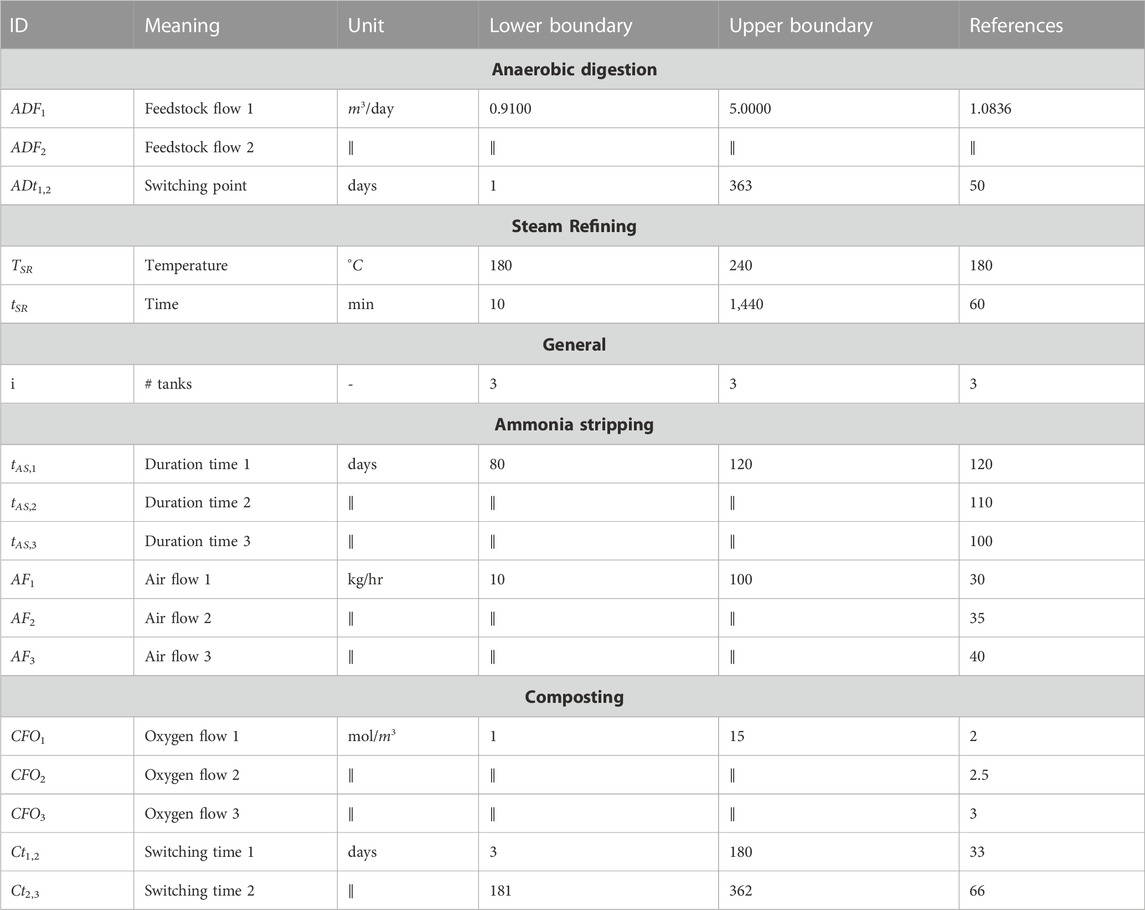
TABLE 1. Controls of the MOOP, their meaning, lower and upper boundary, and reference values.
The controls are subjected to the following (practical) inequality constraints:
Inequality constraint g1, as defined by Eq. 7, ensures that the total amount of food waste fed into the anaerobic digestion reactor does not exceed the total amount of food waste that is available. Concurrently, inequality constraint g2 (see Eq. 8) ensures that the total flow of food waste into the anaerobic digestion reactor amounts to at least 87.5% of the total available amount. Inequality constraints g3 and g4 (see Equations 9 and 10) limit the flow rates into the anaerobic digestion reactor to a maximum of 25% of the digestate (liquid) volume in the reactor, this to avoid wash-out, and inequality constraint g5 (see Eq. 11) ensures that the input flow rate of food waste into the anaerobic digestion reactor is higher during the final stage of the process than during the start-up phase. Finally, regarding the composting process, inequality equation g6 (see Eq. 12) assures that the two switching time stamps (i.e., the time stamps for changing the oxygen flow through the composting cell) are at least 2 days apart. The minimum of 2 days is chosen for simplifying solving the kinetic model of the composting process.
The optimisation problem and the decision variable space are defined in the MATLAB environment. The tDOM-II optimisation algorithm, developed by De Buck et al. (2021), is run from the MATLAB environment as well. The communication between MATLAB (both optimisation and simulation platform) and Aspen Plus (simulation platform) is handled by the INPROP communication platform, developed by Muñoz López et al. (2018).
The tDOM-II algorithm’s trade-off parameters allows for optimising the problem defined in Eq. 4 whilst simultaneously taking a minimum trade-off into account. Δr defines the minimally required difference between two solutions with regard to objective J1, whereas Δt defines the minimally required difference between two solutions with regard to objective J2. In the context of this contribution, Δr = 5% and Δt = 2.5%.
Figure 9 displays the obtained Pareto front. The objective costs of the selected solutions, and this for each separate objective cost term as defined in Equations (5) and (6), are summarised in Table 2, whereas Table 3 summarises the different controls of the selected solutions.
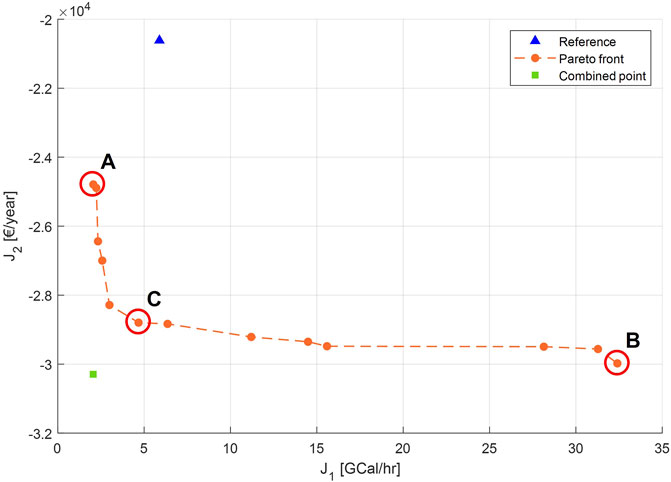
FIGURE 9. Pareto front of the MOOP, simultaneously optimising for energy (J1) and profit (J2).
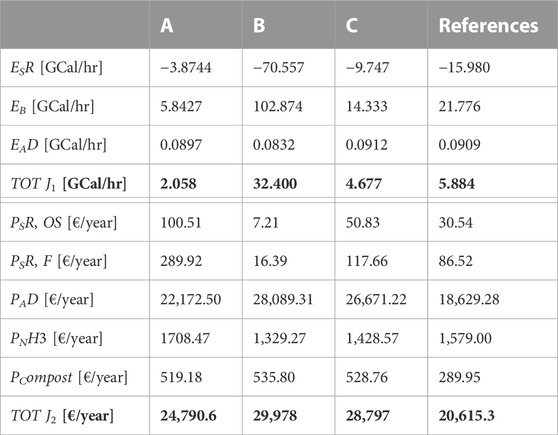
TABLE 2. Results of the MOOP defined in Equation (4), with the costs of each separate term reported separately.
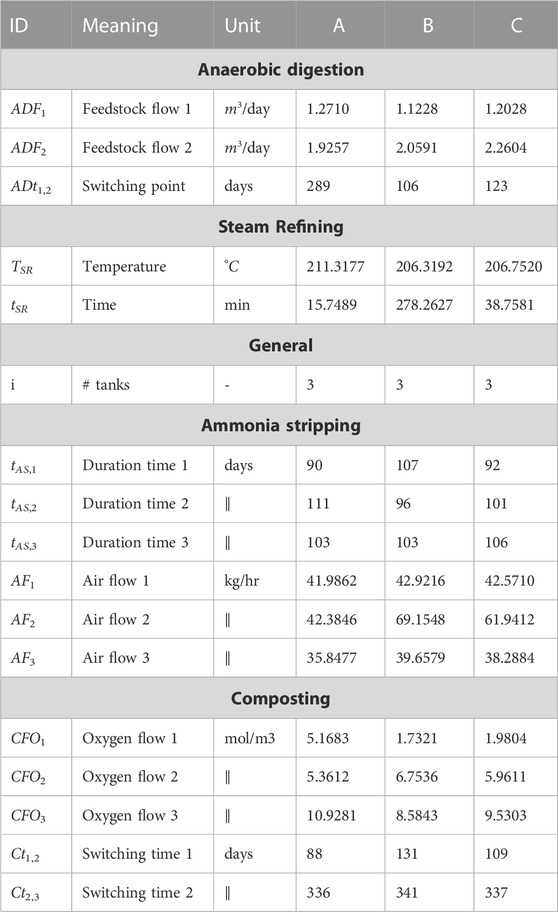
TABLE 3. The optimised controls for the selected Pareto optimal solutions, as indicated in Figure 9.
From Figure 9 it can already be clearly seen that the obtained Pareto front significantly outperforms the reference point. Three points of interest have been indicated on the Pareto front: the anchor points A and B and the selected trade-off point C. Whereas A is the individual minimiser of objective J1, and B the individual minimiser of objective J2, the trade-off point C combines both objectives in a more balanced manner. In general, DMs tend to select points located in the so-called knee-area(s) of the Pareto front as they display the best trade-offs between both objectives (Hashem et al., 2017; De Buck et al., 2021). The trade-off point C displays a 20.50% decrease in the total energy that is consumed and a 39.69% increase in profits made compared to the reference point. When only regarding one objective, a decrease of upto 65.02% in consumed energy and an increase of 45.42% in profits, respectively, can be obtained.
Further analysis of the obtained results, displayed in Table 2, gives rise to two additional main observations: i) the net energy consumption of the steam refining reactor is negative in all of the selected scenarios, and ii) the anaerobic digestion process is the most profitable process of all. Firstly, when looking at the steam refining process in more detail, the negative net energy of the steam refining reactor means that energy is being produced/exuded. The boiler, however, needed for turning water at ambient temperature and pressure into saturated steam at the desired temperature, consumes considerably more energy. One should note that the proposed energy model in Aspen Plus does not take energy recycling into account. Therefore, the obtained estimation of the (total) energy consumption of the proposed process is an overestimation or comparable to a worst-case scenario. In a real-life application, however, energy recycle loops will be present. E.g., the product streams leaving the steam refining process still contain a high amount of thermic energy as they are at an increased temperature. As they need to be cooled down before they can be further processed, the extracted energy can, for instance, be employed to (pre-)heat the water stream entering the boiler, facilitating the steam creation process and, thus, resulting in a diminished amount of energy that is required by the boiler.
When only considering the minimisation of the consumed energy, Table 2 shows that the boiler only consumes 5.84 GCal/hr, whereas in the case of maximising the profit, the boiler consumes 102.87 GCal/hr. One would expect that this would result in an increased amount of profit made by the steam refining products. However, the values presented in Table 2 clearly indicate the opposite scenario with a profit made of 7,21 € and 16.39 € for the oligosaccharides and fibres, respectively (for the processing of 1,000 kg wood waste). The controls of the steam refining process in this scenario indicate a steam temperature of 206.32 °C and a process time of 278.3 min. From the reaction system presented by Borrega et al. (2011a,b) it can be clearly seen that in the case of an increased steam temperature, combined with a high process time, the lignocellulose of the wood waste is almost completely degradated into products that are not desirable and cannot be sold, rendering the process completely unprofitable. One would expect that, when optimising for profit, this would result in a bad objective cost and thus decreasing the solution in question’s chances of being selected as a parent solution for (potential) subsequent generations. However, and this is the second major observation that can be made based on the results displayed in Table 2, while the anaerobic digestion process is more than a thousand-fold more profitable than the steam refining process, the negative impact of the currently obtained controls on the steam refining process is neglible compared to the profit that is being made by the anaerobic digestion process. The same scenario can be seen when looking at the objective costs of the ammonia stripping process spread over all four different scenarios (i.e., A, B, C, and the reference point). Additionally, while the energy price (and other fixed costs) is not taken into account in the profit objective function J2 at this stage of the model development, the high cost that would be paired with a similarly high energy consumption of the
While all processes are decoupled from one another, it is possible to source the controls of one unit operation from one Pareto-optimal solution, while the controls of the other unit operation are sourced elsewhere. As long as the entire set of controls related to one unit operation are sourced from the same solution, there will be no violations of the imposed (inequality) constraints as they only consider one specific unit operation per constraint. In the case of overlapping constraints, e.g., limiting the total amount of energy that is consumed over all unit operations combined, this exchange of controls of one solution to another would not be viable as it would most likely induce constraint violations in the combined solution. The combined solution (see Figure 9) combines the controls of the steam refining process and the ammonia stripping process from solution A with the remaining controls coming from solution B. The objectives costs of the combined solutions are 2.05 GCal/hr and 30,296 €/hr, for both objectives respectively. Compared to the most profitable point on the Pareto front (i.e., solution B), the significant decrease in energy consumption is thanks to the updated controls for the steam refining process, simultaneously resulting in a higher profit made from the steam refining products which on its turn gives rise to a higher profit.
It is clearly visible from Figure 9 that the combined solution outperforms all solutions on the obtained Pareto front, indicating the obtained Pareto front has not fully converged yet. Increasing the number of iterations and/or the number of population members could augment the capability of the solutions to converge further. However, due to the simulations in Aspen Plus taking a significant amount of time (e.g., the steam refining simulation takes 9.93s on average, while the anaerobic digestion simulation takes 59.46s on average, measured on the system described in Section 2.1), increasing the number of iterations and/or population members becomes increasingly more computationally expensive. A computationally less expensive surrogate model, based on the Aspen Plus model, would allow for re-running the optimisation with an increased amount of iterations and population members but without it becoming impossibly computationally expensive (Henao and Maravelias, 2011). The Aspen Plus model could be used as a source for generating data in order to, subsequently, train a new, surrogate model based on the obtained dataset. The surrogate model can range from a response surface model (RSM) in the case of a limited dataset, or an artificial neural network (ANN) when a larger dataset is available (Schack et al., 2021).
As surrogate models require far less computational power than the original comprehensive A+ model, a surrogate model of the steam refining production pipeline was developed in Section 3.2. In order to indicate the performance and effectiveness of the developed surrogate models, the multi-objective optimisation of the steam refining production pipeline is repeated using both the original A+ model, as well as the developed surrogate models. The optimisation problem is simplified to the following two objectives (only the terms corresponding to the steam refining production pipeline are withheld):
With.
Figure 10 displays the Pareto front of the steam refining process using the original A+ model as well as the developed surrogate models. It can be easily seen that the solutions of both optimisations have converged to the same Pareto front and display a similar solution diversity. However, the Pareto set obtained using the original A+ model contains 50 solutions, generated in 25 iterations, whereas the Pareto set obtained using the surrogate model contains 200 solutions, generated in 50 iterations. Even though the latter optimisation problem was generated using a significantly larger population set and using a higher number of iterations, it only lasted a fraction of the time needed for doing the same optimisation using the original A+ model. On average, the steam refining process simulation took around 15.99 ± 5.32 s to complete while the surrogate model’s simulation time was negligible (less than 0.5 s).
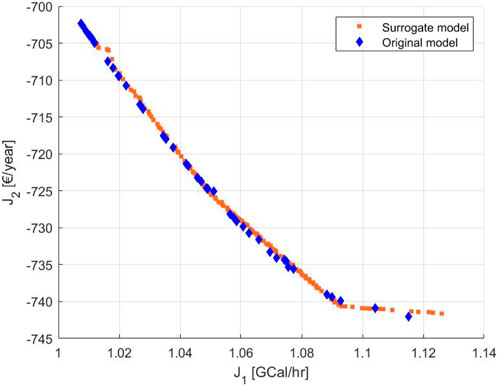
FIGURE 10. Pareto front of the MOO of the steam refining process, for energy (J1) and profit (J2), using the original A+ model as well as the surrogate model.
Based on the obtained results, it can be concluded that a surrogate model can accurately replace a far more elaborate process model. Especially when extending the usage of the developed process models into simulation and/or optimisation environments that are detached from the dedicated simulation software, or do not possess over sufficient power, surrogate models can still be used to simulate the processes that are being considered. Nonetheless, one has to remain cautious about the fact that the quality and performance of a surrogate model is largely dependent on the quality of the dataset used to train it (McBride and Sundmacher, 2019). Sufficient testing of the surrogate model and validating its output with new sampling points should point out shortcomings in the model’s behaviour. Moreover, employing a surrogate model outside of the system boundaries within which it was developed, could give rise to faulty and inaccurate simulation results.
(small-scale) Biorefineries are powerful tools designed to mitigate climate change, tailor to the local biorefinery product needs, and attributing to the local waste processing capacity. However, they need to remain economically viable enterprises as well. Therefore, it is essential not only to be able to model (and optimise) the biorefinery design for a mass-balance point of view, but also from an energy consumption point of view. This contribution provides a critical analysis of the use of white-box models versus black-box models in the context of the multi-objective optimisation of a small-scale biorefinery network (as previously presented by Sbarciog et al. (2022)). Firstly, as there were not yet (mechanistic) models available on the energy consumption of the considered biorefinery unit operation, the biorefinery network was re-modelled in Aspen Plus. The Aspen Plus model allows for estimating the overall energy consumption of the modelled biorefinery network, whilst simultaneously estimating its generated profit using the kinetic models, sourced from literature. However, as the obtained comprehensive biorefinery network model was computationally expensive to simulate, it was opted to use it as a digital twin for generating a surrogate model of the steam refining production pipeline. Subsequently, both models were used in the context of the multi-objective optimisation of the studied biorefinery network. In an initial optimisation problem, only the comprehensive model is employed in order to optimise the entire biorefinery network. During a second, surogate-based optimisation, the multi-objective optimisation of the steam refining production pipeline is repeated, and the performance of the comprehensive model was compared to that of the surrogate model. The outcome of the multi-objective optimisation problem using the surrogate model was at least as satisfactory as that when using the comprehensive model. Furthermore, the computationally inexpensive surrogate model allowed for running the optimisation using a larger population set and a higher number of iterations, effectively increasing the accuracy and credibility of the obtained solution, and clearly indicating the applicability of surrogate models in the studied context.
The original contributions presented in the study are included in the article/Supplementary Material, further inquiries can be directed to the corresponding author.
Conceptualisation: VDB, JC, MS, SB, MP, and JVI; investigation and literature review: VDB, JC, MS; resources: VDB, MS, SB, MP, and JVI; writing, original draft preparation: VDB; writing, review and editing: VDB, MS, SB, MP, and JVI; visualisation: VDB; supervision: JVI; project administration: MP and JVI; funding acquisition: JVI. All authors contributed to the article and approved the submitted version.
This work was supported by the ERA-NET FACCE-SurPlus (Project FLEXIBI, co-funded by VLAIO project HBC.2017.0176) and by the ERA-NET BlueBio (Project BlueBioChain, co-funded by FWO-SBO project S008121N). VDB is supported by FWO-SB Grant 1SC0922N.
The authors would like to acknowledge the local council of De Pinte, Belgium, for their co-operation and the provision of the data necessary for this research.
The authors declare that the research was conducted in the absence of any commercial or financial relationships that could be construed as a potential conflict of interest.
The author JVI declared that they were an editorial board member of Frontiers at the time of submission. This had no impact on the peer review process and the final decision.
All claims expressed in this article are solely those of the authors and do not necessarily represent those of their affiliated organizations, or those of the publisher, the editors and the reviewers. Any product that may be evaluated in this article, or claim that may be made by its manufacturer, is not guaranteed or endorsed by the publisher.
The Supplementary Material for this article can be found online at: https://www.frontiersin.org/articles/10.3389/frfst.2023.1154305/full#supplementary-material
Almquist, J., Cvijovic, M., Hatzimanikatis, V., Nielsen, J., and Jirstrand, M. (2014). Kinetic models in industrial biotechnology – improving cell factory performance. Metab. Eng. 24, 38–60. doi:10.1016/j.ymben.2014.03.007
Aristizábal-Marulanda, V., Solarte-Toro, J., and Cardona Alzate, C. (2021). Study of biorefineries based on experimental data: production of bioethanol, biogas, syngas, and electricity using coffee-cut stems as raw material. Environ. Sci. Pollut. Res. 28, 24590–24604. doi:10.1007/s11356-020-09804-y
Banks, C. J., Chesshire, M., and Stringfellow, A. (2008). A pilot-scale comparison of mesophilic and thermophilic digestion of source segregated domestic food waste. Water Sci. Technol. 58, 1475–1481. doi:10.2166/wst.2008.513
Batstone, D. J., Keller, J., Angelidaki, I., Kalyuzhnyi, S. V., Pavlostathis, S. G., Rozzi, A., et al. (2002). The IWA anaerobic digestion model No 1 (ADM1). Water Sci. Technol. 45, 65–73. doi:10.2166/wst.2002.0292
Borrega, M., Nieminen, K., and Sixta, H. (2011a). Degradation kinetics of the main carbohydrates in birch wood during hot water extraction in a batch reactor at elevated temperatures. Bioresour. Technol. 102, 10724–10732. doi:10.1016/j.biortech.2011.09.027
Borrega, M., Nieminen, K., and Sixta, H. (2011b). Effects of hot water extraction in a batch reactor on the delignification of birch wood. BioResources 6, 1890–1903. doi:10.15376/biores.6.2.1890-1903
Boukouvala, F., and Ierapetritou, M. (2013). Surrogate-based optimization of expensive flowsheet modeling for continuous pharmaceutical manufacturing. J. Pharm. Innovation 8, 131–145. doi:10.1007/s12247-013-9154-1
Caballero, J. A., and Grossmann, I. E. (2008). An algorithm for the use of surrogate models in modular flowsheet optimization. AIChE J. 54, 2633–2650. doi:10.1002/aic.11579
Clauser, N. M., Gutiérrez, S., Area, M. C., Felissia, F. E., and Vallejos, M. E. (2016). Small-sized biorefineries as strategy to add value to sugarcane bagasse. Chem. Eng. Res. Des. 107, 137–146. doi:10.1016/j.cherd.2015.10.050
Das, I., and Dennis, J. (1997). A closer look at drawbacks of minimizing weighted sums of objectives for pareto set generation in multi-criteria optimization problems. Struct. Optim. 14, 63–69. doi:10.1007/bf01197559
Davis, R., Markham, J., Kinchin, C., Grundl, N., Tan, E., and Humbird, D. (2016). Process design and economics for the production of algal biomass: algal biomass production in open pond systems and processing through dewatering for downstream conversion. Golden, Colorado: National Renewable Energy Laboratory. Tech. rep.
Davis, R., Tao, L., Scarlata, C., Tan, E., Ross, J., Lukas, J., et al. (2015). Process design and economics for the conversion of lignocellulosic biomass to hydrocarbons: dilute-acid and enzymatic deconstruction of biomass to sugars and catalytic conversion of sugars to hydrocarbons. Golden, Colorado: National Renewable Energy Laboratory. Tech. rep.
Deb, K., Pratap, A., Agarwal, S., and Meyarivan, T. (2002). A fast and elitist multiobjective genetic algorithm: NSGA-II. Evol. Comput. IEEE Trans. 6 (2), 182–197. doi:10.1109/4235.996017
De Buck, V., Nimmegeers, P., Hashem, I., Muñoz López, C. A., and Van Impe, J. (2021). Exploiting trade-off criteria to improve the efficiency of genetic multi-objective optimisation algorithms. Front. Chem. Eng. 3. doi:10.3389/fceng.2021.582123
De Buck, V., Polanska, M., and Van Impe, J. (2020). Modeling biowaste biorefineries: a review. Front. Sustain. Food Syst. 4. doi:10.3389/fsufs.2020.00011
Değermenci, N., Ata, O. N., and Yildız, E. (2012). Ammonia removal by air stripping in a semi-batch jet loop reactor. J. Industrial Eng. Chem. 18, 399–404. doi:10.1016/j.jiec.2011.11.098
Değermenci, N., and Yildiz, E. (2021). Ammonia stripping using a continuous flow jet loop reactor: mass transfer of ammonia and effect on stripping performance of influent ammonia concentration, hydraulic retention time, temperature, and air flow rate. Environ. Sci. Pollut. Res. 28, 31462–31469. doi:10.1007/s11356-021-13005-6
Degueurce, A., Picard, S., Peu, P., and Trémier, A. (2020). Storage of food waste: variations of physical–chemical characteristics and consequences on biomethane potential. Waste Biomass Valoris. 11, 2441–2454. doi:10.1007/s12649-018-00570-0
De Visser, C., and Van Ree, R. (2016). Small-scale biorefining. Wageningen, The Netherlands: Wageningen University & Research) (Available online, accessed on January 6, 2022).
di Chen, Y., Ho, S.-H., Nagarajan, D., qi Ren, N., and Chang, J.-S. (2018). Waste biorefineries — integrating anaerobic digestion and microalgae cultivation for bioenergy production. Curr. Opin. Biotechnol. 50, 101–110. doi:10.1016/j.copbio.2017.11.017
Geraili, A., and Romagnoli, J. A. (2015). A multiobjective optimization framework for design of integrated biorefineries under uncertainty. AIChE J. 61, 3208–3222. doi:10.1002/aic.14849
Gernaey, K. V., van Loosdrecht, M. C., Henze, M., Lind, M., and Jørgensen, S. B. (2004). Activated sludge wastewater treatment plant modelling and simulation: state of the art. Environ. Model. Softw. 19, 763–783. doi:10.1016/j.envsoft.2003.03.005
Hagel, S., Lüssenhop, P., Walk, S., Kirjoranta, S., Ritter, A., Bastidas Jurado, C. G., et al. (2021). Valorization of urban street tree pruning residues in biorefineries by steam refining: conversion into fibers, emulsifiers, and biogas. Front. Chem. 9, 779609. doi:10.3389/fchem.2021.779609
Hagel, S., and Saake, B. (2020). Fractionation of waste mdf by steam refining. Molecules 25, 2165. doi:10.3390/molecules25092165
Hashem, I., Telen, D., Nimmegeers, P., Logist, F., and Van Impe, J. (2017). A novel algorithm for fast representation of a Pareto front with adaptive resolution: application to multi-objective optimization of a chemical reactor. Comput. Chem. Eng. 106, 544–558. doi:10.1016/j.compchemeng.2017.06.020
Henao, C. A., and Maravelias, C. T. (2011). Surrogate-based superstructure optimization framework. AIChE J. 57, 1216–1232. doi:10.1002/aic.12341
Humbird, D., Davis, R., Tao, L., Kinchin, C., Hsu, D., Aden, A., et al. (2011). Process design and economics for biochemical conversion of lignocellulosic biomass to ethanol: dilute-acid pretreatment and enzymatic hydrolysis of corn stover. Golden, Colorado: National Renewable Energy Laboratory. Tech. rep.
Huntington, T., Baral, N. R., Yang, M., Sundstrom, E., and Scown, C. D. (2023). Machine learning for surrogate process models of bioproduction pathways. Bioresour. Technol. 370, 128528. doi:10.1016/j.biortech.2022.128528
IPCC (2021). IPCC, 2021: climate change 2021: the physical science basis. Contribution of working group I to the sixth assessment report of the intergovernmental panel on climate change. Cambridge, UK, and New York, NY, USA. Tech. rep., IPCC 2021. doi:10.1017/9781009157896
Janzon, R., Schütt, F., Oldenburg, S., Fischer, E., Körner, I., and Saake, B. (2014). Steam pretreatment of spruce forest residues: optimal conditions for biogas production and enzymatic hydrolysis. Carbohydr. Polym. 100, 202–210. doi:10.1016/j.carbpol.2013.04.093
Kaur, S., Diwan, F., and Reddersen, B. (2022). “Mitigating the impacts of drought via wastewater conversion to energy, nutrients, raw materials, food, and potable water,”. Climate change and environmental sustainability. Editors B.-J. He, D. Prasad, G. Pignatta, and J. Jupesta (Cham: Springer International Publishing), 45–60.
Kolfschoten, R. C., Bruins, M. E., and Sanders, J. P. (2014). Opportunities for small-scale biorefinery for production of sugar and ethanol in The Netherlands. Biofuels, Bioprod. Biorefining 8, 475–486. doi:10.1002/bbb.1487
Koziel, S., Ciaurri, D. E., and Leifsson, L. (2011). Surrogate-based methods. Berlin, Heidelberg: Springer Berlin Heidelberg, 33–59. doi:10.1007/978-3-642-20859-1_3
Lave, O. L., Gargalo, C. L., Barton, R., Bayer, C., Udugama, I. A., and Gernaey, K. V. (2021). “Towards a digital twin: a validated digital model of a pilot scale bioreactor producing green fluorescent protein (gfp)”. In 31st European Symposium on Computer Aided Process Engineering, eds. M. Türkay, and R. Gani (Elsevier), vol. 50 of Computer Aided Chemical Engineering. 625–630. doi:10.1016/B978-0-323-88506-5.50099-1
Leong, H., Chang, C., Khoo, K., Chew, K., Chia, S., Lim, J., et al. (2021). Waste biorefinery towards a sustainable circular bioeconomy: a solution to global issues. Biotechnol. Biofuels 14, 87. doi:10.1186/s13068-021-01939-5
Lin, Z., Wang, J., Nikolakis, V., and Ierapetritou, M. (2017). Process flowsheet optimization of chemicals production from biomass derived glucose solutions. Comput. Chem. Eng. 102, 258–267. doi:10.1016/j.compchemeng.2016.09.012
Logist, F., Houska, B., Diehl, M., and Van Impe, J. (2010). Fast pareto set generation for nonlinear optimal control problems with multiple objectives. Struct. Multidiscip. Optim. 42, 591–603. doi:10.1007/s00158-010-0506-x
Lopez, P. C., Udugama, I. A., Thomsen, S. T., Roslander, C., Junicke, H., Mauricio-Iglesias, M., et al. (2020). Towards a digital twin: a hybrid data-driven and mechanistic digital shadow to forecast the evolution of lignocellulosic fermentation. Biofuels, Bioprod. Biorefining 14, 1046–1060. doi:10.1002/bbb.2108
Lo-Thong, O., Charton, P., Cadet, X., Grondin-Perez, B., Saavedra, E., Damour, C., et al. (2020). Identification of flux checkpoints in a metabolic pathway through white-box, grey-box and black-box modeling approaches. Sci. Rep. 10, 13446. doi:10.1038/s41598-020-70295-5
Martalò, G., Bianchi, C., Buonomo, B., Chiappini, M., and Vespri, V. (2020). Mathematical modeling of oxygen control in biocell composting plants. Math. Comput. Simul. 177, 105–119. doi:10.1016/j.matcom.2020.04.011
McBride, K., and Sundmacher, K. (2019). Overview of surrogate modeling in chemical process engineering. Chem. Ing. Tech. 91, 228–239. doi:10.1002/cite.201800091
Mora-Mariano, D., and Flores-Tlacuahuac, A. (2022). A machine learning approach for the surrogate modeling of uncertain distributed process engineering models. Chem. Eng. Res. Des. 186, 433–450. doi:10.1016/j.cherd.2022.07.050
Moretti, C., Hoefnagels, R., van Veen, M., Corona, B., Obydenkova, S., Russell, S., et al. (2022). Using lignin from local biorefineries for asphalts: lca case study for The Netherlands. J. Clean. Prod. 343, 131063. doi:10.1016/j.jclepro.2022.131063
Muñoz López, C. A., Telen, D., Nimmegeers, P., Cabianca, L., Logist, F., and Van Impe, J. (2018). A process simulator interface for multiobjective optimization of chemical processes. Comput. Chem. Eng. 109, 119–137. doi:10.1016/j.compchemeng.2017.09.014
Nguyen, H. (2014). Modelling of food waste digestion using ADM1 integrated with Aspen Plus. Southampton, UK: Ph.D. thesis, University of Southampton.
Pastor-Poquet, V., Papirio, S., Steyer, J.-P., Trably, E., Escudié, R., and Esposito, G. (2018). High-solids anaerobic digestion model for homogenized reactors. Water Res. 142, 501–511. doi:10.1016/j.watres.2018.06.016
Punnathanam, V., Sivadurgaprasad, C., and Kotecha, P. (2016). “Multi-objective optimal integration of biorefineries using nsga-ii and mogwo,” in 2016 International Conference on Electrical, Electronics, and Optimization Techniques (ICEEOT), 3970–3975. doi:10.1109/ICEEOT.2016.7755459
Quirante, N., and Caballero, J. A. (2016). Large scale optimization of a sour water stripping plant using surrogate models. Comput. Chem. Eng. 92, 143–162. doi:10.1016/j.compchemeng.2016.04.039
Quirante, N., Javaloyes, J., and Caballero, J. A. (2015). Rigorous design of distillation columns using surrogate models based on kriging interpolation. AIChE J. 61, 2169–2187. doi:10.1002/aic.14798
Riveros-Gomez, M., Zalazar-García, D., Mut, I., Torres-Sciancalepore, R., Fabani, M. P., Rodriguez, R., et al. (2022). Multiobjective optimization and implementation of a biorefinery production scheme for sustainable extraction of pectin from quince biowaste. ACS Eng. Au 2, 496–506. doi:10.1021/acsengineeringau.2c00018
Rodríguez Carpio, R., de Carvalho Miyoshi, S., Elias, A. M., Furlan, F. F., de Campos Giordano, R., and Secchi, A. R. (2021). Multi-objective optimization of a 1g-2g biorefinery: a tool towards economic and environmental viability. J. Clean. Prod. 284, 125431. doi:10.1016/j.jclepro.2020.125431
Sbarciog, M., De Buck, V., Akkermans, S., Bhonsale, S., Polanska, M., and Van Impe, J. F. M. (2022). Design, implementation and simulation of a small-scale biorefinery model. Processes 10, 829. doi:10.3390/pr10050829
Schack, D., Lueg, L., Schmidt, R., von Kurnatowski, M., Ludl, P. O., and Bortz, M. (2021). Data-driven process simulation using connected surrogate unit models exemplified on a steam methane reforming process. Chem. Ing. Tech. 93, 2052–2062. doi:10.1002/cite.202100087
Senthil Rathi, B., Senthil Kumar, P., and Vinoth Kumar, V. (2022). “Chapter 24 - sustainability assessment of third-generation biofuels: a life cycle perspective,” in Biofuels and bioenergy. Editors B. Gurunathan, R. Sahadevan, and Z. A. Zakaria (Elsevier), 523–534. doi:10.1016/B978-0-323-85269-2.00002-2
Sharma, S., and Rangaiah, G. P. (2013). “Multi-objective optimization applications in chemical engineering,” in Multi-objective optimization in chemical engineering (John Wiley & Sons, Ltd). chap. 3. 35–102. doi:10.1002/9781118341704.ch3
Shokry, A., Baraldi, P., Zio, E., and Espuña, A. (2020). Dynamic surrogate modeling for multistep-ahead prediction of multivariate nonlinear chemical processes. Industrial Eng. Chem. Res. 59, 15634–15655. doi:10.1021/acs.iecr.0c00729
Solarte-Toro, J. C., and Cardona Alzate, C. A. (2021). Biorefineries as the base for accomplishing the sustainable development goals (sdgs) and the transition to bioeconomy: technical aspects, challenges and perspectives. Bioresour. Technol. 340, 125626. doi:10.1016/j.biortech.2021.125626
Spriet, J. A., and Vansteenkiste, G. C. (1982). “Computer-aided modelling and simulation,” in International lecture series in computer science (London: Academic Press).
Tay, D. H. S., Ng, D. K. S., Sammons, N. E. J., and Eden, M. R. (2011). Fuzzy optimization approach for the synthesis of a sustainable integrated biorefinery. Industrial Eng. Chem. Res. 50, 1652–1665. doi:10.1021/ie1011239
Keywords: biorefinery, aspen plus, small-scale, multi-objective optimisation, energy model, white-box model, black-box model
Citation: De Buck V, Sbarciog MI, Cras J, Bhonsale SS, Polanska M and Van Impe JFM (2023) Critical analysis of the use of white-box versus black-box models for multi-objective optimisation of small-scale biorefineries. Front. Food. Sci. Technol. 3:1154305. doi: 10.3389/frfst.2023.1154305
Received: 30 January 2023; Accepted: 15 November 2023;
Published: 22 December 2023.
Edited by:
Ana Ribeiro, Centro de Quimica Estrutural -Instituto Superior Técnico-Univ. Lisboa, PortugalReviewed by:
Peam Cheali, Technical University of Denmark, DenmarkCopyright © 2023 De Buck, Sbarciog, Cras, Bhonsale, Polanska and Van Impe. This is an open-access article distributed under the terms of the Creative Commons Attribution License (CC BY). The use, distribution or reproduction in other forums is permitted, provided the original author(s) and the copyright owner(s) are credited and that the original publication in this journal is cited, in accordance with accepted academic practice. No use, distribution or reproduction is permitted which does not comply with these terms.
*Correspondence: Jan F. M. Van Impe, amFuLnZhbmltcGVAa3VsZXV2ZW4uYmU=
Disclaimer: All claims expressed in this article are solely those of the authors and do not necessarily represent those of their affiliated organizations, or those of the publisher, the editors and the reviewers. Any product that may be evaluated in this article or claim that may be made by its manufacturer is not guaranteed or endorsed by the publisher.
Research integrity at Frontiers
Learn more about the work of our research integrity team to safeguard the quality of each article we publish.