 Merve Yildirim Erturk
 Anh Nghi Minh Le
 Jozef Kokini
- Department of Food Science, Purdue University, West Lafayette, IN, Unites States
Molecular interactions determine the microstructure of food, as well as its response to deformation and flow. In order to design efficient processing equipment, to produce high-quality, stable end products, to predict textural and sensory properties, and to ensure consumer acceptance, the characterization of food rheology is essential. Deformations are rapid and large during the processing of foods and during consumption. In food studies, large amplitude oscillatory shear (LAOS) has become increasingly popular due to its ability to mimic real-life processes. When food is subjected to dynamic oscillatory shear tests, a sinusoidal deformation is applied, the mechanical stress (or strain) is probed, and the response is recorded. This chapter summarize main methods to extract meaningful rheological parameters from complex LAOS response of selected food materials. A time-resolved nonlinear rheology method, sequence of physical processes (SPP), gave detailed interpretations of transient microstructures, whereas the Fourier Transform coupled with Chebyshev decomposition (FTC) method provide static measurements at specific strains. LAOS behavior and its relationship to food microstructures and texture still needed to be studied in depth. By constructing more accurate mechanical models of complex food systems, the fundamental knowledge can be applied to evaluate the nonlinear rheology of food for consumer acceptance and efficient processing.
1 Introduction
Dynamic oscillatory shear flow measurements are used to study the elastic and viscous properties of viscoelastic materials, including polymeric materials, biopolymers, suspensions, emulsions, and food materials (Osswald and Rudolph, 2014). The small amplitude oscillatory shear (SAOS) tests are widely used rheological methods for determining the linear viscoelastic properties of a wide variety of food materials. These methods have been employed, for example, to assess starch pasting, protein denaturation, sol-gel transitions, and many more (Hyun et al., 2007; Duvarci et al., 2017b; Joyner Melito, 2018; Joyner, 2019). SAOS tests, though convenient and robust, are limited to linear viscoelastic regions, where 3D structures of materials are not permanently altered (Joyner, 2021). In SAOS tests, small stress/strain and frequency are used to ensure the food structure is not permanently damaged (Rodriguez, 2019). Food materials undergo permanent structural changes due to deformations associated with industrial processes, consumption (oral food preparation), and transportation (Ptaszek, 2015; Ptaszek, 2017). The rheological characteristics of a material change from linear viscoelastic to non-linear viscoelastic when strain amplitudes and frequency exceed the critical strain/stress range for linearity, this critical strain range is generally small and specific to material’s microstructure architecture (Song & Hyun, 2019). LAOS tests have become increasingly popular in recent years for examining nonlinear characteristics since they allow for control over the frequency, which determines the timescale of deformation, and the amplitude, which determines the range of deformation (Ng et al., 2006).
There are materials that have similar linear rheological properties that can exhibit distinct nonlinear rheology, which is why probing nonlinear rheology can provide information that is not available from linear measurements. As a result of LAOS rheology, one can observe macroscopic rheological responses reflecting microscopic process and breakdown during deformation (Hyun et al., 2011). LAOS describes the behavior of foods by mimicking industrial processing and oral processing, both of which involve a large amplitude of stress and strain. LAOS rheology has been extensively applied to study the nonlinear rheological properties of cheese (Anvari & Joyner, 2018), dough (Yazar et al., 2017; Duvarci et al., 2018; Bonilla et al., 2020a), protein gel (Liu et al., 2014), yogurt (Erturk et al., 2021) and tomato paste (Duvarci et al., 2017b).
In order to attain desirable textures in food materials, it is necessary to analyze the structure of the material as well as the mechanical and oral properties through rheological tests. Several studies have shown that LAOS properties can be used as indicators of chocolate extrusion quality (Sparkman et al., 2019), fat crystal networks in vegetable shortening (Rodriguez, 2019; B. A; Macias-Rodriguez et al., 2018; B; Macias-Rodriguez & Marangoni, 2016), dough aging (Turksoy et al., 2020; 2021), molecular breakdown of dough networks (Bonilla et al., 2020b), and fat content of yogurt products (Erturk et al., 2021). Studies have shown that large-strain rheological parameters have a good correlation with sensory analysis and oral processing data (Melito et al., 2012). Furthermore, LAOS could be used to determine the impact of various processing conditions on food systems, such as pH change in protein gel (Liu et al., 2014) and storage temperature of dough (Turksoy et al., 2020; Turksoy et al., 2021). Using LAOS rheology, we can also analyze interactions between proteins-polysaccharides, as well as oil-water interfaces, enabling us to simulate the food processing conditions, which include large and rapid deformations (Liu et al., 2022; Ma et al., 2020; Rodriguez, 2019; B; Macias-Rodriguez & Marangoni, 2016; Melito et al., 2012; Melito & Daubert, 2011).
2 Dynamic oscillatory shear measurements
In dynamic oscillatory tests, a material is subjected to a sinusoidal deformation and the mechanical response (stress) is measured over time (Hyun et al., 2011; Wagner et al., 2011). When strains amplitudes and frequencies are higher than the linearity critical strain range of a material, it transitions from a linear viscoelastic to a nonlinear viscoelastic region. Rheological properties become a function of strain amplitude and frequency in the nonlinear region (Ewoldt et al., 2008b; Hyun et al., 2011; C. H; Park et al., 2018; Wilhelm, 2002). A linear differential equation with constant coefficients is not adequate to describe the strain-stress response relations in the nonlinear region where the material microstructure is disturbed by the increased deformation strain and frequency (Park & Rogers, 2018). A dynamic oscillatory shear measurement can be used to determine the microstructure of materials, such as the density of crosslinks in a gel or the extent of association within a dispersion (Knoll & Prud’homme, 1987). By examining both inphase and outphase components of the response, the elastic and viscous nature of the material can be simultaneously examined (Ewoldt, 2009). Dynamic oscillatory shear measurements are performed by deforming the material with the deformation in the form of a sinusoidal curve:
where γ0 is strain amplitude at an angular frequency of ω. When the amplitude of the applied strain is small, the stress response is a perfect sinusoidal curve which is an indication of linear viscoelastic region characteristics. In this region, the stress response is formulated by:
where
2.1 Fourier transform Rheology
Dynamic oscillatory tests involve subjecting the test material to sinusoidal strain/stress and probing the response with respect to time. Wilhelm et al. (2002) applied the Fourier transform, one of the most convenient methods for analyzing sinusoidal signals, to assess the rheological response of the materials (Wilhelm, 2002). Fourier Transform Rheology transforms the stress response in the time domain into a frequency-dependent spectrum by accumulating sine and cosine functions at progressively higher frequencies (higher harmonics). It is possible to detect even very weak nonlinearities of the stress response by the intensities and phases of the higher harmonics in the Fourier Transform spectrum of the response to stress.
The stress response can be represented as:
With Fourier Transform Rheology, the stress response curve is evaluated in the form of a full spectrum of odd harmonic numbers (
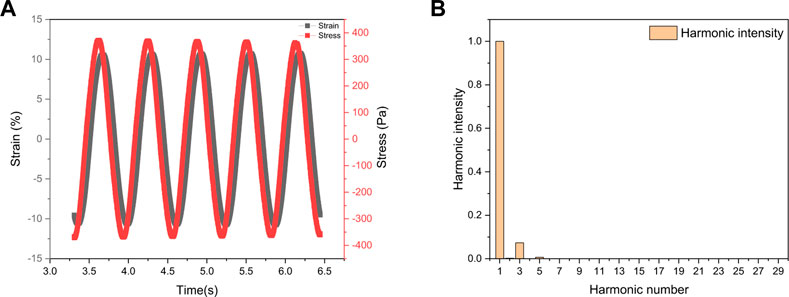
FIGURE 1. (A) Stress response curve with respect to time and (B) Fourier Transform of the stress curve.
In spite of the fact that Fourier Transform provides a sensitive framework for nonlinear rheology, it lacks a clear physical meaning of higher harmonics, as harmonic spectrum cannot be directly related to microstructural rearrangements. Thus, the studies employing solely the Fourier Transform Rheology is limited in the literature. The framework developed by Ewoldt et al. (2008) along with Fourier Transform has found wide variety of applications (Ewoldt et al., 2008a).
2.2 Fourier transform coupled with Chebyshev decomposition (FTC)
FT rheology is a sensitive indicator of nonlinearity, as quantified by total harmonic distortions or normalized third harmonic intensity (Debbaut & Burhin, 2002). The FT framework fails to provide an interpretation of the higher-order coefficient in a physical sense. Therefore, Ewoldt et al. (2008) have developed a new framework combining Fourier transforms and Chebyshev decomposition to analyze nonlinear viscoelasticity derived from Wilhelm’s (2002) framework (Wilhelm, 2002; Ewoldt et al., 2008a). In Fourier Transform coupled with Chebyshev decomposition (FTC), the resulting distorted stress response of the material in the time domain is deconvoluted by Fourier transform into the frequency domain using higher harmonic (3rd, 5th … ) numbers to quantify distortion:
An odd higher harmonic contribution (a higher stress amplitude and phase shift) expands the total nonlinear viscoelastic stress in the following way:
where
The methodology employs Chebyshev polynomials of the first order to relate Fourier coefficients with elastic and viscous contributions in terms of oscillating strain and strain rate, respectively:
Assuming that Tn is the nth-order Chebyshev polynomial of the first kind and
According to Ewoldt et al. (2008a), a material’s local nonlinear behavior can be captured by
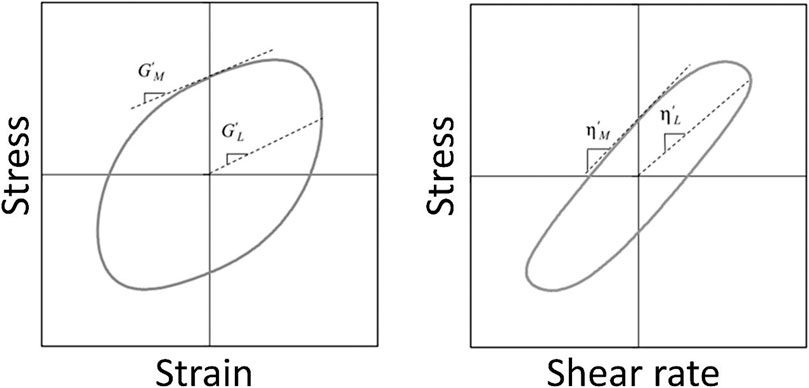
FIGURE 2. Lissajous-Bowditch (LB) curves with the geometrical representation of
The elastic and viscous measures converge to constant values in the linear viscoelastic region (
At minimum or large strain, a dimensionless index of nonlinearity, S (Strain-Stiffening Ratio) & T (Shear-Thickening Ratio) can be calculated using the modulus/viscosity parameter as follows (Ewoldt et al., 2008a):
S = 0 and T = 0 for a linear elastic response, S > 0 shows intracycle strain stiffening, and S < 0 corresponds to intracycle strain-softening; T > 0 indicates intracycle shear-thickening, and T < 0 intracycle shear-thinning behavior.
The detailed framework for characterizing nonlinear viscoelasticity with Fourier transform coupled with the Chebyshev decomposition method can be found elsewhere (Ewoldt, Hosoi, & McKinley, 2008; Ewoldt et al., 2010; Hyun et al., 2011; Ng et al., 2011; Ewoldt, 2013).
Lissajous-Bowditch curves enable visualization of the characteristic transitions from the linear to the nonlinear viscoelastic region and the dramatic changes in the shape of the curve as you move into the nonlinear viscoelastic region are clearly illustrated visually. 3D curves of Lissajous-Bowditch (LB) curve consist of stress, strain and strain rate of the material response with respect to time (Figure 3). In order to distinguish between the viscous and elastic natures of the response, the elastic projection of the LB curve (strain vs. stress) as well as the viscous projection of the LB curve (strain rate vs. stress) are tracked (Ewoldt et al., 2008a). For small strain amplitudes, the elastic Lissajous–Bowditch curves are elliptical, but they become increasingly distorted in the nonlinear regime. With large strain amplitudes, the projecting elastic ellipse becomes larger, thus indicating pronounced elastic strain stiffening (Ewoldt et al., 2008a). In the linear viscoelastic region, the viscous projections at the lowest strain had an elliptic shape with small major to minor axis ratio indicating strong elastic-dominated behavior. Progressive distortions at progressively increasing strain amplitudes in the nonlinear region decreased the area enclosed by the loop and resulted in higher ratios of major to minor axis indicating shear thinning behavior (Erturk et al., 2021).
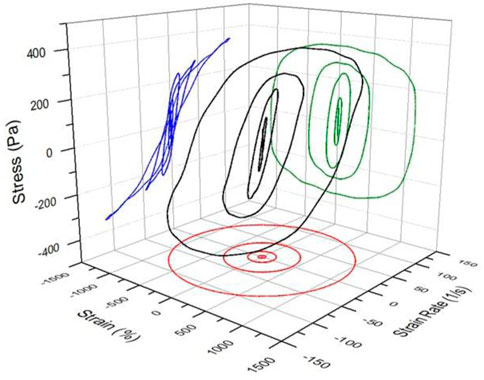
FIGURE 3. The 3-D un-normalized LB curves of stress response loops (black), stress versus strain projections/ elastic projections (green), stress versus strain rate loops/viscous projections (blue), strain versus strain rate loops (red). These loops include nonfat yogurt LB curves at 0.063, 0.25, 1.01, 4.21, 18, 69, 266, 1000% oscillation strain amplitudes.
Fourier Transform coupled with Chebyshev decomposition method along with Lissajous-Bowditch curves have been utilized to interpret the nonlinear rheological structures of various food systems including wheat dough (Douillard et al., 1991; Yazar et al., 2016a; Duvarci et al., 2017b), native starch in water (Klein et al., 2008), gluten (Ng et al., 2006), carragenan gels (Klein et al., 2007; Klein et al., 2008; Melito et al., 2013b), starches (Klein et al., 2008; Li et al., 2009; Alvarez-Ramirez et al., 2019), waxy maize starch paste (Wang et al., 2012), soy protein isolate-flax seed gum dispersions (Bi et al., 2013), dark chocolate (van der Vaart et al., 2013), water-in-oil emulsions (Shu et al., 2013), cheddar, Mozarella, and American cheese (Melito et al., 2013b; 2013a), whey protein-agar complexes (Rocha et al., 2014), tuna myofibrillar protein gels (Liu et al., 2014), foams (Ptaszek, 2015; 2017), yeast biofilms (Brugnoni et al., 2014), agar with locust bean gum (Sousa & Gonçalves, 2015), mashed potato (Joyner & Meldrum, 2016), egg white protein foam with added apple pectin and xanthan gum (Ptaszek, 2014), gelatin gels (Goudoulas & Germann, 2019), shortening (B. Macias-Rodriguez & Marangoni, 2016), gluten-free doughs (Yazar et al., 2016a; Yazar et al., 2016c; Yazar et al., 2017), tomato paste (Duvarci et al., 2017b), gum extracted from Alyssum homolocarpum seed (Anvari et al., 2018), waxy rice starch (Precha-Atsawanan et al., 2018), fish gelatin-gum arabic mixture in oil (Anvari & Joyner, 2017), sourdough (Yildirim-Mavis et al., 2019), yogurt with various fat contents (Erturk et al., 2021), dough at aging at room and elevated temperatures (Turksoy et al., 2020; Turksoy et al., 2021), noodle (Feng et al., 2023), Boletus edulis flour (Nikolić et al., 2023).
2.3 Medium amplitude oscillatory shear (MAOS) Rheology
The small amplitude oscillatory shear (SAOS) measurement enables non-destructive material rheology and structure analysis. In reality, however, most food processing operations involve large and rapid changes in the physical properties of the materials. Thus, it is necessary to carry out large amplitude oscillatory measurements (LAOS) in order to mimic these conditions, and also to investigate the effect of large deformations beyond the linear region for the purpose of determining the complex responses of nonlinear deformations (Ptaszek, 2015). The analysis of the nonlinear region with the Fourier transform is complicated due to the fact that it requires the inclusion of a greater number of harmonic intensity contributions of the Fourier Spectrum (Wilhelm, 2002). Thus, the transition region called medium amplitude oscillatory shear (MAOS) region between SAOS and LAOS regions has been regarded as being of particular interest for the study of non-linear rheological behavior of materials (Bharadwaj & Ewoldt, 2015a). It has been shown that the first (1st) and third (3rd) harmonics of a material’s rheological response characterize medium amplitude oscillatory shear (MAOS) rheology of the material (Song & Hyun, 2019). A medium amplitude oscillatory shear (MAOS) characterization examines a region of intrinsic-nonlinearity independent of the disadvantages of LAOS (Ewoldt, 2009; Wang et al., 2011; Ewoldt, 2013; Bharadwaj & Ewoldt, 2015a; Singh et al., 2018) such as experimental artifacts, edge fractures, wall slip, nonhomogeneous shear, fracture, and failure of materials (Wang et al., 2011). The MAOS parameters are more sensitive than LAOS parameters in identifying the topology of polymers and their molecular weights, since they detect the intrinsic nonlinear region without destroying the structure significantly (Ewoldt & Bharadwaj, 2013; Bharadwaj & Ewoldt, 2015a; Bharadwaj et al., 2017; Hyun & Wilhelm, 2018; Singh et al., 2018). Even though the approach of asymptotical nonlinearity is a long-standing one (Davis & Macosko, 1978), recent studies have provided a new perspective on asymptomatic regions (Ewoldt, 2013; Bharadwaj & Ewoldt, 2015a; Bharadwaj et al., 2017; Hyun & Wilhelm, 2018; Singh et al., 2018).
A first harmonic characterizes the stress response in the SAOS region, since the stress response is a perfect sinusoidal curve. In order to characterize nonlinear stress responses of materials in the time domain, higher harmonics of Fourier transforms must be included and evaluated as applied strain increases (Wilhelm, 2002). Due to the lack of distortion in the stress response in the linear viscoelastic region, the third harmonic intensity to the first harmonic intensity (
In accordance with R. Ewoldt & Bharadwaj (2013), the borders of SAOS, MAOS, and LAOS are determined by the relative magnitudes of second, third, and fifth harmonic intensities compared to first and third harmonic intensities (Ewoldt & Bharadwaj, 2013; Bharadwaj & Ewoldt, 2015b; Singh et al., 2018). Random noise and imperfect excitation lead to the appearance of the second harmonic in a shear-symmetric material (Hyun et al., 2011), thus κ ≤
Hyun and Wilhelm (2018) developed an approach to define a nonlinear Q-parameter (Q =
2.3.1 Determination of boundaries of SAOS and MAOS regions
The stress response of materials in the linear viscoelastic region can be mainly characterized by its first harmonic through Fourier transform, which transforms the perfect sinusoidal oscillation response from the time domain to the frequency domain. The periodic oscillation cycle becomes distorted as strain increases, causing it to deviate from perfect sinusoidal curve. As a result of this deviation, higher order odd harmonic intensities appear along with the first harmonic in the Fourier Spectrum (Hyun et al., 2011). The higher-order odd harmonics, starting with the third harmonic, then the 5th harmonic, then the 7th harmonic, and so on, correspond to waves three times, five times, seven times, etc., of the first harmonic. It has been reported that the amplitude or intensity of the third harmonic is strongly related to the underlying polymer structure, resulting in characteristic rheological signatures (Hyun et al., 2006a; 2007; Hoyle et al., 2014). As a result, initial nonlinearities arising from the nonlinear behavior of the material are captured by the third harmonic intensity in a systematic manner:
where
The framework that defines the boundaries of MAOS region is developed by Ewoldt and Bharadwaj (Ewoldt & Bharadwaj, 2013; Bharadwaj & Ewoldt, 2015a; Bharadwaj & Ewoldt, 2015b; Bharadwaj et al., 2017). SAOS and MAOS regions are defined by the analysis of intensity ratios (I2/1, I3/1, I2/3, I5/3) in relation to strain amplitude. This methodology has been utilized to understand the nonlinear rheological behavior of soft wheat dough (SWD), hard wheat dough (HWD) and semolina dough (SemD) at 10 rad/s as given in Figure 5.
Rheological measurements suffer from low-torque limits characterized by noisy data at very small frequencies and strain amplitudes. It has been shown that the intensity of the second harmonic compared with the first harmonic (
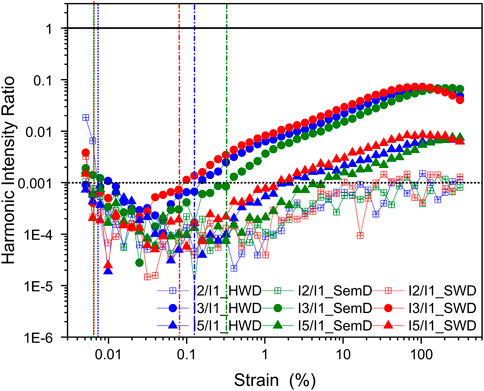
FIGURE 4. The harmonic intensity map of doughs including
The nonlinearity and noise boundaries of the MAOS region is analyzed with respect to third harmonic (
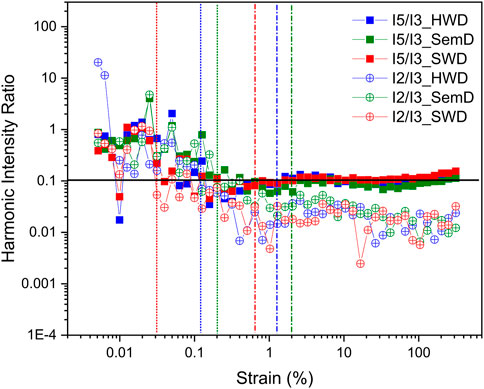
FIGURE 5. Typical harmonic intensity map of SWD, HWD, and SemD including I5/3 and I2/3 during amplitude sweep experiment at 10 rad/s. The boundaries of MAOS of each dough have been shown by vertical lines.
Hyun et al. (2006) attempted to characterize and compare the I3/I1 of linear and branched polypropylenes as model systems to determine the MAOS region with I3/I1 versus strain amplitude curves (typically in the strain region between 30%–100%) in log-log coordinates (Hyun et al., 2006a). Fourier Transform of the stress response is formulated with first and third harmonic intensity with a relation of I1 ∝ γ0 and I3 ∝ γ03, respectively. Then, the quadratic scaling result that the first harmonic to third harmonic ratio have a relation with γ 02, I3/I1 ∝ γ02. I3/I1 as a function of strain amplitude shows a log-linear relationship and the slope is 2. The slopes of the non-linear function Q and I3/I1 versus strain amplitude of linear polymers with various molecular weights and distribution approach to 2. By increasing the fraction of branching, the slope of third harmonic intensity to first harmonic intensity (I3/I1) gradually decreases to 1.64. Therefore, I3/I1 has proven to be a sensitive measure to distinguish polymer topology (linear or branched) and the degree of branching by MAOS characterization (Hyun et al., 2006b). Hyun et al. (2007) investigated the effect of excitation frequency, temperature, and polymer topology of various polymer melts including HDPE, PLA/Epoxy, LDPE (Hyun et al., 2007). The linear polymer melts had a slope of 2, whereas branching decreased the slope of I3/I1 independent of excitation frequency and temperature of the polymer melt (Hyun et al., 2007).
Fourier-transform rheology (FT-rheology) and nonlinear coefficient, Q =
MAOS has received considerable attention lately due to its ability to differentiate the large strain rheological behavior caused by polymer topology and molecular weight of polymers among other structural features (Neidhöfer et al., 2003; Hyun et al., 2006a; Hyun & Wilhelm, 2009; Wagner et al., 2011; Hyun & Wilhelm, 2018). Our observations on the dynamic oscillatory shear measurements focusing especially on medium amplitude oscillatory shear region (MAOS) of dough with various protein content revealed that protein content of dough was correlated with the MAOS parameters and soft wheat dough (SWD) showed the highest microstructural deformation followed by HWD and SemD (Erturk, 2022). Although MAOS offers the benefits described earlier, one significant drawback of the conventional method is its laborious and resource-intensive nature. The material functions that are dependent on frequency in MAOS are usually obtained by conducting strain amplitude sweeps at each frequency and then fitting equations to the obtained data. This data acquisition process is time-consuming since data at multiple strain amplitudes are required at each frequency.
2.4 The sequence of physical processes (SPP) for LAOS
The FTC requires the secant and tangent terms at the maximum and minimum values of the stress response of the material. Discrete local measures and parameters are widely separated, and their links to rheological properties are difficult to establish. The sequential physical process methodology (SPP) was developed by Rogers et al. (2011) has contributed to improving our understanding of nonlinear rheology by providing new physical interpretations and insights into complex materials (Choi et al., 2021; Lee & Rogers, 2017; Rogers, 2012; S; Rogers et al., 2012). According to this approach, the instantaneous transient modulus (modulus with respect to time) within the oscillation cycle of strain as well as its variability is defined by the Frenet-Serret Theorem (Rogers, 2012; Rogers, 2017; Donley et al., 2019; Donley et al., 2020).
The SPP methodology is a way of evaluating the rheological response of a material based on a three-dimensional array of strain, strain rate, and stress values over time. This methodology represents and evaluates the material’s response by constructing this array and using it to analyze the material’s behavior. Each point in an oscillation cycle is given by a position vector, P(t):
Frenet-Serret Theorem uses an orthonormal set consisting of vectors called tangent (T(t)), normal (N(t)), and binormal vectors (B(t)) that help define any point in a three-dimensional space as a function of time as represented in Figure 6. The tangent vector (T(t)) points to the direction of flow which is tangent to the L-B curve defined by the time derivative of the position vector, T(t) =
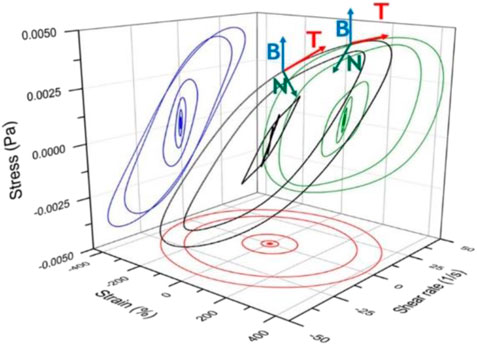
FIGURE 6. Frenet-Serret Framework of nonlinear response in deformation space with arbitrary T(t), N(t), and B(t) on a representative Lissajous-Bowditch curve.
Each point throughout the applied strain cycle is defined by distinct vectors of T, N, and B (Rogers, 2012; 2017).
The projections of binormal vector B(t) =
where
If instantaneous/transient elastic (
Rather than selecting discrete values at specific strains and strain rates, the SPP approach incorporates all strain, strain rate, and stress components along the L-B curve (Ewoldt et al., 2008a). Throughout the oscillation cycle, the instantaneous moduli were interpreted using Cole-Cole plots (Donley et al., 2019), which show how they change over time. The SPP framework also offers a unique feature in that it determines the derivatives of the transient moduli. By doing so, it is possible to gather detailed information about the transients related to time and magnitude of the material characteristics, such as softening, stiffening, thickening, or thinning. SPP parameters are presented on a Cole-Cole plot (instantaneous vs. plot) which enables an easier interpretation of the dynamics of materials as shown in Figure 7.
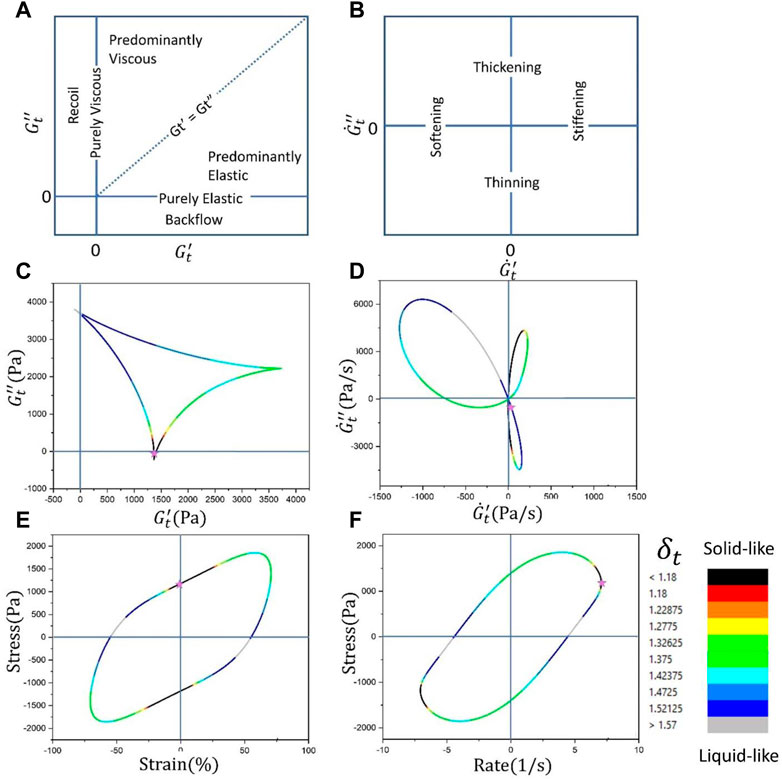
FIGURE 7. Positions and trajectories of
2.4.1 Utilizing sequence of physical processes (SPP) for characterizing LAOS properties of doughs
The SPP method differs from the Fourier Transform methods because it considers the entire response curve of the data with respect to each wave cycle, and the response curve does not need to be periodic to be evaluated in the SPP method. As a result, the time-dependent moduli and their derivatives, as well as the equilibrium position and strain, may be traced over time, which will allow us to get a better understanding of how rheological behaviors progress over time as the material responds to the input, which directly correlates the response to physical behavior (Lee & Rogers, 2017; Rogers, 2017). Analyzing the response with SPP permits a more detailed understanding of the material response as linear and nonlinear behavior evolves.
There has been a substantial amount of research showing that the SPP method is able to accurately predict the polymer response under LAOS under a variety of rheological models (Rogers, 2012; Rogers, 2017; S; Rogers et al., 2012). It has also been demonstrated that it can also be applied to polymer-like micellar solutions (Lee et al., 2019) and multi-arm star polymers (Lee & Rogers, 2017; S; Rogers et al., 2011). Even though SPP method should be fully applicable to any solid, semisolid, or viscoelastic material, there is not enough literature about food and food-related systems as of yet. Since the parameters generated by this method operate as functions of time, it may be challenging to correlate the results with other rheological and sensory data (Joyner, 2021).
Fourier transform coupled with Chebyshev polynomials (FTC) and sequence of physical processes (SPP) methodologies were used to study, interpret and compare the large amplitude oscillatory shear (LAOS) responses of doughs prepared with semolina, hard wheat flour, and pectin solution (Erturk et al., 2022).
When dough is subjected to large strains, its rheological behavior transitions from elastic (solid-like) behavior to viscous (liquid-like) behavior beyond a critical strain where
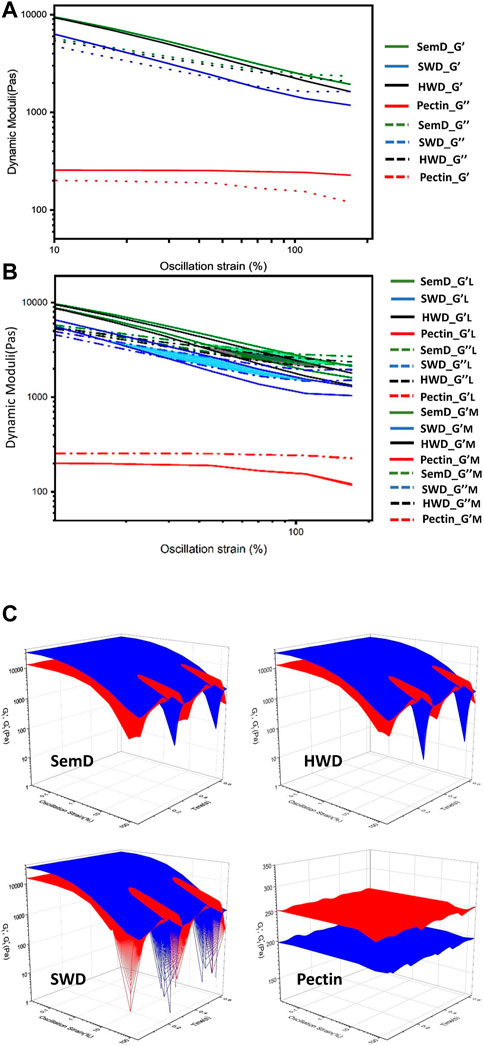
FIGURE 8. The determination of crossover points of (A) with cycle-averaged dynamic moduli
SPP methodology, on the other hand, extends the notion of stepwise degradation with instantaneous moduli in a cycle over time. As shown in Figure 9, the behavior of instantaneous moduli is visualized by plotting
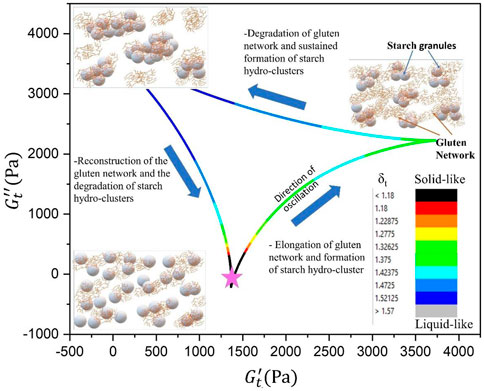
FIGURE 9. The sequences of physical processes that molecular structure of dough goes through during an oscillation cycle. The star shows the starting point of the oscillation cycle where t = 0s.
In terms of time, strain, or strain rate, it is possible to track how stress evolves in a material response with SPP method. The orientation and area of the deltoids help to visualize the deformation evolution of the material. An increase in the amplitude of strain causes a change in the orientation of the deltoid. The area of the deltoids/extensions of each side are dependent on the range of displacements occurring between microstructural units during intracycle rheological transitions (Rogers, 2012; Rogers, 2017; S; Rogers, 2018). The range of structural rearrangements at that strain amplitude is wider within the material if the deltoid has a larger area or extended sides (Park & Rogers, 2018; Park & Rogers, 2020).
Yazar et al. have reported that past studies on dough using FTC method showed strain stiffening caused by gluten networks and shear thinning caused by reduced starch interactions. Increasing strain amplitudes are compared without time information to determine the intercycle nonlinear characteristics of dough (Yazar et al., 2016a). Conversely, SPP methodology provides a history of regenerative deformation within a dough structure during an oscillation cycle (Erturk et al., 2022). Figure 9 shows a representative Cole-Cole plots for dough sample in the nonlinear region, the starting point of the oscillation cycle is marked with a star. Immediately after deformation starts, doughs experience a slight reduction in instantaneous while is constant as a function of time, reaching a local minimum value, which indicates initial small thinning caused by temporary alignment of microstructural constituents. Starch clusters encapsulated within the gluten network behave as a solid (highly elastic) network with δt<1.18 (black color mapping). With an increase in intracycle strain, instantaneous
2.4.2 Utilizing sequence of physical processes (SPP) for characterizing LAOS properties of cheese spreads
Processes occurred to food materials in real life setting such as food processing and consumption call for the application of large deformations in the nonlinear regime. Therefore, LAOS has been used extensively to study viscoelastic behaviors of food and their relationships with composition and microstructure. Regardless of the robust rheological measurements obtained from LAOS, extracting meaningful physical interpretation from LAOS remains a challenge. Hence, using a combination of analysis methods can help to strengthen the validity of experimental results. In studying the nonlinear behavior of processed cheese spreads, Le et al. (2023) used the coupled frequency-amplitude sweep to probe the nonlinearity of the materials with linear rheology. The cheese spreads were investigated at selected strains between 0% and 1000% where the strain sweep was stopped, and immediately followed by a frequency sweep within in the linear region of the materials (Figure 10).
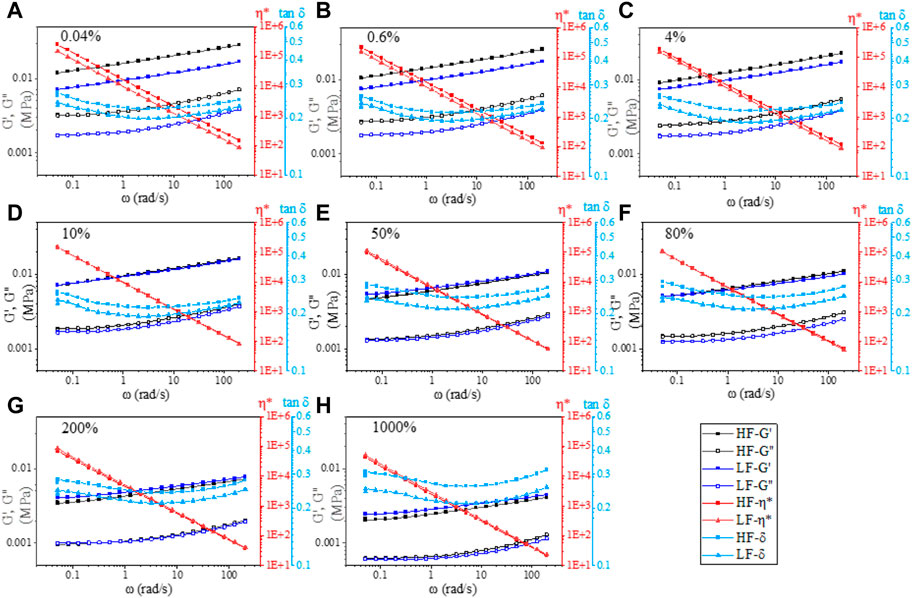
FIGURE 10. Frequency sweeps (set at amplitude strain of 0.04%) of processed cheese spreads immediately after the amplitude sweep was stopped at selected strain values ((A) 0.04%, (B) 0.6%, (C) 4%, (D) 10%, (E) 50%, (F) 80%, (G) 200%, and (H) 1,000%). HF- high-fat cheese spread, LF- low-fat cheese spreads.
In agreement with amplitude sweep (0%–1000% at 10 rad/s), these frequency sweeps also show the decrease of G′ and G″ as the strain increased due to structure decay. Additionally, the changes in these parameters as a function of strain obtained in this way also provide more insight to how the decay process occurs. While the high-fat (HF) sample had higher
In all cases, the deltoids are positioned higher than the
There is a positive relationship between the area of the deltoids and the displacement the material is subjected to causing changes of the material′s microstructure during an oscillation cycle (Lee & Rogers, 2017). In Figure 11A, the strain range between 0.04% and 1000% induced the most displacement in both the HF and LF cheese networks, as the deltoids are the biggest within this strain range. Specifically, the size of the deltoids in both samples increases as strain increases and reached a maximum at 50% strain. Additionally, the shape of all deltoids for both cheeses appear to experience a similar process of physical change in each oscillation cycle at different strain amplitudes. As indicated in Figure 11B, this process can be described in 4 stages: 1) shear thinning and strain softening, 2) shear thickening and strain stiffening, 3) shear thickening and strain softening, 4) shear thinning and strain softening. SPP has also been able to show the transition from shear thickening (stage 2 and 3) to shear thinning (stage 4) reported by FTC parameters, with the additional transition from shear thinning (region 1) to shear thickening (stage 2) at the beginning of the oscillation cycle. As the size of LF sample′s deltoids are bigger than the HF sample′s up to 50% strain, these physical changes occurred to a higher extent in the LF sample. This agrees with the higher degree of strain stiffening observed in
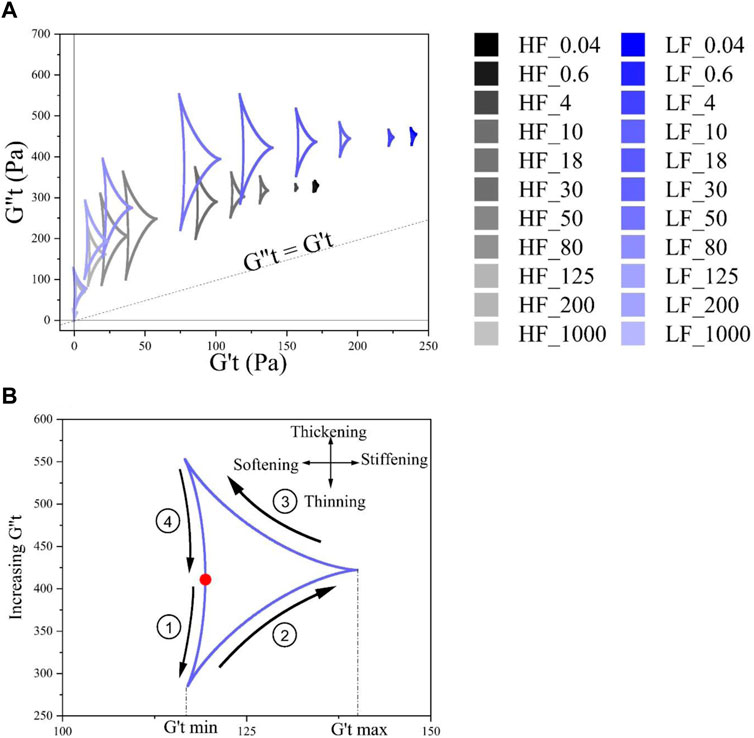
FIGURE 11. Cole-Cole plots of PCS samples at increasing strain amplitudes (A) the zoom-in of a single Cole-Cole plot demonstrating their general behavior during one oscillation cycle (B). The red circle denotes the starting point of the oscillation cycle.
3 Conclusion
Molecular interactions determine the microstructure of food, as well as its response to deformation and flow. In order to design efficient processing equipment, to produce high-quality, stable end products, to predict textural and sensory properties, and to ensure consumer acceptance, the characterization of food rheology is essential. Deformations are rapid and large during the processing of foods and during consumption. In food studies, LAOS has become increasingly popular due to its ability to mimic real-life processes more closely. When food is subjected to dynamic oscillatory shear tests, a sinusoidal deformation is applied, the mechanical stress (or strain) is probed, and the response is recorded. In linear viscoelastic region, SAOS exhibits a perfect sinusoidal curve in its mechanical response. This chapter summarize main methods to extract meaningful rheological parameters from complex LAOS response. A time-resolved nonlinear rheology method, SPP, gave detailed interpretations of transient microstructures, whereas an FTC method provided static measurements at specific strains. Food LAOS behaviors and their relationship to food microstructures and textures still needed to be studied in depth. By constructing more accurate mechanical models of complex food systems, the fundamental knowledge gained in this project can be applied to evaluate the nonlinear rheology of food for consumer acceptance and efficient processing.
Author contributions
ME—writing, data collection and analysis, original manuscript, investigation, curation, methodology, AL—data analysis, writing, editing, data collection JK—funding, supervision, writing-editing. All authors contributed to the article and approved the submitted version.
Conflict of interest
The authors declare that the research was conducted in the absence of any commercial or financial relationships that could be construed as a potential conflict of interest.
Publisher’s note
All claims expressed in this article are solely those of the authors and do not necessarily represent those of their affiliated organizations, or those of the publisher, the editors and the reviewers. Any product that may be evaluated in this article, or claim that may be made by its manufacturer, is not guaranteed or endorsed by the publisher.
References
Alvarez-Ramirez, J., Carrera-Tarela, Y., Carrillo-Navas, H., Vernon-Carter, E. J., and Garcia-Diaz, S. (2019). Effect of leavening time on Laos properties of yeasted wheat dough. Food Hydrocoll. 90, 421–432. doi:10.1016/j.foodhyd.2018.12.055
Anvari, M., and Joyner, H. S. (2018). Concentrated emulsions as novel fat replacers in reduced-fat and low-fat Cheddar cheeses. Part 2. Large amplitude oscillatory shear behavior. Int. Dairy J. doi:10.1016/J.IDAIRYJ.2018.08.018
Anvari, M., and Joyner, H. S. (2017). Effect of fish gelatin and gum Arabic interactions on concentrated emulsion large amplitude oscillatory shear behavior and tribological properties. Food Hydrocoll. 79 , 518–525. doi:10.1016/j.foodhyd.2017.12.016
Anvari, M., Tabarsa, M., and Joyner (Melito), H. S. (2018). Large amplitude oscillatory shear behavior and tribological properties of gum extracted from Alyssum homolocarpum seed. Food Hydrocoll. 77, 669–676. doi:10.1016/J.FOODHYD.2017.11.008
Armstrong, M., Baker, J., Trump, J., Milner, E., Wickiser, J. K., Cameron, K., et al. (2021). Structure-rheology elucidation of human blood via SPP framework and TEVP modeling. Korea Aust. Rheology J. 33 (1), 45–63. doi:10.1007/s13367-021-0005-1
Bharadwaj, N. A., and Ewoldt, R. (2015). Constitutive model fingerprints in medium-amplitude oscillatory shear. J. Rheology 59 (2), 557–592. doi:10.1122/1.4903346
Bharadwaj, N. A., and Ewoldt, R. (2014). The general low-frequency prediction for asymptotically nonlinear material functions in oscillatory shear. J. Rheology 58 (4), 891–910. doi:10.1122/1.4874344
Bharadwaj, N. A., Schweizer, K. S., and Ewoldt, R. (2017). A strain stiffening theory for transient polymer networks under asymptotically nonlinear oscillatory shear. J. Rheology 61 (4), 643–665. doi:10.1122/1.4979368
Bi, C. H., Li, D., Wang, L. J., Wang, Y., and Adhikari, B. (2013). Characterization of non-linear rheological behavior of SPI-FG dispersions using Laos tests and FT rheology. Carbohydr. Polym. 92 (2), 1151–1158. doi:10.1016/j.carbpol.2012.10.067
Bonilla, J. C., Erturk, M. Y., and Kokini, J. L. (2020). Understanding the role of gluten subunits (LMW, HMW glutenins and gliadin) in the networking behavior of a weak soft wheat dough and a strong semolina wheat flour dough and the relationship with linear and non-linear rheology. Food Hydrocoll. 108, 106002. doi:10.1016/j.foodhyd.2020.106002
Brugnoni, L. I., Tarifa, M. C., Lozano, J. E., and Genovese, D. (2014). In situ rheology of yeast biofilms. Biofouling 30 (10), 1269–1279. doi:10.1080/08927014.2014.981165
Carey-De La Torre, O. (2017). Elastic stiffening in PVA-Borax studied with experimental medium amplitude oscillatory shear. Available at: https://www.ideals.illinois.edu/handle/2142/99288.
Carotenuto, C., Grosso, M., and Maffettone, P. L. (2008). Fourier transform rheology of dilute immiscible polymer blends: A novel procedure to probe blend morphology. Macromolecules 41 (12), 4492–4500. doi:10.1021/ma800540n
Chaparian, E., and Tammisola, O. (2019). An adaptive finite element method for elastoviscoplastic fluid flows. J. Newt. Fluid Mech. 271, 104148. doi:10.1016/j.jnnfm.2019.104148
Cho, K. S., Hyun, K., Ahn, K. H., and Lee, S. J. (2005). A geometrical interpretation of large amplitude oscillatory shear response. J. Rheology 49 (3), 747–758. doi:10.1122/1.1895801
Choi, J., Armstrong, M., and Rogers, S. A. (2021). The role of elasticity in thixotropy: Transient elastic stress during stepwise reduction in shear rate. Phys. Fluids 33 (3), 033112. doi:10.1063/5.0042579
Coussot, P. (2018). Slow flows of yield stress fluids: Yielding liquids or flowing solids? Rheol. Acta 57 (1), 1–14. doi:10.1007/s00397-017-1055-7
Cziep, M. A., Abbasi, M., Heck, M., Arens, L., and Wilhelm, M. (2016). Effect of molecular weight, polydispersity, and monomer of linear homopolymer melts on the intrinsic mechanical nonlinearity 3Q0(ω) in MAOS. Macromolecules 49 (9), 3566–3579. doi:10.1021/acs.macromol.5b02706
Davis, W. M., and Macosko, C. W. (1978). Nonlinear dynamic mechanical moduli for polycarbonate and PMMA. J. Rheology 22 (1), 53–71. doi:10.1122/1.549500
Debbaut, B., and Burhin, H. (2002). Large amplitude oscillatory shear and Fourier-transform rheology for a high-density polyethylene: Experiments and numerical simulation. J. Rheology 46 (5), 1155–1176. doi:10.1122/1.1495493
Dinkgreve, M., Paredes, J., Denn, M. M., and Bonn, D. (2016). On different ways of measuring “the” yield stress. J. Newt. Fluid Mech. 238, 233–241. doi:10.1016/j.jnnfm.2016.11.001
Dogan, H., and Kokini, J. L. (2006). “Rheological properties of foods,” in Handbook of food engineering (England, UK: Routledge). doi:10.1201/b18668-4
Donley, G. J., de Bruyn, J. R., McKinley, G. H., and Rogers, S. A. (2019). Time-resolved dynamics of the yielding transition in soft materials. J. Newt. Fluid Mech. 264, 117–134. doi:10.1016/j.jnnfm.2018.10.003
Donley, G. J., Singh, P. K., Shetty, A., and Rogers, S. A. (2020). Elucidating the G? Overshoot in soft materials with a yield transition via a time-resolved experimental strain decomposition. Proc. Natl. Acad. Sci. U. S. A. 117 (36), 21945–21952. doi:10.1073/pnas.2003869117
Douillard, R., Lefebvre, J., and Tran, V. (1991). Models of protein adsorption at gas–liquid interfaces. Food Polym. Gels Colloids Woodhead Publishing, 564–570. doi:10.1533/9781845698331.1.564
Duvarci, O., Yazar, G., Dogan, H., and Kokini, J. L. (2018). “Linear and non-linear rheological properties of foods,” in Handbook of food engineering. Editors D. R. Heldman, D. B. Lund, and C. Sabliov (England, UK: Routledge).
Duvarci, O., Yazar, G., and Kokini, J. L. (2017a). The comparison of Laos behavior of structured food materials (suspensions, emulsions and elastic networks). Trends Food Sci. Technol. 60, 2–11. doi:10.1016/j.tifs.2016.08.014
Duvarci, O., Yazar, G., and Kokini, J. L. (2017b). The SAOS, MAOS and Laos behavior of a concentrated suspension of tomato paste and its prediction using the Bird-Carreau (SAOS) and Giesekus models (MAOS-Laos). J. Food Eng. 208, 77–88. doi:10.1016/j.jfoodeng.2017.02.027
Erturk, M. Y., Bonilla, J. C., and Kokini, J. (2021). Relationship of non-linear rheological properties and quantitative network analysis parameters as a function of increasingly large amplitude deformations in non-fat, low-fat and high-fat yogurt products. Food Hydrocoll. 111, 106194. doi:10.1016/j.foodhyd.2020.106194
Erturk, M. Y. (2022). Nonlinear rheology of food materials. West Lafayette: Diss. Purdue University Graduate School.
Erturk, M. Y., Rogers, S. A., and Kokini, J. (2022). Comparison of sequence of physical processes (SPP) and fourier transform coupled with Chebyshev polynomials (FTC) methods to interpret large amplitude oscillatory shear (Laos) response of viscoelastic doughs and viscous pectin solution. Food Hydrocoll. 128, 107558. doi:10.1016/j.foodhyd.2022.107558
Ewoldt, R., and Bharadwaj, N. A. (2013). Low-dimensional intrinsic material functions for nonlinear viscoelasticity. Rheol. Acta 52 (3), 201–219. doi:10.1007/s00397-013-0686-6
Ewoldt, R. (2013). Defining nonlinear rheological material functions for oscillatory shear. J. Rheology 57 (1), 177–195. doi:10.1122/1.4764498
Ewoldt, R. H., Hosoi, A. E., and McKinley, G. H. (2008). New measures for characterizing nonlinear viscoelasticity in large amplitude oscillatory shear. J. Rheology 52 (6), 1427–1458. doi:10.1122/1.2970095
Ewoldt, R. H. (2009). Nonlinear viscoelastic materials: Bioinspired applications and new characterization measures. PhD Thesis, 1–313. doi:10.1104/pp.106.080945
Ewoldt, R. H, Johnston, M. T., and Caretta, L. M. (2014). Experimental challenges of shear rheology: How to avoid bad data. Complex Fluids in Biological Systems: Experiment, Theory, and Computation, 207–241.
Ewoldt, R., Winter, P., Maxey, J., and McKinley, G. H. (2010). Large amplitude oscillatory shear of pseudoplastic and elastoviscoplastic materials. Rheol. Acta 49 (2), 191–212. doi:10.1007/s00397-009-0403-7
Feng, S., Xing, J. J., Guo, X. N., and Zhu, K. X. (2023). Nonlinear rheological properties of Chinese cold skin noodle (liangpi) and wheat starch gels by large amplitude oscillatory shear (Laos). Food Hydrocoll. 134, 108030. doi:10.1016/j.foodhyd.2022.108030
Fernandes, R. R., Andrade, D. E. V., Franco, A. T., and Negrão, C. O. R. (2017). The yielding and the linear-to-nonlinear viscoelastic transition of an elastoviscoplastic material. J. Rheology 61 (5), 893–903. doi:10.1122/1.4991803
Fleury, G., Schlatter, G., and Muller, R. (2004). Non linear rheology for long chain branching characterization, comparison of two methodologies: Fourier transform rheology and relaxation. Rheol. Acta 44 (2), 174–187. doi:10.1007/s00397-004-0394-3
Goudoulas, T. B., and Germann, N. (2019). Nonlinear rheological behavior of gelatin gels: In situ gels and individual layers. J. Colloid Interface Sci. 553, 746–757. doi:10.1016/j.jcis.2019.06.060
Grosso, M., and Luca, P. (2011). “Fourier transform rheology: A new tool to characterize material properties,” in Fourier transforms - new analytical approaches and FTIR strategies (London, UK: Intechopen). doi:10.5772/15725
Han, C. D. (2007). Rheology and processing of polymeric materials, volume 1: Polymer rheology. Oxford, UK: Oxford University Press. doi:10.1017/CBO9781107415324.004
Hoyle, D. M., Auhl, D., Harlen, O. G., Barroso, V. C., Wilhelm, M., and McLeish, T. C. B. (2014). Large amplitude oscillatory shear and Fourier transform rheology analysis of branched polymer melts. J. Rheology 58 (4), 969–997. doi:10.1122/1.4881467
Hyun, K., Ahn, K. H., Lee, S. J., Sugimoto, M., and Koyama, K. (2006). Degree of branching of polypropylene measured from Fourier-transform rheology. Rheol. Acta 46 (1), 123–129. doi:10.1007/s00397-006-0098-y
Hyun, K., Baik, E. S., Ahn, K. H., Lee, S. J., Sugimoto, M., and Koyama, K. (2007). Fourier-transform rheology under medium amplitude oscillatory shear for linear and branched polymer melts. J. Rheology 51 (6), 1319–1342. doi:10.1122/1.2790072
Hyun, K., and Wilhelm, M. (2009). Establishing a new mechanical nonlinear coefficient Q from FT-rheology: First investigation of entangled linear and comb polymer model systems. Macromolecules 42 (1), 411–422. doi:10.1021/ma8017266
Hyun, K., Wilhelm, M., Klein, C. O., Cho, K. S., Nam, J. G., Ahn, K. H., et al. (2011). A review of nonlinear oscillatory shear tests: Analysis and application of large amplitude oscillatory shear (Laos). Prog. Polym. Sci. 36 (12), 1697–1753. doi:10.1016/J.PROGPOLYMSCI.2011.02.002
Hyun, K., and Wilhelm, M. (2018). Nonlinear oscillatory shear mechanical responses. Berlin, Germany: Springer International Publishing. doi:10.1007/978-3-319-77574-6_11
Joyner, H. S. (2021). Nonlinear (Large-Amplitude oscillatory shear) rheological properties and their impact on food processing and quality. Annu. Rev. Food Sci. Technol. 12, 591–609. doi:10.1146/annurev-food-061220-100714
Joyner, H. S., and Meldrum, A. (2016). Rheological study of different mashed potato preparations using large amplitude oscillatory shear and confocal microscopy. J. Food Eng. 169, 326–337. doi:10.1016/j.jfoodeng.2015.08.032
Joyner (Melito), H. S. (2018). Explaining food texture through rheology. Curr. Opin. Food Sci. 21, 7–14. doi:10.1016/j.cofs.2018.04.003
Kádár, R., Abbasi, M., Figuli, R., Rigdahl, M., and Wilhelm, M. (2017). Linear and nonlinear rheology combined with dielectric spectroscopy of hybrid polymer nanocomposites for semiconductive applications. Nanomaterials 7 (2), 23–19. doi:10.3390/nano7020023
Kallus, S., Willenbacher, N., Kirsch, S., Distler, D., Neidhöfer, T., Wilhelm, M., et al. (2001). Characterization of polymer dispersions by Fourier transform rheology. Rheol. Acta 40 (6), 552–559. doi:10.1007/s003970100184
Kamkar, M., Sadeghi, S., Arjmand, M., and Aliabadian, E. (2020). Intra-cycle elastic nonlinearity of nitrogen-doped carbon nanotube/polymer nanocomposites under medium amplitude oscillatory shear (MAOS) flow. Nanomater. (Basel) 10 (7), 1257. doi:10.3390/nano10071257
KleinSpiess, H. W., Calin, A., Balan, C., and Wilhelm, M. (2007). Separation of the nonlinear oscillatory response into a superposition of linear, strain hardening, strain softening, and wall slip response. Macromolecules 40 (12), 4250–4259. doi:10.1021/ma062441u
KleinVenema, P., Sagis, L., and van der Linden, E. (2008). Rheological discrimination and characterization of carrageenans and starches by Fourier transform-rheology in the non-linear viscous regime. J. Newt. Fluid Mech. 151 (1–3), 145–150. doi:10.1016/j.jnnfm.2008.01.001
Knoll, S. K., and Prud’homme, R. K. (1987). Interpretation of dynamic oscillatory measurements for characterization of well completion fluids. Proceedings of the Paper presented at the SPE International Symposium on Oilfield Chemistry, 439–447. San Antonio, Texas, February 1987, doi:10.2118/16283-ms
Le, A. M., Erturk, M. Y., and Kokini, J. (2023). Effect of fat on non-linear rheological behavior of processed cheese spreads using coupled amplitude-frequency sweeps, Fourier Transform-Chebyshev polynomials method, sequence of physical processes, and quantitative network analysis. J. Food Eng. 336, 111193. doi:10.1016/j.jfoodeng.2022.111193
Lee, , and Rogers, S. A. (2017). A sequence of physical processes quantified in Laos by continuous local measures. Korea Aust. Rheology J. 29 (4), 269–279. doi:10.1007/s13367-017-0027-x
LeePorcar, L., and Rogers, S. A. (2019). Unveiling temporal nonlinear structure-rheology relationships under dynamic shearing. Polymers 11 (7), 1–16. doi:10.3390/polym11071189
Li, X., Wang, S.-Q., and Wang, X. (2009). Nonlinearity in large amplitude oscillatory shear (Laos) of different viscoelastic materials. J. Rheology 53 (5), 1255–1274. doi:10.1122/1.3193713
Liu, , Bao, H., Xi, C., and Miao, H. (2014). Rheological characterization of tuna myofibrillar protein in linear and nonlinear viscoelastic regions. J. Food Eng. 121 (1), 58–63. doi:10.1016/j.jfoodeng.2013.08.016
Liu, R., Zeng, Q., Liang, M., Wang, L., Cheng, S., and Ma, S. (2022). Molecular pathways associated with oxidative stress and their potential applications in radiotherapy (Review). Sci. Technol. Food Industry 43 (4), 65–72. doi:10.3892/ijmm.2022.5121
Ma, Y., Su, D., Wang, Y., Li, D., and Wang, L. (2020). Effects of concentration and NaCl on rheological behaviors of konjac glucomannan solution under large amplitude oscillatory shear (Laos). Lwt 128, 109466. doi:10.1016/j.lwt.2020.109466
Macias-Rodriguez, B. A., Ewoldt, R., and Marangoni, A. G. (2018). Nonlinear viscoelasticity of fat crystal networks. Rheol. Acta 57 (6), 251–266.
Macias-Rodriguez, B., and Marangoni, A. G. (2016). Rheological characterization of triglyceride shortenings. Rheol. Acta 55 (9), 767–779. doi:10.1007/s00397-016-0951-6
Martinetti, L., and Ewoldt, R. (2019). Time-strain separability in medium-amplitude oscillatory shear. Phys. Fluids 31 (2), 021213. doi:10.1063/1.5085025
Melito, H. S., Daubert, C. R., and Foegeding, E. A. (2013a). Relating large amplitude oscillatory shear and food behaviour: Correlation of nonlinear viscoelastic, rheological, sensory and oral processing behaviour of whey protein isolate and carragenan gels. Hoboken: Wiley online library, 521–534. doi:10.1111/jfpe.12015
Melito, H. S., Daubert, C. R., and Foegeding, E. A. (2013b). Relationships between nonlinear viscoelastic behavior and rheological, sensory and oral processing behavior of commercial cheese. J. Texture Stud. 44 (4), 253–288. doi:10.1111/jtxs.12021
Melito, H. S., Daubert, C. R., and Foegeding, E. a. (2012). Validation of a large amplitude oscillatory shear protocol. J. Food Eng. 113 (1), 124–135. doi:10.1016/j.jfoodeng.2012.05.008
Melito, H. S., and Daubert, C. R. (2011). Rheological innovations for characterizing food material properties. Annu. Rev. Food Sci. Technol. 2 (1), 153–179. doi:10.1146/annurev-food-022510-133626
Merger, D., and Wilhelm, M. (2014). Intrinsic nonlinearity from LAOStrain—experiments on various strain- and stress-controlled rheometers: A quantitative comparison. Rheol. Acta 53 (8), 621–634. doi:10.1007/s00397-014-0781-3
Neidhöfer, T., Wilhelm, M., and Debbaut, B. (2003). Fourier-transform rheology experiments and finite-element simulations on linear polystyrene solutions. J. Rheology 47 (6), 1351–1371. doi:10.1122/1.1608954
Ng, T. S. K., McKinley, G. H., and Ewoldt, R. H. (2011). Large amplitude oscillatory shear flow of gluten dough: A model power-law gel. J. Rheology 55 (3), 627–654. doi:10.1122/1.3570340
NgMcKinley, G. H., and Padmanabhan, M. (2006). Linear to non-linear rheology of wheat flour dough. Appl. Rheol. 16 (5), 265–274. doi:10.1515/arh-2006-0019
Nikolić, N., Krasić, M. S., Šimurina, O., Cakić, S., Mitrović, J., Pešić, M., et al. (2023). Regression analysis in examination the rheology properties of dough from wheat and Boletus edulis flour. J. Food Compos. Analysis 115, 105022. doi:10.1016/j.jfca.2022.105022
Osswald, T., and Rudolph, N. (2014). Introduction to Rheology. In N. Rudolph and T. A. Osswald,. Polymer rheology: fundamentals and applications Carl Hanser Verlag GmbH Co KG, 1–24. doi:10.3139/9781569905234.001
Park, C. H., Ahn, K. H., and Lee, S. J. (2018). Path-dependent work and energy in large amplitude oscillatory shear flow. J. Newt. Fluid Mech. 251, 1–9. doi:10.1016/j.jnnfm.2017.10.005
Park, J. D., and Rogers, S. A. (2020). Rheological manifestation of microstructural change of colloidal gel under oscillatory shear flow. Phys. Fluids 32 (6), 063102. doi:10.1063/5.0006792
Park, , Rogers, S. A., Lee, S., and Lim, J. (2018). X-ray beam-position feedback system with easy-to-use beam-position monitor. J. Rheology 62 (4), 869–873. doi:10.1107/S1600577518002692
ParkAhn, K. H., and Lee, S. J. (2015). Structural change and dynamics of colloidal gels under oscillatory shear flow. Soft Matter 11 (48), 9262–9272. doi:10.1039/c5sm01651g
Precha-Atsawanan, S., Uttapap, D., and Sagis, L. M. C. (2018). Linear and nonlinear rheological behavior of native and debranched waxy rice starch gels. Food Hydrocoll. 85, 1–9. doi:10.1016/j.foodhyd.2018.06.050
Ptaszek, P. (2015). A geometrical interpretation of large amplitude oscillatory shear (Laos) in application to fresh food foams. J. Food Eng. 146, 53–61. doi:10.1016/j.jfoodeng.2014.08.022
Ptaszek, P. (2017). Large amplitude oscillatory shear (Laos) measurement and fourier-transform rheology: Application to food. Adv. Food Rheology Its Appl. Woodhead Publishing, 87–123. doi:10.1016/B978-0-08-100431-9.00005-X
Ptaszek, P. (2014). Large amplitudes oscillatory shear (Laos) behavior of egg white foams with apple pectins and xanthan gum. Food Res. Int. 62, 299–307. doi:10.1016/j.foodres.2014.03.002
Reinheimer, K., Grosso, M., Hetzel, F., Kübel, J., and Wilhelm, M. (2012). Fourier Transform Rheology as an innovative morphological characterization technique for the emulsion volume average radius and its distribution. J. Colloid Interface Sci. 380 (1), 201–212. doi:10.1016/j.jcis.2012.03.079
Reinheimer, K., Grosso, M., and Wilhelm, M. (2011). Fourier Transform Rheology as a universal non-linear mechanical characterization of droplet size and interfacial tension of dilute monodisperse emulsions. J. Colloid Interface Sci. 360 (2), 818–825. doi:10.1016/j.jcis.2011.05.002
Rocha, C. M. R., Souza, H. K. S., Magalhães, N. F., Andrade, C. T., and Gonçalves, M. P. (2014). Rheological and structural characterization of agar/whey proteins insoluble complexes. Carbohydr. Polym. 110, 345–353. doi:10.1016/j.carbpol.2014.04.015
Rodriguez, B. A. M. (2019). Nonlinear rheology of fats using large amplitude oscillatory shear tests. Structure-Function Analysis Edible Fats, 169–195. doi:10.1016/B978-0-12-814041-3.00006-X
Rogers, S. A. (2012). A sequence of physical processes determined and quantified in Laos: An instantaneous local 2D/3D approach. J. Rheology 56 (5), 1129–1151. doi:10.1122/1.4726083
Rogers, S. A. (2017). In search of physical meaning: Defining transient parameters for nonlinear viscoelasticity. Rheol. Acta 56 (5), 501–525. doi:10.1007/s00397-017-1008-1
Rogers, S. A., and Lettinga, M. P. (2012). A sequence of physical processes determined and quantified in large-amplitude oscillatory shear (Laos): Application to theoretical nonlinear models. J. Rheology 56 (1), 1–25. doi:10.1122/1.3662962
Rogers, S., Erwin, B. M., Vlassopoulos, D., and Cloitre, M. (2011). A sequence of physical processes determined and quantified in Laos: Application to a yield stress fluid. J. Rheology 55 (2), 435–458. doi:10.1122/1.3544591
Rogers, S., Kohlbrecher, J., and Lettinga, M. P. (2012). The molecular origin of stress generation in worm-like micelles, using a rheo-SANS Laos approach. Soft Matter 8 (30), 7831–7839. doi:10.1039/c2sm25569c
Rogers, S. (2018). Large amplitude oscillatory shear: Simple to describe, hard to interpret. Phys. Today 71 (7), 34–40. doi:10.1063/PT.3.3971
Shu, R., Sun, W., Wang, T., Wang, C., Liu, X., and Tong, Z. (2013). Linear and nonlinear viscoelasticity of water-in-oil emulsions: Effect of droplet elasticity. Colloids Surfaces A Physicochem. Eng. Aspects 434, 220–228. doi:10.1016/j.colsurfa.2013.05.057
Singh, P. K., Soulages, J. M., and Ewoldt, R. (2018). Frequency-sweep medium-amplitude oscillatory shear (MAOS). J. Rheology 62 (1), 277–293. doi:10.1122/1.4999795
Sollich, P. (2006). Soft glassy rheology. Mol. Gels Mater. Self-Assembled Fibrillar Netw.Springer, 161–192. doi:10.1007/1-4020-3689-2_6
Song, H. Y., and Hyun, K. (2019). First-harmonic intrinsic nonlinearity of model polymer solutions in medium amplitude oscillatory shear (MAOS). Korea Aust. Rheology J. 31 (1), 1–13. doi:10.1007/s13367-019-0001-x
Sousa, A. M. M., and Gonçalves, M. P. (2015). The influence of locust bean gum on native and alkali-modified agargels. Food Hydrocoll. 44, 461–470. doi:10.1016/j.foodhyd.2014.10.020
Sparkman, K., Joyner, H. S., and Smith, B. (2019). Understanding how high-protein bar formulations impact their mechanical and wear behaviors using response surface analysis. J. Food Sci. 84 (8), 2209–2221. doi:10.1111/1750-3841.14707
Turksoy, S., Erturk, M. Y., and Kokini, J. (2021). Behavior of semolina, hard, soft wheat flour dough at different aging times and temperatures through Laos properties and molecular interactions of proteins. J. Food Eng. 301, 110549. doi:10.1016/j.jfoodeng.2021.110549
Turksoy, S., Erturk, M. Y., Bonilla, J., Turasan, H., and Kokini, J. L. (2020). Effect of aging at different temperatures on Laos properties and secondary protein structure of hard wheat flour dough. J. Cereal Sci. 92, 102926. doi:10.1016/j.jcs.2020.102926
Uthayakumaran, S., Newberry, M., Keentok, M., Stoddard, F. L., and Bekes, F. (2000). Basic rheology of bread dough with modified protein content and glutenin-to-gliadin ratios. Cereal Chem. 77 (6), 744–749. doi:10.1094/CCHEM.2000.77.6.744
Uthayakumaran, S., Newberry, M., Phan-Thien, N., and Tanner, R. (2002). Small and large strain rheology of wheat gluten. Rheol. Acta 41 (1), 162–172. doi:10.1007/s003970200015
van der Vaart, K., Rahmani, Y., Zargar, R., Hu, Z., Bonn, D., and Schall, P. (2013). Rheology of concentrated soft and hard-sphere suspensions. J. Rheology 57 (4), 1195–1209. doi:10.1122/1.4808054
Vittorias, I., and Wilhelm, M. (2007). Application of FT rheology to industrial linear and branched polyethylene blends. Hoboken: Wiley online library, 935–948. doi:10.1002/mame.200700120
Wagner, M. H., Rolón-Garrido, V. H., Hyun, K., and Wilhelm, M. (2011). Analysis of medium amplitude oscillatory shear data of entangled linear and model comb polymers. J. Rheology 55 (3), 495–516. doi:10.1122/1.3553031
Wang, B., Wang, L. J., Li, D., Wei, Q., and Adhikari, B. (2012). When Brownian diffusion is not Gaussian. Carbohydr. Polym. 88 (2), 481–485. doi:10.1038/nmat3308
WangRavindaranath, S., and Boukany, P. E. (2011). Homogeneous shear, wall slip, and shear banding of entangled polymeric liquids in simple-shear rheometry: A roadmap of nonlinear rheology. Macromolecules 44 (2), 183–190. doi:10.1021/ma101223q
Whitcomb, K. (2019). Determining the linear viscoelastic region in oscillatory measurements. Available at: https://www.tainstruments.com/pdf/literature/RH107.pdf.
Wilhelm, M. (2002). Fourier-transform rheology. Macromol. Mater. Eng. 287 (2), 83–105. doi:10.1002/1439-2054(20020201)287:2<83:aid-mame83>3.0.co;2-b
Yazar, G., Duvarci, O., Tavman, S., and Kokini, J. L. (2016b). Effect of mixing on Laos properties of hard wheat flour dough. J. Food Eng. 190, 195–204. doi:10.1016/J.JFOODENG.2016.06.011
Yazar, G., Duvarci, O., Tavman, S., and Kokini, J. L. (2017). Laos behavior of the two main gluten fractions: Gliadin and glutenin. J. Cereal Sci. 77, 201–210. doi:10.1016/j.jcs.2017.08.014
Yazar, G., Duvarci, O., Tavman, S., and Kokini, J. L. (2016a). Non-linear rheological properties of soft wheat flour dough at different stages of farinograph mixing. Appl. Rheol. 26 (5). doi:10.3933/ApplRheol-26-52508
Yildirim-Mavis, C., Yilmaz, M. T., Dertli, E., Arici, M., and Ozmen, D. (2019). Non-linear rheological (Laos) behavior of sourdough-based dough. Food Hydrocoll. 96, 481–492. doi:10.1016/j.foodhyd.2019.05.055
Zheng, H., Morgenstern, M. P., Campanella, O. H., and Larsen, N. G. (2000). Rheological properties of dough during mechanical dough development. J. Cereal Sci. 32 (3), 293–306. doi:10.1006/jcrs.2000.0339
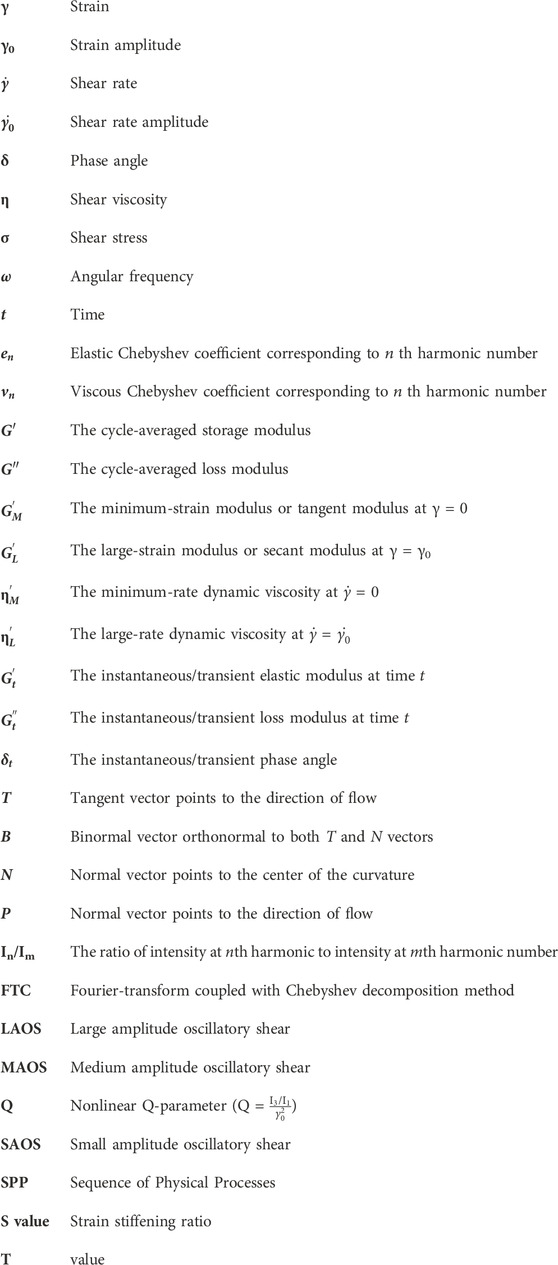
Nomenclature
Keywords: nonlinear Rheology, large amplitude oscillatory shear Rheology, food Rheology, sequence of physical processes, medium amplitude oscillatory shear Rheology
Citation: Erturk MY, Le ANM and Kokini J (2023) Advances in large amplitude oscillatory shear Rheology of food materials. Front. Food. Sci. Technol. 3:1130165. doi: 10.3389/frfst.2023.1130165
Received: 22 December 2022; Accepted: 11 May 2023;
Published: 06 July 2023.
Edited by:
Isabel Sousa, University of Lisbon, PortugalReviewed by:
Kaoru Kohyama, NARO (NFRI), JapanThiago Oliveira Marinho, Federal University of Rio de Janeiro, Brazil
Copyright © 2023 Erturk, Le and Kokini. This is an open-access article distributed under the terms of the Creative Commons Attribution License (CC BY). The use, distribution or reproduction in other forums is permitted, provided the original author(s) and the copyright owner(s) are credited and that the original publication in this journal is cited, in accordance with accepted academic practice. No use, distribution or reproduction is permitted which does not comply with these terms.
*Correspondence: Merve Yildirim Erturk, bXlpbGRpcmlAcHVyZHVlLmVkdQ==