 Sibel Uzuner
 Gulsun Akdemir Evrendilek2
 Sebnem Kurhan
95% of researchers rate our articles as excellent or good
Learn more about the work of our research integrity team to safeguard the quality of each article we publish.
Find out more
ORIGINAL RESEARCH article
Front. Food. Sci. Technol. , 16 September 2022
Sec. Food Biotechnology
Volume 2 - 2022 | https://doi.org/10.3389/frfst.2022.951609
Due to the growing demand for commercial enzymes derived from renewable and sustainable resources with higher efficacy, algal biomass has gained more attention. Thus, the production of exo-polygalacturonase (PGase) from Bacillus subtilis under submerged fermentation (SmF) using algal feedstocks as a carbon source in fermentation medium and its potential use for the clarification of apple and carrot juices with the optimization of the enzyme loading, pH, and time using Box–Behnken response surface methodology (RSM) were prompted. The maximum PGase activity of 510.61 ± 7.86 U/L was achieved at pH 5.0 after 48 h at 40°C using 0.5% (w/v) pectin, 0.1% (w/v) yeast extract, 0.02% (w/v) MgSO47H2O, 0.02% (w/v) K2HPO4, 0.3% (w/v) glucose, and 0.583% (w/v) microalgae hydrolysate as a fermentation medium. PGase production without glucose was favored by SmF with a shake flask working volume of 100 ml (248.90 ± 4.58 U/L) as compared to a bioreactor with a working volume of 1 L (192.99 ± 0.84) for 48 h. Both carrot and apple juices were treated with the crude PGase (248.9 U/L) at different concentrations (0.1–0.5%), temperature (30–50°C), and time (30–120 min), and the maximal clarification conditions were obtained as 0.3% (w/v) enzyme concentration at 50°C for 30 min exposure time. This study revealed that microalgae-derived PGase in crude form could be effectively used for clarification of the juices.
With the increasing demand for healthy living, the consumption of natural fruit juices has gained more attention in recent years. However, raw juices being turbid and viscous tend to settle during storage (Nagar et al., 2012). In order to overcome these problems, commercial pectic enzymes are used in fruit juice processing to degrade pectin. Pectinases are of great importance to the food industry as they are extensively used to extract and clarify various fruit juices and wine. Pectic enzymes such as pectinases provide a rapid flow of juice, give higher juice yields with better clarity, and facilitate filtration (Alkorta et al., 1998); but the cost of the enzymatic depectinization is very high due to the higher cost of enzymes and the fermentation medium. Thus, researchers focus on alternative cheap carbon sources such as wheat bran, soybean meal, and sugar cane molasses as fermentation medium (El Enshasy et al., 2018); however, there is no study available yet about the production of microalgae-derived exo-polygalacturonase (exo-PGase) in the literature.
Although pectinases (polygalacturonase) can be obtained from different sources such as Bacillus subtilis; fungal-originated pectinases are the most commonly used enzymes to clarify fruit juices. Thus, the objective of the study is to investigate the enzymatic depectinization of fruit juices using crude pectinase produced from B. subtilis grown in a fermentation medium containing crude microalgae hydrolysate as a carbon source. The information obtained is critical to determine the potential of the produced crude enzyme compared with the commercial enzymes for the evaluation of the optimum conditions (enzyme loading, temperature, and time) revealing the highest color L* value and total phenolic content (TPC), but the lowest turbidity.
B. subtilis NRRL B-4219 was kindly provided by the ARS culture collection, Northern Regional Research Laboratory (NRRL), Peoria, Illinois, United States. The microalgae Chlorella vulgaris (SAG strain Number: 211-11b) was purchased from the Experimental Phycology and Culture Collection of Algae from the University of Goettingen in Germany (EPSAG). Pectinex 3XL was purchased from Sigma-Aldrich (Darmstadt, Germany). Chemicals were purchased from Sigma-Merck. The carrots and “Golden Delicious” apples used in this study were supplied from a local market in Bolu, Turkey.
Leaching of fermentable sugars (FSs) was carried out using a high hydrostatic pressure (HPP) system with the operating pressure capacity of 690 MPa (2L model, Avure Systems, Columbus, OH). The time required to reach the maximum pressure was less than 30 s. The grounded microalgae biomass was pretreated with H2SO4 solution at concentrations of 1, 2, and 3% (w/v); pressures of 200, 350, and 500 MPa; and pretreatment times of 5, 12.5, and 20 min at a biomass solid-to-liquid ratio of 0.3:87 (w/v, dry weight basis) according to the experimental conditions. The samples were placed in a high-density polyethylene bag (HDPE) and then vacuum packaged. After vacuum packaging, each sample was placed into the HPP chamber to be processed. Processed samples after HPP were hydrolyzed with enzymes, as mentioned in step 2 (enzymatic saccharification part). After HPP and enzymatic saccharification processed samples were analyzed for FSs using the DNS method. The initial temperature of the samples, 22°C, increased to 30°C depending on the process conditions.
Recovered dried algal residues were separately hydrolyzed using cellulase and Viscozyme L enzyme cocktail (Sigma-Aldrich, Denmark) containing cellulase and xylanase enzymes after HPP pretreatment. Enzyme activities of cellulase and xylanase were measured as 2,250 and 1,400 U/mL, respectively, at 50°C, 130 rpm, and pH of 5.0 for 48 h in 100 ml working volume with enzyme loadings of 200 U/g dry substrate and solid loadings of 1/20 (w/v) (g microalgae biomass/mL liquid). After enzymatic saccharification, the samples were heated to 100°C for 15 min to deactivate the enzymes. The samples with the equivalent enzyme loading as a control group were also hydrolyzed. After enzymatic saccharification, the samples were centrifuged at 10.000 x g for 10 min, and the supernatant was used to estimate FSs by measuring reducing sugar content.
B. subtilis stock culture was activated in the medium containing 1.0 g/L yeast extract, 10.0 g/L glucose, 0.4 g/L K2HPO4, 0.2 g/L KH2PO4, 0.4 g/L MgSO4.7H2O, and 2.0 g/L citrus pectin at 30°C temperature and pH of 6.5 for 24 h (Uzuner and Cekmecelioglu, 2015).
After autoclaving at 121°C for 15 min, 1 ml of the inoculum containing 106 CFU/ml was transferred from microorganism medium into 100 ml fermentation medium containing 5 g/L of pectin, 1 g/L of yeast extract, 0.2 g/L of MgSO47H2O, and 0.2 g/L of K2HPO4 in 250 ml Erlenmeyer flasks (Uzuner and Cekmecelioglu, 2015). Flasks were placed in the orbital shaker at 130 rpm at 40°C with the initial pH of 5.0 for 72 h. The pH of all media was adjusted to 5.0 using 10 M NaOH.
The PGase enzyme production from microalgae hydrolysate using B. subtilis in shake flasks with a working volume of 100 ml according to three different conditioning methods was conducted as follows:
Method 1 (M1): Fermentation medium consists of 5 g/L pectin, 1 g/L yeast extract, 0.2 g/L MgSO47H2O, 0.2 g/L K2HPO4, and microalgae hydrolysate (100 ml) in 250-ml Erlenmeyer flasks.
Method 2 (M2): Fermentation medium consists of 5 g/L pectin, 1 g/L yeast extract, 0.2 g/L MgSO47H2O, 0.2 g/L K2HPO4, microalgae hydrolysate (100 ml), and 3 g/L glucose in 250-ml Erlenmeyer flasks.
Method 3 (M3): Fermentation medium consists of 5 g/L pectin, 1 g/L yeast extract, 0.2 g/L MgSO47H2O, 0.2 g/L K2HPO4, microalgae hydrolysate (100 ml), and 2 g/L glucose in 250-ml Erlenmeyer flasks.
A stainless steel, double-jacketed, 5-L stirred bioreactor (Biostat A, Sartorius, Gottingen, Germany) was used, with a working volume of 1 L. Sterilization was carried out at 121°C for 15 min. The agitation was adjusted to 250–300 rpm throughout the cultivation, and aeration was performed using compressor air rates of 800 and 4,500 vvm. The pH of the culture was adjusted to 5.0 by connecting the pH controller to an acid/base feeding peristaltic pump containing 5% H2SO4 and 1 M NaOH solutions. The inoculum ratio was 1 and 5% for shake flask and bioreactor cultivation, respectively.
The PGase produced from microalgae hydrolysate using B. subtilis in a bioreactor with a working volume of 1 L according to two different conditioning methods were as follows:
Method 1 (B1): Fermentation medium consists of 5 g/L pectin, 1 g/L yeast extract, 0.2 g/L MgSO47H2O, 0.2 g/L K2HPO4, and microalgae hydrolysate (1 L) in a 5-L bioreactor with 250 rpm at a rate of 4,500 vvm for 72 h.
Method 2 (B2): Fermentation medium consists of 5 g/L pectin, 1 g/L yeast extract, 0.2 g/L MgSO47H2O, 0.2 g/L K2HPO4, microalgae hydrolysate (1 L) in a 5-L bioreactor with 300 rpm at a rate of 800 vvm for 72 h.
Carrots and apples were washed with water to remove surface dirt and microbial flora. Then both were pressed and squeezed separately with a juicer (Arçelik, Turkey). The cloudy raw fruit juices were filtered through two layers of cheesecloth to separate the pulp. The pH and Brix of the carrot and apple juices were 4.07 ± 0.01 and 12 ± 0.00, and 4.07 ± 0.01 and 12 ± 0.00, respectively. Both juices were treated with PGase produced in a laboratory and commercial Pectinex 3XL (Sigma-Aldrich, Darmstadt, Germany) for comparison with different treatment conditions as mentioned in the experimental design (Table 1). Juice samples (100 ml) were placed into a flask, and after the addition of crude exo-PGase (248.9 U/L) and Pectinex 3XL separately, the samples were put into a shaking water bath at 120 rpm to control the incubation temperature (50°C). Enzymatic treatment was repeated in triplicate under the optimal conditions obtained from BBD analysis using equal activity values of commercial Pectinex 3XL. At the end of the depectinization, both enzymes were deactivated by heating the suspension at 100°C for 5 min.
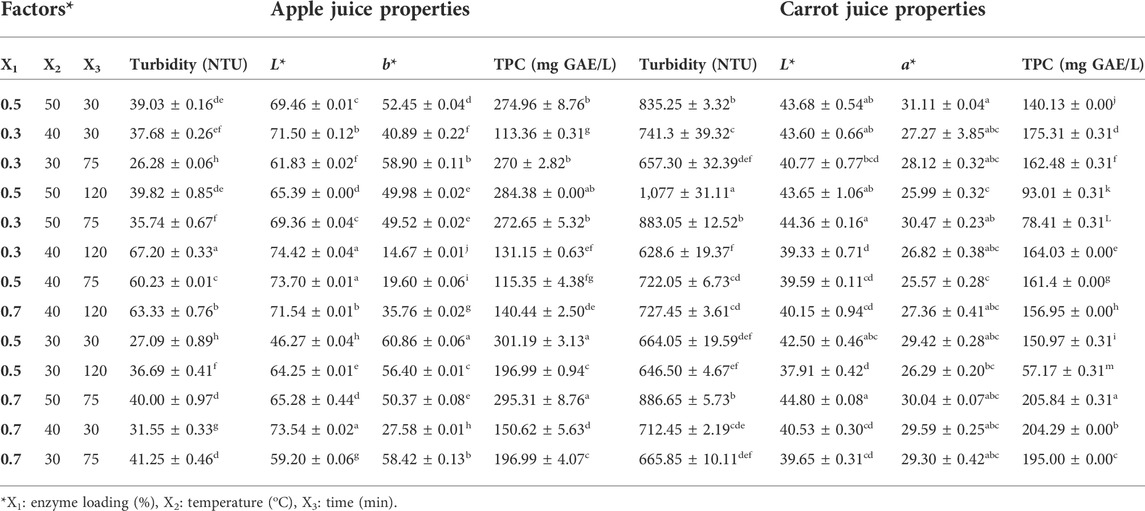
TABLE 1. (Un)coded variables of Box–Behnken design employed for depectinization of apple and carrot juice.
The fermentable sugar content of the dried microalgal pellet was estimated using the DNS method (Miller, 1959). A calibration curve for this method was prepared using analytical grade D-glucose solutions at 0.10–0.40 g/L concentrations.
The enzymatic extract (0.5 ml) was mixed with 0.5 ml of 1% polygalacturonic acid solution prepared in acetate buffer (pH 7.0) and incubated at 50°C for 30 min (Kapoor et al., 2000). After incubation, 3 ml DNS solution was added to stop the enzymatic reaction, and the mixture was heated for 15 min at 90°C. After heating, Rochelle salt was added to the solution. Then, the samples were cooled down to ambient temperature, and the absorbance of the samples was measured at 575 nm. D-galacturonic acid solutions in the range of 0.1–0.5 mg/ml were used as a standard. One unit of PGase activity (U) is expressed as 1 μmol of galacturonic acid released per minute under assay conditions. PGase activity was calculated using the following Eq 1:
where F is a factor to convert absorbance to g of galacturonic acid, T is the incubation time which is the time of incubation of the enzyme with a substrate (30 min), 1/212.12 is the conversion factor from grams of galacturonic acid to moles of galacturonic acid, DF is the dilution factor, and Rv is the amount of enzyme in the reaction mixture (ml).
The total protein content of the samples was determined by a spectrophotometer (Lowry et al., 1951) using bovine serum albumin (BSA) as a protein standard. 0.5 ml samples were added to 0.7 ml Lowry solution, and the mixture was incubated for 20 min at room temperature in the dark before the addition of 0.1 ml Folin’s reagent. After that, the mixture was left for 30 min at room temperature in the dark, and the absorbance of each sample was measured at 750 nm against blank.
pH measurement of the raw and clarified juice samples was made at room temperature by the pH-2005 model (JP Selecta SA, Barcelona, Spain) pH meter.
Total soluble solid (TSS as Brix) was analyzed by a handheld refractometer (Nippon Optical Works 507-1, Tokyo, Japan) at 20°C.
A handheld turbidimeter (Model-FT, Myers, FL, United States ) was used to measure the turbidity of the raw and clarified juice samples. The results were measured as a nephelometric turbidity unit (NTU).
The color parameters (CIE LAB space-Commission Internationale de I’Eclairage- L*, a*, b* color space) of the raw and clarified juice samples were measured using a Hunter Laboratory Color Flex Spectrophotometer (Hunter Associates Laboratory Inc., Reston VA, United States ), where L* value indicates lightness and a* and b* values are the chromaticity coordinates (a* from green to red and b* from blue to yellow).
The Folin–Ciocalteu assay was used for the determination of the total phenolic content in fruit juice samples at 760 nm (Spanos et al., 1990). Five mL of 10-fold diluted Folin–Ciocalteu reagent and 4 ml Na2CO3 solution (75 g/L) were added to 1 ml of the 1:5 diluted sample and incubated at 50°C in a water bath for 5 min. TPC was expressed as gallic acid equivalents (GAE) in mg/L.
The Box–Behnken design (BBD) with a quadratic model using MINITAB 16.0 (Minitab Inc. State College, PA, United States ) was constructed for the three significant factors such as X1—enzyme loading (%), X2—temperature (oC), and X3—time (minute). The experimental design in the coded (x) and actual (X) levels of variables is shown in Table 1. The ranges for each factor studied were 0.3–0.7% for enzyme loading, 30–50°C for temperature, and 30–120 min for time (Table 1). The experimental data were fit to a quadratic mathematical equation expressed as follows:
where Y is the turbidity, L*, a*, b* value, and TPC; bs are regression coefficients; and X1, X2, and X3 are enzyme loading, temperature, and time, respectively. Optimal conditions for clarity were defined from Box–Behnken design regression analysis. To validate the model, additional trials at the defined enzymatic treatment of fruit juice conditions were carried out in triplicate. Analysis of variance (ANOVA) and regression were performed at a 95% confidence interval to define the coefficients of the predictive model and significant terms. The pairwise comparisons were made by Tukey’s test with a significance level of 0.05. Optimization, including numerical and graphical optimization and point prediction, was carried out to establish the optimum level of three independent variables, enzyme loading (X1), temperature (X2), and time (X3) to achieve desirable responses such as maximum L*, a*, and b* values. The optimum value of multiple responses was determined by using the MINITAB optimizer tool.
The FSs content of untreated C. vulgaris was 120 mg/g dry biomass. To enhance the leaching of FSs from C. vulgaris, HPP, as an alternative pretreatment method, was performed. The combined HPP and enzymatic treatment gave significantly higher FSs content than that of the HPP treatment alone (p < 0.05) (data not shown). The FSs content of microalgae ranged from 339.38 to 419.44 mg/g under the different HPP conditions. FSs concentration increased by 71.4% compared to that of the untreated samples. The highest FSs content of C. vulgaris after 48 h enzymatic saccharification (419.44 ± 11.57 mg/g) was obtained at 1% (w/w) acid concentration and 500 MPa for 12.5 min. In contrast, the lowest FSs content after 48 h enzymatic saccharification (339.38 ± 22.79 mg/g) was obtained at 2% (w/w) acid concentration and 500 MPa for 5 min.
Fermentation media with varying synthetic sugar compositions and microalgae hydrolysate were used as a carbon source to produce exo-PGase for 72 h. Based on the results, exo-PGase activity was higher with M2 than that of both with M1 and M3. The fermentation medium containing glucose (2 g/L) and microalgae hydrolysate, known as M3, revealed the least exo-PGase activity (176.79 U/L) (Figure 1). The maximum exo-PGase activities were obtained after 48 h fermentation for shake flask and bioreactor medium. The microalgae hydrolysate with sugar (3 g/L) gave better results with the maximum exo-PGase activity of 510.6 U/L at 48 h. The exo-PGase activities obtained using B. subtilis were 248.9 U/L and 176.8 U/L in M1 and M3, respectively (Figure 1). Thus, exo-PGase production using microalgae hydrolysate as a carbon source was favored by submerged fermentation (SmF) with shake flask cultivation.
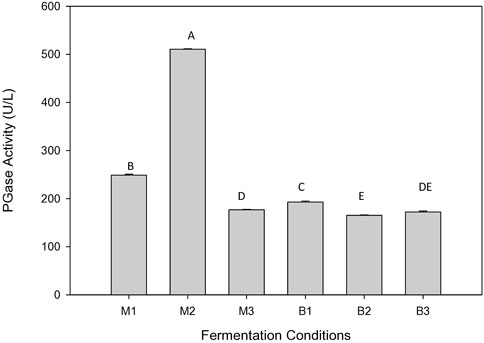
FIGURE 1. PGase activity (U/L) under the different fermentation conditions for 48 h.
The exo-PGase activities obtained using B. subtilis were 192.9 U/L and 165.4 U/L at bioreactor conditions for B1 and B2, respectively (Figure 1). PGase production without glucose was favored by SmF with a shake flask working volume of 100 ml (248.90 ± 4.58 U/L) as compared to a bioreactor with a working volume of 1 L (192.99 ± 0.84 U/L) for 48 h. Crude extract of PGase for M1, M2, M3, B1, B2, and B3 exhibited 0.3, 0.65, 0.23, 0.25, 0.21, and 0.22 mg/ml protein content, respectively.
L* and b* values, turbidity (NTU), TPC (mg GAE/L), pH, and TSS (°Brix) of the untreated apple juice were measured as 71.73 ± 0.02, 28.32 ± 0.04, 73.78 ± 0.33, 184.16 ± 4.69, 3.75 ± 0.07, and 12.65 ± 0.92, respectively. The experimental values for turbidity; L*, a*, and b* values; and TPC under different conditions are represented in Table 1. Clarity, as an essential parameter for clarified juice, increased after the enzymatic treatment indicating that the turbidity of apple juice decreased when compared with the control value (73.78 NTU). During the enzymatic treatment, the amount of pectin in the juices decreased; therefore, the turbidity of the juices was reduced (Alvarez et al., 1998). The turbidity of apple juice in this study ranged between 26.28–73.78 NTU treated with crude pectinase, irrespective of the enzyme loading, temperature, and time. The minimum turbidity (26.28 NTU) value was observed at 30°C and 75 min with 0.3% of enzyme loading (Table 1). The turbidity significantly increased with an increase in the temperature and time (Table 1) (p < 0.05). L* value varied from 46.27 to 74.42 treated with crude pectinase, irrespective of the enzyme loading, temperature, and time. The maximum L* value of apple juice (74.42) was obtained at 40°C and 120 min with the enzyme loading (0.3%) (Table 1). An increase in the b* value indicates an increase in yellowish color in fruit juice. Thus, after enzymatic treatment, the b* value of apple juice increased when compared with the control value (28.32 ± 0.04). The b* value significantly decreased with an increase in treatment time (p < 0.05), whereas it increased with an increase in enzyme loading (Table 1). The maximum b* value of apple juice was recorded as 60.86 at 30°C and 30 min with 0.5% of enzyme loading (Table 1).
TPC of the samples significantly decreased with an increase in the enzyme loading (p < 0.05). Moreover, the maximum TPC value of apple juice (301.19 mg GAE/L) was obtained at 30°C and 30 min with 0.5% enzyme loading (Table 1).
Effects of varying enzyme loading, temperature, and time were investigated in terms of turbidity, L* and b* values, and TPC. In order to select the suitability of the model, R2 must be closer to 1, VIF must be 1, and the lack of fit value must be p > 0.05, respectively. A quadratic model was chosen based on R2, VIF, and lack of fit values for the responses of L*, a*, and b* values.
The regression coefficients for the second-order polynomial equations and results for the linear, quadratic, and interaction terms are presented in Table 2. The statistical analysis indicates that the proposed model was adequate, possessing no significant lack of fit (p > 0.05) and with very satisfactory values of the R2, which is close to 1.0 for the response variables. The insignificant lack of fit values for only two models (L* and b* values for enzymatic treatment of apple juice) also indicated that the model fit the experimental data well (Tables 2, 3). Among the variables studied, temperature and time showed significant effects (p < 0.05) on L* and b* values. It showed a significant main effect of temperature and time with a positive effect on the L* value, whereas the main effect of temperature and time had a negative effect on the b* value (Table 2) (p < 0.05). The most important factor determining the L* and b* values was the temperature with the highest coefficient (4.74 and 1.85, respectively), indicating that it is the most dominant factor influencing the enzymatic treatment of apple juice using microalgae-derived pectinase, followed by time (Table 2).
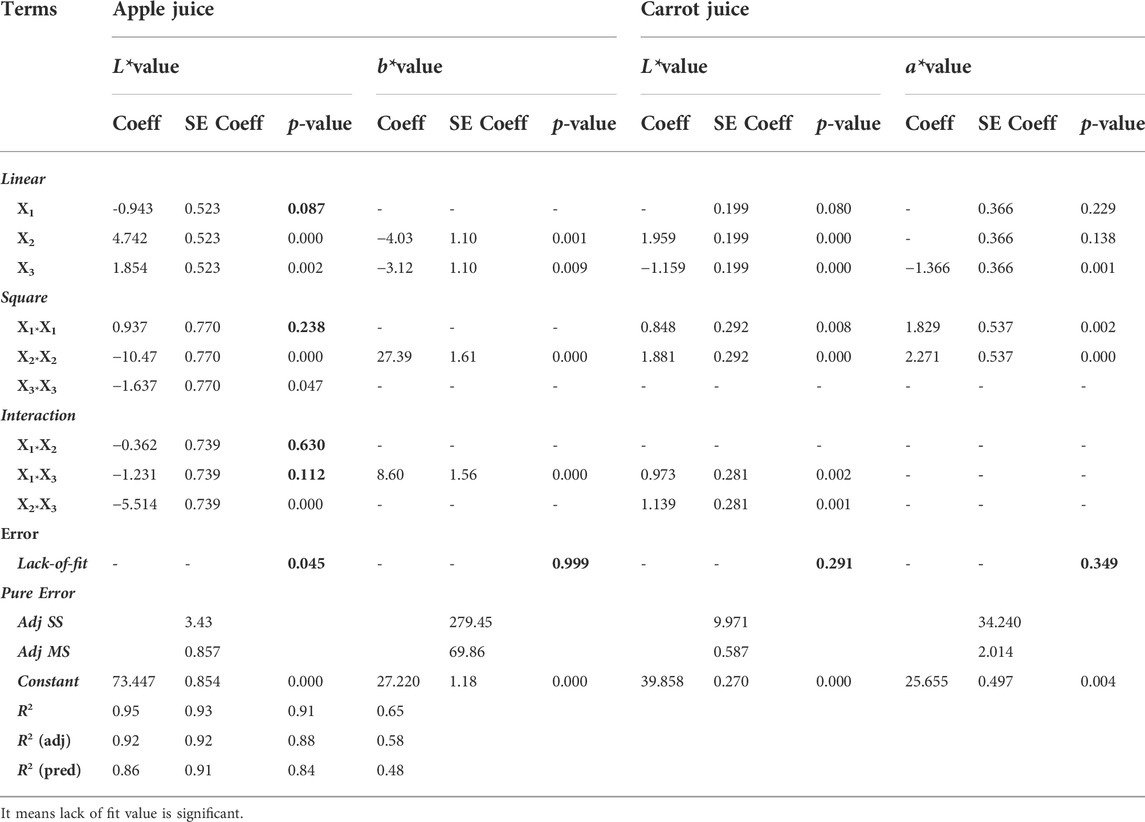
TABLE 2. Revised-ANOVA results and estimated regression coefficients for the coded depectinization of apple and carrot juice models.
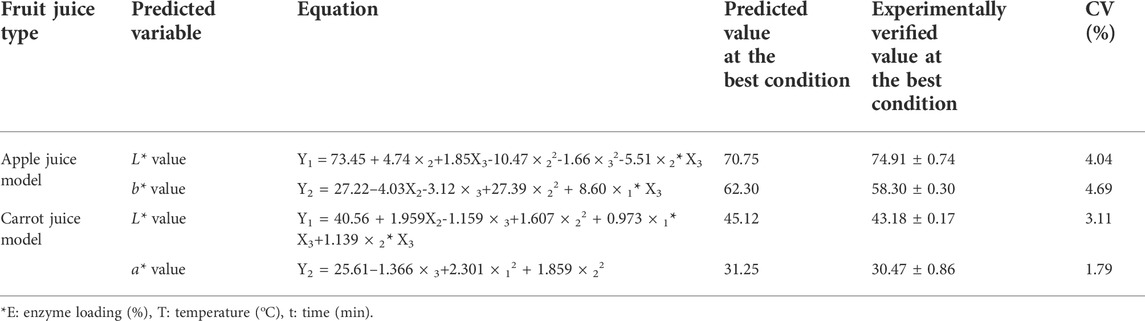
TABLE 3. Best operating Box–Behnken design conditions and models with respect to color values (L*, a*, and b*) at optimum conditions (0.30% enzyme loading, 50°C for 30 min).
The contour plots were used to visualize how the operational settings simultaneously influenced the multiple responses of the fruit juice clarification conditions (Figures 2–5). The two-dimensional (2D) response contour was plotted to study the interaction of the three factors (temperature, enzyme loading, and time) on the L* and b* values for apple juices (Figures 2, 3). Figure 2A showed the projection of a 3-D graph on a 2-D plot of the positive interaction between temperature (X2) and time (X3) on the L* value of apple juice. The perfect interaction between the independent factors can be shown when elliptical contours are obtained (Zahangir et al., 2009). Thus, the contour plot is elliptical and the interaction effect is statistically significant (Figure 2A). It was observed from Figure 2A that the lowest temperature (30°C) minimized the L* value (<50) at the lowest time (30 min). Maximum L* value (>70) was obtained when both factors (temperature and time) were at 40–45°C for 30–120 min, respectively (Figure 2A). L* value increased with an increased temperature under the center point of enzyme loading (0.5%) at an increasing rate (Figure 2A). L* value increased with an increased enzyme loading at the lowest time (30 min) (Figure 2B) as well as under the center point of temperature (40°C) at an increasing rate (Figure 2B) in addition to increased enzyme loading under the center point of time (75 min) at the lowest temperature (Figure 2C).
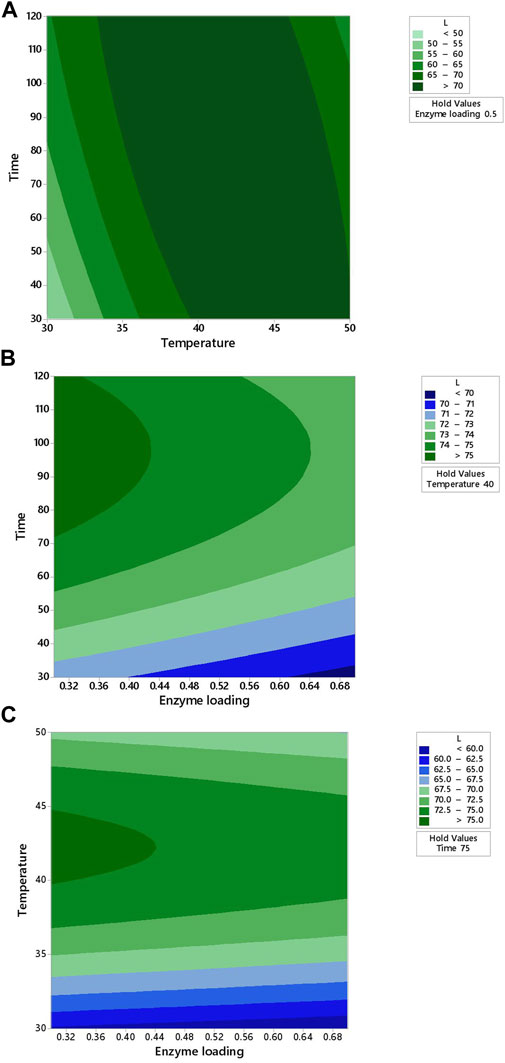
FIGURE 2. Response contour plots showing two-way interaction effects of (A) temperature and time, (B) enzyme loading and time, and (C) enzyme loading and temperature on the L* value for apple juice.
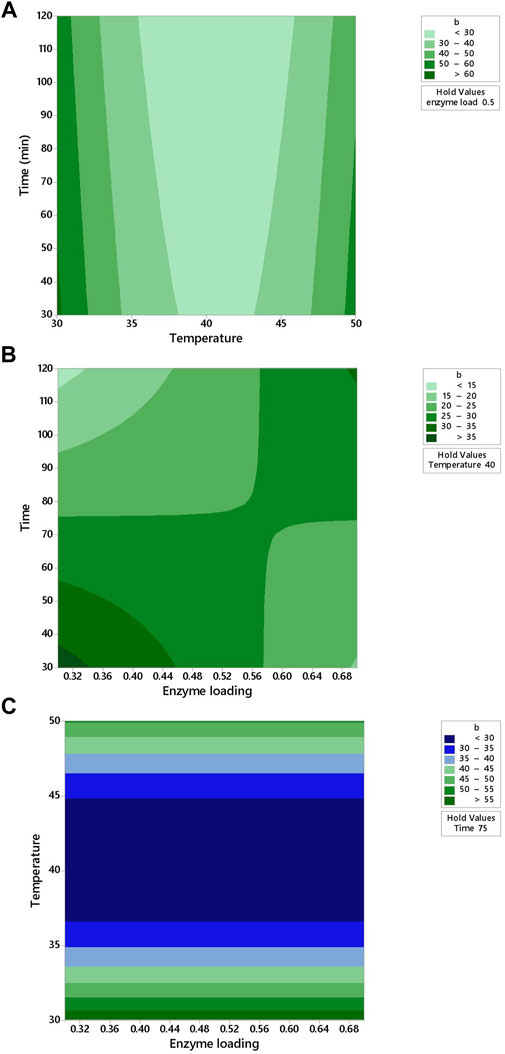
FIGURE 3. Response contour plots showing two-way interaction effects of (A) temperature and time (B) enzyme loading and time (C) enzyme loading and temperature on the b* value for apple juice.
It was observed from Figure 3A that the lowest time (30 min) minimized the b* value (<30) at 40°C. In Figure 3B, the contour plot is not elliptical, indicating that there are fewer interactions between the enzyme loading and time. b* value increased with the decreased temperature under the center point of enzyme loading (0.5%) at an increasing rate of time (Figure 3B). When the temperature was increased from 35 to 45°C, the b* value increased from 30 to 35 (Figure 3C).
The process was optimized by keeping the constraints as maximum L* and b* values for apple juice. The multiple response optimizations of enzymatic treatment parameters were carried out using response surface methodology based on the desirability function approach. Desirability is an objective function that ranges from zero to one (least to most desirable, respectively) at the goal. The best solution for the multiple response optimizations is represented in Table 3. The optimum conditions for enzymatic treatment of apple juice predicted by the model were 0.3% enzyme loading, at 50°C for 30 min, which gave about 70.75 for L* value and 62.30 for b* value (Table 3). The coefficient of variation (CV) describes the dispersion of the data, and smaller values of CV give the best reproducibility. CV values were 4.04 and 4.69% for L* and b* values, respectively.
L*, a*, turbidity (NTU), TPC (mg GAE/L), pH, and TSS (oBrix) of untreated carrot juice were also measured as 43.34 ± 0.31, 29.45 ± 0.06, 849.3 ± 22.34, 142.12 ± 0.31, 4.07 ± 0.01, and 12.00 ± 0.00, respectively. The turbidity of carrot juice in this study ranged between 628.6–1077 NTU treated with crude pectinase, irrespective of the enzyme loading, temperature, and time (Table 1). The turbidity significantly increased with an increase in temperature and time (Table 1) (p < 0.05). The maximum L* value of carrot juice (44.80) was obtained at 50°C for 75 min with 0.7% enzyme loading (Table 1). a* value varied from 25.57 to 31.11 treated with crude pectinase, irrespective of the enzyme loading, temperature, and time. An increase in a* value indicates an increase in reddish color in fruit juice. Thus, the maximum a* value of carrot juice was found as 31.11 at 50°C for 30 min with 0.5% of enzyme loading (Table 1). The maximum TPC value of carrot juice (205.84 mg GAE/L) was obtained at 50°C for 75 min with 0.7% enzyme loading, whereas the minimum TPC value (57.17 mg GAE/L) was obtained at 30°C for 120 min with 0.5% enzyme loading (Table 1).
The insignificant lack of fit values for only two models (L* and a* values for enzymatic treatment of carrot juice) also indicated that the model fitted the experimental data well (Tables 2, 3). Among the variables studied, temperature and time showed a significant effect (p < 0.05) on the L* value. It showed a significant main effect of temperature with a positive effect on the L* value, whereas the main effect of time with a negative effect on the L* value (Table 2) (p < 0.05). The most important factor determining the L* value was temperature with the highest coefficient (1.959), indicating that it is the most dominant factor influencing the enzymatic treatment of carrot juice using microalgae-derived pectinase followed by time (Table 2). However, among the variables studied, only time showed a significant effect on a* value (p < 0.05). The optimum conditions for enzymatic treatment of carrot juice predicted by the model were 0.3% enzyme loading at 50°C for 30 min, which gave about 45.12 for the L* value and 31.25 for the a* value (Table 3). CV values were 3.11 and 1.79% for L* and a* values, respectively.
The two-dimensional (2D) response contour was plotted to study the interaction of the three factors (temperature, enzyme loading, and time) on the L* and a* values for carrot juice (Figures 4, 5). Figure 4A showed the projection of a 3-D graph on a 2-D plot of the positive interaction between temperature (X2) and time (X3) on the L* value of carrot juice. The contour plot is elliptical and the interaction effect is statistically significant (Figure 4A). The maximum L* value (>43) was obtained when both factors (temperature and time) were at 45–50°C and 30–120 min, respectively (Figure 4A). L* value increased with decreased enzyme loading at the lowest time (Figure 4B). In Figure 4B, the contour plot is elliptical, indicating that there are interactions between the enzyme loading and time. The L* value increased with increased temperature from 45 to 50°C under the center point of time (75 min) (Figure 4C).
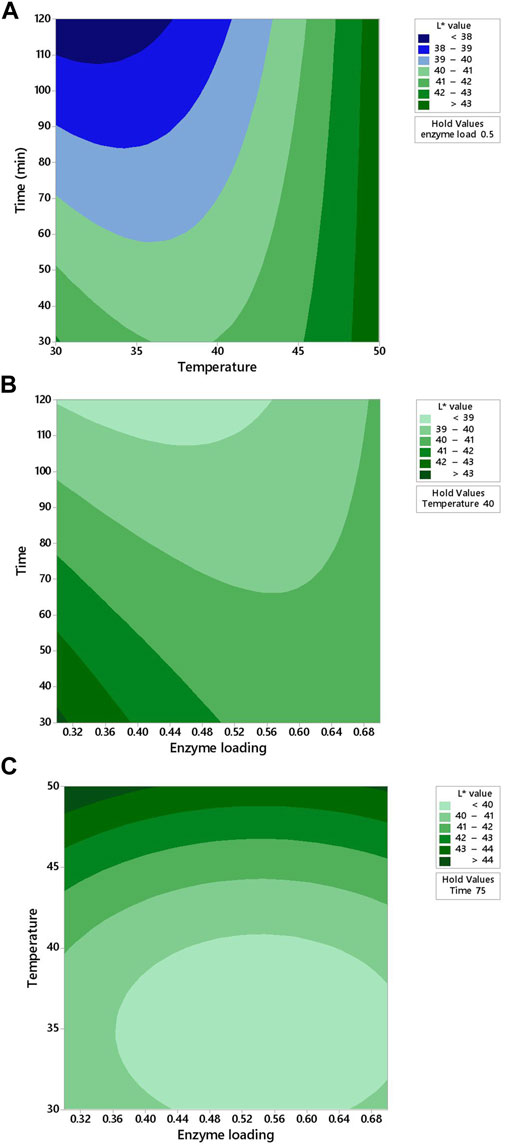
FIGURE 4. Response contour plots showing two-way interaction effects of (A) temperature and time, (B) enzyme loading and time, and (C) enzyme loading and temperature on the L* value for carrot juice.
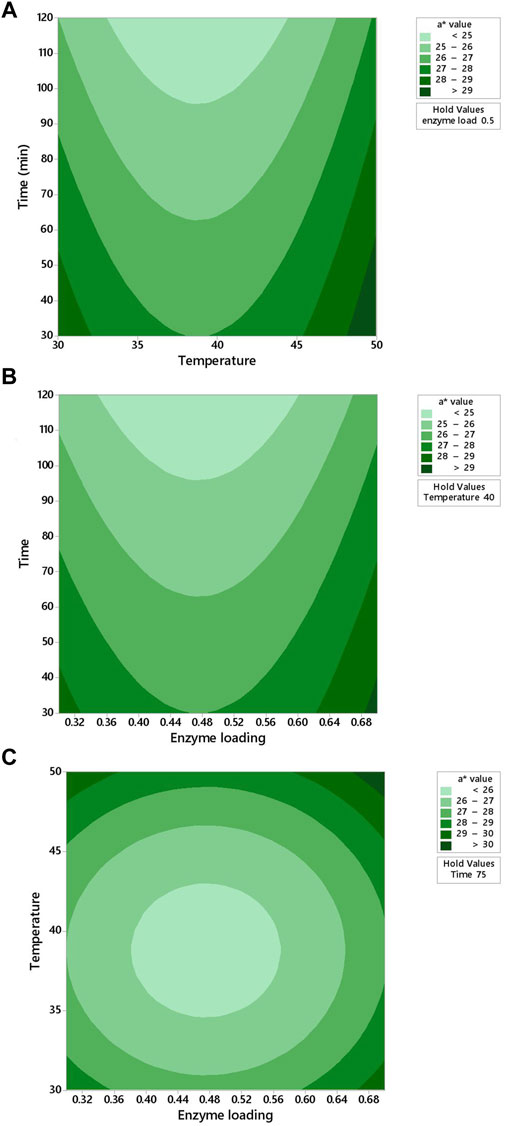
FIGURE 5. Response contour plots showing two-way interaction effects of (A) temperature and time, (B) enzyme loading and time, and (C) enzyme loading and temperature on the a* value for carrot juice.
It was observed from Figure 5A that the a* value decreased with increased time at 40°C. In Figures 5A–C, the contour plot is not elliptical, indicating that there are no interactions between the enzyme loading and time, temperature and time, as well as enzyme loading and temperature. The a* value decreased with increased time under the center point of temperature (40°C) at an enzyme loading of 0.5% (Figure 5B). When the enzyme loading was increased from 0 to 0.50%, the a* value decreased from 28 to 26 (Figure 5C).
The b* value of apple juice was enhanced by 48.6% in B. subtilis PGase-treated samples after enzymatic treatment over control (no enzyme-treated sample). L* and a* values of carrot juice do not change significantly after enzymatic treatment (p > 0.05), revealing better color values at enzymatic treatment for apple juice samples.
Carrot juice was treated with pectinase enzyme obtained from hazelnut shells by B. subtilis at different incubation times (2–6 h), pH (4–7), and enzyme concentration (0.1–0.5%) indicated the optimum conditions for clarification of carrot juice as 0.5% enzyme loading at 50°C and pH of 7.0 for 6 h of time resulting in 100% clarity (Uzuner and Cekmecelioglu, 2015). Amobonye et al. (2022) investigated the use of crude PGase enzyme from Beauveria bassiana using wheat bran to clarify pear juice. The best results of pear juice clarification were found at 36.8°C for 2.75 h. Uzuner (2018) observed that the activity of PGase needs to be considered during depectinization of apple juice. The best results of apple juice clarification were obtained with B. subtilis crude enzymes at 45.8°C with 0.3% of enzyme loading during 2 h of time, resulting in 70.40 lightness, 49.44 turbidity, and 88.33% clarity.
The crude PGase derived from microalgae pectinase performed good effectiveness and competitiveness of the commercial pectinase in the apple juice for the depectinization process (Table 4). The application of crude Exo-PGase derived from microalgae showed a 53% decrease in turbidity of apple juice as compared to no-enzyme-treated sample. The turbidity reduction of apple juice was found at 59 and 53% in pectinex- and B. subtilis PGase-treated samples, respectively, over control (no enzyme treated sample) after 30 min of incubation (Table 4). L*, a*, and b* values did not change significantly for control, crude, and commercial enzymes (p > 0.05). However, 29 and 37% reductions were observed in the TPC of apple juice for crude and commercial enzymes, respectively (Table 4).
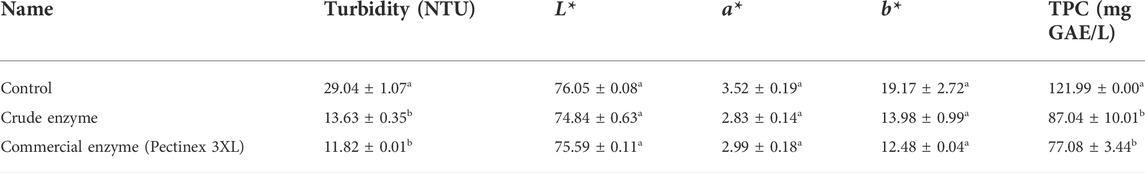
TABLE 4. Comparison of crude and commercial enzymes according to apple juice properties.
The Exo-PGase production was investigated concerning microalgae hydrolyzate and the combination of microalgae hydrolyzate and glucose as carbon sources by B. subtilis. The experiments conducted with synthetic sugar and microalgae hydrolyzate showed increased Exo-PGase activity. The Exo-PGase activity obtained from microalgae hydrolyzate was lower than that of the combination of synthetic sugar and microalgae hydrolyzate. Maximum enzyme activity was increased by about 2.9 folds from the initial starting conditions. Different juice processing conditions (enzyme loading, temperature, and time) were also examined for the clarification of apple and carrot juice. Both carrot and apple juices were treated with the crude PGase (248.9 U/L) at different concentrations (0.1–0.5%), temperatures (30–50°C), and times (30–120 min). The maximum clarification conditions were obtained as 0.3% (w/v) enzyme concentration at 50°C for 30 min exposure time. The study also indicates the equal effectiveness and competitiveness of crude enzymes as commercial enzymes.
The original contributions presented in the study are included in the article/supplementary materials; further inquiries can be directed to the corresponding author.
SU: investigation (conducting a research and investigation process, specifically performing the experiments, or data/evidence collection), formal analysis (application of statistical or mathematical techniques to analyze or synthesize study data), and writing—original draft (preparation and/or creation of the published work, specifically writing the initial draft). GE: investigation (specifically performing the experiments, or data/evidence collection) and writing—review and editing (specifically critical review, commentary or revision—including pre- or post-publication stages). SK: investigation (performing the experiments, or data/evidence collection).
The authors would like to thank the Republic of Turkey Ministry of Agriculture and Forestry General Directorate of Agricultural Research and Policies (Project no: TAGEM/16/AR-GE/36) for financial support and the Innovative Food Technologies Development Application and Research Center (YENIGIDAM) of Bolu Abant Izzet Baysal University (BAIBU) for HPP analyses.
The authors declare that the research was conducted in the absence of any commercial or financial relationships that could be construed as a potential conflict of interest.
All claims expressed in this article are solely those of the authors and do not necessarily represent those of their affiliated organizations, or those of the publisher, the editors, and the reviewers. Any product that may be evaluated in this article, or claim that may be made by its manufacturer, is not guaranteed or endorsed by the publisher.
Alkorta, I., Garbisu, C., Llama, M. J., and Serra, J. L. (1998). Industrial applications of pectic enzymes: A review. Process Biochem. 33, 21–28. doi:10.1016/S0032-9592(97)00046-0 |
Alvarez, S., Alvarez, R., Riera, F. A., and Coca, J. (1998). Influence of depectinization on apple juice ultrafiltration. Colloids Surfaces A Physicochem. Eng. Aspects 138, 377–382. doi:10.1016/S0927-7757(98)00235-0 |
Amobonye, A., Bhagwat, P., Ruzengwe, F. M., Singh, S., and Pillai, S. (2022). Pear juice clarification using polygalacturonase from Beauveria bassiana: Effects on rheological, antioxidant and quality properties. Pol. J. Food Nutr. Sci. 72 (1), 57–67. doi:10.31883/pjfns/145704 |
El Enshasy, H. A., Elsayed, E. A., Suhaimi, N., Malek, R. A., and Esawy, M. (2018). Bioprocess optimization for pectinase production using Aspergillus Niger in a submerged cultivation system. BMC Biotechnol. 18, 71. doi:10.1186/s12896-018-0481-7 | |
Kapoor, M., Beg, Q. K., Bhushan, B., Dadhich, K. S., and Hoondal, G. S. (2000). Production and partial purification and characterization of a thermo-alkali stable polygalacturonase from Bacillus sp. MG-cp-2. Process Biochem. 36, 467–473. doi:10.1016/S0032-9592(00)00238-7 |
Lowry, O. H., Rosenbrough, N. J., Farr, A. L., and Randall, R. J. (1951). Protein measurement with the Folin phenol reagent. J. Biol. Chem. 193, 265–275. doi:10.1016/s0021-9258(19)52451-6 | |
Miller, G. L.(1959). Use of dinitrosalysilic acid reagent for determination of reducing sugar. Anal. Chem.31(3), 426–428. doi:10.1021/ac60147a030 |
Nagar, S., Mittal, A., and Gupta, V. K. (2012). Enzymatic clarification of fruit juices (apple, pineapple, and tomato) using purified Bacillus pumilus SV-85S xylanase. Biotechnol. Bioprocess Eng. 17, 1165–1175. doi:10.1007/s12257-012-0375-9 |
Spanos, G. A., Wrolstad, R. E., and Heatherbell, D. A. (1990). Influence of processing and storage on the phenolic composition of apple juice. J. Agric. Food Chem. 38, 1572–1579. doi:10.1021/jf00097a031 |
Uzuner, S., and Cekmecelioglu, D. (2015). Enhanced pectinase production by optimizing fermentation conditions of Bacillus subtilis growing on hazelnut shell hydrolyzate. J. Mol. Catal. B Enzym. 113, 62–67. doi:10.1016/j.molcatb.2015.01.003 |
Uzuner, S. (2018). Effect of crude pectinase on apple juice quality characteristics by desirability approach. Gıda 43 (4), 558–568. doi:10.15237/gida.GD18024 |
Keywords: microalgae-derived polygalacturonase, microalgae, clarification, bioreactor, submerged fermentation
Citation: Uzuner S, Evrendilek GA and Kurhan S (2022) Production of microalgae-derived exo-polygalacturonase for fruit juice clarification. Front. Food. Sci. Technol. 2:951609. doi: 10.3389/frfst.2022.951609
Received: 24 May 2022; Accepted: 23 August 2022;
Published: 16 September 2022.
Edited by:
Betul Soyler, Middle East Technical University, TurkeyReviewed by:
Mukesh Patidar, Maharaja Ranjit Singh College of Professional Sciences, IndiaCopyright © 2022 Uzuner, Evrendilek and Kurhan. This is an open-access article distributed under the terms of the Creative Commons Attribution License (CC BY). The use, distribution or reproduction in other forums is permitted, provided the original author(s) and the copyright owner(s) are credited and that the original publication in this journal is cited, in accordance with accepted academic practice. No use, distribution or reproduction is permitted which does not comply with these terms.
*Correspondence: Sibel Uzuner, c2liZWx1enVuZXJAaXl0ZS5lZHUudHI=, c3V6dW5lcjgxQHlhaG9vLmNvbQ==
Disclaimer: All claims expressed in this article are solely those of the authors and do not necessarily represent those of their affiliated organizations, or those of the publisher, the editors and the reviewers. Any product that may be evaluated in this article or claim that may be made by its manufacturer is not guaranteed or endorsed by the publisher.
Research integrity at Frontiers
Learn more about the work of our research integrity team to safeguard the quality of each article we publish.