Abstract
This technology report validates the application of radio frequency (RF) coefficient of reflection (Γ) measurement as a viable and accurate means to estimate the starch content of fresh cassava roots. A clear relationship between cassava dry matter as an indicator of starch content and the Γ is experimentally verified both from the measurement of cassava flour in water at different concentrations and by direct probing of cassava root samples at a specific frequency of 30 MHz. A prototype test instrument designed with goals of portability, low cost and ease of use is also reported. The test instrument displays estimated starch content in five categories, from “low” to “high”, using an array of five LEDs. The performance of the test instrument is experimentally verified in the field, and a reliable correlation between cassava dry matter content and LED indication is demonstrated.
1 Introduction
The United Nations has projected that by 2050, the world population will hit 9.8 billion (United Nations, 2019), with a commensurate increase in pressure on global food systems. To meet this challenge within the framework of the UN SDG to “End hunger, achieve food security and improved nutrition and promote sustainable agriculture” (Mollier et al., 2017; Cheo and Tapiwa, 2021) will require a combination of increased global agriculture output; improved food distribution systems and reduced food waste. Information and Communication Technology (ICT), especially the application of the Internet of Things (IoT), is already playing a critical role and is projected to have an even more significant impact on the food systems of the future. However, there are critical gaps in the application of technology to monitoring food quality and safety from farm to fork, especially with crops that have primary importance in developing economies. Applied to agriculture, IoT and connected systems especially, have great potential to transform how we produce, process and access food. However, at the core of these systems, portable sensors and devices that can measure and monitor key quality metrics are required.
Lab-based spectrometric methods of food characterization are often highly specialized and impractical to deploy either at scale or in the field. More practical solutions are linked to the study of the interactions between electromagnetic fields of different wavelengths and food materials. These methods, which include electrical impedance spectroscopy (EIS) (Nernst, 1894), near-infrared (NIR) spectroscopy (Williams and Norris, 1987) and nuclear magnetic resonance (NMR) spectroscopy (Marcone et al., 2013), provide simple and non-destructive means to characterize food and other biological materials. EIS and NIR spectroscopes have been designed and incorporated in handheld units, making them applicable in different environments. Both methods have generated significant interest in the food industry, where attempts have been made to identify different quality indices of crops and food substances (Grossi and Riccò, 2017; Ozaki et al., 2006).
EIS, a method of characterizing biological materials based on their interaction with electrical energy in the Radio Frequency (RF) and microwave range dates back to 1894, when Nernst demonstrated the possibility of differentiating between different fluids based on their dielectric constants (Nernst, 1894). The technique provides a versatile and comparatively low-cost method for spectrometry due to the relative ease of generating signals in this wavelength. A prominent area of application is the characterization of the physiological state of fruits (Harker and Maindonald, 1994; Bauchot et al., 2000; Nelson, 2005; Lizhi et al., 2008). Such techniques have also been applied to the characterization of vegetable oils [Lizhi et al. (2008)] and dairy products (Mabrook and Petty, 2003) and in measuring the concentration of pathogens in food samples such as milk, spinach and ground beef (Yang et al., 2004).
In the starch sub-industry, where new applications such as the production of bioenergy and biodegradable plastic alternatives are driving increasing global demand (Prakash, 2008), the availability of a rapid, non-destructive method for estimating the starch content of fresh roots and tubers in the field is highly desirable (Wholey and Booth, 1979; Teye et al., 2011; Ikeogu et al., 2017). In this regard, particular focus has been on the estimation of the starch content in cassava (Manihot esculenta), a tropical root crop, which is one of the most important starch crops globally (Van Alfen, 2014; Figueiredo et al., 2013). Cassava provides staple food to nearly 800 million people globally, most of which are in sub-Saharan Africa (Howeler et al., 2013). The crop is highly valued because of its peculiar climate resilience, drought tolerance and relative resistance to weeds and insect pests (Ajibola, 1985). The bulk of the dried cassava root consists of carbohydrates, over 80% of which is pure starch (Figueiredo et al., 2013; Wholey and Booth, 1979). Cassava starch is typically constituted of 16–18% of amylose and 82–84% amylopectin (Wheatley et al., 2003).
For industrial supply chains, the price paid for fresh cassava roots is often dependent on the estimated starch content, rather than the bulk weight (Wholey and Booth, 1979). The most accurate method of starch determination currently available is a qualitative laboratory analysis, which is beyond the reach of small and medium-scale starch processors and the vast majority of sub-Saharan African farmers, as it requires specialised laboratory facilities (Wholey and Booth, 1979). A commonly adopted substitute is complete oven-drying, which leaves a dry-matter residue (Figueiredo et al., 2013). This Oven Dry Matter (ODM) technique is, however, mainly applicable in a laboratory/research context as the process requires oven-drying at 105°C for at least 24 h to reach a steady dry weight (Teye et al., 2011; Ikeogu et al., 2017; Haase, 2003). From the dry weight, the starch content can be derived, as both quantities are closely correlated (Teye et al., 2011; Fukuda et al., 2010). A quicker, non-destructive but less accurate method of starch estimation is to determine the Root Specific Gravity (RSG) by measuring the weight of the roots in air and then in water (Wholey and Booth, 1979). The RSG is then used to estimate dry-matter and starch content using empirical formulae such as those reported by Teye et al. (2011), Fukuda et al. (2010). The RSG method is the one most often used at starch production plants. Whilst being quicker and simpler to implement, it can, however, be prone to significant measurement errors and requires trained personnel to yield reliable results (Ajibola, 1985).
The application of rapid non-destructive measurement of starch content is highly valuable in high-throughput phenotyping (HTP) studies of cassava. This approach can be used for rapid screening of breeding plots as well as in grower fields. Currently, spectrophotometric methods that use near-infrared regions of the electromagnetic spectrum have been used to estimate dry matter content rapidly (Hershberger et al., 2022). The near-infrared technology could replace the laborious and time-consuming lab-based starch content quantification. Still, the available NIR technologies are expensive, lab-based, and not deployable at scale, for example, to be used by growers. The NIR spectrophotometers also require an internet connection and proprietary software that is out of reach of ordinary farmers.
Studies have shown a link between the electrical properties, such as conductivity and dielectric constant, of fresh cassava root and its dry matter and starch content (Harnsoongnoen and Siritaratiwat, 2015; Bergo et al., 2012; Ajibola, 1985). In this paper, we describe work done to explore the link between starch content and the reflection coefficient magnitude (|Γ|) for cassava root samples at a range of radio frequencies. This work resulted in the discovery of an optimum measurement frequency where the difference in |Γ| between different starch content samples is most pronounced. We also describe the design and fabrication of a simple, low-cost, hand-held test instrument that could potentially enable farmers to test the starch content of cassava roots quickly and non-destructively in the field using the coefficient of reflection measurement method.
An early report of this work was presented at the 2020 IEEE International Symposium on Circuits and Systems (ISCAS) the flagship conference on Circuits and Systems held in Seville, Spain and published as a conference proceeding in Odedeyi et al. (2020). This paper expands substantially on the conference proceeding by providing the broader context of the research; additional results; and a more extensive discussion. This report also provides protocols to obtain rapid and accurate measurements using the developed method.
2 Experimental investigations
In the field of electrical engineering and telecommunications, |Γ| is a coefficient used to describe the proportion of a signal that is reflected as a result of an impedance mismatch between the source or generator of the signal and the destination (often described as the load) (Pozar, 2011; Poole and Darwazeh, 2015). In a perfectly matched system, there will be no reflection of the signal, hence |Γ| = 0, while in a system with a perfect mismatch, the whole signal will be reflected to the source; hence a |Γ| of 1. |Γ| is typically measured at a reference impedance level of 50 Ω, with a network analyzer—a device that generates an RF signal across a defined range of frequencies and measures the magnitude of the signal reflected, effectively measuring impedance at different frequencies Moura and Darwazeh, (2005).
For our experiments, we connected a 50 Ω-matched open-ended coaxial probe to the network analyzer to directly probe the samples to be tested (Figure 1). An open-ended coaxial probe was used since such probes have been the most commonly used method of determining the dielectric properties of semi-solid foods such as fresh fruits and vegetables as in Guo et al. (2007) and Nelson and Bartley, (2000). This probe also presents a practical method for testing root crops in the field using a hand-held device. One consequence of taking spot measurements with a coaxial probe is that there will be marked variations in results depending on the location of the probe insertion point, and care needs to be taken to control for sample slice position and probe insertion point. The coaxial probe used in this work consisted of a semi-rigid solid copper-jacketed coaxial cable with one end stripped to expose a 3 mm section of the centre conductor. To ensure consistent depth of insertion, a band of insulating material made from heat-shrink tubing was placed around the copper jacket at 5 mm from the tip of the probe, as shown in Figure 2.
FIGURE 1
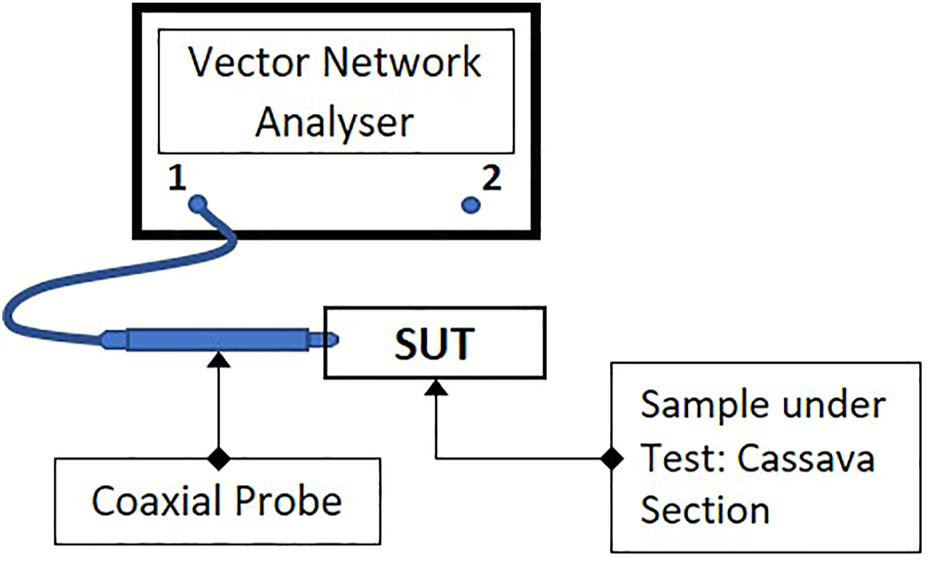
Block diagram of measurement setup. One port (S11) measurements of samples were taken from “Port 1” of the VNA.
FIGURE 2
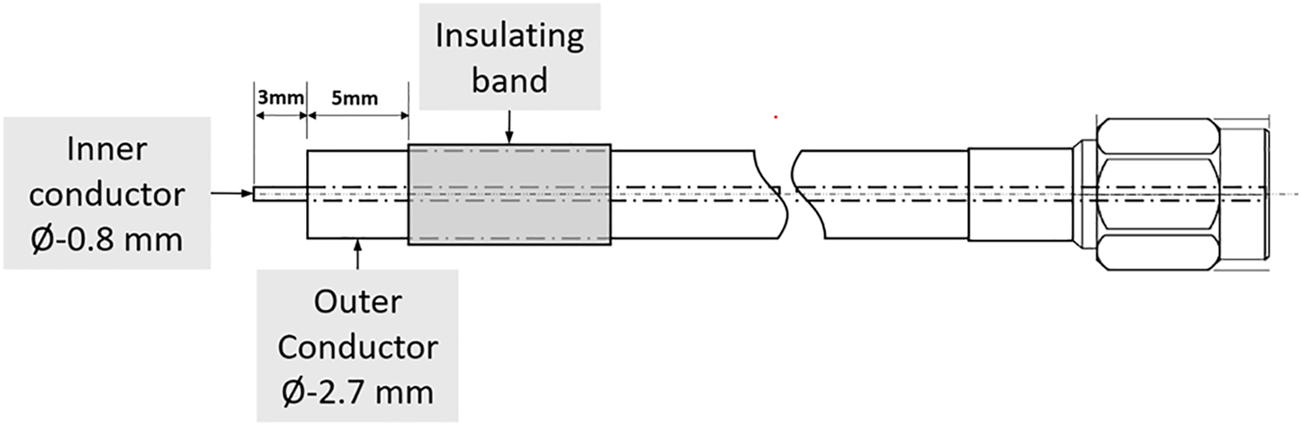
Open-ended coaxial probe.
Two sets of experiments were conducted using the measurement setup described in Figure 1: first to investigate the possibility of characterizing the concentration of cassava flour in a suspension and afterwards to test if this relationship could be observed by direct probing of a fresh cassava root. These experiments are subsequently described.
2.1 Measurement of cassava flour concentration
This initial set of experiments aimed to observe if different concentrations of cassava dry matter and starch could be determined by measuring the value of the |Γ|. Cassava flour was dissolved in water as shown in Figure 3 at concentration levels of 10% (10 g of starch in 90 g of water), 20% (20 g of starch in 80 g of water), 30% (30 g of starch in 70 g of water) and 40% (40 g of starch in 60 g of water). The maximum concentration level of 40% was chosen for this experiment, as this is the typical high-end in dry matter content for cassava roots, with values above 30% considered as high (Teye et al., 2011). As a control experiment, the return loss of water used as solvent was also measured. The return loss measurements were carried out using a Keysight FieldFox Microwave Analyzer N9917A (a vector network analyzer) and the purpose-made coaxial probe to measure the one-port reflection coefficient from 10 kHz to 5 GHz. All the samples were thoroughly stirred before each measurement was taken. Figure 4 shows the |Γ| measurement from 10 kHz to 5 GHz.
FIGURE 3
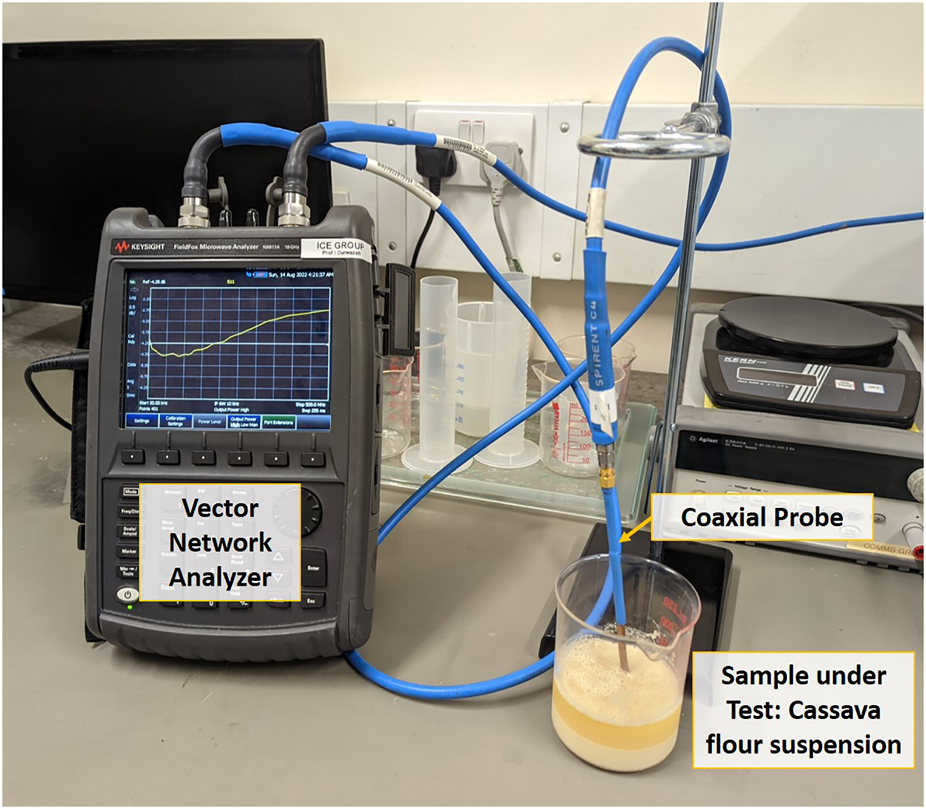
Measurement setup for testing different concentration levels of cassava flour. Suspension of cassava flour in water at 0; 10; 20; 30 and 40% concentration levels were tested.
FIGURE 4
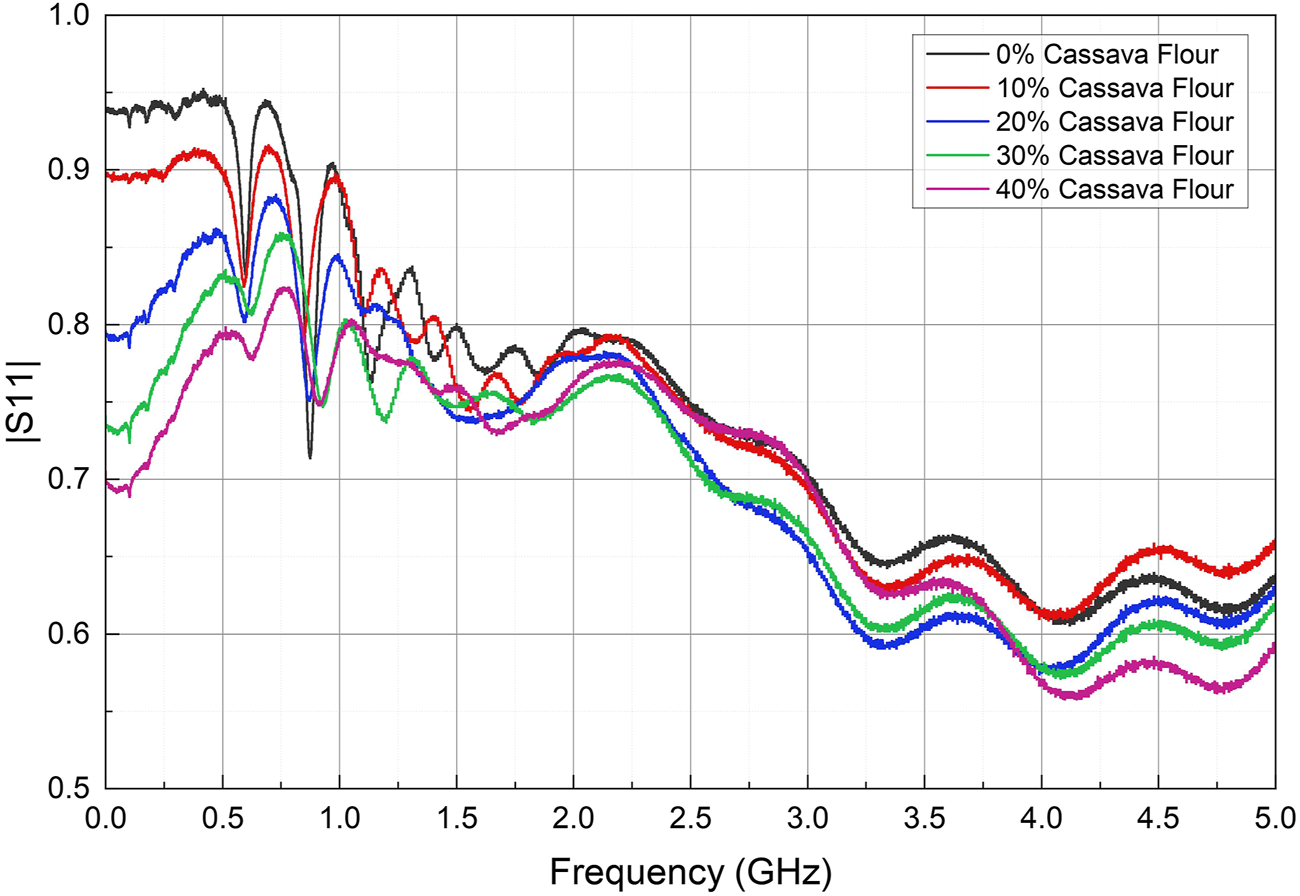
Coefficient of reflection |Γ| for cassava flour suspensions at 0; 10; 20; 30 and 40% concentration.
It may be observed from Figure 4 that the low-frequency range up to 0.5 GHz provides the clearest differentiation between Γ for the measured samples. Furthermore, it is observed that |Γ| reduces with respect to the percentage concentration of cassava flour. This experiment was repeated with similar results, demonstrating the possibility of characterizing the dry-matter and starch concentration of cassava using this technique.
2.2 Measurement of dry matter in cassava root sections
Following the initial experiments with cassava flour suspensions, a series of experiments were conducted at the International Institute of Tropical Agriculture (IITA) in Nigeria on fresh cassava roots (harvested and tested within a 12-h period). These experiments aimed to provide a proof-of-concept validation of the relationship between cassava dry matter content and |Γ| across a range of radio frequencies up to 900 MHz when measurement is performed by directly probing the root. Three cultivars of cassava, the IITA-TMS-IBA000070, IITA-TMS-IBA980505 and TMEB419, were obtained from the IITA research farms. For this preliminary proof-of-concept study, a large number of roots per cultivar were sampled, at different stages of maturity and thus varying levels of dry matter content. Through the course of these experiments, over 250 roots were harvested in the field and immediately transported to the laboratory, where they were cleaned and each cassava root divided into six sections: two sections each from the distal, mid and proximal regions. The extremities of the roots were cut off so that each section presented a viable test surface on both sides. One section each from the distal, mid and proximal regions was selected for return loss measurements, while the remaining portions were reserved for ODM processing. These sample portions were grated and homogenized by thorough mixing. 100 g portions of these gratings were then placed in the oven at 70°C for more than 48 h to ensure complete drying. The dried samples were then weighed to determine the dry matter content. These ODM results were used to calibrate the return loss measurements against root sample starch content.
The return loss measurements were carried out using a PicoVNA-106 vector network analyzer and the purpose-made coaxial probe to measure the |Γ|. Figure 5 shows the complete measurement setup, with an inset showing the oven drying setup. In all cases, the insertion point of the probe was the location of the central xylem bundle, which is within the region in which the starch molecules are concentrated (Onwueme (1978), as shown in Figure 5. The observable marking at the central xylem bundle of the cassava section was chosen as the probing point to ensure the experiments could be easily repeatable.
FIGURE 5
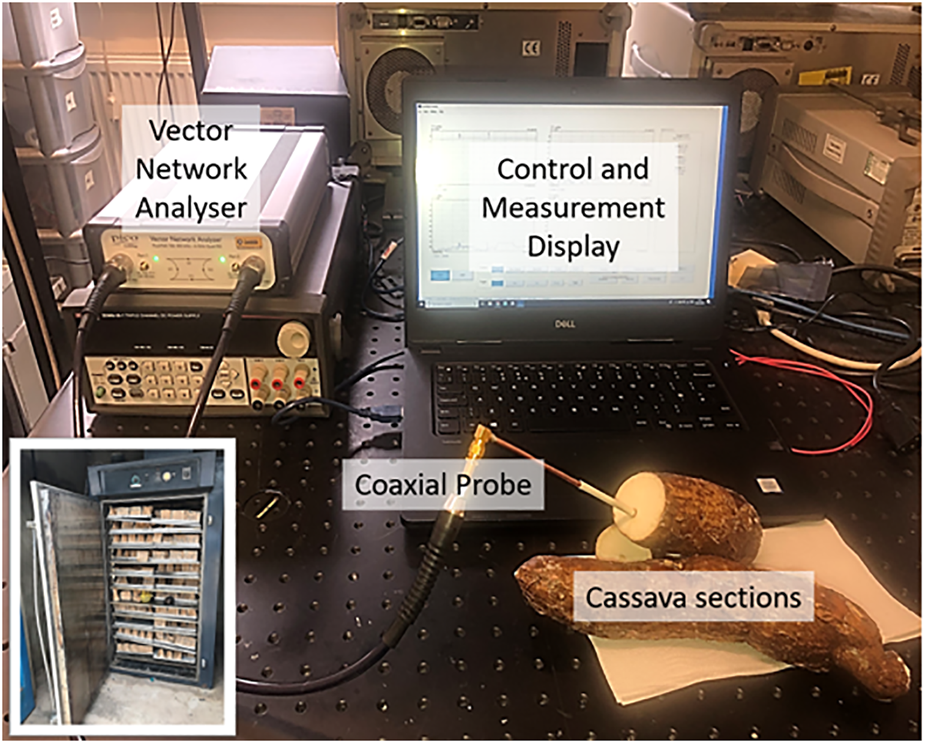
Reflection measurements (S11) setup (Inset: Oven drying setup for dry matter and starch content estimation).
3 Data analysis
The plot of |Γ| versus frequency for 46 cassava samples is shown in Figure 6, with measurements taken from the proximal, mid and distal portion of the roots. Each coloured trace represents an individual sample, with the graphs showing a general trend of the observed response. A general upward trend in the value of |Γ| with frequency can be observed, with a pronounced minimum value of |Γ| at around 30 MHz. This characteristic shape was observed for all sample sets. The frequency of minimum |Γ| is also the frequency at which the divergence in |Γ| values for samples of differing dry-matter content are most pronounced.
FIGURE 6
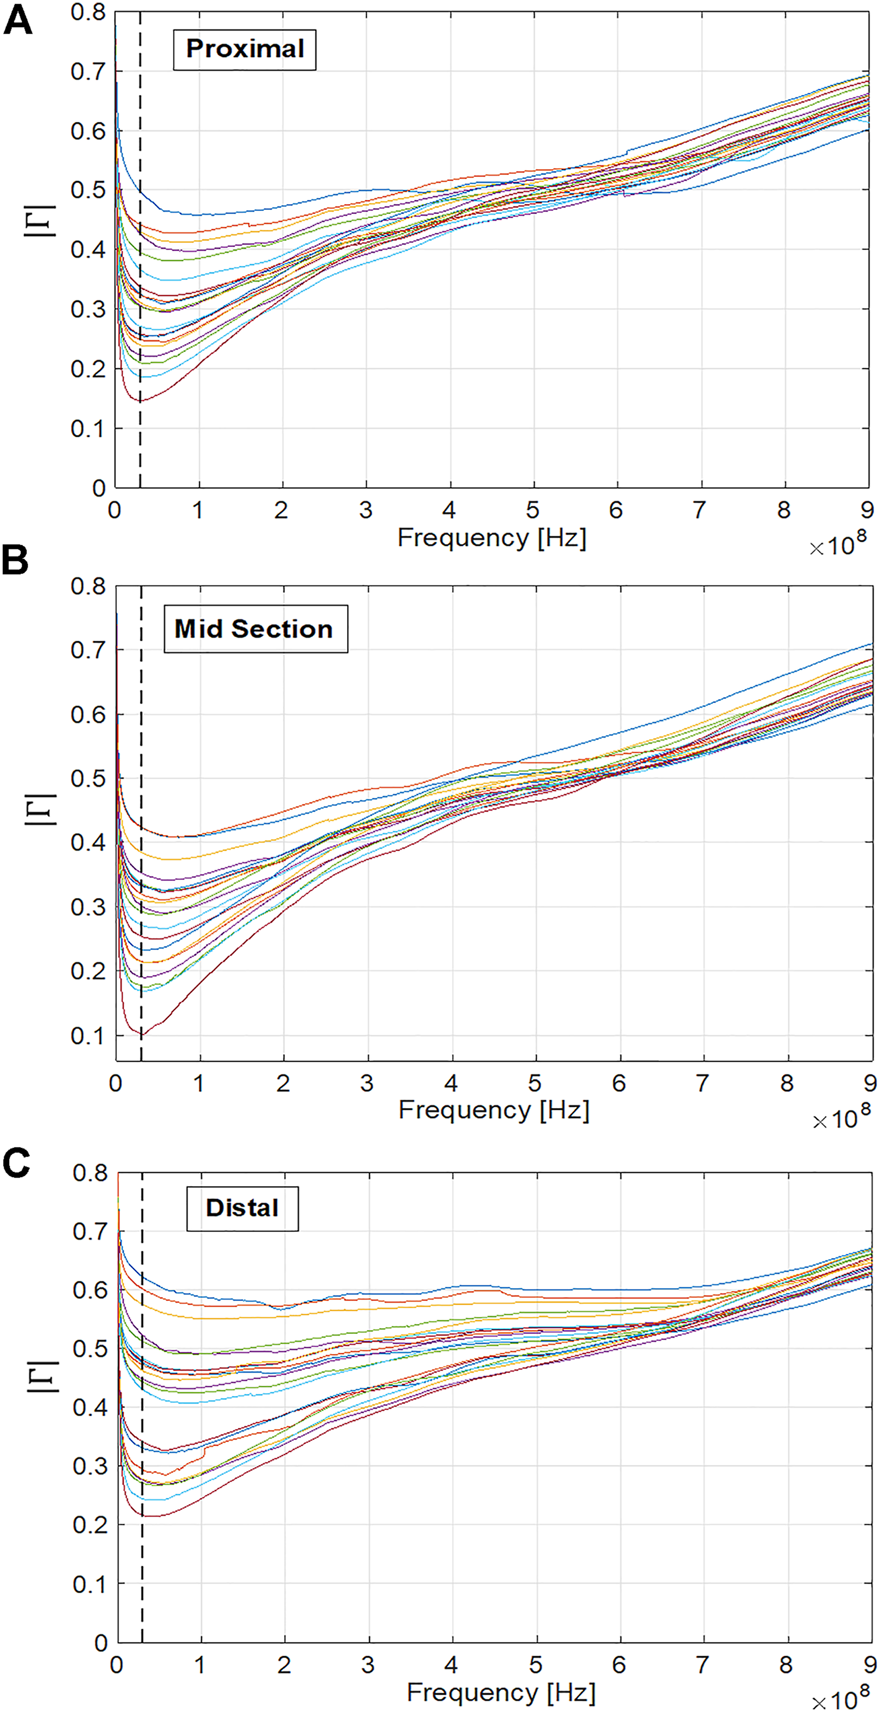
Coefficient of reflection (|Γ|) plots for cassava samples from the (A) proximal section (B) mid-section and (C) distal section. The vertical dashed black line indicates the 30 MHz frequency which is in the region of the frequency of minimum |Γ| and maximum divergence for all measured samples.
It is also observed from Figure 6 that compared to measurements taken from the proximal section (Figure 6A) and distal section (Figure 6C), |Γ| measurements taken from the mid-section of each cassava root (Figure 6B tend to be higher, indicating a higher starch concentration in the mid portion. This is consistent with the current understanding of moisture and starch distribution within cassava roots (Figueiredo et al., 2013; Mehdi et al., 2019).
A related phenomenon was observed for probe placement within the sample cross-section, with measurements taken from the xylem bundle tending to have a higher magnitude compared to the measurements taken towards the cortex of the sample slice. Taken together, these observations provide significant evidence that a spot frequency measurement of return loss at 30 MHz is sufficient to classify cassava samples into “low”, “medium” and “high” starch content, but that root slice selection and probe insertion point within the slice are important considerations in maintaining consistency of measurement results.
4 Test instrument design
Having established |Γ| as a viable index for estimating the starch content of cassava roots, the goal was then to design a low-cost, portable test instrument that could give an immediate, approximate indication of starch content in the field.
A simple test instrument was designed that generates a low-power RF signal, at a single fixed frequency of 30 MHz, to be injected into the sample under test (SUT) via a coaxial probe. The test instrument then determines the amount of RF power reflected from the sample via the probe. In this way, the test instrument can be said to resemble a simple one-port scalar network analyzer. As defined in Poole and Darwazeh, (2015), the instrument calculates the return loss (RLSUT) in dB as followswhere ΓSUT is the coefficient of reflection of the SUT, defined bywhere V+ is the incident voltage wave being injected into the SUT and V+ is the reflected voltage wave coming back from the SUT.
In general, a return loss of 20 dB (or higher) means that the percentage of the power reflected by the SUT is 1% (or less) of the incident power. On the other hand, if the return loss is between 0 and 3 dB, then this means that the SUT is reflecting 50% or more of the incident power.
A block diagram of the test instrument is shown in Figure 7. It consists of a signal source, a receiver for detecting the signal, some simple data processing and an array of five LEDs to indicate a range of return loss values.
FIGURE 7
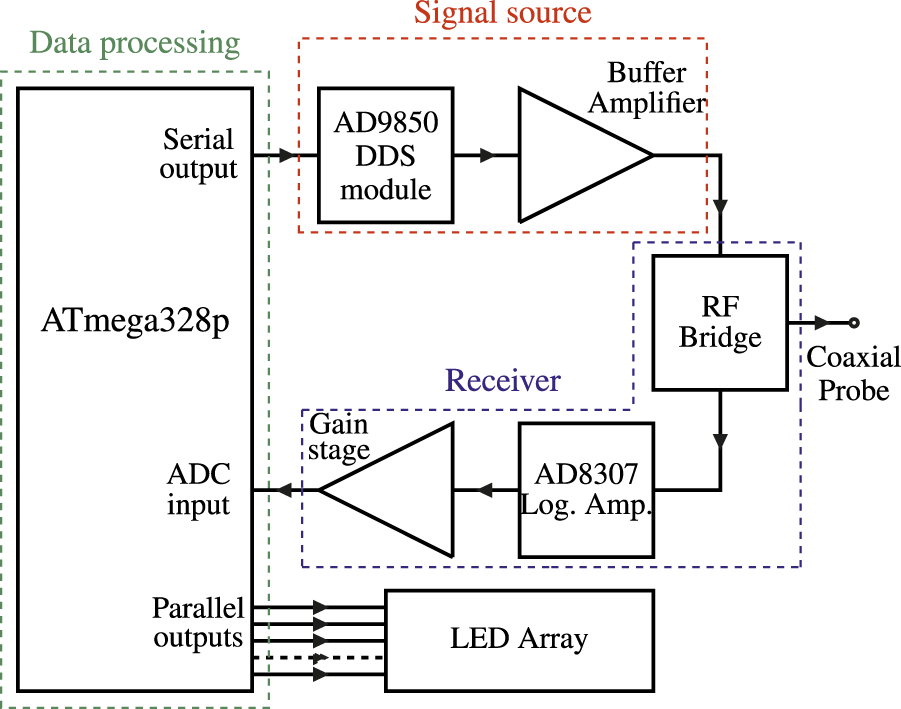
Test instrument block diagram.
The components and basic description of the operation of the device is as follows:
• The signal source employs the AD9850 Direct Digital Synthesizer (DDS) device from Analog Devices Inc. (Analog Devices, 1999). For simplicity, a DDS module containing the AD9850 device plus an external clock oscillator was used.
• The system controller is an Arduino Nano microcontroller module (ATmega328p). At system power-up, the microcontroller provides signal to the DDS module that sets the frequency of operation, which is 30 MHz, as this was established as the optimal test frequency in the previous experiments.
• The output of the DDS is buffered using an Analog Devices AD8307 logarithmic amplifier, to prevent excessive loading of the DDS output by the widely varying impedances that will be presented by the SUT.
• The analogue inputs on the ATmega328p have 10-bit resolution with a full-scale voltage range of 5 V. Since the output voltage of the AD8307 covers the range from 0.31 V an additional voltage gain stage is required between the AD8307 output and the analogue input of the microcontroller to make use of the full dynamic range of the microcontroller ADC.
• The buffered output from the DDS is injected into the SUT via the coaxial probe. The signal measured at the probe input is then the sum of both incident voltage waves injected into the line plus the reflected voltage wave being reflected from the load. The signal presented across AD8307 in such a bridge configuration will therefore represent only the reflected voltage wave coming back from the SUT.
A more detailed description of the device operation can be obtained in Odedeyi et al. (2020).
A photograph of the completed prototype test instrument is shown in Figure 8, which shows the DDS module (top right) the Arduino Nano (ATmega323p) module (centre) the probe SMA connector, RF bridge and AD8307 detector circuit (centre left) and the LED array (bottom right).
FIGURE 8
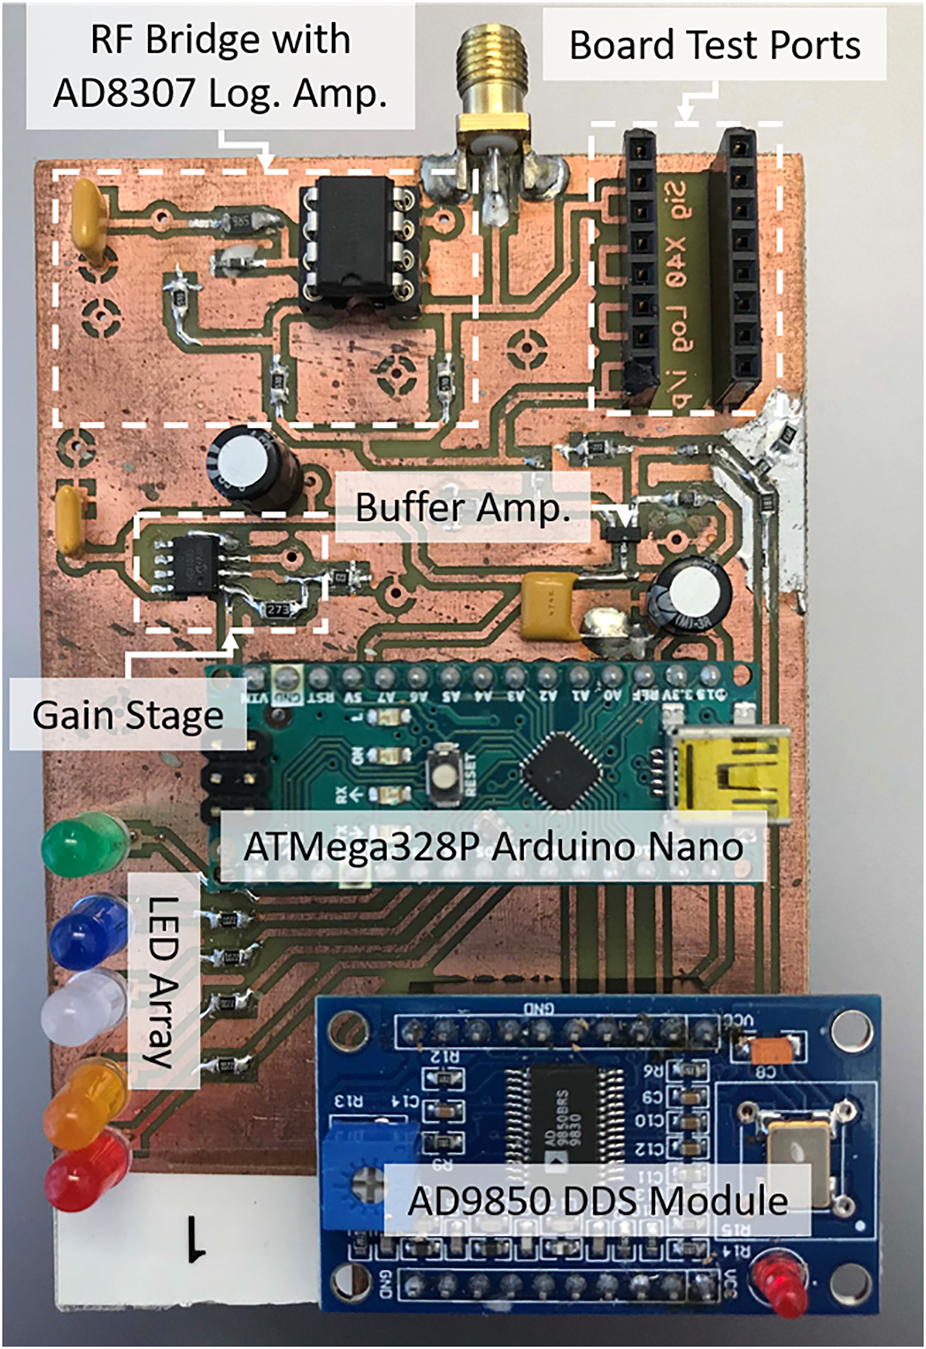
Photograph of the prototype test instrument.
5 Test instrument validation
Four identical prototype test instruments were constructed and tested at IITA using 60 root samples taken from four different cultivars of Cassava with starch content ranging between 6 and 22%. The roots were cut into proximal, mid and distal sections and the starch content of each section was determined using the ODM method and the empirical formulae presented inTeye et al. (2011). The prototype test instrument was used to test each sample using a coaxial probe and the readings generated by the ATmega323p internal ADC, representing the measured return loss, were recorded. Figure 9 shows average ADC readings against ODM measured starch content for the sample set together with the specific LED thresholds that were set during this test. A maximum ADC reading of 1,024 represents a return loss of less than 3 dB, i.e. more than half the incident RF power is being reflected from the SUT. This corresponds to high starch content and will be indicated by the green LED being activated. An ADC reading below about 100 corresponds to a return loss of over 20 dB which will indicate that over 99% of incident RF power is being absorbed by the SUT. This corresponds to low starch content and will be indicated by the red LED being activated. For this early prototype, the use of LED indicators was adopted for ease of use and design simplicity. However, future iterations of the device will feature a digital readout along with the LED indicator and will be calibrated to higher margins of accuracy, with data obtained from ongoing experiments.
FIGURE 9
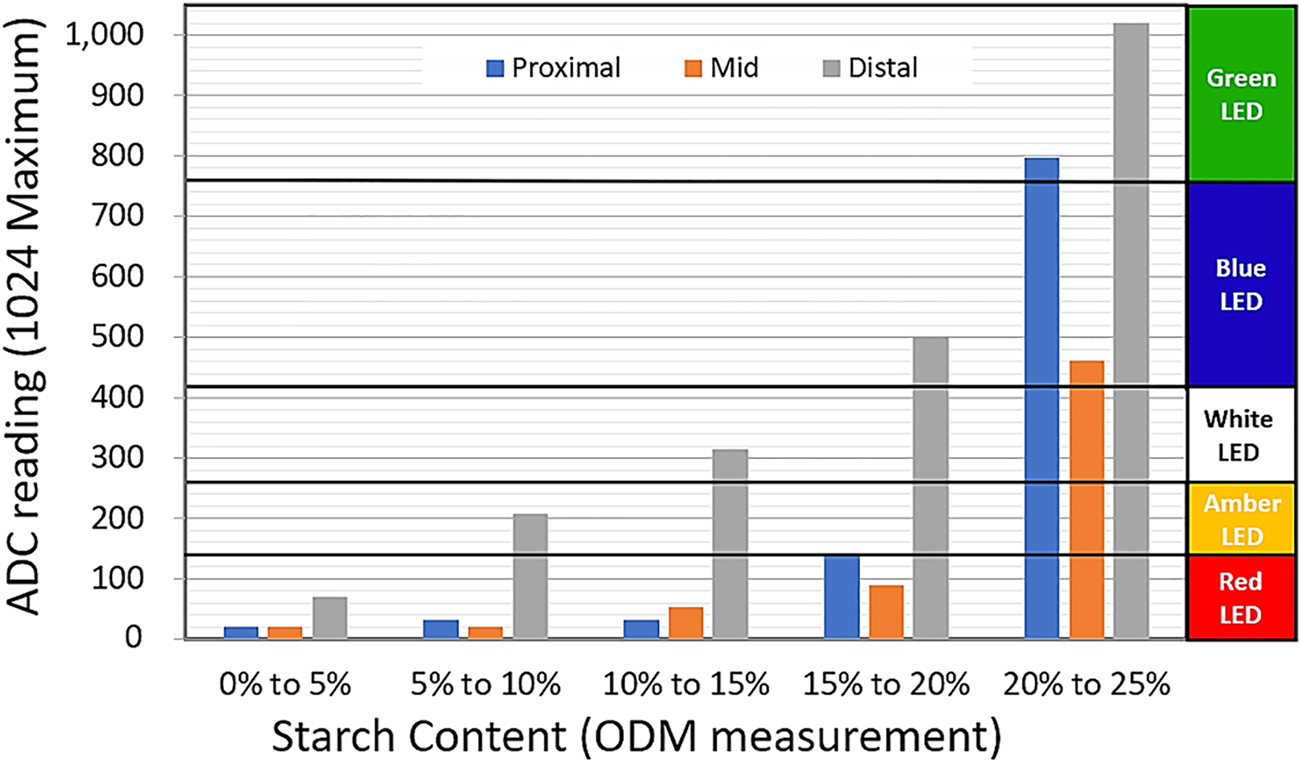
Experimental results for the prototype test instrument, with LED thresholds set using the measurement from distal sections.
Figure 9 reveals a clear correlation between ADC output and ODM measured starch content, although the readings for mid slices were noticeably lower than those for proximal and distal slices, particularly at high starch levels. This is consistent with our understanding of moisture distribution within the cassava root and our earlier results shown in Figure 6. From Figure 9 it may be observed that the LED thresholds need to be set differently for different slice locations, but that the distal slice would give the highest measurement resolution. Whilst starch content values above 25% are obtainable in high starch content cassava varieties at full maturation and peak season, such samples were not available during this project and the highest starch-content band used in calibrating the device was therefore 20–25% (Figure 9). The test instrument is, however, capable of measuring much higher starch contents and the LED thresholds can be easily reset in software to allow for measurement of higher or lower starch content varieties.
6 Measurement protocols
We propose three measurement protocols for starch estimation using the |Γ| property of cassava roots, as measured with the new test instrument.
6.1 Measurement of the return loss of the distal section
From our experiments, it was determined that the distal section offers the highest degree of variation. Hence, for a quick and easy starch content estimation, the threshold for classification may be assigned using measurements from this section, as shown in Figure 9. However, to standardize this measurement protocol, more research is needed to determine a fixed reference for the proximal, mid and distal sections. This problem is complicated by the high degree of variability in the morphology of roots, such that tubers maybe 20–100 cm long and 5–10 cm in diameter, with average tuber weight between 4 and 7 kg and specimens up to 40 kg having been reported by Heuzé et al. (2016).
6.2 Measurement of the average of the proximal, mid and distal section
While the distal section gives the highest measurement resolution, this value is not indicative of the average dry-matter content across all sections of the cassava root. Hence, it is possible to have two cassava roots with similar distal-dry-matter but different dry matter distribution across other sections. A measurement protocol that eliminates this potential error may be implemented, whereby, in software, the device is programmed to capture three measurements per root - from the proximal, mid and distal sections. An average of the three ADC readings is computed and the output is fed via the parallel output to light the LED array, as shown in Figure 10. To improve accuracy, an average of measurement from six sections or more per root may be taken. In effect, this protocol also eliminates the need for a standard proximal-mid-distal reference, although it increases the time required to arrive at a starch content estimate.
FIGURE 10
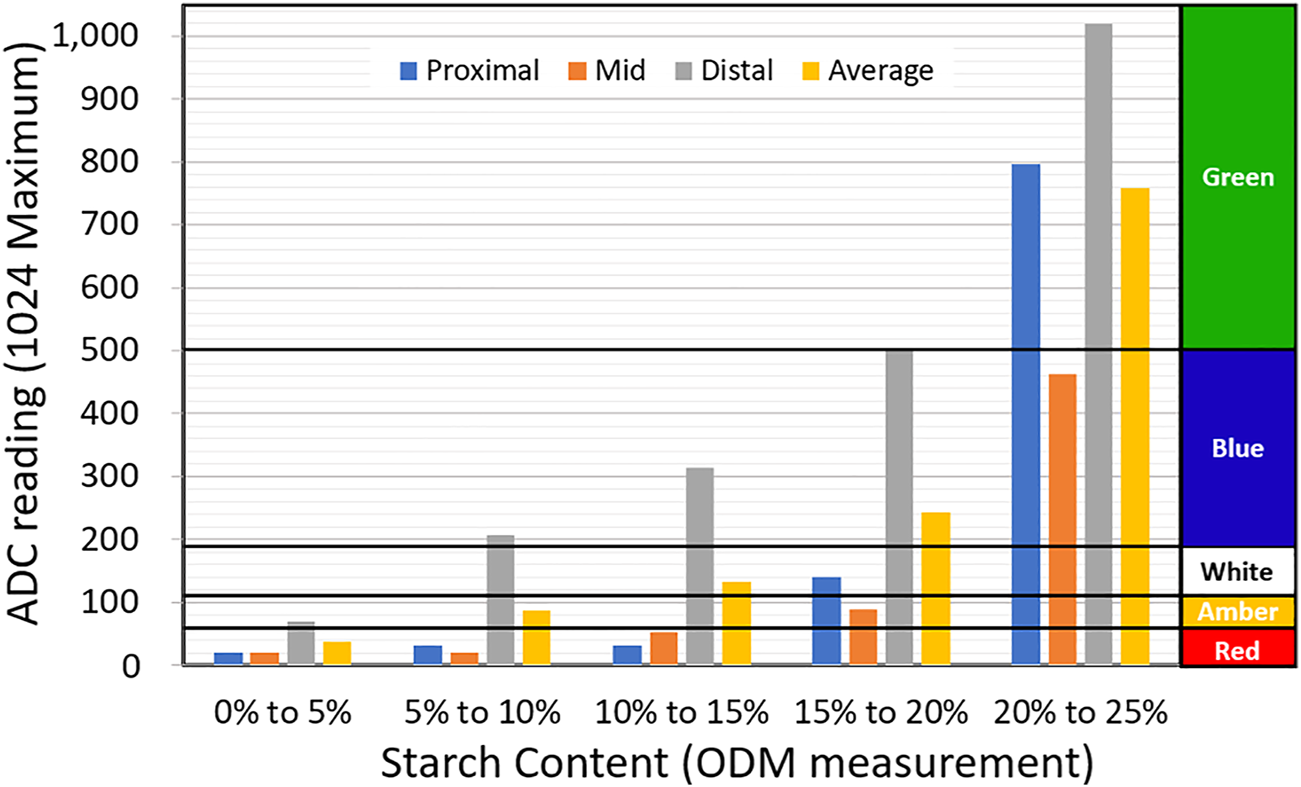
Experimental results for the prototype test instrument, with LED thresholds set using the average of measurement from proximal, mid and distal sections.
6.3 Measurement of the average starch content from a large batch of samples
In an industrial or commercial context, it is very important to be able to estimate, rapidly, the average starch content of a large batch of cassava. To get such an estimate, the test instrument may be programmed to log measurements from a selection that is considered representative of the entire batch, and thereafter report an average. The selection of a representative set of roots for estimation of the overall batch is also in agreement with the current industry standard which is widely based on RSG measurements, and may therefore be considered adequate. An alternative protocol is to test a compacted, homogenized sample of the roots selected for testing. The homogenized test sample may be prepared by peeling, grating, mixing and compacting, before probing. The pre-test processing to achieve homogenization will lead to some loss of moisture, and this must be taken into account in standardizing this protocol.
7 Conclusion
A clear relationship between the starch content of cassava roots and the measured return loss of root samples at a specific frequency of 30 MHz has been demonstrated. A simple, low-cost, test instrument was designed to allow the measurement of cassava root sample return loss in the field using a coaxial probe. For simple classification, the test instrument displays starch content in five categories, from “low” to “high” using an array of five LEDs. The performance of the test instrument was experimentally verified and a reliable correlation between root starch content of between 0 and 25% and LED indication was demonstrated. The root slice position and location of the probe insertion point within the slice were shown to be important considerations in obtaining consistent measurements. The low cost, portability and simplicity of use of the instrument make it highly suitable for use by farmers in developing countries to determine the quality of cassava crops in the field. The device can be readily provisioned as an IoT device by adding low-power wireless-connection peripherals to transmit measurements captured from the device directly to a cloud platform enabling a real-time connection between key stakeholders in the cassava value chain. Furthermore, the starch measurement device is expected to deliver a major impact in cassava HTP studies. Coupling the non-destructive starch estimation method in this report with non-destructive ground-penetrating radar (GPR), currently being tested to monitor biomass of root crops such as cassava during the crop growing season (Agbona et al., 2021) will be a game-changer in terms of predicting dry-root yield at scale.
Statements
Data availability statement
The raw data supporting the conclusion of this article will be made available by the authors, without undue reservation.
Author contributions
TO: hypothesis formulation, experiment design. TO, CP, ID, and IR: data collection, field study and writing of the manuscript. TO and CP: data analysis. CP, TO, and ID: device design and calibration. ID and TO: funding acquisition and project administration. All authors contributed to the article and approved the submitted version.
Funding
This work was funded by the UCL Global Challenges Research Fund (GCRF) under the Agri-tech for Sustainable Development: Crop Quality Evaluation and Prediction based on RF/Microwave Properties (ASPIRE) project the award reference is EP/S51603X/1 (EPSRC).
Acknowledgments
Contributions of Gideon Oyebode (IITA), Xinyue Liu (UCL) and Amany Kassem (UCL) towards the data collection; data analysis and device design, respectively are acknowledged. The support of Chin-Pang Liu (UCL), Scott Martin (UCL), Gerald McBrearty(UCL) and Andy Moss(UCL), in the design and fabrication of the prototype device is also acknowledged.
Conflict of interest
The authors declare that the research was conducted in the absence of any commercial or financial relationships that could be construed as a potential conflict of interest.
Publisher’s note
All claims expressed in this article are solely those of the authors and do not necessarily represent those of their affiliated organizations, or those of the publisher, the editors and the reviewers. Any product that may be evaluated in this article, or claim that may be made by its manufacturer, is not guaranteed or endorsed by the publisher.
References
1
Agbona A. Teare B. Ruiz-Guzman H. Dobreva I. D. Everett M. E. Adams T. et al (2021). Prediction of root biomass in cassava based on ground penetrating radar phenomics. Remote Sens.13, 4908. 10.3390/rs13234908
2
Ajibola O. O. (1985). Moisture dependence of some electrical and dielectric properties of cassava. J. Sci. Food Agric.36, 359–366. 10.1002/jsfa.2740360508
3
Analog Devices (1999). CMOS, 125 MHz complete DDS synthesizer. AD9850.). Norwood, Massachusetts: Analog Devices Inc.
4
Bauchot A. D. Harker F. R. Arnold W. M. (2000). The use of electrical impedance spectroscopy to assess the physiological condition of kiwifruit. Postharvest Biol. Technol.18, 9–18. 10.1016/s0925-5214(99)00056-3
5
Bergo P. Moraes I. C. F. Sobral P. J. d. A. (2012). Effects of moisture content on structural and dielectric properties of cassava starch films. Starch/Starke.64, 835–839. 10.1002/star.201200023
6
Cheo A. E. Tapiwa K. A. (2021). SDG2-zero hunger: Food security, improved nutrition and sustainable agriculture. Emerald Group Publishing
7
Figueiredo P. G. Moraes-Dallaqua M. A. d. Bicudo S. J. Tanamati F. Y. (2013). Starch accumulation in cassava roots: Spatial and temporal distribution. Afr. J. Agric. Res.8 (46), 5712–5715. 10.5897/AJAR2013.7144
8
Fukuda W. Guevara C. Kawuki R. Ferguson M. (2010). Selected morphological and agronomic descriptors for the characterization of cassava. Ibadan, Nigeria: International Institute of Tropical Agriculture (IITA).
9
Grossi M. Riccò B. (2017). Electrical impedance spectroscopy (eis) for biological analysis and food characterization: A review. J. Sens. Sens. Syst.6, 303–325. 10.5194/jsss-6-303-2017
10
Guo W.-c. Nelson S. O. Trabelsi S. Kays S. J. (2007). 10–1800-mhz dielectric properties of fresh apples during storage. J. Food Eng.83, 562–569. 10.1016/j.jfoodeng.2007.04.009
11
Haase N. U. (2003). Estimation of dry matter and starch concentration in potatoes by determination of under-water weight and near infrared spectroscopy. Potato Res.46, 117–127. 10.1007/BF02736081
12
Harker F. R. Maindonald J. H. (1994). Ripening of nectarine fruit (changes in the cell wall, vacuole, and membranes detected using electrical impedance measurements). Plant Physiol.106, 165–171. 10.1104/pp.106.1.165
13
Harnsoongnoen S. Siritaratiwat A. (2015). Electrical and absorption properties of fresh cassava tubers and cassava starch. J. Instrum.10, P09004. 10.1088/1748-0221/10/09/P09004
14
Hershberger J. Mbanjo E. G. N. Peteti P. Ikpan A. Ogunpaimo K. Nafiu K. et al (2022). Low-cost, handheld near-infrared spectroscopy for root dry matter content prediction in cassava. Plant Phenome J.5, e20040. 10.1002/ppj2.20040
15
Heuzé V. Tran G. Archimede H. Regnier C. Bastianelli D. Lebas F. (2016). Cassava peels, cassava pomace and other cassava by-products. Feedepedia.
16
Howeler R. Lutaladio N. Thomas G. (2013). Save and grow: Cassava. A guide to sustainable production intensification. Rome, Italy: Food and Agriculture Organization of the United Nations (FAO).
17
Ikeogu U. N. Davrieux F. Dufour D. Ceballos H. Egesi C. N. Jannink J.-L. (2017). Rapid analyses of dry matter content and carotenoids in fresh cassava roots using a portable visible and near infrared spectrometer (vis/nirs). PloS one12, e0188918. 10.1371/journal.pone.0188918
18
Lizhi H. Toyoda K. Ihara I. (2008). Dielectric properties of edible oils and fatty acids as a function of frequency, temperature, moisture and composition. J. Food Eng.88, 151–158. 10.1016/j.jfoodeng.2007.12.035
19
Mabrook M. Petty M. (2003). Effect of composition on the electrical conductance of milk. J. food Eng.60, 321–325. 10.1016/s0260-8774(03)00054-2
20
Marcone M. F. Wang S. Albabish W. Nie S. Somnarain D. Hill A. (2013). Diverse food-based applications of nuclear magnetic resonance (nmr) technology. Food Res. Int.51, 729–747. 10.1016/j.foodres.2012.12.046
21
Mehdi R. Lamm C. E. Bodampalli Anjanappa R. Müdsam C. Saeed M. Klima J. et al (2019). Symplasmic phloem unloading and radial post-phloem transport via vascular rays in tuberous roots of manihot esculenta. J. Exp. Bot.70, 5559–5573. 10.1093/jxb/erz297
22
Mollier L. Seyler F. Chotte J. L. Ringler C. (2017). End hunger, achieve food security and improved nutrition and promote sustainable agriculture: SDG 2. A guide to SDG interactions: From science to implementation. Paris, France: ICSU.
23
Moura L. Darwazeh I. (2005). Introduction to linear circuit analysis and modelling: From DC to RF. Burlington, MA: Elsevier.
24
Nelson S. Bartley P. Jr (2000). Measuring frequency-and temperature-dependent dielectric properties of food materials. Trans. ASAE43, 1733–1736. 10.13031/2013.3075
25
Nelson S. O. (2005). Dielectric spectroscopy of fresh fruits and vegetables. IEEE Instrumentationand Meas. Technol. Conf. Proc. (IEEE)1, 360–364.
26
Nernst W. (1894). Methode zur bestimmung von dielektrizitätskonstanten. Z. für Phys. Chem.14, 622–663. 10.1515/zpch-1894-1445
27
Odedeyi T. Poole C. Liu X. Kassem A. Oyebode G. Ismail R. et al (2020). “A low-cost instrument for estimating the starch content of cassava roots based on the measurement of rf return loss,” in 2020 IEEE International Symposium on Circuits and Systems (ISCAS) (IEEE).
28
Onwueme I. (1978). The tropical tuber crops: Yams, cassava, sweet potato, and cocoyams. Chicester, UK: John Wiley & Sons.
29
Ozaki Y. McClure W. F. Christy A. A. (2006). Near-infrared spectroscopy in food science and technology. Hoboken, NJ: Wiley Online Library.
30
Poole C. Darwazeh I. (2015). Microwave active circuit analysis and design. London, United Kingdom: Elsevier Science.
31
Pozar D. M. (2011). Microwave engineering. Hoboken, NJ: John Wiley & Sons.
32
Prakash A. (2008). Cassava: International market profile. Background paper for the competitive commercial agriculture in sub-saharan Africa (CCAA) study. Rome: Trade and Markets Division: Food and Agriculture Organisation FAO.
33
Cheo, A. E., & Tapiwa, K. A. (2021). SDG2-Zero Hunger: Food Security, Improved Nutrition and Sustainable Agriculture. Emerald Group Publishing.
34
Teye E. Asare A. Amoah R. Tetteh J. (2011). Determination of the dry matter content of cassava (manihot esculenta, crantz) tubers using specific gravity method. ARPN J. Agric. Biol. Sci.6, 23–28.
35
United Nations (2019). World population prospects 2019: Highlights. New York: Department of Economic and Social Affairs, Population Division.
36
Van Alfen N. K. (2014). Encyclopedia of agriculture and food systems. London, United Kingdom: Elsevier.
37
Wheatley C. Chuzel G. Zakhia N. (2003). “Cassava— the nature of the tuber,” in Encyclopedia of food science, and food technology and nutrition (San Diego: Academic Press), 734–743.
38
Wholey D. W. Booth R. H. (1979). A comparison of simple methods for estimating starch content of cassava roots. J. Sci. Food Agric.30, 158–164. 10.1002/jsfa.2740300210
39
Williams P. Norris K. (1987). Near-infrared technology in the agricultural and food industries. St. Paul, MN: American Association of Cereal Chemists, Inc.
40
Yang L. Li Y. Erf G. F. (2004). Interdigitated array microelectrode-based electrochemical impedance immunosensor for detection of escherichia c oli o157: H7. Anal. Chem.76, 1107–1113. 10.1021/ac0352575
Summary
Keywords
crop quality, electrical impedance spectroscopy, return loss, test instrument design, high throughput phenotyping (HTP), cassava (Manihot esculenta (L.) crantz)
Citation
Odedeyi T, Rabbi I, Poole C and Darwazeh I (2022) Estimation of starch content in cassava based on coefficient of reflection measurement. Front. Food. Sci. Technol. 2:878023. doi: 10.3389/frfst.2022.878023
Received
17 February 2022
Accepted
22 August 2022
Published
28 September 2022
Volume
2 - 2022
Edited by
José S. Câmara, Universidade da Madeira, Portugal
Reviewed by
Douglas Barbin, State University of Campinas, Brazil
Michael Gomez Selvaraj, Consultative Group on International Agricultural Research (CGIAR), United States
Updates
Copyright
© 2022 Odedeyi, Rabbi, Poole and Darwazeh.
This is an open-access article distributed under the terms of the Creative Commons Attribution License (CC BY). The use, distribution or reproduction in other forums is permitted, provided the original author(s) and the copyright owner(s) are credited and that the original publication in this journal is cited, in accordance with accepted academic practice. No use, distribution or reproduction is permitted which does not comply with these terms.
*Correspondence: Temitope Odedeyi, t.odedeyi@ucl.ac.uk
This article was submitted to Food Characterization, a section of the journal Frontiers in Food Science and Technology
Disclaimer
All claims expressed in this article are solely those of the authors and do not necessarily represent those of their affiliated organizations, or those of the publisher, the editors and the reviewers. Any product that may be evaluated in this article or claim that may be made by its manufacturer is not guaranteed or endorsed by the publisher.