Abstract
Cost-effective techniques are usually recommended in the dissemination and adoption of postharvest processing technologies of food products. Due to limited value addition practices for cowpea leaf, the Fruits and Vegetables for All Seasons Project undertook a study to bridge the gap in the seasonal availability of the vegetable in the arid and semi-arid lands (ASALs) of Kenya through the production of cowpea leaf soup mix. However, the adoption of these techniques has an economic perspective that guides decision-making. This study utilized a two-stage linear programming methodology using NutriSurvey and the analytic hierarchy process in a seven-step hierarchy for the production of a cowpea leaf soup mix of an optimal nutrition and sensory quality. The optimal inclusion level of cowpea leaves into the soup mix was 49%. With an R2 of 61.36%, consistency, taste, and mouthfeel were the greatest determinants of the acceptability of cowpea leaf soup mixes. The incorporation of blanching in solar drying and sun drying were the least costly options with priority vectors of 0.08 and 0.09 (CR < 0.1) respectively, whereas, in the use of mechanized processing techniques such as oven drying, priority vectors of 0.10–0.19 had higher maximum benefits than the local processing technique of sun-drying that had a priority vector of 0.08 (CR < 0.1). The benefit-cost ratio was maximal without extrusion, with the solar-drying pathway having the highest benefit-cost ratio of 1.5. The study found that resource-intensive pathways yielded maximum benefits in the retention of quality. However, with the exclusion of extrusion, the benefit-cost ratio of the processes improved.
1 Introduction
Cost-effective strategies have proven the most successful in attaining food and nutrition security among vulnerable populations (Bizikova et al., 2017; Pearson-Stuttard et al., 2018). Due to sub-optimal nutrition, low-income households have disproportionately higher incidences of nutrition-related health burdens (Mozaffarian et al., 2018). Diet diversification and food fortification programs are some of the recommended nutrition interventions being undertaken in resource-constrained sub-Saharan African (SSA) countries. Ongoing effort promoting such techniques is due to their cost effectiveness. Additionally, five case scenarios are recommended when addressing vulnerability to food and nutrition insecurity: (1) increase food production; (2) reduce on-farm losses; (3) achieve optimal yields; (4) reduce postharvest losses; (5) reduce alternative uses of food such as in-production of animal feed and biofuels (Denkenberger and Pearce, 2016). The recommended case scenarios differ in adaptability due to their cost implications. Moreover, the ever-increasing global demand for food has further increased the demand for appropriate interventions that would deliver food of the right quality and quantity (Amit et al., 2017).
Value addition techniques are co-opted in food systems to address postharvest losses and improve quality and, thus, the acceptability of produce (Njoroge et al., 2016). Economic evaluation of these techniques can guide decision-making towards the adoption of initiatives aimed at addressing the existent challenges while minimizing costs (WHO, 2011). Through the Choosing Interventions that are Cost-Effective (CHOICE) project, the World Health Organization promotes the utilization of initiatives with maximum outcomes per unit cost (WHO, FAO, 2006). The processing of cowpea leaves can utilize multiple pathways with varied levels of nutrient retention and cost-implications (Ddungu et al., 2015; Okello et al., 2015; Owade et al., 2020); there is, however, a need to economically evaluate the recommended pathways to realize the targeted benefits. Analytic hierarchy process (AHP) is a multi-criteria decision analysis (MCDA) used by decision-makers, from small-scale processors to policy-makers, in solving complex decisions and problems (Babalola, 2020). MCDA incorporates competing goals and outputs that are important to decision-making: in the processing of cowpea leaves, optimal nutritional quality vis-à-vis processing costs are taken into consideration. Vaidya and Kumar (2006) document that, in selecting the best processing pathway for powdered milk, a hierarchy development that considers the weight of vectors in quantitative terms is the best method. This tool presents a prioritization approach that best guides the optimal economic choice. The current study deployed the AHP decision-making approach in documenting the best pathway to address the challenges of limited value-addition of cowpea leaves. This study focuses on cowpea leaf soup mixes, an output generated from value-addition studies undertaken by the Fruits and Vegetables for All Seasons Project (FruVaSe) at the University of Nairobi, Kenya. It provides a case for evaluating the of costs and benefits for decision-making in food processing initiatives for neglected crops.
2 Material and methods
2.1 Conceptual framework
The conceptual framework of the study is as summarized in Figure 1. A two-stage methodology of nutrient and cost optimization was conducted. The input variables for nutrient optimization were the zinc, iron, and beta carotene composition of raw ingredient cowpea leaves, coriander leaves, tomato, onion, garlic, salt and oil, with the response variable being the consumer acceptability of the product. The second stage entailed the processing of the optimized ratios of ingredients using different techniques and evaluating a combination of criteria to make a benefit-cost decision for the production of cowpea leaf soup mix.
FIGURE 1
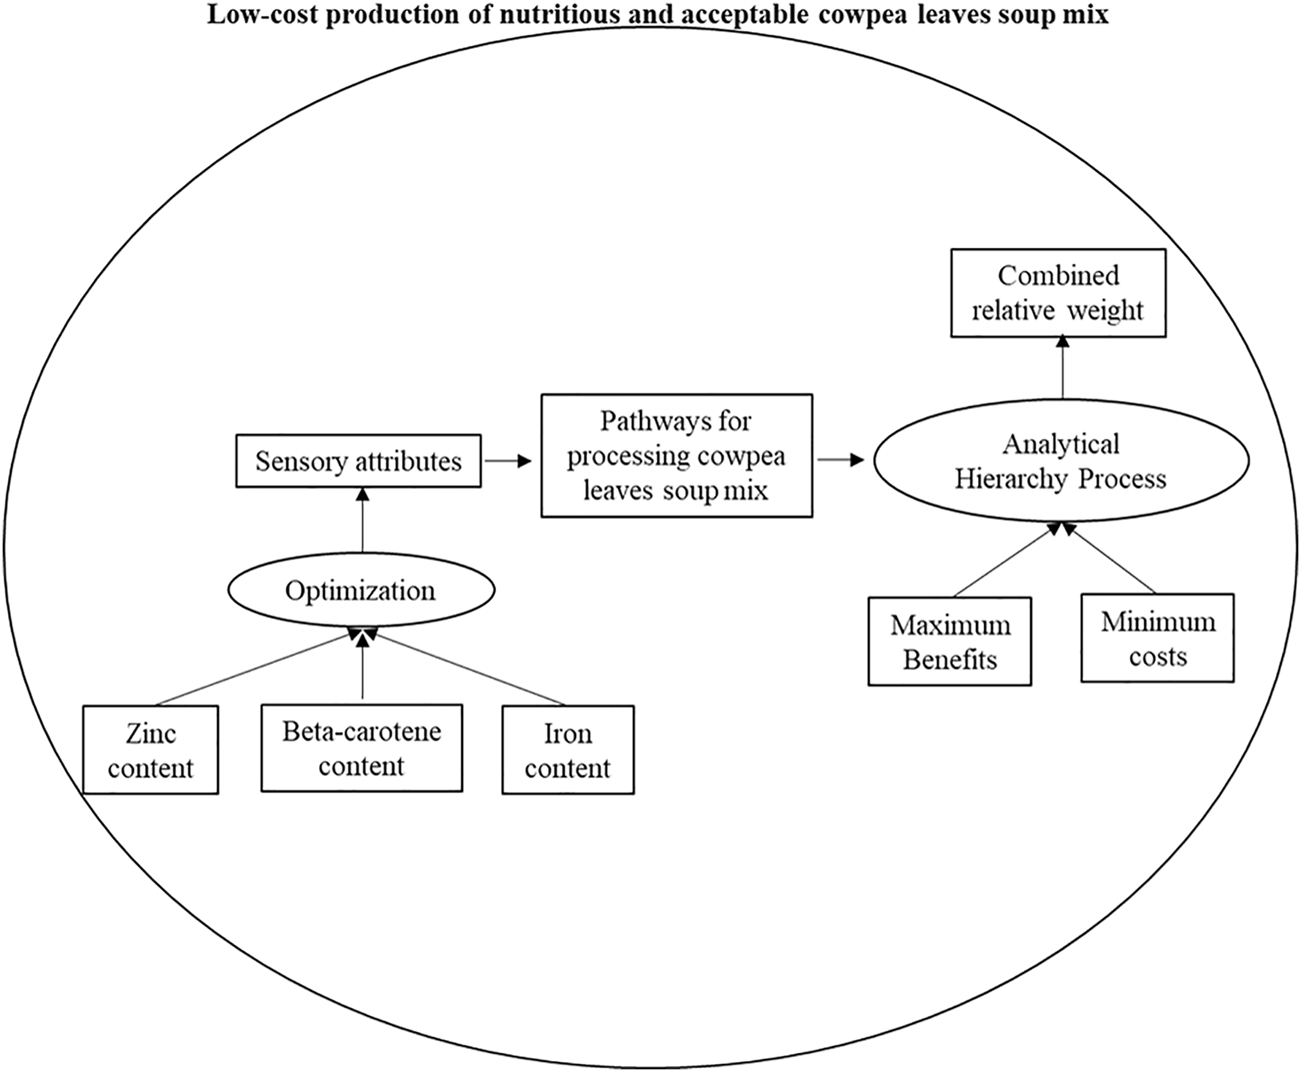
Conceptual framework of the study.
2.2 Optimization of formulations for cowpea leaves soup mixes
The ingredient formulations of cowpea leaf soup mixes were generated using NutriSurvey software (NutriSurvey, 2007). Seven different formulations of cowpea leaf soup mixes were generated with a targeted nutrient composition (fresh weight) of 0.5 mg/100 g beta-carotene, 4 mg/100 g iron, and 2 mg/100 g zinc in order to meet the minimum set threshold for product fortification (Johnson et al., 2004; Low and Jaarsveld, 2008). These levels meet the recommended dietary allowance (RDA) of various segments of the population as the product is targeted at general household consumption.
Sensory analysis of the cooked formulations was performed in order to establish the most optimal product formulation based on consumer acceptability. An untrained sensory panel of 32 respondents from Kilifi County, Kenya were consumers of cowpea leaf products. Ethical review of the study was conducted by the institutional (University of Nairobi) review board. The panellists were aged between 20 and 50 years, with females comprising 43.75% and males 56.25%. The formulated soup mixes were first mixed with cold water (ratio of 1:9, respectively) and stirred to form a consistent paste before heating it to the boil for the extruded mix, whereas the non-extruded mixes were boiled for a further five minutes. Each of the seven different formulations of the soup mix was served hot to the panellists in a counter-current sequence for each successive panellist. A nine-point hedonic scale, ranging from 1 ‘dislike extremely’ to 9 ‘like extremely’ was used to assess the attributes of each formulation; the attributes were colour, appearance, mouthfeel, texture/consistency, aroma and overall acceptability. Sensory evaluation was done in a well-lit room, with about 30 ml of soup served hot in a white dish. Once each panellist had sampled one formulation, they cleansed their palate with water before proceeding to the next sampling.
2.3 Analytical hierarchy process
The AHP was undertaken in the seven-step hierarchy recommended by Saaty and Vargas (2012) as shown in Figure 2. The decision-making hierarchy has its basis on relative weights that analyse alternatives (pathways) using pairwise comparison to generate the best-case scenario for cost minimization and maximization of benefits (Babalola, 2020). The priority alternative (pathway/vector) was determined based on the combined relative weights of all criteria and options (Eq. 1).where A is the comparison matrix, W is the priority vector and λmax is the principal eigenvalue.
FIGURE 2
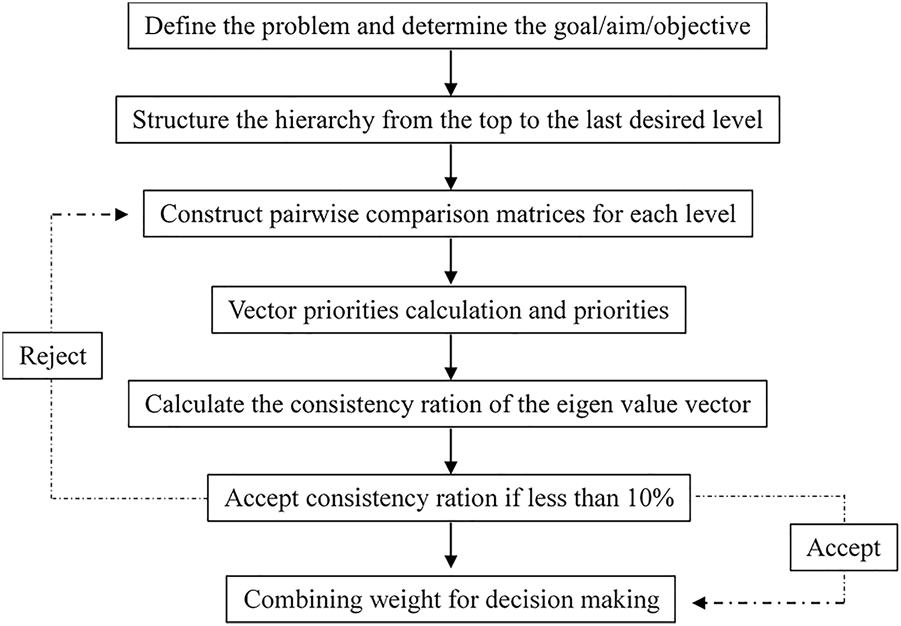
The step-wise analytical hierarchy process. Adapted from Saaty and Vargas (2012).
Each and every decision-making criterion is subjected to evaluation based on consistency ratio (CR, shown in Equation 2 with computation of consistency index as shown in Equation 3) and thus avoids reliance on a single decision.where CI is the consistency index, n is the size of the comparison matrix, and RI is the random consistency index for the nth row generated by random pairwise comparison for a criterion.
Choosing alternative pathways for processing of cowpea leaf soup mix
The most optimal ingredient ratio was adopted for use in the case scenarios for the production of cowpea leaf soup mixes using different process flows. The case scenarios were adopted from a scoping study conducted by Owade et al. (2020) coupled with nutrient retention patterns established by the authors (Owade J, 2021, unpublished data). Seven different scenarios were selected for evaluation in the processing of cowpea leaf soup mix (Figure 3). Optimal fermentation was achieved as per Owade et al. (2021). The initial benefits and costs of each pathway were calculated before being computed into one hierarchy.
FIGURE 3
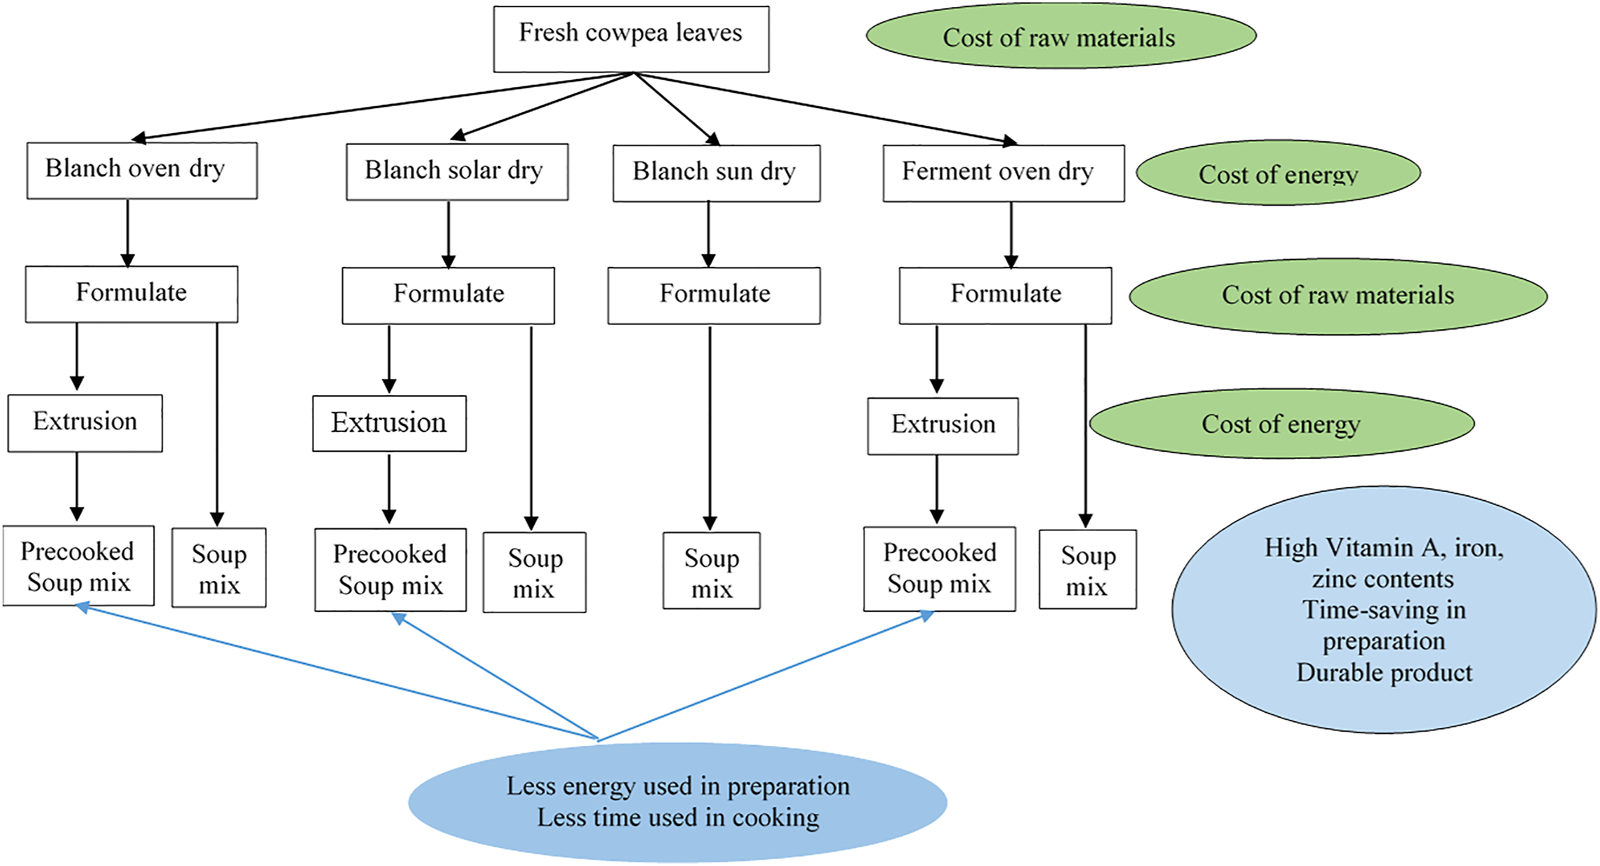
Case-scenarios for the processing of cowpea leaf soup mix.
Step 1:Definition and determination of the goalThis study’s ultimate aim was to achieve the minimum cost in processing cowpea leaf soup mix while maximizing the nutrient retention and consumer acceptability of the product. Higher retention of nutrients due to lower in-process losses during the processing of the cowpea leaves and higher consumer acceptability were used to define the most optimal best practice in the production of cowpea leaf soup mixes.
Step 2:Identification and classification of criterion and alternative/pathwaysThe identified pathways for processing of cowpea leaves were used to inform the objectives of the hierarchy setting. From the seven different pathways identified based on nutrient retention trends (blanching and oven-drying combined with extrusion; blanching and oven drying; blanching and solar-drying combined with extrusion; blanching and solar drying; fermenting and oven-drying combined with extrusion; fermenting and oven-drying; and blanching and sun-drying), a cost analysis was performed for the costs of energy, water, labour, raw material and fixed assets in United States Dollars (USD)—see Figure 4. The derivative benefits were classified into beta-carotene, iron and zinc content, time saved, and overall consumer acceptability (Figure 5), which were obtained from a study by the authors (Owade J, 2021, unpublished data).The cost of production of the soup mix was calculated as shown in Equation 4.The cost analysis of the cowpea leaf soup mixes subjected to various processing techniques was performed by calculating the total variable costs as described by Katanga and Haruna (2015), Equation 5—Table 1. The variable costs incorporated the cost of raw materials, energy and water used and packaging.In calculating the fixed costs of the products, the consumption of fixed capital approach was used as shown in Equation 6 (FAO, 2016).where f(x) is the fixed cost of an asset for the production of a unit of product, denotes the change in the price of a product in a given period of production (in this case, the transformation was done to daily production), D is depreciation and T is the product life.
FIGURE 4
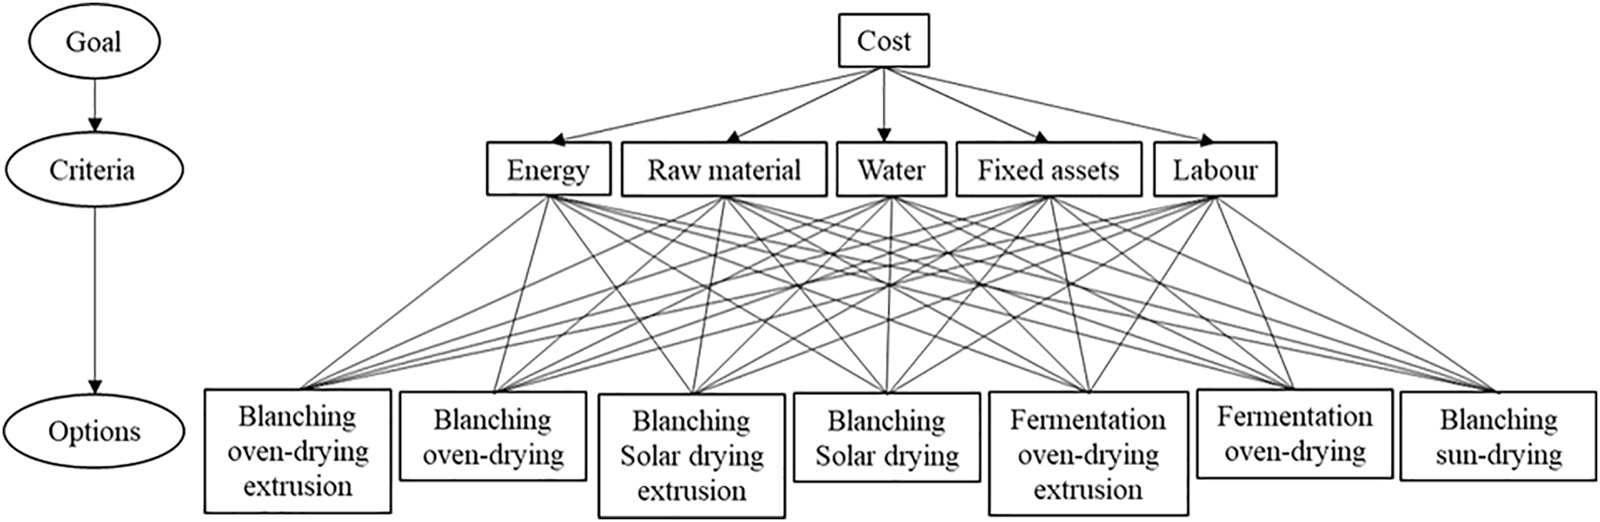
Hierarchy structure for cost analysis.
FIGURE 5
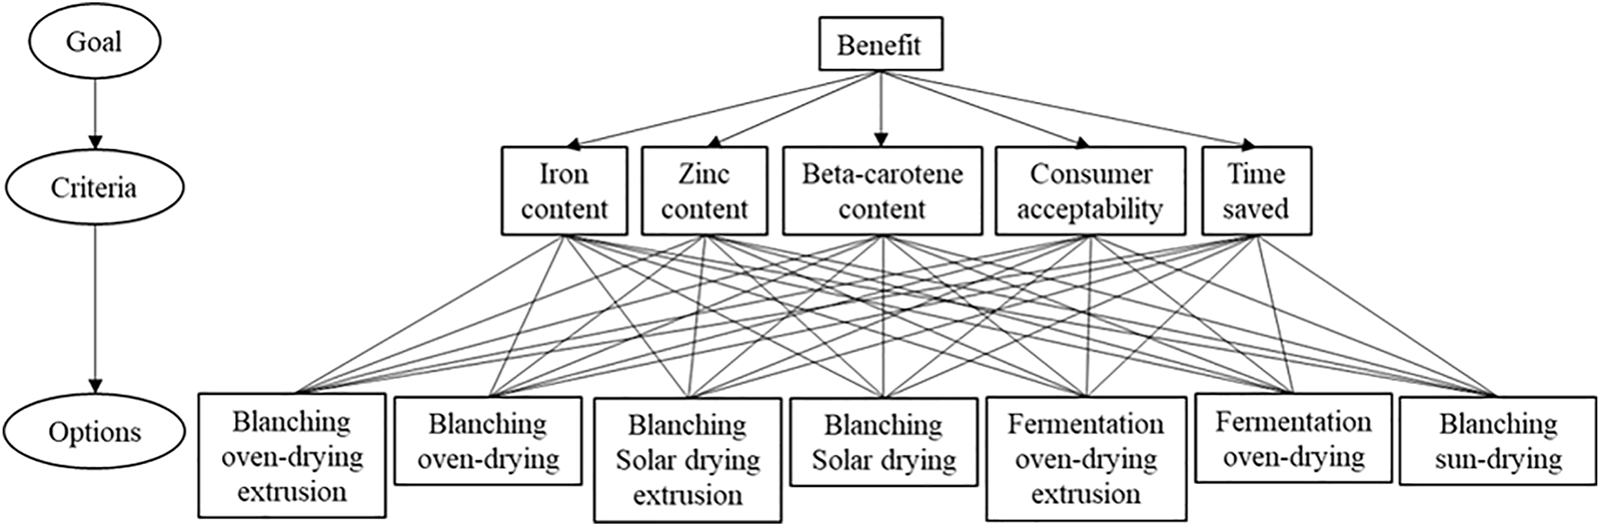
Hierarchy structure of benefits analysis.
TABLE 1
| Cost component | Description |
|---|---|
| Raw materials | Costs calculated from dried cowpea leaf $0.3, Starch $1, Dried coriander $10, Dried onions $25, Dried Garlic $33, Salt $0.3, Tomato $40 and Sugar $1.25 per kg, oil $1.5 per litre and packaging material $0.03 |
| Labour | Daily wage rate of $15 |
| Water | Calculated at $0.64 per m3 |
| Energy | Calculated at $0.15 per kilowatt per hour |
| Fixed costs | Extruder (Emerson Industrial Automation, United Kingdom) at $2000, blender (Krups, Germany) $200, oven drier (Innotech, Australia) at $500, electric cooker (GE Consumer and Industrial, United States) at $660, and solar drier at $2,000 with an assumption of estimated life of 26 years for machinery as per Erumban (2008) |
Description of cost components.
Daily production rate of cowpea leaf for soup mix was set at 10 kg except for sun drying, which was 5 kg.
Step 3:Pairwise comparisonIn ranking the attributes, Saaty’s nine-point rating scale (Table 2) and the concept of ideal alternative recommended by García et al. (2010) were used in the current study in order to overcome the challenges of reliance on the qualitative aspects only. The quantitative ratios were generated for each individual benefit whereas the comparative ranking of the components of the cost was done qualitatively. In ranking the benefits of the products, the quantitative scale established in a study by Petrescu et al. (2020) on processed food products was used whereas the costs were quantitatively ranked on a nine-point scale based on their proportion to the overall production costs.
TABLE 2
| Numeric intensity | Saaty’s pairwise comparison scale |
|---|---|
| 9 | Extremely favoured |
| 8 | Very strongly to extremely |
| 7 | Very strongly favoured |
| 6 | Strongly to very strongly |
| 5 | Strongly |
| 4 | Moderately to strongly |
| 3 | Moderately favoured |
| 2 | Equally to moderately |
| 1 | Equally favoured |
Saaty’s numeric scoring scale.
Adapted from Saaty (1987).
Step 4:Calculation of vector prioritiesThe vector priorities were calculated using the mean of normalized values approach (Ishizaka and Lusti, 2006). Summation of all ratios for the pathways was done as shown in Eq. 7 to compute vector priorities j.where p is the ratio (qualitative or quantitative) of a benefit or cost, i is an alternative ranging from 1 to n and pj is the cumulative mean of the ratios.The values were Normalization as shown in Equation 8.The priority vector for i was therefore determined as shown in Equation 9.
Step 5:Calculation of consistency ratioThe consistency ratio is generated by dividing the consistency index by the random indices (Table 3).
TABLE 3
| n | 3 | 4 | 5 | 6 | 7 | 8 | 9 | 10 | 11 | 12 | 13 | 14 | 15 |
|---|---|---|---|---|---|---|---|---|---|---|---|---|---|
| RI | 0.52 | 0.89 | 1.12 | 1.26 | 1.36 | 1.41 | 1.46 | 1.49 | 1.52 | 1.54 | 1.56 | 1.58 | 1.59 |
Random indices for calculating consistency ratio.
Adapted from Lin et al. (2013).
Step 6:Acceptance of consistency ratioConsistency was defined by CR of less than 0.1 (<10%) as posited by Saaty (Saaty, 1989; Vargas, 1990). If an alternative A has CR greater than 0.1, it is an indication that the matrix falls beyond the tolerance levels and that the ratio scale needs to be checked.
Step 7:Decision makingA benefit-cost ratio was obtained with the maximum being the best pathway for production and the least being the worst case pathway (Ramlan and Qiang, 2014). Sensitivity analysis of the optimal solution was undertaken through variation of the ratios based on the standard deviations of the metrics.
2.4 Statistical analysis
The sensory evaluation data was subjected to analysis using the Agricolae, Caret, Pls and TidyVerse Packages of the R language for computing software (R Core Team, 2019). The sensory data was first subjected to analysis of variance (ANOVA) testing with the panellists as the fixed factor and the samples as the experimental factor to evaluate the mean differences in the scores of the sensory attributes. Means that were statistically different (p < 0.05) were separated using Tukey’s honest significant difference (HSD) test. Principle component analysis was used to generate orthogonal principal components, reduce multi-collinearity in the generated independent variables, and establish the linear model predicting the acceptability of the product. The data was first divided into training (80%) and test (20%) datasets using the Caret package. The training dataset was utilised in generating the principal component regression linear model and the validation of the model done on the test dataset.
Microsoft Office Excel 2013 was used to compute the pairwise comparisons, consistency ratios, priority vectors and the benefit-cost ratios for the AHP. Weighted means were used in the ranking of the benefits and costs, whereas the ratio was used to determine the best benefit-cost computation.
3 Results
3.1 Optimal ingredient formulation of cowpea leaf soup mixes
Seven different formulations of cowpea leaf soup mix were obtained from the nutrient composition optimization study (Table 4). The colour, consistency, taste, mouthfeel and overall acceptability significantly (p < 0.01) differed among the seven different formulations (Table 5). Incorporating cowpea leaf at a proportion of 49% produced the most optimal product. Six principal components explained variation in the sensory attributes. All six sensory parameters had a positive correlation with the overall acceptability of the formulations (Figure 6). Consistency, taste, mouthfeel and overall acceptability had the highest loading in the first principal component (textural properties), as shown in Table 6. The generated linear model explained 57.88% of the variation in the overall acceptability. The first principal component explained 57.36% of the variance in the overall acceptability and a beta-coefficient of 1.59 (Figure 7). Thereby consistency, taste and mouthfeel were the greatest determinants of product acceptability. Validation of the model on the test dataset showed that it accounted for 61.36% of the variation in the acceptability of the soup mixes, with the root mean square error equalling to 0.91.
TABLE 4
| Ingredient | Formulations (% ingredients) | ||||||
|---|---|---|---|---|---|---|---|
| F1 | F2 | F3 | F4 | F5 | F6 | F7 | |
| Corn starch | 22.5 | 22 | 17 | 27 | 12 | 7 | 2 |
| Cowpea leaves | 53.5 | 55 | 60 | 49 | 65 | 70 | 75 |
| Tomato | 7 | 7 | 7 | 7 | 7 | 7 | 7 |
| Onions | 2 | 2 | 2 | 2 | 2 | 2 | 2 |
| Vegetable oil | 4 | 4 | 4 | 4 | 4 | 4 | 4 |
| Coriander | 6 | 6 | 6 | 6 | 6 | 6 | 6 |
| Salt | 3 | 2 | 2 | 3 | 2 | 2 | 2 |
| Garlic | 2 | 2 | 2 | 2 | 2 | 2 | 2 |
Formulation of cowpea leaf soup mixes.
F-formulation.
TABLE 5
| Formulation | Sensory attributes | ||||||
|---|---|---|---|---|---|---|---|
| Colour | Consistency | Taste | Mouthfeel | Aroma | Long-lasting taste | Overall acceptability | |
| F1 | 5.4 ± 1.2ab | 5.9 ± 1.2a | 5.3 ± 1.7ab | 4.9 ± 1.5abc | 5.1 ± 1.6a | 4.7 ± 1.3a | 5.3 ± 1.5a |
| F2 | 5.5 ± 0.9ab | 5.3 ± 1.7ab | 5.3 ± 1.7ab | 5.1 ± 1.5ab | 5.1 ± 1.5a | 4.8 ± 1.5a | 5.2 ± 1.4a |
| F3 | 5.5 ± 1.1ab | 5.2 ± 1.2ab | 5.1 ± 1.3abc | 5.0 ± 1.1abc | 5.0 ± 1.3a | 4.6 ± 1.5a | 4.9 ± 1.4ab |
| F4 | 5.9 ± 0.9a | 5.8 ± 1.2a | 5.5 ± 1.4a | 5.4 ± 1.5a | 5.3 ± 1.5a | 5.1 ± 1.5a | 5.4 ± 1.6a |
| F5 | 5.1 ± 1.4ab | 4.7 ± 1.7bc | 4.0 ± 1.9c | 4.3 ± 1.8bc | 5.0 ± 1.9a | 4.4 ± 1.8a | 4.4 ± 1.6ab |
| F6 | 5.2 ± 1.3ab | 4.6 ± 1.6bc | 4.5 ± 1.7abc | 4.4 ± 1.8abc | 5.1 ± 1.3a | 4.3 ± 1.7a | 4.3 ± 1.4ab |
| F7 | 4.6 ± 1.9b | 3.6 ± 2.2c | 4.2 ± 1.9bc | 3.9 ± 1.8c | 4.7 ± 1.7a | 4.4 ± 1.3a | 4.1 ± 1.9c |
| HSD | 0.89 | 1.12 | 1.16 | 1.1 | 1.1 | 1.0 | 1.1 |
| %CV | 23.3 | 31.0 | 33.1 | 32.7 | 29.1 | 30.7 | 31.5 |
| p-value | 0.003 | <0.001 | <0.001 | <0.001 | 0.81 | 0.226 | <0.001 |
Sensory profile of optimized formulation of cowpea leaf soup mixes.
Values (Mean ± SD) with different letters in the superscript along a column are statistically different at p < 0.05.
FIGURE 6
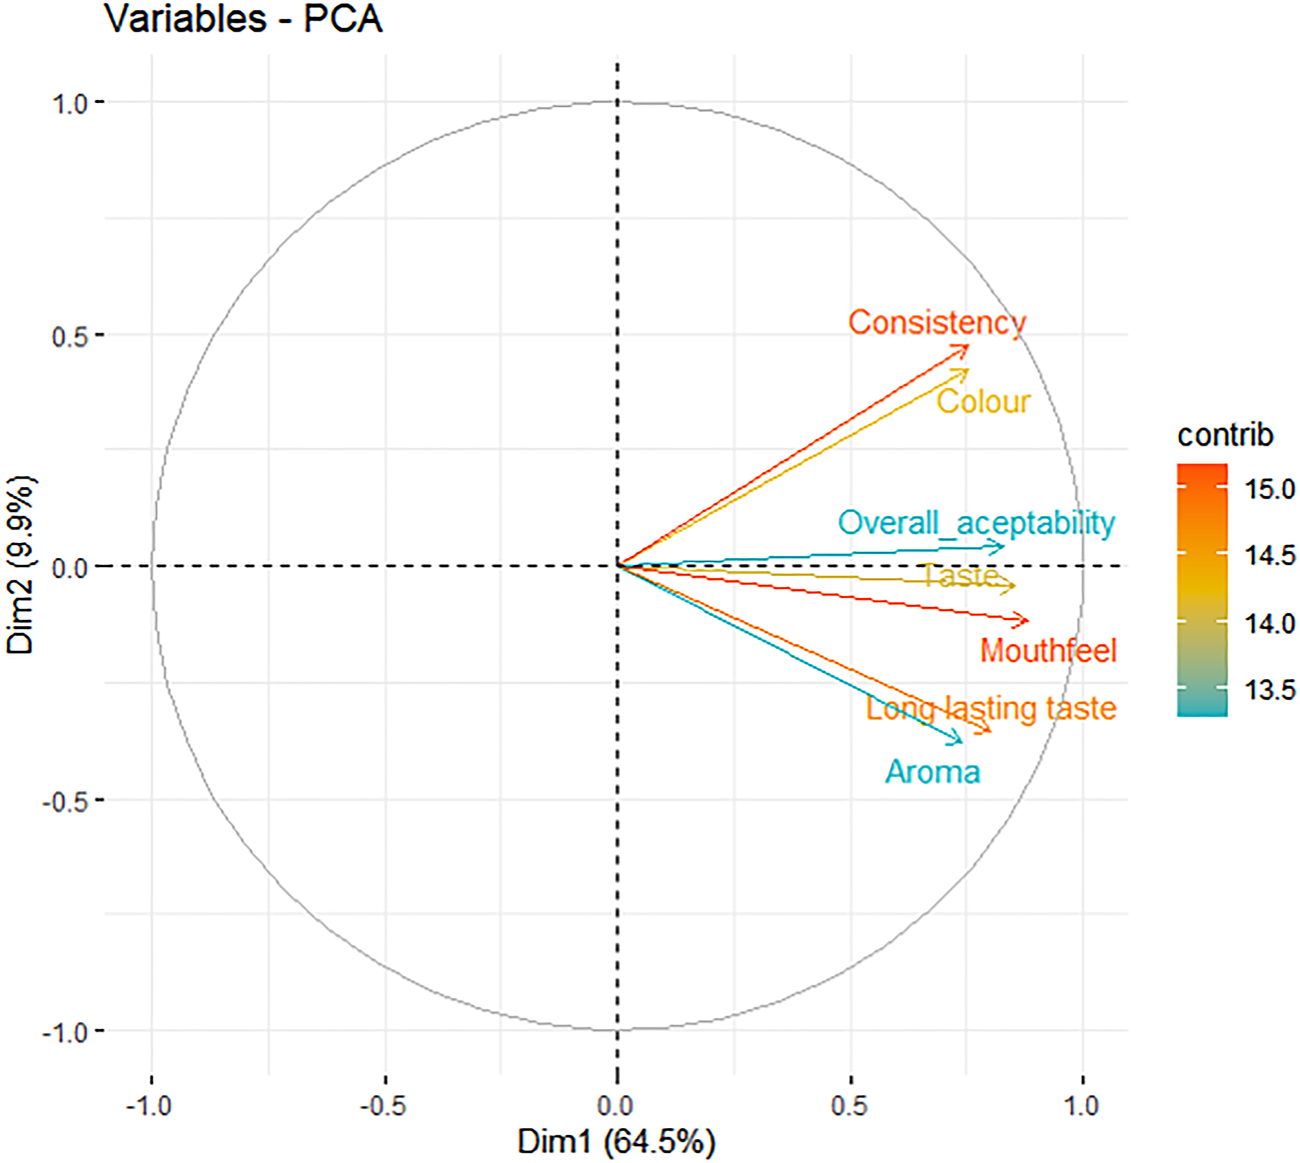
Principal component analysis plot of sensory attributes of formulated cowpea leaf soup mixes. Dim1 and Dim 2 were the first and second principal components classified as textural and aesthetic qualities. Contrib-is the contribution of the variable to the two principal components. The location of the variable closer to the margin of the circle is indicative of good representation of the variable by the two principal components.
TABLE 6
| Sensory attributes | PC1 | PC2 | PC3 | PC4 | PC5 | PC6 | PC7 |
|---|---|---|---|---|---|---|---|
| Colour | 0.28 | 0.26 | 0.17 | 0.40 | 0.25 | 0.78 | 0.02 |
| Consistency | 0.39 | 0.76 | 0.25 | -0.33 | 0.08 | -0.31 | 0.01 |
| Taste | 0.44 | -0.11 | -0.51 | 0.29 | 0.40 | -0.30 | 0.44 |
| Mouthfeel | 0.43 | -0.16 | -0.33 | -0.14 | 0.09 | 0.04 | -0.81 |
| Aroma | 0.33 | -0.43 | 0.72 | 0.26 | 0.12 | -0.30 | -0.08 |
| Long lasting taste | 0.36 | -0.36 | 0.06 | -0.69 | -0.06 | 0.34 | 0.37 |
| Overall acceptability | 0.39 | 0.05 | -0.10 | 0.29 | -0.86 | -0.01 | 0.09 |
Loading of individual sensory attributes of formulated cowpea leaf soup mixes on the seven principal components.
PC-principal Component, the major principal components that were distinctively classified PC1-textural, PC2-aesthetic, PC3-aroma, PC6-colour.
FIGURE 7
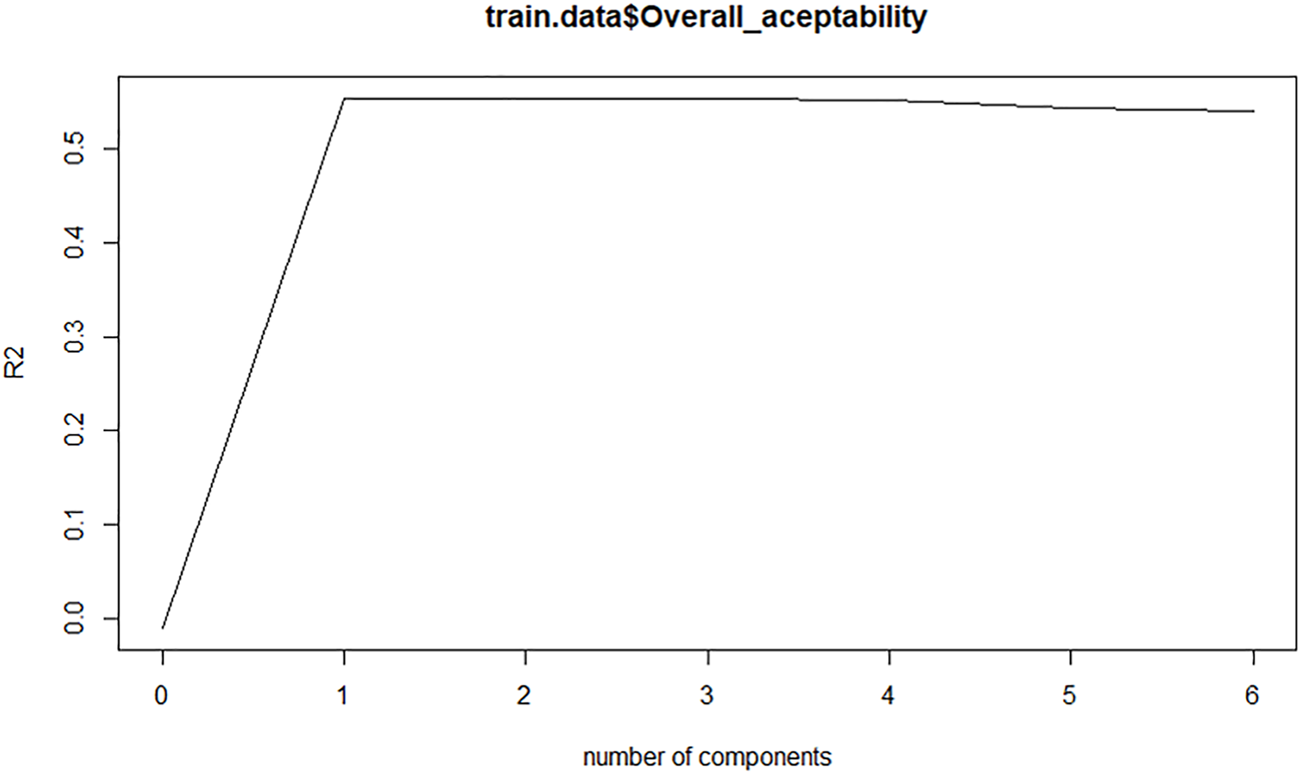
Explained variance of acceptability of cowpea leaf soup mixes by the predictors (principal components). R2 proportion of variance in the dependent variable explained.
3.2 Optimization of cost of production of cowpea leaves soup mixes
3.2.1 Pairwise comparison matrices
The pairwise comparison matrix of the benefits showed that time saved, consumer acceptability and beta carotene content were the most preferred criteria in ranking the benefits with a consistency ratio <0.1 (Table 7). In terms of consumer acceptability and ease of preparation, the pathways showed no major differences in preference. The benefit of high iron, zinc and beta-carotene was maximized in oven-drying techniques (CR < 0.1), see Table 8. The benefits were maximized in blanched oven-drying techniques Table 9.
TABLE 7
| Options | Iron content | Beta carotene content | Zinc content | Consumer acceptability | Time saved | Priority vector |
|---|---|---|---|---|---|---|
| Iron content | 1.00 | 0.71 | 1.00 | 0.65 | 1.06 | 0.17 |
| Beta carotene content | 1.40 | 1.00 | 1.40 | 0.91 | 1.48 | 0.24 |
| Zinc content | 1.00 | 0.71 | 1.00 | 0.65 | 1.06 | 0.17 |
| Consumer acceptability | 1.54 | 1.10 | 1.54 | 1.00 | 1.32 | 0.25 |
| Time saved | 0.94 | 0.67 | 0.94 | 0.76 | 1.00 | 0.17 |
Pairwise comparison of benefits of pathways.
λ max = 5.00, CI = -0.001, CR = -0.0.001.
TABLE 8
| Options | Project | Priority | ||||||
|---|---|---|---|---|---|---|---|---|
| P1 | P2 | P3 | P4 | P5 | P6 | P7 | ||
| Iron content (λmax = 7, CI = -0.0, CR = -0.0.00) | ||||||||
| P1 | 1.00 | 0.59 | 0.85 | 0.76 | 0.49 | 1.30 | 0.92 | 0.11 |
| P2 | 1.71 | 1.00 | 1.46 | 1.29 | 0.83 | 2.23 | 1.57 | 0.19 |
| P3 | 1.17 | 0.69 | 1.00 | 0.89 | 0.57 | 1.53 | 1.08 | 0.13 |
| P4 | 1.32 | 0.77 | 1.13 | 1.00 | 0.65 | 1.72 | 1.21 | 0.15 |
| P5 | 2.05 | 1.20 | 1.74 | 1.55 | 1.00 | 2.67 | 1.88 | 0.22 |
| P6 | 0.77 | 0.45 | 0.65 | 0.58 | 0.37 | 1.00 | 0.70 | 0.08 |
| P7 | 1.09 | 0.64 | 0.93 | 0.83 | 0.53 | 1.42 | 1.00 | 0.12 |
| Beta-carotene content (λmax = 7, CI = -0.0, CR = -0.0.00) | ||||||||
| P1 | 1.00 | 1.71 | 3.56 | 4.49 | 5.86 | 5.50 | 3.21 | 0.36 |
| P2 | 0.58 | 1.00 | 2.08 | 2.63 | 3.43 | 3.22 | 1.88 | 0.21 |
| P3 | 0.28 | 0.48 | 1.00 | 1.26 | 1.65 | 1.54 | 0.90 | 0.10 |
| P4 | 0.22 | 0.38 | 0.79 | 1.00 | 1.30 | 1.22 | 0.71 | 0.08 |
| P5 | 0.17 | 0.29 | 0.61 | 0.77 | 1.00 | 0.94 | 0.55 | 0.06 |
| P6 | 0.18 | 0.31 | 0.65 | 0.82 | 1.07 | 1.00 | 0.58 | 0.07 |
| P7 | 0.31 | 0.53 | 1.11 | 1.40 | 1.83 | 1.71 | 1.00 | 0.11 |
| Zinc content (λmax = 7, CI = -0.0, CR = -0.0.00) | ||||||||
| P1 | 1.00 | 0.69 | 1.02 | 1.13 | 1.23 | 9.09 | 1.65 | 0.17 |
| P2 | 1.46 | 1.00 | 1.49 | 1.65 | 1.79 | 13.26 | 2.40 | 0.25 |
| P3 | 0.98 | 0.67 | 1.00 | 1.10 | 1.20 | 8.90 | 1.61 | 0.17 |
| P4 | 0.89 | 0.61 | 0.91 | 1.00 | 1.09 | 8.06 | 1.46 | 0.15 |
| P5 | 0.81 | 0.56 | 0.83 | 0.92 | 1.00 | 7.41 | 1.34 | 0.14 |
| P6 | 0.11 | 0.08 | 0.11 | 0.12 | 0.14 | 1.00 | 0.18 | 0.02 |
| P7 | 0.61 | 0.42 | 0.62 | 0.68 | 0.74 | 5.52 | 1.00 | 0.10 |
| Consumer acceptability (λmax = 7, CI = -0.0, CR = -0.0.00) | ||||||||
| P1 | 1.00 | 0.83 | 0.90 | 0.91 | 0.95 | 0.81 | 1.13 | 0.16 |
| P2 | 1.21 | 1.00 | 1.10 | 1.11 | 1.15 | 0.98 | 1.37 | 0.13 |
| P3 | 1.11 | 0.91 | 1.00 | 1.01 | 1.05 | 0.90 | 1.25 | 0.16 |
| P4 | 1.09 | 0.90 | 0.99 | 1.00 | 1.04 | 0.89 | 1.24 | 0.13 |
| P5 | 1.05 | 0.87 | 0.95 | 0.96 | 1.00 | 0.85 | 1.19 | 0.16 |
| P6 | 1.23 | 1.02 | 1.11 | 1.13 | 1.17 | 1.00 | 1.40 | 0.13 |
| P7 | 0.88 | 0.73 | 0.80 | 0.81 | 0.84 | 0.72 | 1.00 | 0.13 |
| Time-saved (λmax = 7, CI = -0.0, CR = -0.0.00) | ||||||||
| P1 | 1.00 | 1.25 | 1.00 | 1.25 | 1.00 | 1.25 | 1.25 | 0.16 |
| P2 | 0.80 | 1.00 | 0.80 | 1.00 | 0.80 | 1.00 | 1.00 | 0.13 |
| P3 | 1.00 | 1.25 | 1.00 | 1.25 | 1.00 | 1.25 | 1.25 | 0.16 |
| P4 | 0.80 | 1.00 | 0.80 | 1.00 | 0.80 | 1.00 | 1.00 | 0.13 |
| P5 | 1.00 | 1.25 | 1.00 | 1.25 | 1.00 | 1.25 | 1.25 | 0.16 |
| P6 | 0.80 | 1.00 | 0.80 | 1.00 | 0.80 | 1.00 | 1.00 | 0.13 |
| P7 | 0.80 | 1.00 | 0.80 | 1.00 | 0.80 | 1.00 | 1.00 | 0.13 |
Pairwise comparison for alternatives for each benefit.
P1-blanching and oven-drying combine with extrusion; P2-blanching and oven drying only; P3-blanching and solar-drying combined with extrusion; P4-blanching and solar drying only; P5-fermenting and oven-drying combined with extrusion; P6-fermenting and oven-drying only; and P7-blanching and sun-drying only.
TABLE 9
| Alternatives | Iron content | Beta carotene content | Zinc content | Consumer acceptability | Time saved | Overall priority | Idealized priorities |
|---|---|---|---|---|---|---|---|
| P1 | 0.02 | 0.09 | 0.03 | 0.03 | 0.03 | 0.19 | 1.00 |
| P2 | 0.03 | 0.05 | 0.04 | 0.04 | 0.02 | 0.19 | 0.96 |
| P3 | 0.02 | 0.02 | 0.03 | 0.04 | 0.03 | 0.14 | 0.71 |
| P4 | 0.02 | 0.02 | 0.03 | 0.04 | 0.02 | 0.13 | 0.66 |
| P5 | 0.04 | 0.01 | 0.02 | 0.03 | -0.03 | 0.08 | 0.43 |
| P6 | 0.01 | 0.02 | 0.00 | 0.04 | 0.02 | 0.10 | 0.49 |
| P7 | 0.02 | 0.03 | 0.02 | 0.03 | 0.02 | 0.12 | 0.60 |
Synthesis of benefits for prioritization of pathways.
P1-blanching and oven-drying combine with extrusion; P2-blanching and oven drying only; P3-blanching and solar-drying combined with extrusion; P4-blanching and solar drying only; P5-fermenting and oven-drying combined with extrusion; P6-fermenting and oven-drying only; and P7-blanching and sun-drying only.
As the objective of the cost analysis was to rank the pathways based on their costliness, the ranking rated the pathways from the most to the least costly. The raw material was the most costly component in the processing of the soup mixes (Table 10). The comparison matrix for the cost components had a CR of <0.1; thus, the scales used were consistent (Table 11). The pathway that combined extrusion, fermentation and oven-drying was the most costly (Table 12), with the least costly being to combine blanching and solar drying. Sun and solar drying without extrusion had less than half the costs incurred by the pathway that combined extrusion, fermentation and oven drying (Figure 8).
TABLE 10
| Options | Energy | Water | Raw material | Labour | Fixed costs | Priority vector |
|---|---|---|---|---|---|---|
| Energy | 1.00 | 2.00 | 2.00 | 2.00 | 0.11 | 0.19 |
| Water | 0.50 | 1.00 | 0.25 | 0.33 | 0.26 | 0.05 |
| Raw material | 0.50 | 4.00 | 1.00 | 9.00 | 9.00 | 0.41 |
| Labour | 0.50 | 3.00 | 0.11 | 1.00 | 0.28 | 0.08 |
| Fixed costs | 9.00 | 3.82 | 0.11 | 3.60 | 1.00 | 0.28 |
Pairwise matrix for costs of alternatives.
λ max = 5.00, CI = -0.00, CR = -0.00.
TABLE 11
| Options | Project | Priority | ||||||
|---|---|---|---|---|---|---|---|---|
| P1 | P2 | P3 | P4 | P5 | P6 | P7 | ||
| Cost of raw material (λmax = 7.00, CI = -0.00, CR = -0.0.00) | ||||||||
| P1 | 1.00 | 1.08 | 0.86 | 1.08 | 0.68 | 1.16 | 1.22 | 0.14 |
| P2 | 0.92 | 1.00 | 0.79 | 1.00 | 0.63 | 1.07 | 1.12 | 0.13 |
| P3 | 1.17 | 1.27 | 1.00 | 1.27 | 0.79 | 1.35 | 1.42 | 0.16 |
| P4 | 0.92 | 1.00 | 0.79 | 1.00 | 0.63 | 1.07 | 1.12 | 0.13 |
| P5 | 1.47 | 1.60 | 1.26 | 1.60 | 1.00 | 1.71 | 1.79 | 0.21 |
| P6 | 0.86 | 0.94 | 0.74 | 0.94 | 0.59 | 1.00 | 1.05 | 0.12 |
| P7 | 0.82 | 0.89 | 0.70 | 0.89 | 0.56 | 0.95 | 1.00 | 0.11 |
| Cost of energy (λmax = 7.07, CI = -0.01, CR = -0.0.01) | ||||||||
| P1 | 1.00 | 1.12 | 2.56 | 3.53 | 1.00 | 1.12 | 3.53 | 0.21 |
| P2 | 0.89 | 1.00 | 2.28 | 3.15 | 0.89 | 1.00 | 3.15 | 0.19 |
| P3 | 0.39 | 0.44 | 1.00 | 1.38 | 0.39 | 0.44 | 1.38 | 0.08 |
| P4 | 0.28 | 0.32 | 0.73 | 1.00 | 0.28 | 0.32 | 1.00 | 0.06 |
| P5 | 1.00 | 1.12 | 2.56 | 3.53 | 1.00 | 1.12 | 3.53 | 0.21 |
| P6 | 0.89 | 1.00 | 2.28 | 3.15 | 0.89 | 1.00 | 3.15 | 0.19 |
| P7 | 0.28 | 0.32 | 0.73 | 1.00 | 0.28 | 0.32 | 1.00 | 0.06 |
| Cost of water (λmax = 7.07, CI = -0.008, CR = -0.0.011) | ||||||||
| P1 | 1.00 | 1.32 | 0.96 | 1.33 | 1.14 | 1.11 | 1.00 | 0.16 |
| P2 | 0.76 | 1.00 | 0.77 | 1.00 | 0.66 | 1.15 | 1.12 | 0.13 |
| P3 | 1.04 | 1.30 | 1.00 | 1.38 | 1.18 | 1.16 | 1.05 | 0.16 |
| P4 | 0.75 | 1.00 | 0.72 | 1.00 | 0.86 | 0.84 | 0.76 | 0.12 |
| P5 | 0.88 | 1.52 | 0.84 | 1.17 | 1.00 | 1.75 | 1.70 | 0.17 |
| P6 | 0.90 | 0.87 | 0.86 | 1.19 | 0.57 | 1.00 | 0.90 | 0.12 |
| P7 | 1.00 | 0.89 | 0.96 | 1.32 | 0.59 | 1.11 | 1.00 | 0.14 |
| Cost of labour (λmax = 7.06, CI = -0.009, CR = -0.0.007) | ||||||||
| P1 | 1.00 | 1.67 | 1.00 | 1.67 | 0.83 | 1.00 | 0.83 | 0.15 |
| P2 | 0.60 | 1.00 | 0.57 | 1.00 | 0.65 | 0.44 | 0.34 | 0.08 |
| P3 | 1.00 | 1.76 | 1.00 | 1.76 | 1.15 | 0.77 | 0.59 | 0.15 |
| P4 | 0.60 | 1.00 | 0.57 | 1.00 | 0.50 | 0.60 | 0.50 | 0.09 |
| P5 | 1.20 | 1.53 | 0.87 | 2.00 | 1.00 | 1.20 | 1.00 | 0.17 |
| P6 | 1.00 | 2.28 | 1.30 | 1.67 | 0.83 | 1.00 | 0.77 | 0.16 |
| P7 | 1.20 | 2.96 | 1.68 | 2.00 | 1.00 | 1.30 | 1.00 | 0.20 |
| Cost of fixed assets (λmax = 7.27, CI = -0.045, CR = -0.0.033) | ||||||||
| P1 | 1.00 | 2.47 | 0.69 | 1.17 | 1.00 | 2.47 | 3.91 | 0.19 |
| P2 | 0.40 | 1.00 | 0.28 | 0.48 | 0.40 | 1.00 | 1.58 | 0.08 |
| P3 | 1.45 | 3.57 | 1.00 | 1.70 | 1.45 | 3.57 | 5.65 | 0.27 |
| P4 | 0.85 | 2.10 | 0.59 | 1.00 | 0.85 | 2.10 | 3.33 | 0.16 |
| P5 | 1.00 | 2.47 | 0.69 | 1.17 | 1.00 | 2.47 | 3.91 | 0.19 |
| P6 | 0.40 | 1.00 | 0.28 | 0.48 | 0.40 | 1.00 | 1.58 | 0.08 |
| P7 | 0.26 | 0.63 | 0.18 | 0.30 | 0.26 | 0.63 | 1.00 | 0.05 |
Pairwise comparison matrix of the alternatives for each cost component.
P1-blanching and oven-drying combine with extrusion; P2-blanching and oven drying only; P3-blanching and solar-drying combined with extrusion; P4-blanching and solar drying only; P5-fermenting and oven-drying combined with extrusion; P6-fermenting and oven-drying only; and P7-blanching and sun-drying only.
TABLE 12
| Alternatives | Energy | Water | Raw material | Labour | Fixed costs | Overall priority | Idealized priorities |
|---|---|---|---|---|---|---|---|
| P1 | 0.13 | 0.02 | 0.01 | 0.02 | 0.01 | 0.19 | 0.96 |
| P2 | 0.12 | 0.02 | 0.01 | 0.01 | 0.01 | 0.16 | 0.79 |
| P3 | 0.05 | 0.02 | 0.01 | 0.02 | 0.02 | 0.12 | 0.60 |
| P4 | 0.04 | 0.02 | 0.01 | 0.01 | 0.01 | 0.08 | 0.41 |
| P5 | 0.13 | 0.02 | 0.01 | 0.02 | 0.01 | 0.20 | 1.00 |
| P6 | 0.12 | 0.02 | 0.01 | 0.02 | 0.01 | 0.16 | 0.82 |
| P7 | 0.04 | 0.02 | 0.01 | 0.02 | 0.00 | 0.09 | 0.44 |
Synthesis of the costs for prioritization.
P1-blanching and oven-drying combine with extrusion; P2-blanching and oven drying only; P3-blanching and solar-drying combined with extrusion; P4-blanching and solar drying only; P5-fermenting and oven-drying combined with extrusion; P6-fermenting and oven-drying only; and P7-blanching and sun-drying only.
FIGURE 8
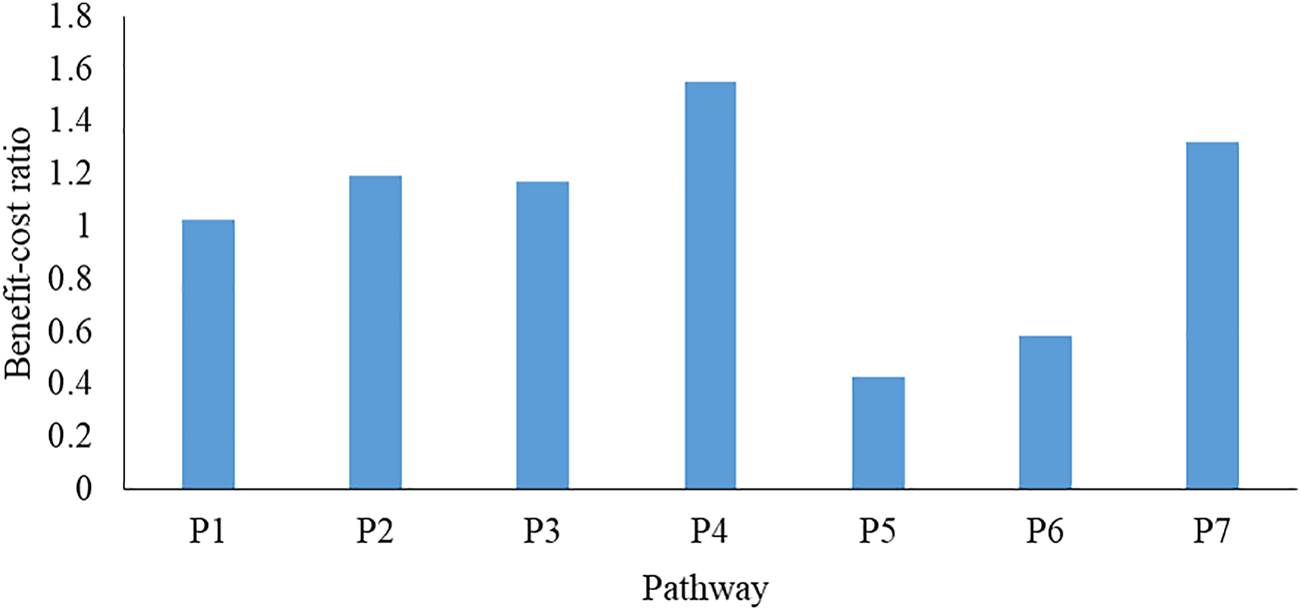
Benefit-cost ratio of pathways for processing cowpea leaf soup mixes. P1-blanching and oven-drying combine with extrusion; P2-blanching and oven drying only; P3-blanching and solar-drying combined with extrusion; P4-blanching and solar drying only; P5-fermenting and oven-drying combined with extrusion; P6-fermenting and oven-drying only; P7-blanching and sun-drying only.
3.2.2 Benefit-cost analysis
The pathway of blanched solar drying was the most cost-efficient, with a benefit-cost ratio of (1.55); the pathway combining fermentation, oven-drying and extrusion was the least cost-efficient with a benefit-cost ratio of 0.4 (Figure 8).
3.2.3 Sensitivity analysis
Sensitivity analysis was undertaken by deviating the mean of an attribute of the costs by its specific standard deviation. In the first case, the deviation of means above the overall mean was done by adding the standard deviation whereas, for those below, the standard deviation was subtracted in order to attain the highest possible variation for the benefit-cost ratio. In the second scenario, the means that were above the overall mean had the standard deviation subtracted from them, whereas those below the standard deviation were added in order to obtain the least possible deviation in the benefit-cost ratio. Scenario A showed an increase in the benefit-cost ratio whereas. in Scenario B, the artisanal techniques showed an increase in the benefit-cost ratio (Figure 9). The pairwise comparison in the two case scenarios attained a CR of <0.1.
FIGURE 9
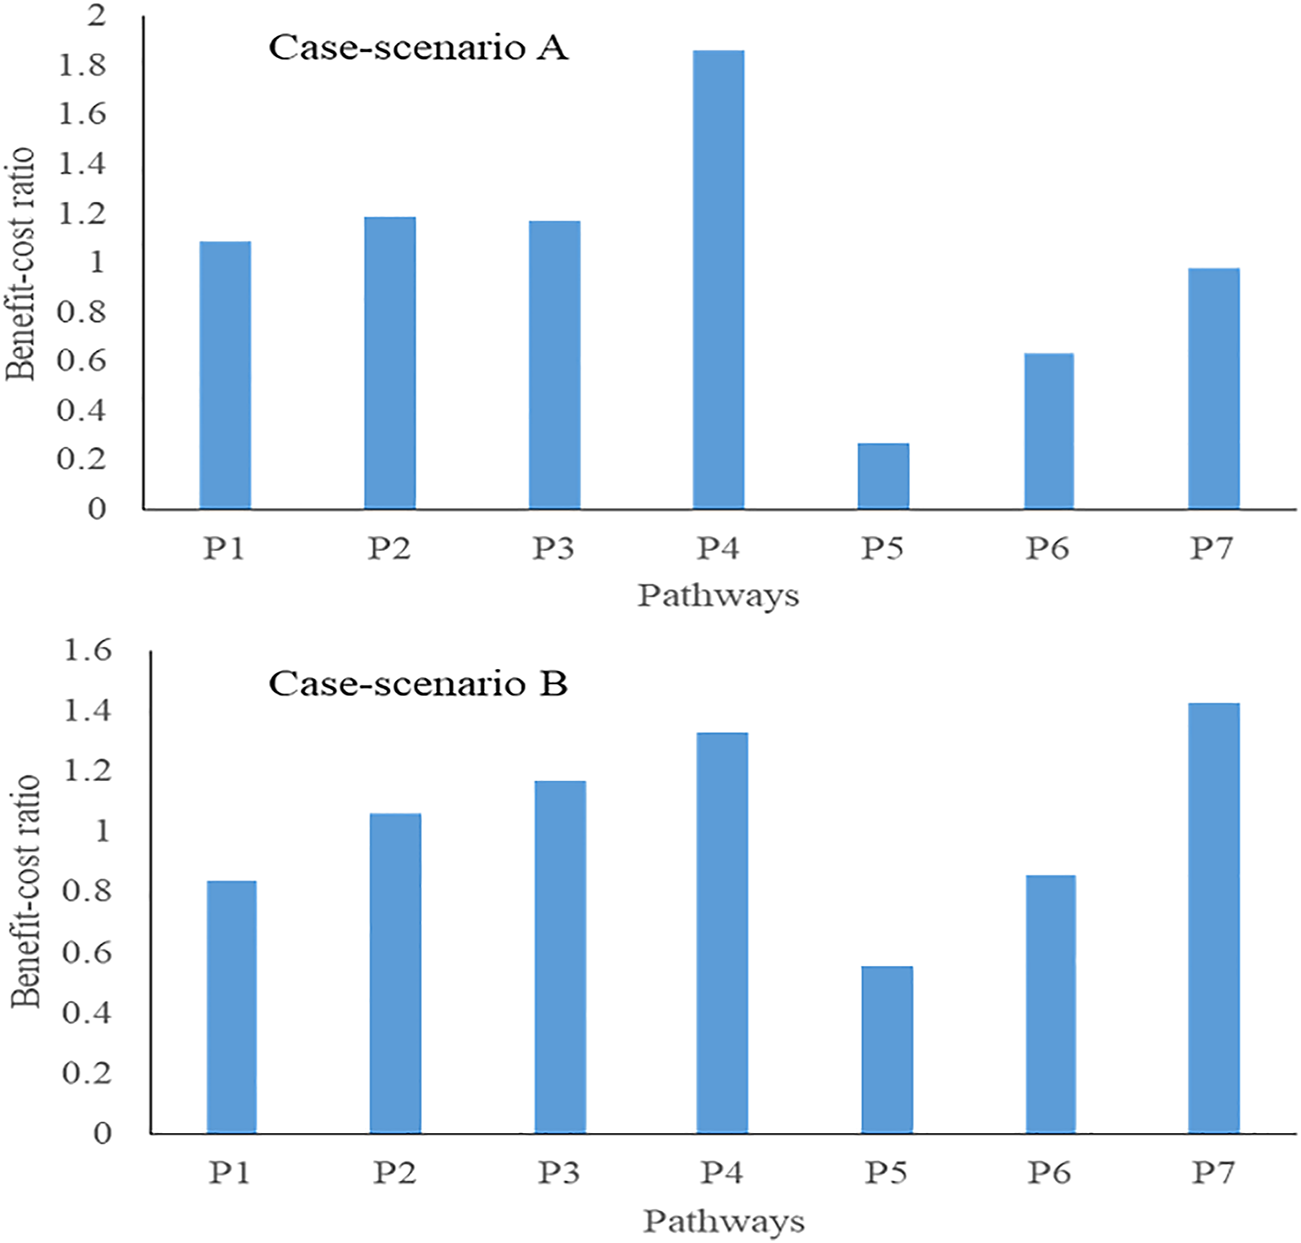
Sensitivity analysis of changes to the benefit-cost ratio. Scenario A, values above the average mean were increased by addition of standard deviation whereas those below the standard deviation were subtracted. In Scenario B, the values above the mean were reduced by subtracting the mean whereas those below the standard deviation were added. P1-blanching and oven-drying combine with extrusion; P2-blanching and oven drying only; P3-blanching and solar-drying combined with extrusion; P4-blanching and solar drying only; P5-fermenting and oven-drying combined with extrusion; P6-fermenting and oven-drying only; and P7-blanching and sun-drying only.
4 Discussion
4.1 Optimization of ingredient formulations
The current findings showed that the optimal level of inclusion of cowpea leaf in the soup mix was 49%, with higher levels reducing consumer acceptability. This is explained by the reduction in consistency which is induced in the product by the addition of starch, a thickening agent (Alcázar-Alay and Meireles, 2015). Starch has an inherent thickening property that improves the product acceptability of soups with increasing proportion (Dhiman et al., 2017); however, this trend has an optimal point beyond which the product acceptability declines (Bothma et al., 2020). In the development of food preferences, textural properties is one of the factors with significant influence (Jeltem et al., 2015). Similarly, the present study established that consistency and mouthfeel—textural properties—influenced the overall consumer acceptability of the soup mixes. Whereas the optimization of the product focused on ameliorating the nutritional quality, the determination of the optimal ingredient formulation level was guided by the acceptability of the product. Optimization studies have been undertaken to balance the functional and sensory properties of the soup to avoid detrimental quality attributes such as limited nutrient availability due to unbalanced ingredients (Manhivi et al., 2020). In mapping the sensory attributes to the consumer acceptability of the soup mixes, this study found that all six attributes were contributors to their acceptance. This implies that the functional properties were subject to the incorporation of cowpea leaf in the soup mixes. The Kenyan and Tanzanian Standards for the soups permit the inclusion of vegetables beyond >40% only if the dominant raw material is stated in the product's labelling (KEBS, 2012; TBS, 2020).
4.2 Minimization approach for the cost of production
The current study undertook a separate evaluation of costs and benefits prior to combining the weights to evaluate the least cost and maximum benefits, as performed in a similar study by Babalola (2020). However, in that study, the concept of the ideal alternative that improves the accuracy of the values was less explored; thus, the consistency ratios obtained for the pairwise matrices were higher (>0.06) than those obtained in our study. The nine-point scaling suffers the demerit of less accuracy of the pairwise matrices due to the use of the qualitative components in the generation of the scales (Benítez et al., 2011). Babalola (2020) established that the least cost pathways did not necessarily attract maximum benefits. Similarly, in the present study, the least cost option was local processing to yield the soup mixes; however, the maximum benefits were realizable using the pathway combining the extrusion, oven-drying and blanching pathways. The benefits were derived as increased consumer acceptability, iron, zinc and beta-carotene contents and ease of preparation whereas, on the other hand, the cost analysis identified which of the seven pathways processing cowpea leaf soup mix was the least cost option.
The incorporation of highly mechanized processing techniques of solar and oven drying improved the benefits derived from the processed product, although it attracted increasing costs too. The emergence of solar-drying, a technique that incorporates the use of renewable energy as the pathway with the maximum cost-benefit ratio, is explained by the minimal variable costs that come with it compared to oven-drying and sun-drying, such as sun-drying attracting higher labour costs and low retention of beta-carotene due to photo-oxidation (Çiftçioğlu et al., 2020; Ndawula et al., 2004). The major demerit of the low-cost artisanal techniques is the low retention of nutrients.
Whereas some of the assumptions made in this study may vary from product to product, especially on the ranking of costs and benefits as revealed by the sensitivity analysis, the study justifies the need for a shift from artisanal food processing techniques to mechanized ones, especially for initiatives that seek to address micronutrient deficiencies in the vulnerable communities. Additionally, in this study, the criteria for both cost and benefits were limited to five within the recommended maximum of seven (Russo and Camanho, 2015); however, in instances where additional criteria would be identified, the final cost-benefit ratio would fluctuate. The need for this limitation was to improve the accuracy of the pairwise comparison matrices that were generated (Ishizaka, 2012). In cases of more than seven levels, Hanine et al. (2016) introduced sub-criteria by creating extra hierarchies in the steps while minimizing the probability of increasing the error in the calculation of weights through a pairwise comparison matrix.
5 Conclusion
The two stage-optimization study achieved the minimal production costs necessary to process cowpea leaf soup mixes rich in micronutrients, which are major limiting nutrients in the diet of most communities in arid and semi-arid lands. Whereas the processing techniques with little demand for mechanization would seem more feasible for adoption among resource-constrained communities, this study proves that mechanized techniques have higher value for money invested than artisanal techniques. Additionally, the study establishes that the low-cost processing pathways provide minimal benefits and thus provide limited advantage in terms of product quality amelioration. It is therefore recommended that a shift from artisanal processing is necessary to realization the maximum benefits from the derived product. In instances where interest would be on health outcomes, including the reduction of micronutrient deficiencies, this study would recommend cost-effectiveness analysis. The approach explored in this study is recommended in evidence-based decision-making about disseminating the processing technologies for cowpea leaf soup mixes and other initiatives in SSAs dealing with orphaned and neglected crops such as the ALVs.
Statements
Data availability statement
The raw data supporting the conclusions of this article will be made available by the authors, without undue reservation.
Author contributions
JO collected the data, conceived and designed the analysis and wrote the manuscript, GA conceived and designed the analysis, contributed to data analysis, supervised and edited the manuscript; MO conceived and designed the analysis, contributed to data analysis, supervised and edited the manuscript; and AM conceived and designed the analysis, and supervised and edited the manuscript.
Funding
This work was financially supported by the German Federal Ministry of Food and Agriculture (BMEL) based on the decision of the Parliament of the Federal Republic of Germany.
Conflict of interest
The authors declare that the research was conducted in the absence of any commercial or financial relationships that could be construed as a potential conflict of interest.
Publisher’s note
All claims expressed in this article are solely those of the authors and do not necessarily represent those of their affiliated organizations, or those of the publisher, the editors and the reviewers. Any product that may be evaluated in this article, or claim that may be made by its manufacturer, is not guaranteed or endorsed by the publisher.
References
1
Alcázar-Alay S. C. Meireles M. A. A. (2015). Physicochemical properties, modifications and applications of starches from different botanical sources. Food Sci. Technol.35, 215–236. 10.1590/1678-457X.6749
2
Amit S. K. Uddin M. M. Rahman R. Islam S. M. R. Khan M. S. (2017). A review on mechanisms and commercial aspects of food preservation and processing. Agric. Food Secur.6, 51. 10.1186/s40066-017-0130-8
3
Babalola M. A. (2020). A benefit-cost analysis of food and biodegradable waste treatment alternatives: the case of Oita City, Japan. Sustainability12, 1916. 10.3390/su12051916
4
Benítez J. Delgado-Galván X. Izquierdo J. Pérez-García R. (2011). Achieving matrix consistency in AHP through linearization. Appl. Math. Model.35, 4449–4457. 10.1016/j.apm.2011.03.013
5
Bizikova L. Jungcurt S. Mcdougal K. Smaller C. (2017). Effective public investments to improve food security. Toronto, CanadaInternational Institute for Sustainable Development.
6
Bothma C. Cronjé N. Koen M. Hugo A. (2020). Product development and consumer acceptability of soup made from Clarias gariepinus. CyTA - J. Food18, 572–579. 10.1080/19476337.2020.1800826
7
Çiftçioğlu G. A. Kadırgan F. Kadırgan M. A. N. Kaynak G. (2020). Smart agriculture through using cost-effective and high-efficiency solar drying. Heliyon6, e03357. 10.1016/j.heliyon.2020.e03357
8
Ddungu S. P. Ekere W. Bisikwa J. Kawooya R. Kalule D. O. Biruma M. et al (2015). Marketing and market integration of cowpea (Vigna unguiculata L. Walp) in Uganda. J. Dev. Agric. Econ.7, 1–11. 10.5897/jdae2014.0577
9
Denkenberger D. C. Pearce J. M. (2016). Cost-effectiveness of interventions for alternate food to address agricultural catastrophes globally. Int. J. Disaster Risk Sci.7, 205–215. 10.1007/s13753-016-0097-2
10
Dhiman A. K. Vidiya N. Surekha A. Preethi R. (2017). Studies on development and storage stability of dehydrated pumpkin based instant soup mix. J. Appl. Nat. Sci.9, 1815–1820. 10.31018/jans.v9i3.1444
11
Erumban A. A. (2008). Lifetimes of machinery and equipment: evidence from Dutch manufacturing. Rev. Income Wealth54, 237–268. 10.1111/j.1475-4991.2008.00272.x
12
FAO (2016). Agricultural cost of production statistics: Guidelines for data collection, compilation and dissemination. Rome, Italy: FAO.
13
García G. M. J. Hernández R. J. G. Hernández G. G. J. (2010). Effect of the use of an ideal alternative in Hierarchical Analytic Processes [English new version] in VII Congress of Research and Intellectual Creation of UNIMET (VII Congreso de Investigación y Creación Intelectual de la UNIMET), Caracas, Venezuela, May, 2010.
14
Hanine M. Boutkhoum O. Tikniouine A. Agouti T. (2016). Application of an integrated multi-criteria decision making AHP-TOPSIS methodology for ETL software selection. Springerplus5, 263. 10.1186/s40064-016-1888-z
15
Ishizaka A. (2012). Clusters and pivots for evaluating a large numberof alternatives in AHP. Pesqui. Oper.32, 87–102. 10.1590/S0101-74382012005000002
16
Ishizaka A. Lusti M. (2006). How to derive priorities in AHP: a comparative study. Cent. Eur. J. Oper. Res.14, 387–400. 10.1007/s10100-006-0012-9
17
Jeltem M. Beckley J. Vahalik J. (2015). Model for understanding consumer textural food choice. Food Sci. Nutr.3, 202–212. 10.1002/fsn3.205
18
Johnson Q. Mannar V. Ranum P. (2004). Fortification handbook: Vitamin and mineral fortification of wheat flour and maize meal. Ontario, Canada: Nutrition International.
19
Katanga Y. N. Haruna U. (2015). Socio-economic analysis of cowpea production in kiyawa local government area of jigawa state. Nigeria3, 150–153.
20
KEBS (2012). Kenya standard: Specification for soups and broths (KS 1088-1: 2001). Nairobi, Kenya: KEBS.
21
Lin C. Kou G. Ergu D. (2013). An improved statistical approach for consistency test in AHP. Ann. Oper. Res.211, 289–299. 10.1007/s10479-013-1413-5
22
Low J. Jaarsveld P. (2008). The potential contribution of bread buns fortified with β - carotene – Rich sweetpotato in Central Mozambique. Food Nutr. Bull.29 (2), 98–107. 10.1177/156482650802900203
23
Manhivi V. E. Sultanbawa Y. Sivakumar D. (2020). Enhancement of the phytonutrient content of a gluten-free soup using a composite of vegetables. Int. J. Food Prop.23, 1051–1065. 10.1080/10942912.2020.1778028
24
Mozaffarian D. Liu J. Sy S. Huang Y. Rehm C. Lee Y. et al (2018). Cost-effectiveness of financial incentives and disincentives for improving food purchases and health through the US supplemental nutrition assistance program (SNAP): A microsimulation study. PLoS Med.15, e1002661. 10.1371/journal.pmed.1002661
25
Ndawula J. Kabasa J. D. Byaruhanga Y. B. (2004). Alterations in fruit and vegetable beta-carotene and vitamin C content caused by open-sun drying, visqueen-covered and polyethylene-covered solar-dryers. Afr. Health Sci.4, 125–130.
26
Njoroge E. W. Matofari J. W. Mulwa R. M. S. Anyango J. O. (2016). Effects of blanching time/temperature combination coupled with solar-drying on the nutritional and microbial quality of indigenous leafy vegetables in Kenya. Afr. J. Food Sci. Technol.6, 209–219. 10.14303/ajfst.2015.068
27
NutriSurvey (2007). Nutrisurvey: Linear programming module [WWW Document]. NutriSurvey. Available at: http://www.nutrisurvey.de/(accessed 3 18, 20).
28
Okello J. Hutchinson M. Mwang’ombe A. Ambuko J. Olubayo F. Mwakangalu M. et al (2015). Consumer demand for value-added products of African indigenous vegetables in Coastal Kenya: The case of sun-dried and frozen cowpea leaves. J. Agric. Food Syst. Community Dev.6, 189–207. 10.5304/jafscd.2015.061.004
29
Owade J. O. Abong G. O. Okoth M. W. Mwang’ombe A. W. (2020). A review of the contribution of cowpea leaves to food and nutrition security in East Africa. Food Sci. Nutr.8, 36–47. 10.1002/fsn3.1337
30
Owade J. O. Abong’ G. O. Okoth M. W. Mwang’ombe A. W. Jobor J. O. (2021). Comparative profiling of lactic acid bacteria isolates in optimized and spontaneous fermentation of cowpea leaves. Food Sci. Nutr.9, 1651–1664. 10.1002/fsn3.2140
31
Pearson-Stuttard J. Kypridemos C. Collins B. Mozaffarian D. Huang Y. Bandosz P. et al (2018). Estimating the health and economic effects of the proposed US Food and Drug Administration voluntary sodium reformulation: Microsimulation cost-effectiveness analysis. PLoS Med.15, e1002551. 10.1371/journal.pmed.1002551
32
Petrescu D. C. Vermeir I. Petrescu-Mag R. M. (2020). Consumer understanding of food quality, healthiness, and environmental impact: A cross-national perspective. Int. J. Environ. Res. Public Health17, E169. 10.3390/ijerph17010169
33
R Core Team (2019). R: A language and environment for statistical computing. Vienna, Austria: R Foundation for Statistical Computing.
34
Ramlan R. Qiang L. W. (2014). “An analytic hierarchy process approach for supplier selection: A case study,” in The third international conference on global optimization and its applications (ICoGOIA 2014), September 9–12, 2014, 150–160.
35
Russo R. D. F. S. M. Camanho R. (2015). Criteria in AHP: A systematic review of literature. Procedia Comput. Sci.55, 1123–1132. 10.1016/j.procs.2015.07.081
36
Saaty R. W. (1987). The analytic hierarchy process-what it is and how it is used. Math. Model.9, 161–176. 10.1016/0270-0255(87)90473-8
37
Saaty T. L. (1989). “Group decision making and the ANP,” in The analytic hierarchy process. Editors GoldenB. L.WasilE. A.HarkerP. T. (Berlin, Heidelberg: Springer). 10.1007/978-3-642-50244-6_4
38
Saaty T. L. Vargas L. G. (2012). Models, methods , concepts & applications of the analytic hierarchy process. Second Edi. Dordrecht London, Boston, MA, USA: Springer New York Heidelberg.
39
TBS (2020). Tanzania standard dehydrated soup, canned soups and broths. Dar es Salaam, Tanzania: TBS.
40
Vaidya O. S. Kumar S. (2006). Analytic hierarchy process: An overview of applications. Eur. J. Oper. Res.169 169, 1–29. 10.1016/j.ejor.2004.04.028
41
Vargas L. G. (1990). An overview of the analytic hierarchy process and its applications. Eur. J. Oper. Res.48, 2–8. 10.1016/0377-2217(90)90056-H
42
WHO (2011). Methodological approaches for cost-effectiveness and cost-utility analysis of injury prevention measures. DK-2100 Copenhagen, Denmark: WHO Regional Office for Europe. 10.1017/cbo9780511805998.006
43
WHO, FAO (2006). Guidelines on food fortification with micronutrients. Geneva, Switzerland: WHO Press, World Health Organization. 10.1242/jeb.02490
Summary
Keywords
analytic hierarchy process (AHP), benefit-cost ratio (B/C), cowpea leaves, linear programming (in general vector spaces), optimization, soup mix
Citation
Owade JO, Abong’ GO, Okoth MW and Mwang’ombe AW (2022) A benefit-cost analysis approach for determining the optimal processing of micronutrient-enriched cowpea leaf soup mixes. Front. Food. Sci. Technol. 2:874557. doi: 10.3389/frfst.2022.874557
Received
12 February 2022
Accepted
29 June 2022
Published
09 August 2022
Volume
2 - 2022
Edited by
Iuliana Vintila, Dunarea de Jos University, Romania
Reviewed by
Abe Shegro Gerrano, Agricultural Research Council of South Africa (ARC-SA), South Africa
Kandi Sridhar, Agrocampus Ouest, France
Updates
Copyright
© 2022 Owade, Abong’, Okoth and Mwang’ombe.
This is an open-access article distributed under the terms of the Creative Commons Attribution License (CC BY). The use, distribution or reproduction in other forums is permitted, provided the original author(s) and the copyright owner(s) are credited and that the original publication in this journal is cited, in accordance with accepted academic practice. No use, distribution or reproduction is permitted which does not comply with these terms.
*Correspondence: Joshua Ombaka Owade, owadehjm@gmail.com
This article was submitted to Food Process Design and Engineering, a section of the journal Frontiers in Food Science and Technology
Disclaimer
All claims expressed in this article are solely those of the authors and do not necessarily represent those of their affiliated organizations, or those of the publisher, the editors and the reviewers. Any product that may be evaluated in this article or claim that may be made by its manufacturer is not guaranteed or endorsed by the publisher.