 Egide Hakorimana1,2,3,4,5,6,7
 Chen Xi1,8,2,3,4,5*Alishir Kurban1,2,3,4,5
 Justin Nsanzabaganwa1,2,3,4,5,6Jeanine Umuhoza1,2,3,4,5,6Schadrack Niyonsenga1,2,3,4,5,6Adeline Umugwaneza1,2,3,4,5,6
 Chantal Habimana6,7
- 1Xinjiang Institute of Ecology and Geography, Chinese Academy of Sciences, Urumqi, China
- 2University of Chinese Academy of Sciences, Beijing, China
- 3Xinjiang Key Laboratory of RS & GIS Application, Urumqi, China
- 4Joint Research Center for Natural Resources and Environmental in East Africa, Kigali, Rwanda
- 5Research Center for Ecology and Environment of Central Asia, Chinese Academy of Sciences, Urumqi, Xinjiang, China
- 6University of Lay Adventist of Kigali (UNILAK), Faculty of Environmental Studies, Kigali, Rwanda
- 7Rwanda Sustainable Development Organization (RESO), Kigali, Rwanda
- 8Zhejiang University of Technology, Hangzhou, China
This study evaluates the impacts of land use and land cover (LULC) changes on streamflow dynamics and water availability within the Rwanda Hydro-Unity Network catchment, part of the Nile River basin. Utilizing the Soil and Water Assessment Tool (SWAT) and the Climatic Water Balance (CWB) model, we analyze hydrological changes from 1991 to 2020. The findings reveal a significant increase in surface runoff, water yield, and evapotranspiration, mainly driven by urban expansion and agricultural intensification, while groundwater recharge and percolation have declined. Climate variability has also contributed to increased evapotranspiration and seasonal water deficits, exacerbating drought risks. The key Findings showed that (1) LULC Changes (1991–2020): Cropland increased from 33.2% to 72.0%, Built-up areas expanded from 0.9% to 2.7% and Forest cover declined sharply from 49.9% to 11.8%. (2) Hydrological Changes: Surface runoff increased from 144.99 mm to 201.73 mm, Total water yield rose from 304.83 mm to 338.25 mm, Groundwater recharge declined from 105.58 mm to 88.27 mm and Evapotranspiration increased from 600.39 mm to 657.32 mm. (3) Climate Variability and Water Balance: Rising temperatures increased potential evapotranspiration (PET), reducing available water and the long dry season (June–September) showed the most significant decline in water balance. (4) Flood Risks and Adaptation Strategies: Urbanization has increased flood risks due to expanded impervious surfaces, Sustainable solutions, such as reforestation, improved urban drainage, and wetland restoration, are necessary. The study emphasizes the need for integrated land and water management strategies, including sustainable land-use policies, climate adaptation measures, and enhanced flood mitigation practices to ensure long-term water security in Rwanda.
1 Introduction
The alteration of Land Use Land Cover (LULC) brought about by both natural mechanisms and human-induced modifications significantly impacts the global hydrologic system (Mokaya et al., 2004; Mahmoud and Gan, 2018). These global hydrological processes possess the ability to ascertain the availability of water within a given river basin (Yáñez-Morroni et al., 2024). The alteration also influences the interaction between soil and water (Liu et al., 2023). Furthermore, the repercussions extend to surface and atmospheric systems, which represent the primary sources of surface water accessibility. Therefore, the impact of LULC alteration on hydrological processes at a river basin scale remains a pertinent subject of research on a global scale (Bucha et al., 2024).
The management of the consequences stemming from LULC alteration on river basins poses challenges in developing nations due to the incessant growth in population (Egide Hakorimana et al., 2018). The underlying reasons for this predicament include the accelerated rate of LULC alteration linked to rural-urban migration, the escalating demand for agricultural land, and the high frequency of unsustainable human-nature interactions. The resulting LULC alteration has given rise to fluctuations in the quantity, duration, and pattern of streamflow, thus affecting water availability in numerous regions across Africa.
Research investigations conducted in Rwanda have provided evidence that modifications to land use and land cover (LULC) have exerted a discernible influence on streamflow and hydrological cycle mechanisms within different basins, sub-basins, and catchments (Uwimana et al., 2017). Research by Hassen (2022) has shown that transforming forests, shrubs, and grasslands into farmlands impacts the river’s flow and water loss through evaporation and plant transpiration. While agricultural fields tend to boost river flow during the main rainy season and reduce water loss through evaporation and transpiration, the effects are less predictable during the shorter rains and dry periods. (Akinyemi, 2017) and others noted in 2017 that in Northwestern Rwanda, the expansion of agricultural land by 16% over 3 decades coincided with a 12% reduction in forested areas. These substantial land use alterations have altered the hydrological equilibrium of the region, leading to decreased water infiltration into the soil and heightened runoff.
In Rwanda, the Nyabarongo River serves as a critical resource. Its waters are essential for the operation of sugar mills, which rely on it for the cultivation of their sugarcane crops. The river also supports numerous minor irrigation projects throughout its watershed. Investments in large-scale farming are made by both governmental and private entities. Additionally, the Nile River basin, where the Nyabarongo River is located, is known for its rapid land use and land cover (LULC) changes, driven by ongoing demographic growth, the spread of farmland, and increasing urban development. Such changes exert extra strain on the region’s water resources, leading to inconsistent water levels.
Extensive research has been conducted on a global scale to understand the effects of land use and land cover (LULC) changes on streamflow. For example, Shahid and colleagues in 2018 investigated the impacts of climate change and human activities on streamflow by employing the ABCD hydrological model. This model helped assess how LULC and climate variations affect runoff production at a basin scale in Pakistan. Similarly, Cong, Shahid (Cong et al., 2017) examined shifts in runoff patterns and hydrological variable trends, linking these alterations to environmental changes in China. In Rwanda, a series of studies (Uwimana et al., 2017; Nambajimana et al., 2019; Guzha et al., 2018) have pinpointed the repercussions of LULC alterations on surface runoff. These investigations delved into the repercussions of climate and land use changes on runoff, employing diverse research methods. Efforts were also made to gauge the impact of LULC transformations on the availability of surface water resources.
The research conducted has enhanced our understanding of how changes in land use and land cover (LULC) affect surface runoff and water availability within a watershed. However, the findings are dispersed and lack a clear delineation of how LULC alterations directly influence streamflow and thus the presence of surface water. The intricate relationship between LULC dynamics and their effects on streamflow remains undefined, leaving a gap in our grasp of these environmental interactions.
The assessment of how changes in land utilization and coverage affect surface water, as well as the measurement of available surface water, can be effectively conducted using the Soil and Water Assessment Tool (SWAT). A thorough grasp of the dynamics of land use and cover, along with related factors like water consumption, irrigation expansion, and watershed management, can be achieved by examining the influence of land use and cover changes on surface water and by further appraising the availability of this water. This approach allows for a detailed exploration of the interplay between land development and water resources.
The Soil and Water Assessment Tool (SWAT) is a widely used hydrological model designed to simulate the impact of land use, soil types, and climate conditions on streamflow and water resources (Arnold et al., 1998). It has been extensively applied in watershed studies worldwide, particularly in data-scarce regions, due to its ability to model surface runoff, evapotranspiration, and water balance dynamics over long periods (Gassman et al., 2007). Several studies in East Africa, including those by Mango et al. (2011) and Kiprotich et al. (2021), have demonstrated SWAT’s effectiveness in assessing hydrological responses to land-use changes, revealing that agricultural expansion and urbanization often lead to increased runoff and altered streamflow patterns. In the context of the Rwanda Hydro-Unity Network catchment, part of the Nile River basin, rapid land-use changes necessitate a robust modeling approach to evaluate their hydrological implications. Given its ability to integrate spatial and temporal variations, SWAT was chosen for this study to provide insights into how land-use shifts affect water availability and surface runoff, complementing seasonal analyses conducted with the Climatic Water Balance (CWB) model. However, previous research has noted SWAT’s tendency to overestimate peak flows while effectively capturing moderate and low-flow conditions (Arnold et al., 2012), a limitation also observed in this study. Despite these challenges, SWAT remains a valuable tool for guiding land and water resource management strategies in the face of evolving land-use patterns and climate variability.
2 Materials and methods
2.1 Description of the study area
The Rwanda Hydro-Unity Network is the interconnection nature of catchments and the collaborative approach to water resource management in Rwanda, it is an integral component of Nile basin, encompassing diverse ecological regions and serving as vital water sources. Rwanda Hydro-Unity Network is situated particularly in the lower part of the Nile basin. The absolute location of the network is between 29°18′0″E and 30°36′00″E latitude and 2°28′0″S and 1°36′0″S longitude (Figure 1). The total area of the catchment is about 11554 square kilometers. As shown in Figure 1, there are 15streamflow outlets in the catchment. The elevation of the Rwanda Hydro-Unity Network catchment ranges between 1320 and 4,495 m above mean sea level.
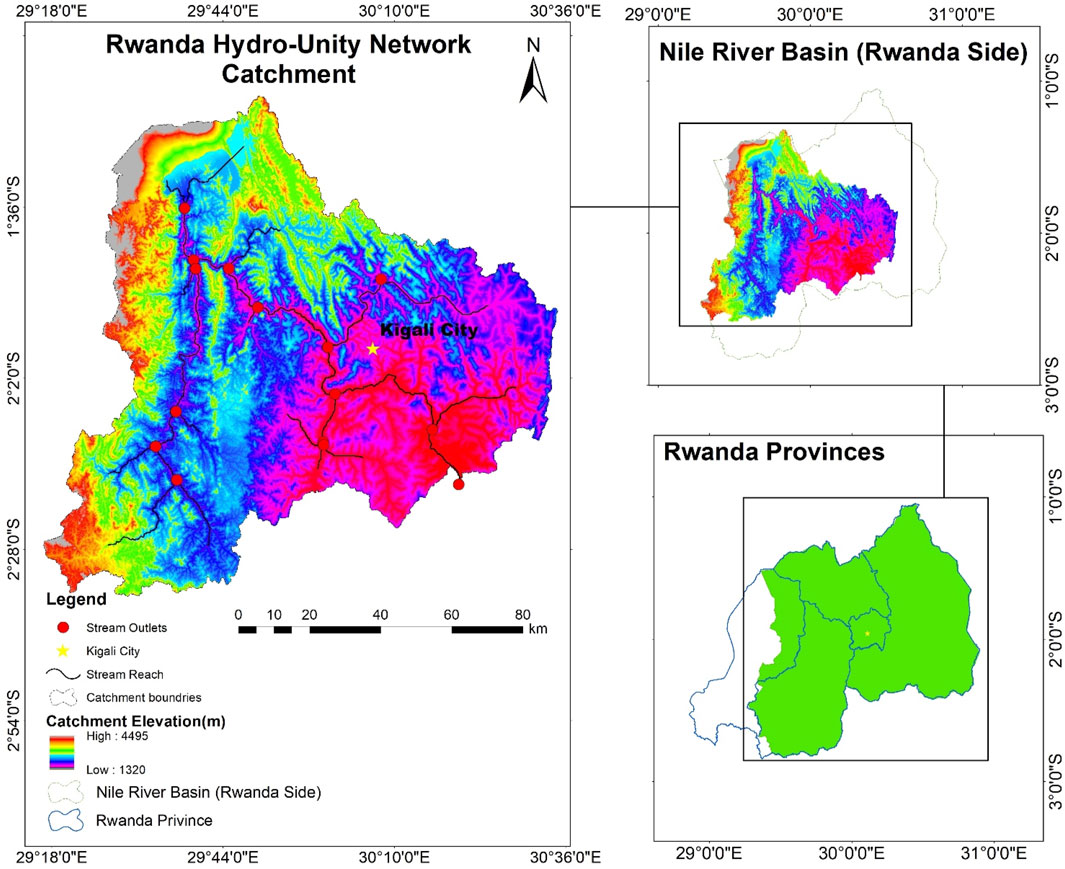
Figure 1. Study area map with stream networks, outflow points, and topographic levels.
Rwanda’s topography is a tapestry of undulating hills and deep valleys, which play a crucial role in the hydrology of the country. The landlocked nation is characterized by its high elevation, with the terrain sloping from west to east. This unique topography significantly influences the catchment areas, which are essential for water resources management. The country is divided into several major catchments, which make Rwanda Hydro-Unity Network including the Kivu, Nyabarongo, Muvumba, Akanyaru, Akagera, Mukungwa, and Rusizi, each named after the key river systems they encompass. These catchments are not just physical demarcations but are vital for the integrated water resources management (IWRM) approach adopted by Rwanda.
2.2 Trend analysis of stream flow, precipitation and temperature
Prior to initiating the SWAT and Climatic Water Balance models, an analysis of the temporal trends in hydro-meteorological variables, including streamflow, precipitation, and temperature, was performed. The evaluation of these trends utilized the Mann Kendall Sen’s slope method. This approach was applied to the primary hydro-meteorological data sets. The calculation of the Mann-Kendall test statistic ‘S' follows Equation 1, which is grounded in the methodologies established by Mann in 1945 and Kendall in 1948.
In the context of the Mann-Kendall statistic, ‘S' represents the statistic itself, while “xi” refers to a sequential data set that has been arranged in order of occurrence from the first to the penultimate position, denoted as i = 1, 2, … , n-1. Concurrently, “xj” is another sequence of data points that follows “xi” and is ranked from j = i+1, 2, … , n. The process involves taking each data point “Xi” as a benchmark and comparing it with subsequent data points “Xj” to analyze the trend (Equation 2). This comparison is crucial for identifying the direction and strength of the trend within the time series data. And:
When the annual values for years i and j (with j being later than i) are represented as Xi and Xj, it is observed that if there are more than 10 observations, the ‘S' statistic tends to follow a normal distribution where the expected value, E(S), is zero, as noted by Kendall in 1948. Under these conditions, the variance of the statistic can be described by a specific formula referred to as (Equation 3):
In the context of statistical analysis, ‘n' represents the total number of observations within the dataset, and ti denotes the tied ranks within the sample time series. The test statistic Zc is then computed according to the formula designated as Equation 4, which is typically used to determine the significance of the observed data in relation to the hypothesis being tested.
2.3 Model description
In the current research, two analytical models were employed. The SWAT model was utilized to assess how changes in land use and land cover affect streamflow. Meanwhile, the Climatic Water Balance model was applied to determine the availability of surface water. These models are instrumental in understanding environmental impacts on water resources.
2.3.1 SWAT model
The SWAT model is adept at calculating key hydrological processes including percolation, surface flow, and infiltration, along with evapotranspiration and various aquifer dynamics (Mapes and Pricope, 2020). Renowned for its ability to assess the effects of land use and land cover (LULC) alterations on streamflow within watersheds, it effectively processes extensive data inputs like LULC variations, soil properties, and climatic factors. Additionally, SWAT’s compatibility with ArcGIS as an add-on enhances its utility for projecting LULC changes and their consequent hydrological.
The SWAT framework employs the water balance equation for the replication of the hydrological cycle, as delineated in Equation 5 by Neitsch and colleagues in 2011. This approach is instrumental in understanding the movement and distribution of water within the Earth’s atmosphere and surface.
In this statement, SWt represents the final measurement of soil moisture in millimeters, while SW0 indicates the initial measurement on a given day. Rday refers to the precipitation received, Qsurf to the runoff observed, and Ea to the water lost through evapotranspiration, all recorded in millimeters. Additionally, Wseep denotes the water percolating into the subsoil, and Qgw represents the groundwater returning to the surface, also measured in millimeters, all within the same day.
The research utilized the ArcSWAT extension within ArcMap and the SWAT-CUP 12 software. ArcSWAT was used to establish the SWAT project, define the watershed boundaries, and input various data types such as DEM, LULC, soil, and slope, as well as to incorporate meteorological data and execute the SWAT model within ArcMap. SWAT-CUP was applied to adjust and confirm the SWAT model’s accuracy by employing streamflow data. This approach facilitated the calibration, confirmation, sensitivity testing, and uncertainty evaluation of the SWAT model (Huo et al., 2020).
During the SWAT model’s calibration and validation process, three key performance indicators were utilized: the R-Square Coefficient (R2), the Nash–Sutcliffe Efficiency (NSE), and the Percent Bias (PBIAS). The R2 coefficient quantifies the correlation strength between the observed data and the model’s regression line, with values ranging from 0 to 1—where a value closer to 1 indicates a model with less error variance (Hariri-Ardebili and Mahdavi, 2023). The NSE metric assesses the size of the data’s variance against the residual variance, with values from −1 to 1. An NSE value above 0.5 is deemed satisfactory (Duc and Sawada, 2023). Lastly, PBIAS measures the tendency of the model’s data to be higher or lower than the actual observations, with the ideal value being 0, indicating no bias.
2.3.1.1 Mode evaluation indicators
2.3.1.1.1 Nash-Sutcliffe Efficiency (NES)
The NSE is a standardized metric designed to assess how accurately the simulated runoff aligns with the observed runoff (Nash and Sutcliffe, 1970). It serves as an indicator of the reliability of the water yield model. The corresponding formula is provided below (Equation 6).
In this context, OBSi represents the observed water yield, SIMi denotes the simulated water yield, and OBS refers to the average of the observed values. An NSE value of 1 indicates excellent simulation performance, while an NSE value of 0 suggests that the model’s simulations are comparable to the mean of the observed data.
2.3.1.1.2 Percent bias (PBIAS)
The PBIAS quantifies the discrepancy between the simulated and observed water yields. The following formula will have applied to calculate PBIAS (Equation 7)
In this Formula 8, OBSi represents the observed water yield, SIMi is the simulated water yield, and N denotes the total number of samples. The ideal PBIAS value is 0.0. A positive PBIAS indicates a model bias toward overestimating, while a negative PBIAS suggests a bias toward underestimating.
2.3.1.1.3 Coefficient of determination (R2)
The R2 statistic is used to assess the extent to which variations in water yield can be attributed to influencing factors. It reflects the strength of the linear relationship between water yield and these factors. The formula for R2 is provided below.
In this equation, ÿi represents the water yield, ÿi denotes the influencing factor, ÿ is the average of ÿi, and i refers to the total number of samples. An R2 value of 0 indicates that the water yield cannot be explained by the influencing factor, while an R2 value of 1 signifies a perfect relationship between the water yield and the factor.
2.3.2 Climatic water balance (CWB)
The CWB approach assesses water resources in a region by considering rainfall and potential evapotranspiration (PET) (Gebreyesus et al., 2021). Prior to utilizing the CWB framework, one must determine the PET for a given period. While various techniques for calculating PET exist, depending on the available data, the method proposed by Hargreaves GH (Hargreaves, 2024) is often preferred due to its convenience. This particular method estimates PET by taking into account both the lowest and highest temperatures, along with solar radiation data using the following equation (Equation 9).
Where potential evapotranspiration (PET), measured in millimeters per day (mm/day), is calculated using the mean temperature (Tmean), expressed in degrees Celsius (°C), along with the highest (Tmax) and lowest (Tmin) temperatures, also in °C. Additionally, extra-terrestrial radiation (Ra), which is quantified in mm/day, is factored into the equation. The climatic water balance can then be understood as the total precipitation minus the PET over a specific time frame (Equation 10).
In this context, ‘CWB’ stands for climatic water balance, measured in millimeters, which is calculated by subtracting potential evapotranspiration (PET) in millimeters per day from precipitation (P) in millimeters. This measure is utilized to assess the seasonal availability of surface water within a watershed. The model then estimates this availability, taking into account the effects of climate change.
The PET in this study was calculated using the method proposed by Hargreaves and Samani, which estimates PET based on temperature data and extraterrestrial radiation. This approach was selected due to its simplicity and minimal data requirements, making it particularly suitable for regions like the Rwanda Hydro-Unity Network catchment, where detailed meteorological data (e.g., solar radiation, wind speed, and relative humidity) are often limited or unavailable (Diva, 1982). The Hargreaves method has been widely used in similar hydrological studies, especially in data-scarce environments, and has demonstrated reasonable accuracy for estimating PET in such contexts (Droogers and Allen, 2002).
While the Penman method is recognized for its higher accuracy under certain conditions, as it incorporates additional meteorological parameters such as solar radiation, wind speed, and humidity, its application in this study was constrained by the lack of comprehensive input data. The Penman method requires detailed and high-quality meteorological data, which were not consistently available across the study area and time period (1991–2020) (Allen et al., 2006). Furthermore, the Hargreaves method was deemed appropriate given the study’s focus on long-term trends and relative changes in hydrological dynamics rather than absolute PET values.
It is important to note that the choice of the Hargreaves method may introduce some uncertainties, particularly in regions with significant variations in microclimatic conditions. However, the method’s simplicity and reliability in data-scarce environments make it a practical choice for this study. Future research could explore the use of more data-intensive methods, such as the Penman method, if additional meteorological data become available, to further refine PET estimates and enhance the accuracy of hydrological modeling in the region.
2.3.3 Image processing and classification
Following the procurement of the Landsat Mapper and Enhanced Thematic Mapper Plus (ETM+) from the USGS Earth Explorer, a series of image pre-processing steps were undertaken to refine the image for better classification. This included both geometrical corrections, such as spatial georeferencing, and radiometric adjustments, like image enhancement and the removal of noise and dark objects. The ENVI 5.3 software was utilized to stack the image bands, and the improved image was then imported into ArcMap 10.8, where it was masked with the Rwanda Hydro-unity catchment boundary. Supervised image classification was executed using ERDAS Imagine 2015, chosen for its ability to be validated against ground-truthing GPS data points that confirm the land use classifications on the image. This method involves selecting representative sample pixels for specific classes and directing the software to use these samples as a benchmark for classifying the remaining pixels in the image. The classification process was further supported by the high-resolution imagery from Google Earth, integrated with ERDAS Imagine and an in-depth understanding of the study area. To enhance classification precision, multiple iterations were performed using the signature editor tool.
In the process of validating image accuracy, each pixel was treated as a separate unit of validation. The accuracy assessment included evaluations from the user’s perspective, the producer’s perspective, an overall accuracy calculation, and the Kappa Coefficient. The user’s accuracy is concerned with commission errors, which occur when the classifier incorrectly assigns pixels to a target class. This is detailed in the work of Foody (Foody, 2020). On the other hand, the producer’s accuracy focuses on omission errors, where the classifier fails to identify pixels of the target class, as discussed by (Budde et al., 2021). Overall accuracy is the ratio of correctly identified samples, as described by Baldi, Brunak (Baldi et al., 2000). Lastly, the Kappa Coefficient, calculated as per (Congalton and Green, 2019) Equation 11, measures the error reduction achieved by the classification algorithm compared to random chance, as explained by Fahsi et al. (2000)
In this context, ‘TS’ stands for Total Sample, ‘TCS’ represents Total Column Sample, ‘CT’ is an abbreviation for Column Total, and ‘RT’ signifies Row Total. These terms are typically used in statistical analysis or data collection methodologies to refer to different aggregates or subsets of data.
2.3.4 Data types and sources
In the present research, the SWAT model was executed with essential datasets such as Land Use and Land Cover (LULC), Digital Elevation Model (DEM), soil characteristics, and meteorological data on a 4 km by 4 km grid (covering precipitation, temperature extremes, relative humidity, solar radiation, and wind speed). Table 1 illustrate the specification of used data set. Additionally, the model incorporated observed streamflow measurements from the Rwanda Hydro-Unity Network stations.
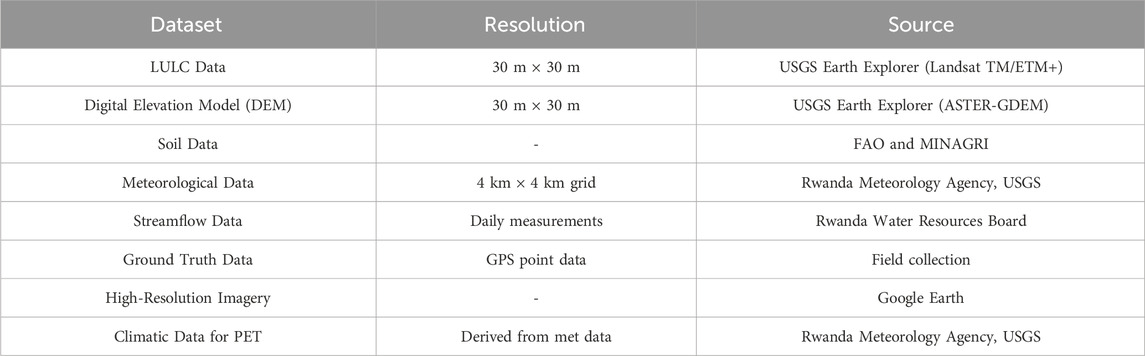
Table 1. Specification of used data set.
The Land Use/Land Cover (LULC) mapping was conducted for the years 1991 and 2020, chosen based on previous research work, which identified these years as non-drought and drought periods within the Nile River basin, side of Rwanda. The purpose of selecting these specific years was to establish a connection between the SWAT model’s results and the variations in water availability during wet and dry conditions. For the creation of the LULC maps, data from the Landsat Thematic Mapper (TM) for 1991 and the Enhanced Thematic Mapper Plus (ETM+) for 2020 were utilized. This information was retrieved from the USGS Earth Explorer website, which provides a spatial resolution of 30 m by 30 m. Subsequently, the LULC maps for the years 1991 and 2020, as depicted in Figure 2, were generated to facilitate the simulation of the SWAT model.
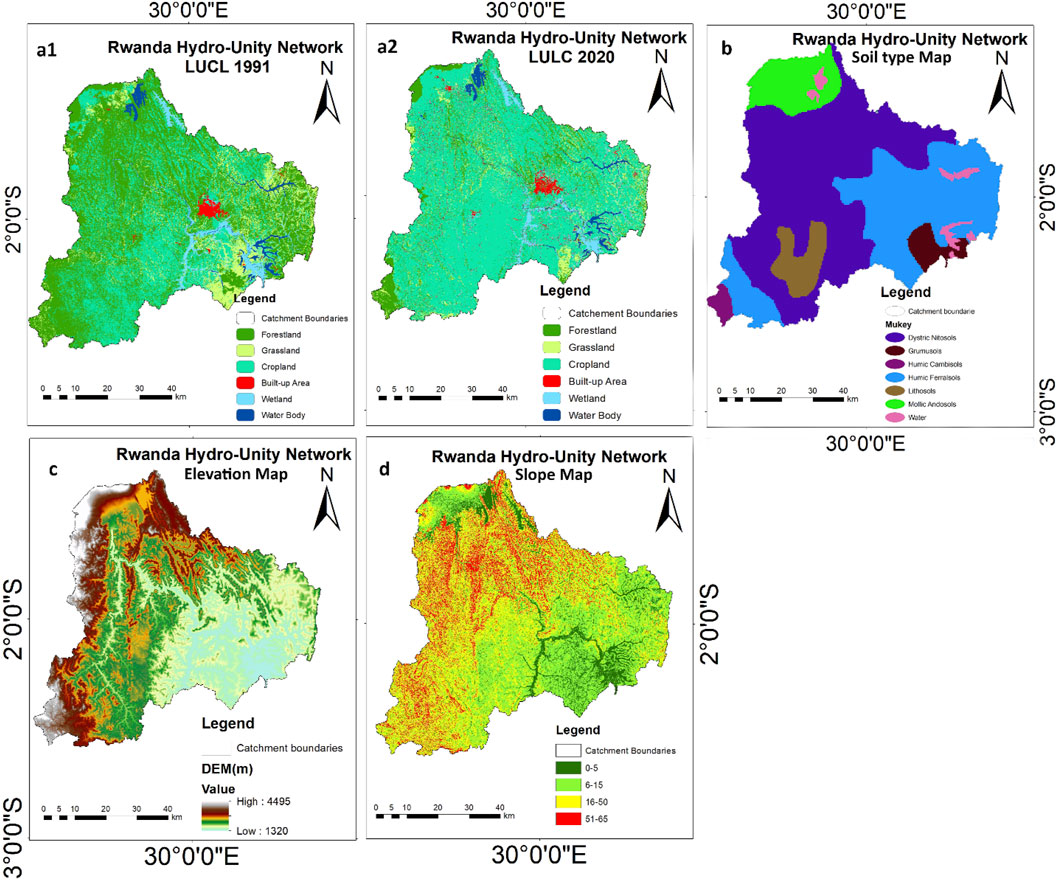
Figure 2. The Rwanda Hydro-Unity Network LULC maps (a1,a2), Soil Type Map (b), Elevation Map (c) and Slope Map (d).
The ASTER Global Digital Elevation Model (ASTER-GDEM), a high-definition topographic dataset, was sourced from the USGS Earth Explorer, as depicted in Figure 2C. This dataset served as the Digital Elevation Model (DEM) input for the SWAT model and was instrumental in creating a slope map Figure 2D. Utilizing the slope function within ArcGIS and the DEM as the foundational data, the slope map for the designated study zone was generated. The ASTER-GDEM boasts a spatial resolution of 30 m by 30 m and captures elevation variations ranging from 1320 to 4,495 m above the average sea level, as illustrated in Figure 2C.
The information regarding soil was obtained from the digital soil map provided by the Food and Agriculture Organization (FAO) of the United Nations and the Ministry of Agriculture (MINAGRI). This data, including soil types and their specific codes, was inputted manually into the SWAT soil database, along with their characteristics as shown in Figure 2B. Within the Rwanda Hydro-Unity Network, as depicted in Figure 2B, seven distinct soil types have been identified. The predominant soil type is Dystric Nitisols (Nd39-3bc-807), which constitutes 58.1% of the total area of the catchment. Following in abundance are Humic Ferralsols (Fh10-3b-477) and Mollic Andosols (Tm10-2bc-941), which make up 19.6% and 15.1% of the area, respectively. The remaining area is composed of four other soil types: Grumusols (Gh7-2a-57), Lithosols (I-N-c-657), Humic Cambisol (Bh14-3c-466) and Water (WATER-1972).
Meteorological information was gathered from a pair of sources. The Rwanda Meteorology Agency supplied data on daily rainfall, minimum temperatures, and overall temperature trends spanning from 1991 to 2020. However, due to a lack of data at the necessary spatial and temporal resolutions from the Rwanda Meteorology Agency, daily measurements of relative humidity and wind speed for the study region were retrieved from the aforementioned USGS site, supplemented by station location details. Additionally, the Rwanda water Resources Board contributed daily streamflow observations for the same period.
The study outlines a comprehensive methodological approach, integrating SWAT and SWAT CUP 12 with R software, as depicted in Figure 3. This fusion of tools facilitates a robust analysis of watershed simulations, optimizing calibration through SWAT CUP 12, while R software provides a platform for statistical computation and graphics. Figure 5 serves as a visual guide to the workflow, illustrating the sequential steps and the interplay between these applications in achieving the study’s objectives.
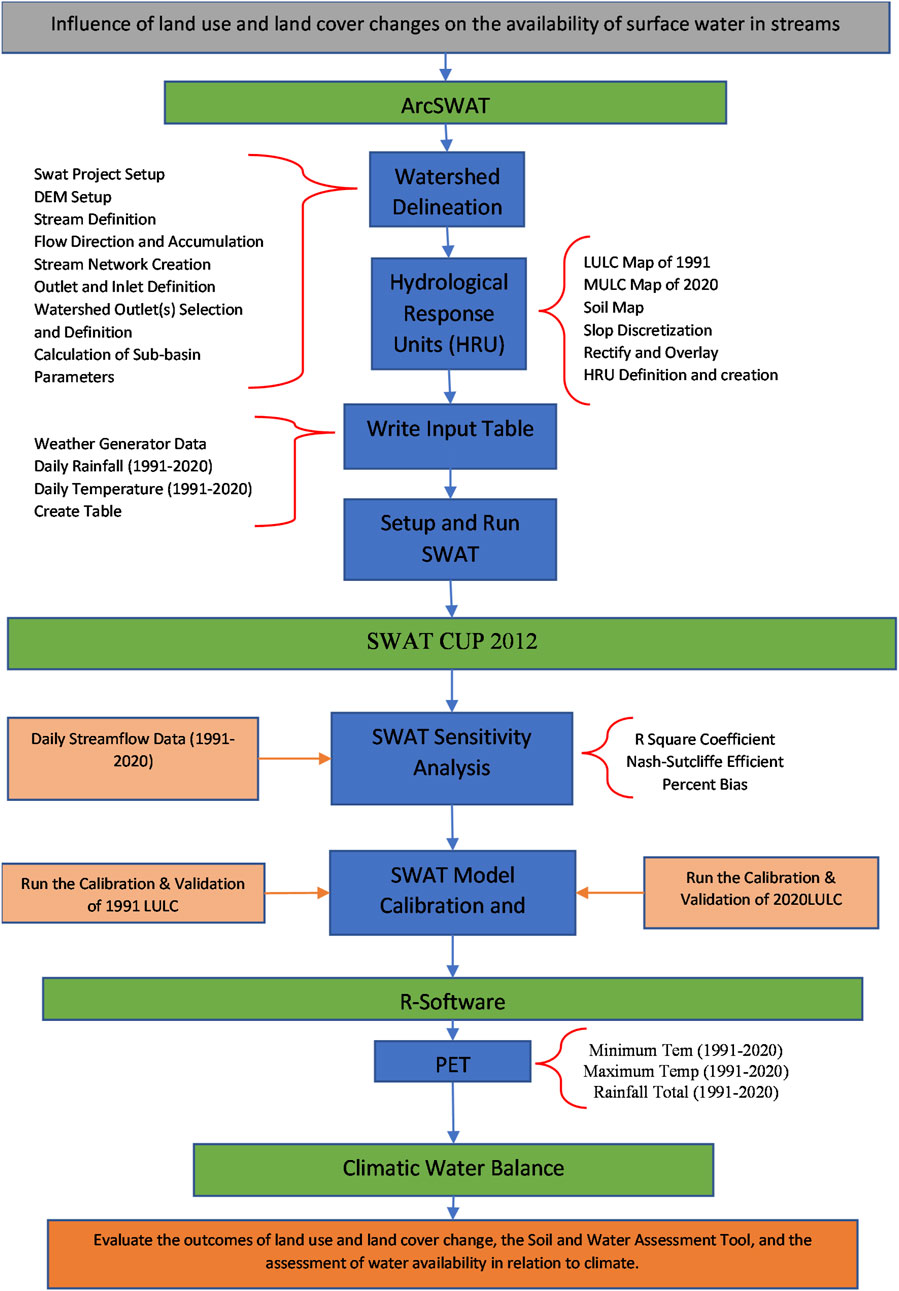
Figure 3. Methodological flowchart.
3 Results and discussions
3.1 Trend analysis of hydro-meteorological data
Hydro-meteorological parameters serve as essential input data for this research. Observing trends in these parameters, whether they rise or fall, is crucial for comparing results with the SWAT and CWB models. Therefore, an annual Mann-Kendall Sen’s Slope trend analysis was conducted over a 30-year span from 1991 to 2020. The findings, detailed in Table 1, reveal a statistically significant upward trend in the annual streamflow within the Rwanda Hydro-unity Network, confirmed at a 99% confidence level throughout the duration of the study.
A recent investigation in Rwanda revealed a notable upward trend in streamflow, as evidenced by data collected from monitoring stations (Macharia et al., 2023). This trend, which is statistically significant, suggests changes in streamflow patterns over time. The findings underscore the importance of continuous observation and analysis to understand the dynamics affecting water resources Rwanda Hydro-Unity Network.
Table 2 indicates that the study used 30 data points in the series (n) and the overall trend in precipitation does not show a significant statistical change, as evidenced by a p-value of 0.129. This trend of non-significance is consistent across the majority of different part of Rwanda, including our area of study, as noted in studies by (Muhire et al., 2015). Despite this, there is a notable high variability in seasonal patterns, as highlighted by Ayabagabo (Ayabagabo, 2018). Instances of precipitation occurring in unanticipated seasons have been documented (Jonah et al., 2021), along with delays in the usual seasonal onset (Ntirenganya, 2018), and even shifts between seasons (Ntirenganya, 2014; Twahirwa et al., 2023). Such unpredictability has had a profound impact on subsistence farming reliant on rainfall, leading to widespread food insecurity and increased poverty levels in Rwanda, as discussed by Austin, Beach (Austin et al., 2020).
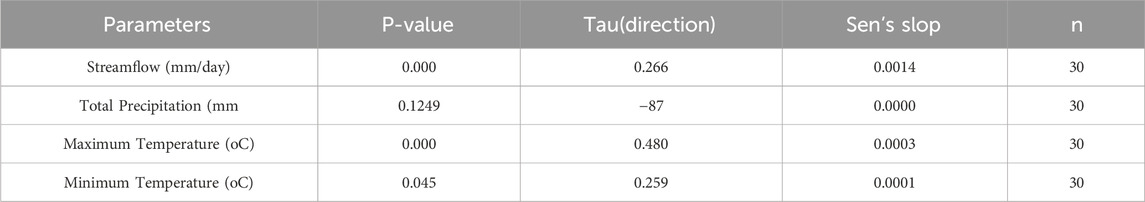
Table 2. Application of Mann-Kendall and Sen’s slope in hydro-meteorological trend analysis.
Over a 30-year period, trends have shown a significant rise in both maximum and minimum temperatures, with a 99% confidence level. This suggests an elevation in temperatures within the study area, leading to higher rates of evapotranspiration which may impact the availability of surface water. The reason is the direct correlation between temperature increases and evapotranspiration rates (Zomer et al., 2022). Concurrently, a rise in precipitation has been observed, which could lead to more streamflow since precipitation directly contributes to streamflow levels. Supporting this, recent research (Safari and Sebaziga, 2023) has noted a consistent upward trend in precipitation within the Rwanda Hydro-Unity Network.
3.2 Verification process for the correctness of LULC categorization
In the realm of image classification for varying annual datasets, a generally accepted benchmark for precision is an overall accuracy exceeding 85% and a Kappa coefficient also surpassing 85%, as noted by Foody (Foody, 2020). In the case of the Rwanda Hydro-Unity Network area, a meticulous validation of the land use and land cover (LULC) categorization for imagery from the year 2020 was conducted. This process involved the collection of 60 verifiable ground truth data points via Global Positioning System (GPS) for each of the six distinct land-use categories identified within the catchment. The subsequent accuracy evaluation yielded affirmative results, confirming the reliability of the supervised classification approach applied to the 2020 imagery. Specifically, the user’s accuracy, which reflects the proportion of correct predictions for a given class, was recorded at an impressive 98%. This figure was derived by dividing the number of correct classifications for a class by the row total. Moreover, the producer’s accuracy, indicative of the frequency with which the classified map accurately represents the actual terrain features, was calculated to be 96%. These figures collectively contributed to an overall accuracy rate of 98% for the image classification, while the Kappa coefficient, a statistical measure of inter-rater agreement for categorical items, stood at a commendable 97%, as detailed in Table 2 of the referenced document. This high level of accuracy and agreement underscores the effectiveness of the classification methodology employed and the rigorous nature of the validation process, thereby reinforcing the credibility of the findings. The results not only demonstrate the precision of the classification but also highlight the importance of thorough ground truthing in ensuring the reliability of remote sensing data for land-use analysis.
3.3 Land use and land cover change
The study identified six distinct land use and land cover (LULC) categories: Forestland, Grassland, Cropland, Built-Up area, Wetland Area and Water body. These classifications were derived from a methodical image classification process aimed at monitoring alterations in the landscape. The objective was to observe the evolution of these LULC classes over a period spanning from 1991 to 2020. A detailed table was created to illustrate land use and land cover changes from 1991 to 2020, with data presented at 10-year intervals (Table 3). The findings, which provide a comprehensive overview of the changes, have been concisely presented in Table 3. This table likely serves as a crucial reference point for understanding the extent and nature of environmental changes in the studied area. The classification process is instrumental in highlighting shifts in land use patterns, potentially indicating ecological transformations, urban development, or changes in agricultural practices. Such insights are invaluable for policymakers, environmentalists, and urban planners in making informed decisions that align with sustainable development goals. The data from 1991 to 2020 would reveal trends and transitions in land use, offering a narrative of the region’s development and natural resource management. The study’s approach underscores the importance of using supervised image classification as a reliable tool for environmental monitoring and planning.
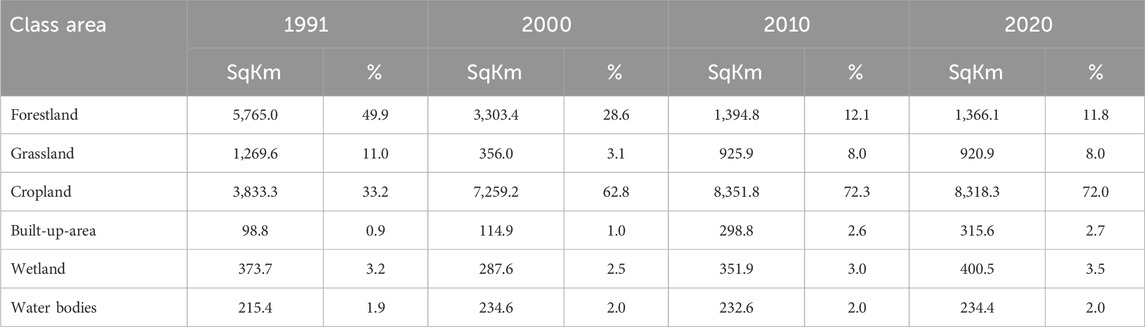
Table 3. Detailed LULC 1991–2020.
Table 3 provides Land Use and Land Cover (LULC) data for the area of study over four time periods: 1991, 2000, 2010, and 2020. The data, presented in square kilometers (sqKm) and percentages of total area, reveals significant changes in land use over the 30-year span. Forestland, for instance, experienced a dramatic decline, dropping from 5,765.03 sqKm (40.64%) in 1991 to 1,366.12 sqKm (12.04%) in 2020. This reduction, particularly sharp between 1991 and 2000, is attributed to deforestation for agriculture, logging, and urbanization (Hester et al., 2010). The loss of forestland has profound ecological consequences, including reduced biodiversity, lower carbon sequestration, and altered hydrological processes, such as increased runoff and reduced water infiltration (Benjamin, 2024).
Grassland and cropland also underwent significant changes. Grassland decreased by 72% between 1991 and 2000, due to conversion into cropland and built-up areas, though it saw some recovery after 2000. Cropland, on the other hand, expanded rapidly, more than doubling from 3,833.25 sqKm (26.90%) in 1991 to 8,318.28 sqKm (63.19%) in 2020. This expansion reflects agricultural intensification driven by population growth and food demand. While this supports food security, it comes at the cost of natural ecosystems, potentially leading to soil erosion, nutrient runoff, and reduced water quality. Urbanization also played a significant role, with built-up areas growing steadily, particularly between 2000 and 2010, reflecting population growth and economic development. This expansion contributes to the loss of natural habitats and increases impervious surfaces, raising flood risks and altering local microclimates.
Wetlands and water bodies showed more stability over the 30-year period. Wetlands experienced a decline between 1991 and 2000 but recovered somewhat after 2000, due to conservation efforts and natural regeneration (Nabahungu and Visser, 2011). By 2020, wetlands had stabilized, with a slight increase compared to 2010. Overall, the data highlights the significant impact of deforestation, agricultural expansion, and urbanization on the Hydro Unity Network area of Rwanda. These changes have important implications for ecological balance, hydrological processes, and sustainable development, underscoring the need for proactive land use planning and conservation efforts to mitigate environmental degradation and promote sustainable resource management.
The study revealed changes in land use and land cover (LULC) from 1991 to 2020 (Table 4), showing a decrease in Forest and Grassland while Cropland, Built-up area, Wetland and Water Body shown increased. Notably, cropland was the most significant, with an 8318.3 km2 increase, accounting for a 72% rise, primarily due to the country’s significant population growth over the last decade, which has led to a higher demand for food and thus more land being converted into cropland (Rwanyiziri et al., 2020; Musafiri, 2016).
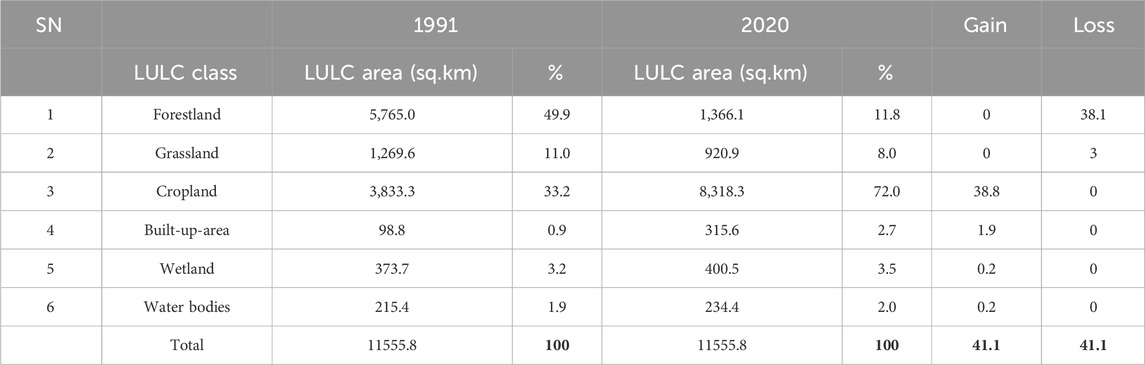
Table 4. Comparative analysis of LULC changes between 1991 and 2020.
Additionally, Rwanda has been investing in land husbandry, water harvesting, and hillside irrigation to enhance resilience to climate change, reduce soil erosion, halt land degradation, and increase land productivity (Munyantarama, 2016). Statistically, Forest shown a decrease of 1366.1 km2 which represent 38.1% of decrease, Grassland known a decrease of 920.9 km2 which equal to 3% loss.
Built up area suit to Urbanization has shown an increase of 315.5 km2 which equal to 1.9% (Nduwayezu et al., 2021). Meanwhile, conservation efforts and the need to sustainably manage natural resources have led to the deliberate creation and preservation of wetlands and water bodies, and the know an increase of 0.2% each one (Mkonda, 2022; Gakuba, 2024; Rammal and Berthier, 2020).
Alterations in Land Use and Land Cover (LULC) within a watershed can significantly impact the river’s streamflow and the availability of surface water. The type of land cover, soil characteristics, and annual precipitation are closely linked to the average yearly streamflow of a watershed. For example, urban areas, with their impermeable surfaces and limited infiltration, are prone to generating higher runoff (Rammal and Berthier, 2020; Zölch et al., 2017), this is particularly evident in certain catchment zones.
3.4 SWAT model results
3.4.1 Hydrological response unit (HRU) definition
In the context of the SWAT simulation, the Rwanda Hydro-Unity Network catchment area was segmented into 29 smaller units known as sub-basins. These sub-basins were then further dissected into Hydrological Response Units (HRUs), which were delineated based on a trio of criteria: the predominant land use, soil type, and slope variations found within each sub-basin. The HRUs emerged from the intersection of the newly created slope map, depicted in Figure 3B, with the maps of soil and land use, shown in Figures 2, 3C, respectively. To define the HRUs, thresholds of 12% for land use, 15% for soil type, and 17% for slope were applied. This methodology led to the formation of 189 distinct HRUs through the SWAT model. These HRUs served a dual purpose: they were not only the fundamental building blocks for the simulation but also provided the essential data for calibrating the streamflow within the SWATCUP12 tool. It's important to note that an HRU is the most granular division within a sub-basin and does not necessarily mirror the overall characteristics of the larger sub-basin it resides in. This level of detail in the simulation allows for a more precise analysis of how different land characteristics can affect water flow and distribution in a catchment area.
3.4.2 Sensitivity analysis
In the initial stage of the SWAT CUP simulation, sensitivity analysis is conducted to determine the key input parameters of the model. This analysis is crucial for assessing how variations in watershed conditions can lead to significant changes in hydrological sensitivity (Herman et al., 2013). According to Wang DanDan, Yu XinXiao (Wang DanDan et al.), this step is essential for calibrating the model accurately, as it involves pinpointing the parameters that are most influential on the model’s output, thereby ensuring precision in the simulation results.
In the sensitivity analysis detailed in Table 5, a set of ten parameters was selected based on their strong correlation with streamflow. These parameters include critical environmental factors like temperature and precipitation, as well as key hydrological components such as groundwater. Additionally, factors influencing land management, specifically land use and cover, along with surface features and soil properties, were given precedence due to their impact on streamflow dynamics. This prioritization ensures that the most influential variables are considered in evaluating the system’s responsiveness to environmental changes.
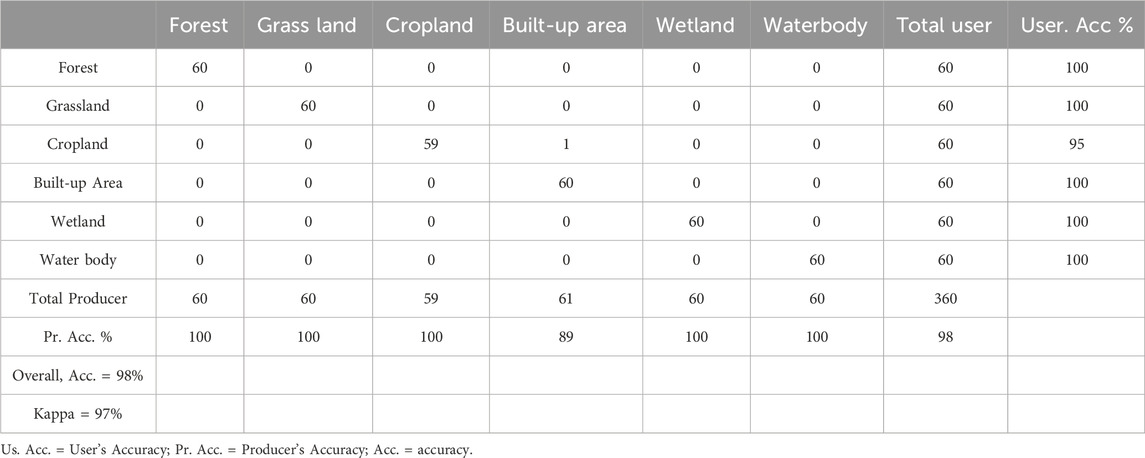
Table 5. Accuracy measurement Matrix for classification models (2020).
Following the sensitivity analysis, the four parameters that demonstrated the highest sensitivity were selected to adjust the streamflow, as depicted in Figure 4. These parameters underwent a sensitivity evaluation over a period of 4 years within the SWAT CUP framework, employing the SUFI-2 method for global sensitivity analysis. This rigorous approach ensures that the most influential factors are considered in the calibration process, enhancing the accuracy and reliability of the streamflow modeling.
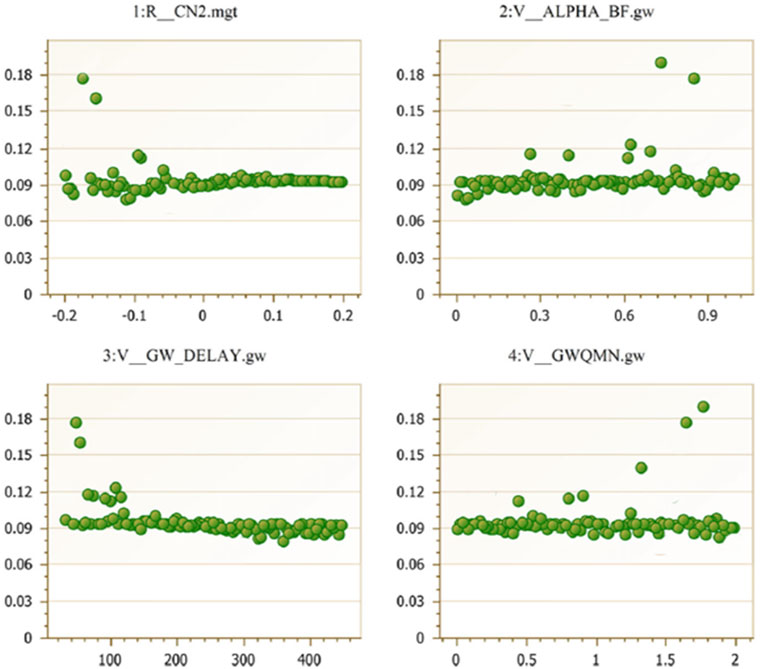
Figure 4. Dot plot representation of optimal sensitivity parameters in model calibration (Y-axis: p-value, X-axis: t-statistic).
The sensitivity of the parameters was assessed by analyzing the t-statistic and p-value. This method is commonly used in statistics to determine the reliability of the parameters, where the t-statistic measures the degree of deviation from the null hypothesis, and the p-value indicates the probability of observing the results given that the null hypothesis is true. A low p-value, in conjunction with a high t-statistic, typically suggests that the parameter has a significant impact on the model and is not due to random chance.
3.4.3 Model calibration and validation
The calibration and Validation of the SWAT model for the Rwanda Hydro-Unity Network is a critical process to ensure accurate simulation of streamflow. The use of the Sufi-2 algorithm within the SWAT Cup interface allows for a systematic adjustment of the most sensitive parameters, enhancing the model’s performance over the calibration period of 2011–2013 and Validation Period 2014–2015. Despite the initial unsatisfactory results from the Arc SWAT calibration and Validation, the subsequent iterative approach with 200 simulations and 10 iterations signifies a thorough attempt to refine the model outputs. The incorporation of the 1991 LULC map further anchors the calibration and Validation to a specific temporal context, providing a more precise representation of the catchment conditions during that period. The employment of statistical indices like NSE, R2, and PBIAS offers a quantitative assessment of the calibration and The Validation, comparing the simulated data against measured values to gauge the model’s predictive reliability. This meticulous calibration and Validation process is essential for developing a robust model that can inform water resource management and planning in the catchment area.
The calibration and validation coefficients for the observed and modeled streamflow were assessed using three statistical indicators: Nash-Sutcliffe Efficiency (NSE), coefficient of determination (R2), and Percent Bias (PBIAS). For Calibration, the results indicated that the NSE was 0.76, suggesting a very good model performance. The R2 value was 0.80, indicating a strong correlation between observed and modeled data. Meanwhile, the PBIAS was 1.21, which implies that the model predictions are on average higher than the observed values. For Validation, R2, NSE, and PBIAS were 0.81, 0.79, and 1.34. Overall, these metrics suggest that the model is reliable for simulating streamflow within the calibration and validation period.
Figure 5 illustrates that the daily measured and modeled streamflow are consistent with the predictions of the chosen parameters, as per the calibration and Validation results of the statistical model evaluator. The SWAT model tends to predict higher daily stream flows than observed and lower values for minimal stream flows. However, it performs better in simulating medium stream flows. This overestimation is attributed to SWAT’s heightened sensitivity to periods of significant streamflow, particularly during the rainy season, as noted by Spruill et al., in 2000. These findings suggest that while the SWAT Cup model is adept at simulating medium flows, accurate simulation of high and low flows requires meticulous parameter tuning and iterative calibration and Validation. Consequently, the calibration and validation outcomes endorse the use of the SWAT model for streamflow simulation in the Rwanda Hydro-Unity Network, contingent on the careful selection of critical streamflow parameters. During the period under observation, a consistent correlation was noted between stream flow and rainfall; periods with higher rainfall coincided with increases in stream flow.
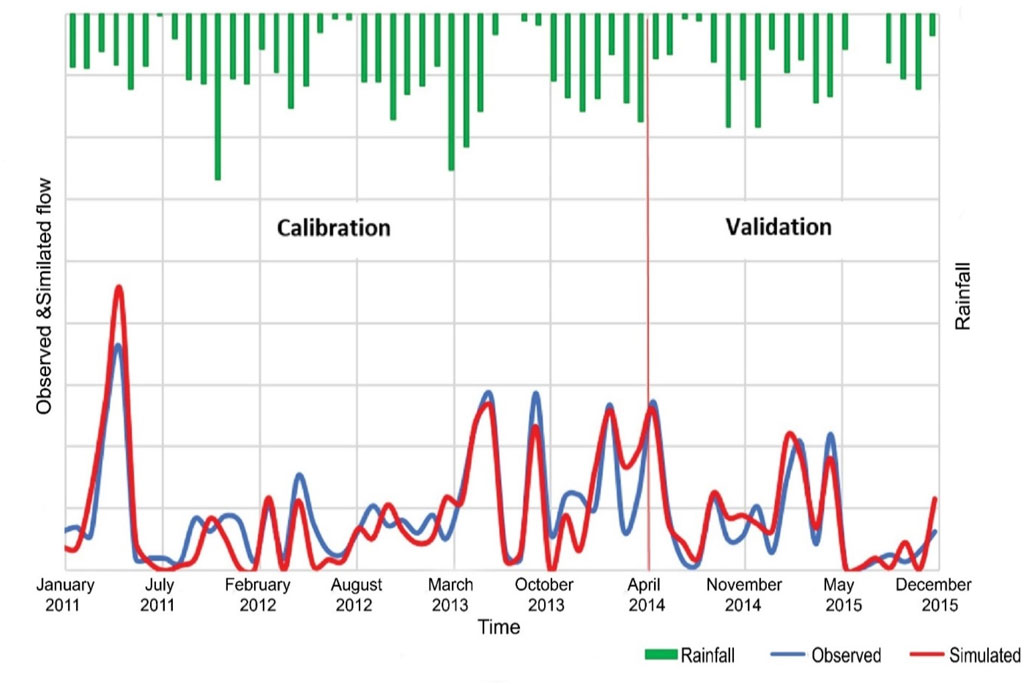
Figure 5. Calibrated and validated hydrograph for daily streamflow analysis of Rwanda hydro-unity network.
3.5 Climatic water balance model results
The catchment’s seasonal Potential Evapotranspiration (PET) was determined using 3 decades of climatic data, spanning from 1991 to 2020. This calculation of seasonal PET is crucial as it provides a clear understanding of the water balance, which is closely linked to the periods of crop cultivation. Consequently, the PET values were established for each of the four distinct seasons: the extended period of rainfall from March to May, the prolonged dry spell between June and September, the brief rainy interval occurring from October to November, and the short dry phase from December to February.
Figure 6 illustrates that during the Short rain season, typically spanning October to November, the Rwanda Hydro-Unity Network’s potential evapotranspiration (PET) consistently exceeded 200 mm per day across several years. The peak PET measurement reached 246 mm per day within this same period. In comparison, the Long Dry Season, from June to September, exhibited PET values that were notably higher than those recorded during the Short dry season (December to February) and Long Rain Season (March to May) seasons. Notably, the Long rain season and Short Rain seasons experienced greater fluctuations in PET. Evapotranspiration plays a crucial role in the hydrological cycle, impacting both the volume and quality of surface water, as noted by Feng et al. (2020). Despite the Rwanda Hydro-Unity Network catchment showing trends of increasing streamflow, the elevated PET levels have had a significant effect on the availability of surface water.
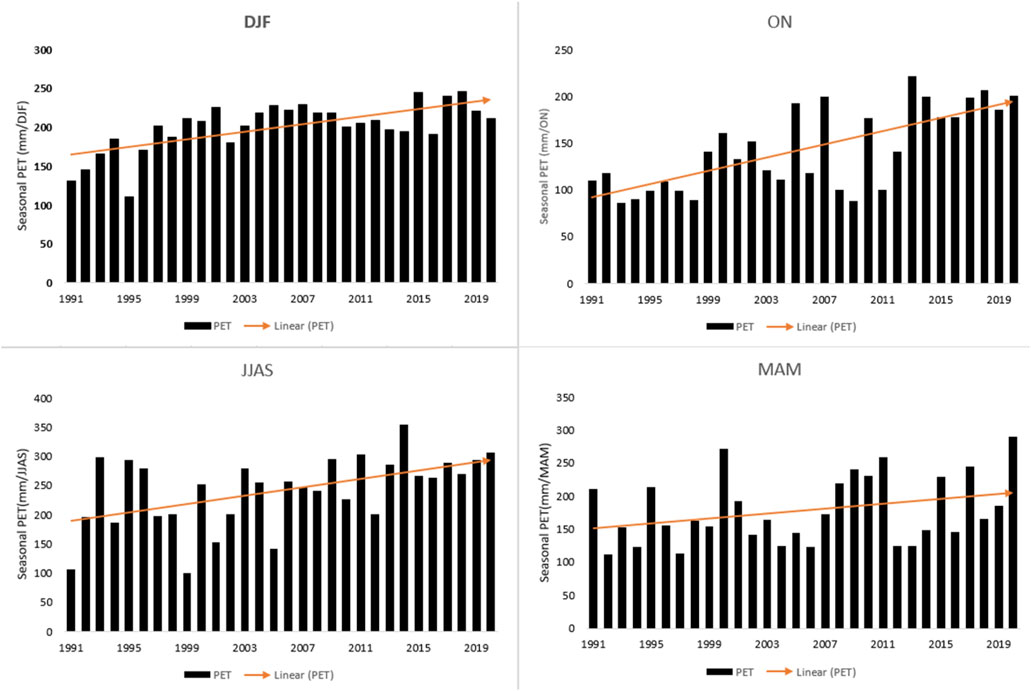
Figure 6. Seasonal evapotranspiration patterns of Rwanda’s hydro-unity network (1991–2020).
The analysis using the Mann-Kendall trend method revealed a notable rise in PET trends, with a 95% confidence level, during the Short rain season (ON) and Long rain season (MAM) (Table 6). Similarly, the Long dry season (JJAS) season exhibited a considerable upward trend in PET, with a 90% confidence level, as documented in the study (Table 7). The Rwanda Hydro-Unity Network experiences higher temperatures during the Short (ON) and Long rain season (MAM), as reported by Ngarukiyimana et al. (2021), hence, highly vulnerable to climate change. These seasons, Short rain (ON) and Long Rain (MAM), are crucial for rainfall in the basin and across Rwanda, marking a period when farmers are heavily involved in agricultural activities, predominantly in the rainfed farming system, as highlighted by Jonah et al. (2021).
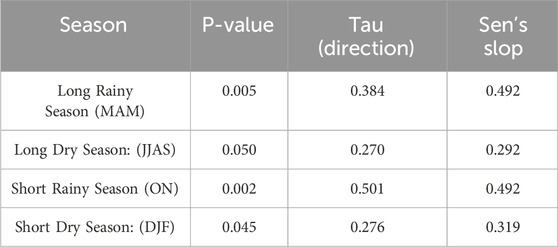
Table 6. Seasonal trend patterns for PET applying Mann-Kendall and Sen’s slope.
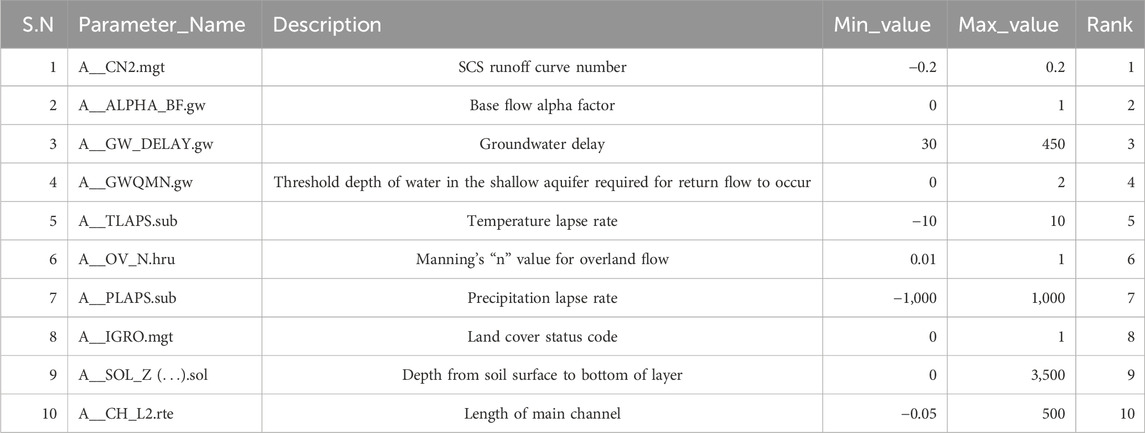
Table 7. Variables employed in the sensitivity analysis of the SWAT model.
The Rwanda Hydro-Unity Network catchment’s climatic water balance demonstrates seasonal fluctuations, reflecting the changes in precipitation and temperature throughout the year. Figure 7 illustrates that the Long Dry Season (JJAS), spanning June to September, has consistently exhibited a negative water balance over a span of 30 years, signifying a period of aridity. The dry months bring a pronounced dryness to the region, resulting in a substantial water balance shortfall. In contrast, the Short rain and dry seasons, occurring from December to February and October to November respectively, display a mix of positive and negative climatic water balances. However, it is the positive balances that are more prevalent. The short dry (DJF) season marks a time of transition, where the focus shifts from the cultivation phase to the harvesting of key crops. Concurrently, the Short rain season (ON) is a preparatory period for rainfed agriculture, which is a common practice across the catchment area.
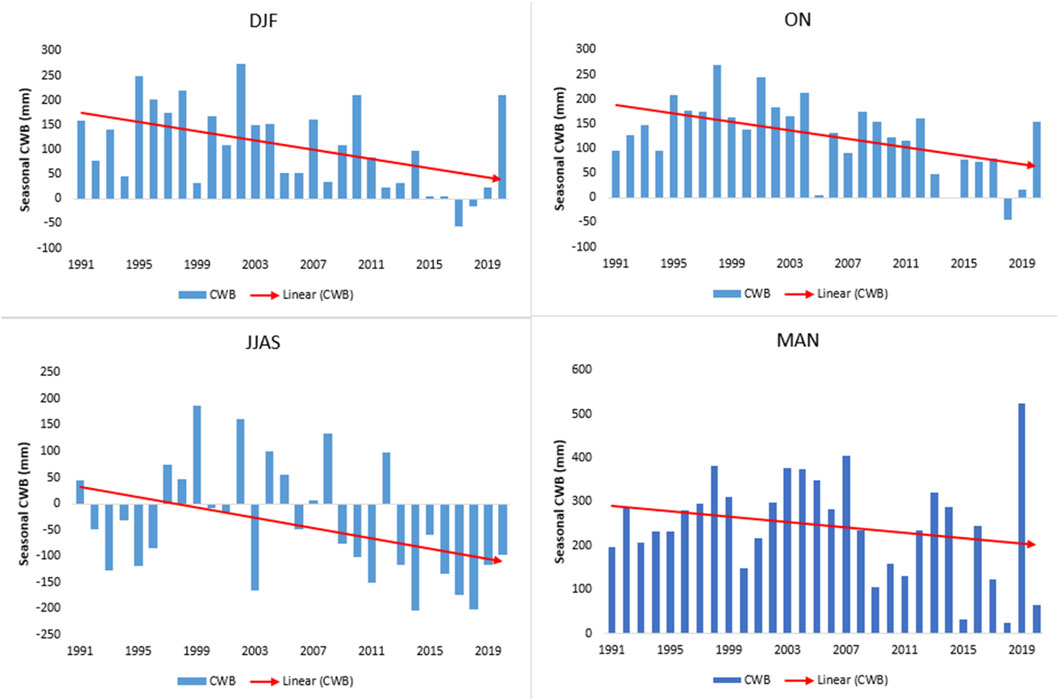
Figure 7. Temporal changes in seasonal water balance of Rwanda hydro–unity network (1991–2020).
In the Rwanda Hydro-Unity Network catchment area, the period from March to May, spanning is recognized as the primary rainy season. Consequently, as depicted in Figure 7, the Climatic Water Balance (CWB) is predominantly high and favorable, with only 2 years being the exception when compared to other seasons. Notably, the CWB has exceeded 500 mm during this period. This abundance of water is vital for the rain-dependent agriculture within the catchment (Uwimbabazi et al., 2022). The majority of the agricultural planting coincides with this season, and conversely, a lack of water during the Long Dry Season (JJAS), from June to September, signals potential drought conditions affecting future harvests, as indicated by Miklyaev et al. (2020).
In the period from 2017 to 2019, the CWB recorded low values across all seasons, as depicted in Figure 7. This trend was attributed to an increase in Potential Evapotranspiration (PET) coupled with a decrease in precipitation levels. Similarly, Niyonsenga et al. (2024) observed that the recent period has been marked by meteorological drought conditions within the whole country of Rwanda where included our study area. Areas that were once moist are now experiencing dryness, and droughts are emerging in regions of the basin that historically did not experience such conditions.
The seasonal CWB Mann Kendall t-test results corroborated the initial findings. Table 8 reveals that, there was a notable downward trend in CWB during the four seasons. Specifically, the Long dry season’s CWB trend was significant at the 94% level, while the Short Rain and Long Rain seasons’ trends were significant at the 89% level. It's possible that the elevated PET trends during the Long Dry contributed to the steeper declines in CWB. Over a span of 30 years, the Rwanda Hydro-Unity Network catchment’s seasonal CWB experienced a marked reduction, which aligns with the diminished water availability from 1991 to 2020, suggesting a prevailing meteorological drought in recent times.
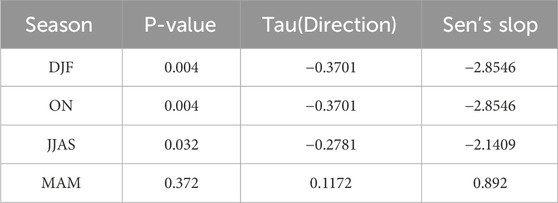
Table 8. Seasonal trend analysis of CWB using Mann-Kendall and Sen’s slope.
3.6 Impact of land use and land cover changes on surface water availability
The SWAT model’s ability to measure surface water through various parameters was demonstrated in the Rwanda Hydro-Unity Network catchment, using land use and land cover (LULC) data from 1991 to 2020. This comparison revealed an increase in average surface runoff from 144.99 mm to 201.73 mm over the period, influenced by changes in LULC classifications, particularly in built-up and cropland, which grew by 1.8% and 38.8%, respectively. The urban sprawl of Kigali City, situated within the catchment area, has been encroaching on adjacent rural zones, contributing to this trend. The study suggests that urbanization enhances the horizontal water flow on the surface, leading to higher runoff levels.Weatherl, Henao Salgado (Weatherl et al., 2021) noted that urban areas expedite lateral water movement, thereby increasing runoff. The surge in runoff is primarily linked to LULC alterations, as other factors like aquifer recharge and soil percolation showed a decline during the same timeframe (Table 9).
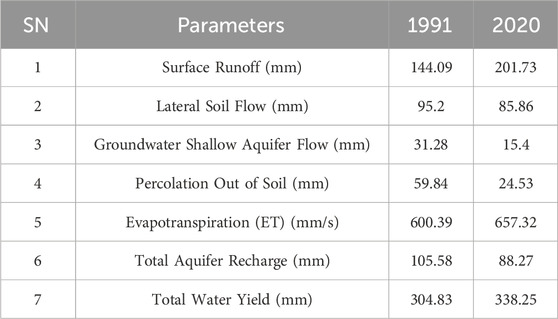
Table 9. Parameters of water availability under the LULC scenarios from 1991 to 2020 in the Rwanda Hydro-Unity Network catchment area.
During the period of study, the catchment’s total water yield saw an upward trend. The 1991 and 2020 land use and land cover (LULC) scenarios reveal a notable increase in water yield, quantified at 33.42 mm. This rise in both surface runoff and water yield has been linked to severe climate occurrences, specifically flooding, within the catchment area. The Rwanda Hydro-unity Network catchment has witnessed a surge in such extreme weather events in recent times. Urban expansion in Kigali City from 1991 to 2020 has heightened the city’s vulnerability to floods. The study indicates that despite the lack of a significant long-term change in precipitation patterns, it is the augmented surface runoff that primarily drives the increased frequency of flood events.
4 Discussion
The study examines the effects of land use and land cover (LULC) changes on streamflow and water availability in the Rwanda Hydro-Unity Network catchment, part of the Nile River basin. Using the SWAT and Climatic Water Balance (CWB) models, the study analyzes hydrological changes from 1991 to 2020. The results indicate a significant transformation in LULC, with cropland increasing from 33.2% to 72.0% and built-up areas expanding from 0.9% to 2.7%, while forest cover declined drastically from 49.9% to 11.8%. These changes have led to increased surface runoff (rising from 144.99 mm in 1991 to 201.73 mm in 2020), higher water yield (304.83 mm–338.25 mm), and reduced groundwater recharge, exacerbating the risk of flooding and water scarcity.
The study finds that surface runoff has increased due to urbanization and deforestation, which reduce infiltration rates. The SWAT model shows a rise in runoff from 144.99 mm in 1991 to 201.73 mm in 2020, leading to higher overland flow and flood risks. Additionally, groundwater recharge has declined due to reduced vegetation cover, limiting the soil’s ability to retain and slowly release water. This hydrological shift has significant implications for water security, particularly in the dry season when water availability is already low. While the increase in water yield might seem beneficial, it is primarily driven by excessive runoff, which can contribute to soil erosion and declining water quality.
Climate variability also plays a role in the changing hydrological patterns, although the study finds LULC changes to be a more dominant factor. The Mann-Kendall trend analysis shows an increase in streamflow and temperatures over the 30-year period, while precipitation changes were less significant. Rising temperatures have increased potential evapotranspiration (PET), worsening water deficits, especially during the long dry season (June–September). The CWB model indicates a seasonal decline in water balance, emphasizing the vulnerability of the catchment to prolonged droughts. The increasing PET rates reduce groundwater recharge and available surface water, making the region more susceptible to water shortages.
Flood risks are particularly high in urban areas like Kigali due to the rapid expansion of impervious surfaces. The study highlights that built-up areas have grown, leading to a loss of natural infiltration zones, which accelerates surface runoff and increases flood hazards. The findings align with previous research, showing that urban expansion without proper drainage planning exacerbates flooding risks. To mitigate this, the study suggests implementing urban flood management strategies such as improved drainage infrastructure, green spaces, and wetland restoration. Additionally, capturing and storing excess surface runoff for irrigation and urban agriculture could help manage floods while improving food security.
To address these hydrological challenges, the study calls for integrated land and water management strategies. Reforestation, agroforestry, and wetland conservation are critical in enhancing groundwater recharge and reducing excessive runoff. Additionally, climate adaptation measures such as improved water storage infrastructure (e.g., reservoirs and rainwater harvesting) and promoting drought-resistant crops can help increase resilience to climate variability. While the study provides valuable insights, it acknowledges limitations in model calibration and data availability, particularly regarding PET estimation methods. Future research should incorporate socioeconomic factors, such as population growth and land tenure, to develop more comprehensive land and water resource management policies.
5 Conclusion
This study assessed the impacts of land use and land cover (LULC) changes on streamflow and water availability in the Rwanda Hydro-Unity Network catchment using the SWAT and Climatic Water Balance models. The results indicate significant LULC transformations between 1991 and 2020, including rapid agricultural expansion and urbanization, leading to increased surface runoff, higher water yield, and reduced groundwater recharge. Additionally, climate variability has exacerbated seasonal water deficits and increased potential evapotranspiration, making the catchment more vulnerable to water shortages and flooding. The results showed that (1) LULC Changes: Cropland increased from 33.2% to 72.0%, Built-up areas expanded from 0.9% to 2.7% and Forest cover declined from 49.9% to 11.8%. (2) Hydrological Changes: Surface runoff increased from 144.99 mm to 201.73 mm, Total water yield rose from 304.83 mm to 338.25 mm, Groundwater recharge declined from 105.58 mm to 88.27 mm and Evapotranspiration increased from 600.39 mm to 657.32 mm. (3) Climate Variability and Water Balance: Higher temperatures increased PET, exacerbating seasonal water shortages, the long dry season (June–September) experienced the most significant water deficits. (4) Flood Risks and Adaptation Strategies: Urbanization has led to increased flood risks, especially in Kigali, implementing green infrastructure, wetland restoration, and improved urban drainage is necessary to mitigate flooding. Given these findings, the study calls for integrated land and water resource management, including sustainable land-use practices, reforestation, and improved urban water management systems. Strengthening climate adaptation measures, such as developing water storage infrastructure and promoting drought-resistant crops, will enhance the resilience of the catchment against future environmental changes. By implementing these strategies, Rwanda can achieve long-term water security and sustainable development.
Data availability statement
The raw data supporting the conclusions of this article will be made available by the authors, without undue reservation.
Ethics statement
Ethical approval was not required for the studies involving humans because Ethical approval was not required for this research because it relied solely on publicly available hydrological, climatic, and land use data, without involving human subjects, animals, or sensitive personal information. The studies were conducted in accordance with the local legislation and institutional requirements. Written informed consent for participation was not required from the participants or the participants’; legal guardians/next of kin in accordance with the national legislation and institutional requirements because Written informed consent was not required for this research because it did not involve human participants, personal data, or any interventions affecting individuals.
Author contributions
EH: Conceptualization, Data curation, Formal Analysis, Funding acquisition, Investigation, Methodology, Project administration, Resources, Software, Supervision, Validation, Visualization, Writing–original draft, Writing–review and editing. CX: Conceptualization, Formal Analysis, Funding acquisition, Project administration, Supervision, Writing–review and editing. AK: Conceptualization, Formal Analysis, Writing–review and editing. JN: Methodology, Software, Validation, Writing–review and editing. JU: Data curation, Methodology, Visualization, Writing–review and editing, Writing–original draft. SN: Formal Analysis, Visualization, Writing–review and editing. AU: Data curation, Visualization, Writing–review and editing. CH: Conceptualization, Investigation, Visualization, Writing–review and editing.
Funding
The authors declare that financial support was received forthe research, authorship, and/or publication of this article. This study received financial support from the Tianshan Talent Project of Xinjiang Uygur 735 Autonomous Region, China (Grant number 2022TSYCLJ0056) and the Joint CAS-MPG Research Project (HZXM20225001MI).
Acknowledgments
We would like to acknowledge the Alliance of International Science Organizations (ANSO) scholarship for Young Talents for its material contributions to the doctoral studies (Ph.D.) of which this study is a part. Additionally, the authors greatly acknowledge the support received from the Xinjiang Institute of Ecology and Geography, Chinese Academy of Sciences (CAS).
Conflict of interest
The researchers have fully complied with ethical considerations regarding conflicts of interest and have stated that there is no conflict of interest to disclose.
Generative AI statement
The authors declare that no Generative AI was used in the creation of this manuscript.
Publisher’s note
All claims expressed in this article are solely those of the authors and do not necessarily represent those of their affiliated organizations, or those of the publisher, the editors and the reviewers. Any product that may be evaluated in this article, or claim that may be made by its manufacturer, is not guaranteed or endorsed by the publisher.
References
Akinyemi, F. O. (2017). Land change in the central Albertine rift: insights from analysis and mapping of land use-land cover change in north-western Rwanda. Appl. Geogr. 87, 127–138. doi:10.1016/j.apgeog.2017.07.016
Allen, R. G., Pruitt, W. O., Wright, J. L., Howell, T. A., Ventura, F., Snyder, R., et al. (2006). A recommendation on standardized surface resistance for hourly calculation of reference ETo by the FAO56 Penman-Monteith method. Agric. water Manag. 81 (1-2), 1–22. doi:10.1016/j.agwat.2005.03.007
Arnold, J. G., Srinivasan, R., Muttiah, R. S., and Williams, J. R. (1998). Large area hydrologic modeling and assessment part I: model development 1. JAWRA J. Am. Water Resour. Assoc. 34 (1), 73–89. doi:10.1111/j.1752-1688.1998.tb05961.x
Austin, K. G., Beach, R., Lapidus, D., Salem, M., Taylor, N., Knudsen, M., et al. (2020). Impacts of climate change on the potential productivity of eleven staple crops in Rwanda. Sustainability 12 (10), 4116. doi:10.3390/su12104116
Ayabagabo, P. (2018). Empirical analysis of seasonal rainfall variability and its associated effects on major food crop yields in Rwanda. Doctoral dissertation University of Nairobi. Available online at: https://erepository.uonbi.ac.ke
Baldi, P., Brunak, S., Chauvin, Y., Andersen, C. A. F., and Nielsen, H. (2000). Assessing the accuracy of prediction algorithms for classification: an overview. Bioinformatics 16 (5), 412–424. doi:10.1093/bioinformatics/16.5.412
Benjamin, N. (2024). Assessment of the impact of population growth on forest degradation in Rwanda case study gishwati forest (1990-2020). ULK.
Bucha, N. M., Goshime, D. W., Awas, A. A., and Asnake, A. B. (2024). Hydrologic responses contemplating to Land use Land cover change and water balance of Lake Chamo sub-basin of Ethiopia. Sustain. Water Resour. Manag. 10 (1), 29. doi:10.1007/s40899-023-01003-0
Budde, L. E., Bulatov, D., and Iwaszczuk, D. (2021). Identification of misclassified pixels in semantic segmentation with uncertainty evaluation. Int. Archives Photogrammetry, Remote Sens. Spatial Inf. Sci. 43, 441–448. doi:10.5194/isprs-archives-xliii-b2-2021-441-2021
Cong, Z., Shahid, M., Zhang, D., Lei, H., and Yang, D. (2017). Attribution of runoff change in the alpine basin: a case study of the Heihe Upstream Basin, China. Hydrological Sci. J. 62 (6), 1013–1028. doi:10.1080/02626667.2017.1283043
Congalton, R. G., and Green, K. (2019). Assessing the accuracy of remotely sensed data: principles and practices. CRC Press. Available online at: https://taylorfrancis.com
Droogers, P., and Allen, R. G. (2002). Estimating reference evapotranspiration under inaccurate data conditions. Irrigation drainage Syst. 16, 33–45. doi:10.1023/a:1015508322413
Duc, L., and Sawada, Y. (2023). A signal-processing-based interpretation of the Nash–Sutcliffe efficiency. Hydrology Earth Syst. Sci. 27 (9), 1827–1839. doi:10.5194/hess-27-1827-2023
Egide Hakorimana, A. K., Valentine, M., Lamek, N., Baptiste, N. J., Gasirabo, A., and Mindje, R. (2018). Assess. Land Cover Change using Landsat Data Satell. city Area South. Rwanda. Int. J. Acad. Res. 5 (Issue-12).
Fahsi, A., Tsegaye, T., Tadesse, W., and Coleman, T. (2000). Incorporation of digital elevation models with Landsat-TM data to improve land cover classification accuracy. For. Ecol. Manag. 128 (1-2), 57–64. doi:10.1016/s0378-1127(99)00272-8
Feng, S., Liu, J., Zhang, Q., Zhang, Y., Singh, V. P., Gu, X., et al. (2020). A global quantitation of factors affecting evapotranspiration variability. J. hydrology 584, 124688. doi:10.1016/j.jhydrol.2020.124688
Foody, G. M. (2020). Explaining the unsuitability of the kappa coefficient in the assessment and comparison of the accuracy of thematic maps obtained by image classification. Remote Sens. Environ. 239, 111630. doi:10.1016/j.rse.2019.111630
Gassman, P. W., Reyes, M. R., Green, C. H., and Arnold, J. G. (2007). The soil and water assessment tool: historical development, applications, and future research directions. Trans. ASABE 50 (4), 1211–1250. doi:10.13031/2013.23637
Gebreyesus, M., Rivera Garcia, A., Tuba, G., Kovács, G., Sinka, L., and Zsembeli, J. (2021). Climatic water balance in Hamelmalo, Eritrea. Acta Agrar. Debreceniensis (1), 69–76. doi:10.34101/actaagrar/1/8307
Guzha, A., Rufino, M., Okoth, S., Jacobs, S., and Nóbrega, R. (2018). Impacts of land use and land cover change on surface runoff, discharge and low flows: evidence from East Africa. J. Hydrology Regional Stud. 15, 49–67. doi:10.1016/j.ejrh.2017.11.005
Hargreaves, G. H., and Samani, Z. A. (1985). Reference crop evapotranspiration from temperature. Appl. Eng. Agric. 1 (2), 96–99. doi:10.13031/2013.26773
Hariri-Ardebili, M. A., and Mahdavi, G. (2023). Generalized uncertainty in surrogate models for concrete strength prediction. Eng. Appl. Artif. Intell. 122, 106155. doi:10.1016/j.engappai.2023.106155
Hassen, J. M. (2022). Understanding the impact of land use and land cover change on local hydrology: implications for long-term planning in the sore and Geba Watersheds, Southwestern Ethiopia. Open Access Libr. J. 9 (2), 1–16. doi:10.4236/oalib.1108161
Herman, J., Reed, P., and Wagener, T. (2013). Time-varying sensitivity analysis clarifies the effects of watershed model formulation on model behavior. Water Resour. Res. 49 (3), 1400–1414. doi:10.1002/wrcr.20124
Hester, D., Nelson, S. A. C., Cakir, H. I., Khorram, S., and Cheshire, H. (2010). High-resolution land cover change detection based on fuzzy uncertainty analysis and change reasoning. Int. J. Remote Sens. 31 (2), 455–475. doi:10.1080/01431160902893493
Huo, A., Huang, Z., Cheng, Y., and Van Liew, M. W. (2020). Comparison of two different approaches for sensitivity analysis in Heihe River basin (China). Water Supply 20 (1), 319–327. doi:10.2166/ws.2019.159
Jonah, K., Wen, W., Shahid, S., Ali, M. A., Bilal, M., Habtemicheal, B. A., et al. (2021). Spatiotemporal variability of rainfall trends and influencing factors in Rwanda. J. Atmos. Solar-Terrestrial Phys. 219, 105631. doi:10.1016/j.jastp.2021.105631
Kiprotich, P., Wei, X., Zhang, Z., Ngigi, T., Qiu, F., and Wang, L. (2021). Assessing the impact of land use and climate change on surface runoff response using gridded observations and swat+. Hydrology 8 (1), 48. doi:10.3390/hydrology8010048
Liu, Z., Rong, L., and Wei, W. (2023). Impacts of land use/cover change on water balance by using the SWAT model in a typical loess hilly watershed of China. Geogr. Sustain. 4 (1), 19–28. doi:10.1016/j.geosus.2022.11.006
Macharia, D., Mugabo, L., Kasiti, F., Noriega, A., MacDonald, L., and Thomas, E. (2023). Streamflow and flood prediction in Rwanda using machine learning and remote sensing in support of rural first-mile transport connectivity. Front. Clim. 5, 1158186. doi:10.3389/fclim.2023.1158186
Mahmoud, S. H., and Gan, T. Y. (2018). Impact of anthropogenic climate change and human activities on environment and ecosystem services in arid regions. Sci. Total Environ. 633, 1329–1344. doi:10.1016/j.scitotenv.2018.03.290
Mango, L. M., Melesse, A. M., McClain, M. E., Gann, D., and Setegn, S. G. (2011). Land use and climate change impacts on the hydrology of the upper Mara River Basin, Kenya: results of a modeling study to support better resource management. Hydrology earth Syst. Sci. 15 (7), 2245–2258. doi:10.5194/hess-15-2245-2011
Mapes, K. L., and Pricope, N. G. (2020). Evaluating SWAT model performance for runoff, percolation, and sediment loss estimation in low-gradient watersheds of the Atlantic coastal plain. Hydrology 7 (2), 21. doi:10.3390/hydrology7020021
Miklyaev, M., Jenkins, G., and Shobowale, D. (2020). Sustainability of agricultural crop policies in Rwanda: an integrated cost–benefit analysis. Sustainability 13 (1), 48. doi:10.3390/su13010048
Mkonda, M. Y. (2022). Sustainable management of wetlands in east Africa: a case of Akagera Wetland in the north-western Tanzania. Environ. Sustain. Indic. 16, 100210. doi:10.1016/j.indic.2022.100210
Mokaya, S. K., Mathooko, J. M., and Leichtfried, M. (2004). Influence of anthropogenic activities on water quality of a tropical stream ecosystem. Afr. J. Ecol. 42 (4), 281–288. doi:10.1111/j.1365-2028.2004.00521.x
Muhire, I., Ahmed, F., and Abutaleb, K. (2015). Relationships between Rwandan seasonal rainfall anomalies and ENSO events. Theor. Appl. Climatol. 122, 271–284. doi:10.1007/s00704-014-1299-4
Munyantarama, J. P. (2016). “Impact of land husbandry technologies on the improvement of soil erosion control in Rwanda: a case of land husbandry water harvesting and hillside irrigation (lwh) project site,” in Nyanza 23. Doctoral dissertation. University of Rwanda. Available online at: https://dr.ur.ac.rw
Musafiri, I. (2016). Effects of population growth on smallholder farmers' productivity and consumption in Rwanda: a long-term analysis. Asian J. Agric. Ext. Econ. & Sociol. 12 (4), 1–11. doi:10.9734/ajaees/2016/27693
Nabahungu, N., and Visser, S. (2011). Contribution of wetland agriculture to farmers' livelihood in Rwanda. Ecol. Econ. 71, 4–12. doi:10.1016/j.ecolecon.2011.07.028
Nambajimana, J. d.D., He, X., Zhou, J., Justine, M. F., Li, J., Khurram, D., et al. (2019). Land use change impacts on water erosion in Rwanda. Sustainability 12 (1), 50. doi:10.3390/su12010050
Nduwayezu, G., Manirakiza, V., Mugabe, L., and Malonza, J. M. (2021). Urban growth and land use/land cover changes in the post-genocide period, Kigali, Rwanda. Environ. Urbanization ASIA 12 (1_Suppl. l), S127–S146. doi:10.1177/0975425321997971
Ngarukiyimana, J. P., Fu, Y., Sindikubwabo, C., Nkurunziza, I. F., Ogou, F. K., Vuguziga, F., et al. (2021). Climate change in Rwanda: the observed changes in daily maximum and minimum surface air temperatures during 1961–2014. Front. Earth Sci. 9, 619512. doi:10.3389/feart.2021.619512
Niyonsenga, S., Eziz, A., Kurban, A., Yuan, X., Umwali, E. D., Azadi, H., et al. (2024). Spatiotemporal analysis of drought characteristics and their impact on vegetation and crop production in Rwanda. Remote Sens. 16 (8), 1455. doi:10.3390/rs16081455
Ntirenganya, F. (2018). Analysis of rainfall variability in Rwanda for small-scale farmers coping strategies to climate variability. East Afr. J. Sci. Technol. 8 (8), P75–P96.
Rammal, M., and Berthier, E. (2020). Runoff losses on urban surfaces during frequent rainfall events: a review of observations and modeling attempts. Water 12 (10), 2777. doi:10.3390/w12102777
Rwanyiziri, G., Kayitesi, C., Mugabowindekwe, M., Byizigiro, R., Muyombano, E., Kagabika, M., et al. (2020). Spatio-temporal analysis of urban growth and its effects on wetlands in Rwanda: the case of Rwampara wetland in the city of Kigali. J. Appl. Sci. Environ. Manag. 24 (9), 1495–1501. doi:10.4314/jasem.v24i9.2
Safari, B., and Sebaziga, J. N. (2023). Trends and variability in temperature and related extreme indices in Rwanda during the past four decades. Atmosphere 14 (9), 1449. doi:10.3390/atmos14091449
Twahirwa, A., Oludhe, C., Omondi, P., Rwanyiziri, G., and Sebaziga Ndakize, J. (2023). Assessing variability and trends of rainfall and temperature for the district of Musanze in Rwanda. Adv. Meteorology 2023, 1–14. doi:10.1155/2023/7177776
Uwimana, A., van Dam, A., Gettel, G., Bigirimana, B., and Irvine, K. (2017). Effects of river discharge and land use and land cover (LULC) on water quality dynamics in Migina Catchment, Rwanda. Environ. Manag. 60, 496–512. doi:10.1007/s00267-017-0891-7
Uwimbabazi, J., Jing, Y., Iyakaremye, V., Ullah, I., and Ayugi, B. (2022). Observed changes in meteorological drought events during 1981–2020 over Rwanda, East Africa. Sustainability 14 (3), 1519. doi:10.3390/su14031519
Wang, W. D., Yu, X., Jia, G., and Wang, H. (2019). Sensitivity analysis of runoff to climate variability and land-use changes in the Haihe Basin mountainous area of north China, 269, 193, 203. doi:10.1016/j.agee.2018.09.025
Weatherl, R. K., Henao Salgado, M. J., Ramgraber, M., Moeck, C., and Schirmer, M. (2021). Estimating surface runoff and groundwater recharge in an urban catchment using a water balance approach. Hydrogeology J. 29 (7), 2411–2428. doi:10.1007/s10040-021-02385-1
Yáñez-Morroni, G., Suárez, F., Muñoz, J. F., and Lagos, M. S. (2024). Hydrological modeling of the Silala River basin. 2. Validation of hydrological fluxes with contemporary data. Wiley Interdiscip. Rev. Water 11 (1), e1696. doi:10.1002/wat2.1696
Zölch, T., Henze, L., Keilholz, P., and Pauleit, S. (2017). Regulating urban surface runoff through nature-based solutions–an assessment at the micro-scale. Environ. Res. 157, 135–144. doi:10.1016/j.envres.2017.05.023
Keywords: LULC, streamflow dynamics, Rwanda hydro-unity network, nile river basin, urbanization, water yield
Citation: Hakorimana E, Xi C, Kurban A, Nsanzabaganwa J, Umuhoza J, Niyonsenga S, Umugwaneza A and Habimana C (2025) Integrated assessment of land use/land cover changes and hydrological impacts in the nile river basin: a case study of Rwanda hydro-unity network. Front. Environ. Sci. 13:1575894. doi: 10.3389/fenvs.2025.1575894
Received: 14 February 2025; Accepted: 27 February 2025;
Published: 18 March 2025.
Edited by:
Nan Xu, Hohai University, ChinaReviewed by:
Jiaqi Yao, Tianjin Normal University, ChinaHuanyu Chang, Tianjin Normal University, China
Copyright © 2025 Hakorimana, Xi, Kurban, Nsanzabaganwa, Umuhoza, Niyonsenga, Umugwaneza and Habimana. This is an open-access article distributed under the terms of the Creative Commons Attribution License (CC BY). The use, distribution or reproduction in other forums is permitted, provided the original author(s) and the copyright owner(s) are credited and that the original publication in this journal is cited, in accordance with accepted academic practice. No use, distribution or reproduction is permitted which does not comply with these terms.
*Correspondence: Chen Xi, Y2hlbnhpQG1zLnhqYi5hYy5jbg==