
94% of researchers rate our articles as excellent or good
Learn more about the work of our research integrity team to safeguard the quality of each article we publish.
Find out more
ORIGINAL RESEARCH article
Front. Environ. Sci., 25 March 2025
Sec. Atmosphere and Climate
Volume 13 - 2025 | https://doi.org/10.3389/fenvs.2025.1558934
 Cong Yang1,2
 Deyan Liu3*Ye Li1Junjie Li1,2Huijie Zheng1,2Yanhong Dong1,2
 Junji Yuan1
 Zengming Chen1Lei Chen4
 Weixin Ding1,5*
Dairy effluents instead of mineral fertilizer can realize nutrients recycling while urease inhibitors have been proposed as fertilizer amendments to maximize nutrients utilization and reduce negative environmental effects. However, studies on the impacts of dairy effluent combined with urease inhibitors on nitrous oxide (N2O) and nitric oxide (NO) emissions remain limited. Here, a 2-year field trail with maize was conducted in a sandy soil with four treatments: no nitrogen (N) fertilizer (Control), mineral N fertilizer urea (NPK), fermented dairy effluent as liquid fertilizer (LF), and LF plus urease inhibitor hydroquinone (LFHQ). Cumulative N2O emission in the NPK treatment was 0.44 kg N ha‒1 during the 2021 maize season while drastically increased to 5.21 kg N ha‒1 during the 2022 maize season with extreme precipitation occurred, while NO emission reduced from 0.65 to 0.17 kg N ha‒1. Compared with the NPK treatment, N2O and NO emissions in the LF treatment decreased by 38.6% and 29.2%, and by 38.8% and 6.4% during the 2021 and 2022 maize seasons, respectively. Compared with the LF treatment, the LFHQ treatment increased N2O emissions by 40.7% and 21.7% during the 2021 and 2022 maize seasons, respectively. The N2O emission factors (EF-N2O) of applied N was 0.90–1.71% during the 2022 maize season, which was ten times greater than the 2021 maize season. We further evaluated correlation between EF-N2O of mineral N fertilizer and annual precipitation in temperate sandy soils by compiling published literature, suggesting that there was a quadratic relationship between EF-N2O and precipitation, with the highest EF-N2O occurring at ∼690 mm of precipitation. Accordingly, extreme precipitation would induce explosive N2O emissions at optimal scenario. Overall, our results suggest that replacing mineral fertilizers with dairy effluent mitigated N2O and NO emissions while heavy rainfall could cause N2O paroxysmal emission. Thus, rational water management in temperate farms is particularly required to avoid N2O surge emission after heavy rainfall events, and urease inhibitors co-application with nitrification inhibitors are recommended under dairy effluent application.
Nitrous oxide (N2O) is a greenhouse gas (GHG) with a long atmospheric lifespan and a heat-trapping ability 273 times stronger than CO2 (IPCC, 2021). It has been regarded as the primary factor contributing to the depletion of stratospheric ozone (Bouwman et al., 2002; Ravishankara et al., 2009). Nitric oxide (NO) plays an important role in regulating of the tropospheric oxidant balance (Williams et al., 1992) and contributed to the acidification of ecosystems after being oxidized to nitrate and nitric acid (Nakahara et al., 2003). Cropland soil is a major source of N-containing gases, releasing 3.8–4.1 Tg of N2O-N and 1.6 Tg of NO-N into the atmosphere annually, accounting for about 60% and 40% of anthropogenic N2O and NO emissions, respectively (IPCC, 2013; Lassaletta et al., 2014; Tian et al., 2020). Hence, there is a growing need to develop strategies that can mitigate N2O and NO emissions and enhance N fertilizer utilization efficiency in agricultural landscapes.
Such strategies include replacing mineral fertilizer with organic fertilizer (Vallejo et al., 2005; Hu et al., 2013), co-application with urease inhibitors or other N transformation regulators (Zaman et al., 2008) and altering the application rate and stage of N fertilizer according to the crop’s nutrient uptake curve (Dalal et al., 2003; Sanz-Cobena et al., 2011; Wang et al., 2024). Applying organic fertilizer instead of mineral N fertilizer has a beneficial influence on both crop development and N retention (Reay et al., 2012; Pardo et al., 2015) by optimizing soil structure and properties (Wang et al., 2017; Well et al., 2024), adjusting the rate of nutrient release to keep long-term N availability (Cheng et al., 2017). However, most of the reported organic fertilizers were applied in the form of manure with high solids content and their effects on N2O and NO emissions were inconsistent (Vallejo et al., 2005; Ding et al., 2013). As noted by Bouwman et al. (2010), the reintegration of N from livestock waste into agricultural land has been shown to reduce soil N2O emissions. Conversely, Hayakawa et al. (2009) reported that the use of poultry manure on an Andisol led to a substantial increase in N2O emissions by 2 and 7 times greater, while concurrently decreasing NO emissions by 49–56% when compared to mineral fertilizers. In addition, no significant difference in N2O (Meng et al., 2005) as well as NO (Nartey et al., 2021) emissions was reported between the application of organic manure and mineral fertilizers. Dairy effluent as liquid organic fertilizer has been paid more attention because of its huge quantity as a consequence of the geographical concentration and specialization of dairy farms, and the pollution risk of improper treatment to neighboring environment (Sarkar et al., 2006; Karadag et al., 2015). According to Bristow et al. (1992) and Zaman et al. (2007), a significant portion (60–90%) of cow urine is composed of urea-N, while the remaining portion consists of a mixture of easily mineralizable amino acids and NH4+-N (Bolan et al., 2004). Nevertheless, few studies have reported influence of dairy effluent on N2O and NO emission in sandy soils.
Urease inhibitors can delay urea hydrolysis to avoid great increase of soil NH4+-N in a short time and are generally used in conjunction with mineral N fertilizer to mitigate NH3 loss (Manunza et al., 1999; Silva et al., 2017; Matse et al., 2024), while the results of their effects on N2O and NO emission were not uniform. Compared with single urea application, the addition of urease inhibitors significantly reduced N2O emissions by 23.5% in a soil with 52% sand (Krol et al., 2020) and by 75% in a soil with 55% sand (Abalos et al., 2012). However, Martins et al. (2017) reported that urease inhibitors upsurged N2O losses by 16.7% in a soil with 70% sand due to the prolongation of the nitrification process by the delayed urea hydrolysis. Oppositely, organic fertilizers in combination with urease inhibitors have been studied less frequently (Pereira et al., 2013; Park et al., 2021) and their synergistic effects on soil N2O and NO emissions warrant further. Among several common urease inhibitors, hydroquinone (HQ) lasts longer in soils for inhibiting urease activity and requires fewer amounts to achieve the same inhibitory effect (Wang et al., 1990). In addition, the effectiveness of urease inhibitors is not only related to inhibitor species and application ratio, the source and amount of N fertilizer, and soil texture, but more likely to vary with climatic factors such as precipitation (Abalos et al., 2017; Mira et al., 2017). A synthesis analysis of 182 research articles indicated that inhibitors could lead to a 70% decrease in N2O emissions when annual precipitation stayed below 400 mm, whereas the reduction effect was minimal when annual precipitation exceeded 800 mm (Fan et al., 2022).
As climate change ongoing, the severity and frequency of extreme precipitation events will be intensified around the world (Zhang and Zhou, 2019; Tan et al., 2021). Soil microbial processes that transform N in terrestrial ecosystems are substantially affected by precipitation and the consequent dynamics of soil water (Corre et al., 2002; Aranibar et al., 2004). The response of N2O emissions to rainfall variability has a tendency to increase (Zhang et al., 2022), remain stable (Shi et al., 2021) or decrease (Li et al., 2023). Few investigations have considered the large interannual variations in precipitation associated with the temperate sandy regions. Extreme precipitation was encountered during the maize season in the second year according to the definition of extreme precipitation events by Gimeno et al. (2022). The objectives of our research were to: 1) evaluate the influence of annual precipitation on the N2O emissions from sandy soils; 2) compare the impacts of dairy effluent and traditional mineral fertilizer on the emissions of N2O and NO; and 3) evaluate the effects of dairy effluent in combination with HQ on N2O and NO emissions.
An in situ trial was carried out in 2021 and 2022 on a silage planting farmland at the Youran dairy farm, Zhangwu County, Liaoning Province, China (122°32′24″E, 42°23′24″N), which was situated at the southern boundary of the Horqin Sandy Land. The area experiences a temperate continental monsoon climate, characterized by an average annual air temperature of 7.4°C and annual precipitation of 480 mm concentrated from June to September. The soil was categorized as sand based on the taxonomy of the United States Department of Agriculture (USDA). Before the experiment commenced, the top layer of soil (0–20 cm) exhibited a bulk density of 1.63 g cm-3 (intact core method (Ding et al., 2015)), pH of 6.7 (determination of leachate with a water:soil volume of 2.5:1 by glass electrode pH meter), soil organic C content of 2.86 g C kg‒1 (potassium dichromate oxidation by external heating), total N content of 0.29 g N kg‒1 (concentrated sulfuric acid digestion and Kjeldahl determination), and sand content of 90% (laser particle size analyzer LS13320 (ZX_2012)).
Four treatments were included: no N fertilizer (Control), conventional mineral N fertilizer urea (NPK), dairy effluent from open-air fermentation in oxidation ponds (LF), and dairy effluent plus HQ at the rate of 0.3% (He et al., 2018) of the total N application (LFHQ). The mortality rate of Ascaris lumbricoides eggs in the fermented dairy effluent is higher than 96%, and the value of fecal coliform bacteria is lower than 2.5 ×10³ MPN/L, which meet the standard of returning to the field. The properties of the dairy effluent are shown in Table 1. Four replicate plots per treatment in a randomized block design. Each plot had dimensions of 3 m × 7 m and the crop planted was maize (Zhengdan 958), with a spacing of 70 cm between rows and 25 cm between plants. The N application rate was 250 kg N ha‒1 in all fertilized treatments. Phosphate (75 kg P2O5 ha−1) and potassium (60 kg K2O ha−1) were used as primary fertilizers in the NPK treatment, and they were also used as supplements when insufficient amounts were introduced by the liquid dairy effluent. The urea and dairy effluent were split as basal fertilizer, first topdressing and second topdressing according to the N ratio of 40%:20%:40%. In 2021, the date of sowing and basal fertilization was July 5, and the two topdressing events were on August 6 and 24. In 2022, the sowing date was May 23, 3 days later basal fertilizer applied, and the two topdressing events occurred on June 17 and July 17. Detailed fertilization information is presented in Supplementary Figure S1. The application of mineral fertilizers was done manually, and the dairy effluent was sprayed on the soil surface through pipes. Considering the high sand content of the soil at the test site resulting in high soil permeability, dairy effluent with high water content was not tilled into the soil after application.
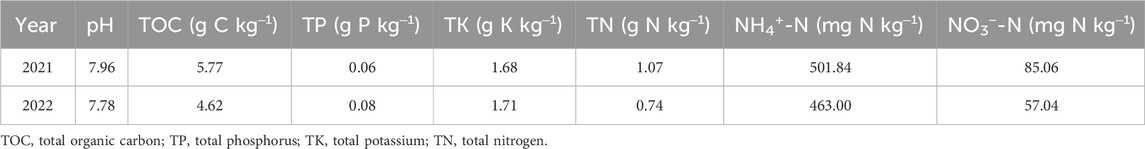
Table 1. Properties of dairy effluent.
The closed static chamber method was employed to measure the soil N2O fluxes (Ding et al., 2007). Prior to planting, the stainless base (60 cm × 20 cm × 10 cm) was pre-buried in soil, and a groove, measuring 5 cm depth, was specifically designed into the upper boundary of the base to facilitate water storage and sealing. A pair of special stainless chambers (30 cm × 20 cm × 15 cm) were buckled on the base, leaving space in the middle for maize growth. The chamber was set with two ports on its top surface. One port consisted of a silicone-sealed rubber hose connected to a plastic three-way valve, which allowed for sampling. The other port was designed to equalize air pressure within the chamber. In addition, there was also a small round hole for thermometer insertion to record the chamber temperature. Ding et al. (2007) have provided a detailed description of the chamber’s structure.
Gas collection throughout the maize growing season, i.e., about 110 days, on the first, second, fourth, and sixth days of the first week after each fertilization, and then the frequency was twice a week until the next fertilization. Three additional collections were taken at the end of the growing season to ensure that there were no differences in gas emissions between the fertilized and control treatments. On the day of sampling, placing the chambers inside the base groove and sealing using water, 40 mL of gas samples were extracted from the chamber with a syringe at 0, 10, 20 and 30 min since sealing and instantly injected into pre-evacuated vials fitted with butyl rubber stoppers. The gases in the vials were analyzed for N2O concentration by a gas chromatograph (Agilent 7890D, Agilent Technologies, Santa Clara, CA, United States) equipped with a63Ni electron capture detector (ECD) and operated at 250°C.
The static chamber method was also utilized to quantify NO fluxes. A 500 mL glass syringe is connected to a three-way valve through a rubber tube. When collecting gasses, the three-way valve at the end of the rubber tube is connected to the three-way valve used for gas collection on the chamber. Chamber air samples were collected at two time points: immediately after sealing and 30 min after sealing. The glass syringe first twitches back and forth two times to evenly mix the gasses in the chamber, and then draws about 1.5 L gas. These gas samples were then carefully stored in Teflon gas bags (Delin Gas Packing Co., LTD., Dalian, China), and determined using a NOx analyzer (Model 42i, Thermo Fisher Scientific Inc., Franklin, MA, United States).
The N2O and NO fluxes were determined by employing the subsequent equation:
where F is the gas (N2O or NO) flux (µg N m‒2 h‒1); ρ is the density of N2O or NO in the standard state, which is 1.25 kg m-3 or 1.339 kg m-3, respectively; h represents the height of chamber (m); Δc/Δt denotes the rate of change in gases concentration over time (R2 > 0.9); T is the temperature (°C) in the chamber; and 60 is used for unit conversion. Cumulative N2O and NO emissions were calculated using integration:
where
The N2O and NO emission factors (EF-N2O, EF-NO, %) of fertilizer N were calculated as follows:
where EN and EControl are the cumulative emissions of the N gases (kg N ha‒1) in the N-fertilized and no N application plots, respectively; and N-applied is the total amount of N application (kg N ha‒1).
The digital thermometers were utilized to measure the soil temperatures at depths of 5 cm (T5) during each gas sampling period. The soil moisture content was assessed using a time domain reflectometer (TDR, MP406B, Haian huating instrument co., Itd., China) and subsequently converted to soil water filled pore space (WFPS, %) via soil bulk density and soil porosity (Ding et al., 2013). A total of five soil samples were collected from each plot at the topsoil using a stainless steel sampler with height of 20 cm and inner diameter of 5 cm. After mixing evenly, a representative sample was used to measure the soil inorganic N (NH4+-N and NO3−-N) and dissolved organic C (DOC). Soil inorganic N was extracted with 2 M KCl (soil/KCl ratio of 1:5), agitated at a frequency of 220 rpm under 25°C for 60 min, stood for 10 min and then filtered through qualitative filter paper. The filtrate was stored in 30 mL plastic bottles and determined by a flow analyzer (Skalar, Netherlands). DOC was extracted with pure water (soil/water ratio of 1:5), agitated at a frequency of 220 rpm under 25°C for 30 min, then subjected to centrifugation at a speed of 8,000 rpm for 10 min. The supernatant after centrifugation was passed through 0.45 μm filter membrane with the aid of a pressure filter and the filtrate was analyzed with a TOC analyzer (Vario TOC Cube, Elementar, Hanau, Germany).
To further explore the response of N2O emissions to annual precipitation variability, this study collected relevant peer-reviewed publications spanning from 1995 to 2020 via the Web of Science, Google Scholar and China National Knowledge Infrastructure database using search terms of “sandy soil” and “N2O emission” or “nitrous oxide emission”, and only reports of field trials were considered. The screening criteria also included: 1) the trial site was in the temperate zone (23.5°–66.5° north or south of the equator); 2) the soil texture was sandy (higher than 50% sand and less than 15% clay (Hengl et al., 2017)); 3) the trial treatments covered the control without N fertilizer and the application of mineral N fertilizer; and 4) the test period included at least one complete growing season. Additionally, studies were also restricted to those with at least three replications per treatment. After verification of the retrieved literature, a total of 13 reports that met all of the above criteria were included (Supplementary Table S1). Information on annual precipitation and N2O emissions was obtained directly from the text and tables or extracted using the offline tool WebPlotDigitizer (version 4.2, Ankit Gupta), integrating the average daily N2O fluxes and accumulating the daily rainfall over the measurement period.
Statistical analyses and graphing were performed using the software of SPSS 26.0 (SPSS Inc., Chicago, IL, United States), Origin 2024 (Origin Lab, United States) and R 4.4.1 (Foundation for Statistical Computing, Vienna, Austria). A one-way analysis of variance (ANOVA) was conducted to analyze the gaseous nitrogen emissions, emission factors, average soil inorganic N fractions (NH4+-N, NO3−-N, TIN = NH4+-N + NO3−-N), and DOC after checking for variance homogeneity under different treatments. The Tukey test was performed at a significance level of 5%. To assess the normality of all dependent variables, we conducted the Kolmogorov-Smirnov test. Log transformations were conducted as necessary to fulfill the assumptions of normality. Pearson correlation was employed to access the correlation between the fluxes of N2O, NO and the soil substrate variables (NH4+-N, NO3−-N, TIN, DOC), and environment variables (soil WFPS and temperature). Random forest and partial least squares path models were constructed using the “randomForest” and “piecewiseSEM” packages in R software, respectively, to clarify the importance of substrate variables and soil WFPS on N2O emissions, as well as the exact relationship between them.
The average air temperatures were 23.0°C and 23.2°C during the 2021 and 2022 maize seasons, respectively (Figure 1A). The soil temperature at 5 cm depth in the 2021 and 2022 maize seasons varied from 9.9 to 33.0°C and 10.9–30.9°C, respectively (Figure 1B). The cumulative precipitation during the 2021 maize season was 408 mm while reached 712.2 mm during the 2022 maize season, with 25 days precipitation exceeding 10 mm. Soil WFPS increased following fertilization and precipitation, and averaged at 36% and 71% during the 2021 and 2022 maize seasons, respectively (Figure 1C). Due to continuous precipitation since sowing, soil WFPS in all the treatments exceeded 60% on the 32nd day and exceeded 90% on the 40th day after sowing during the 2022 maize season. At about 100th day after sowing, the continuous rainfall ended and soil WFPS began to decline.
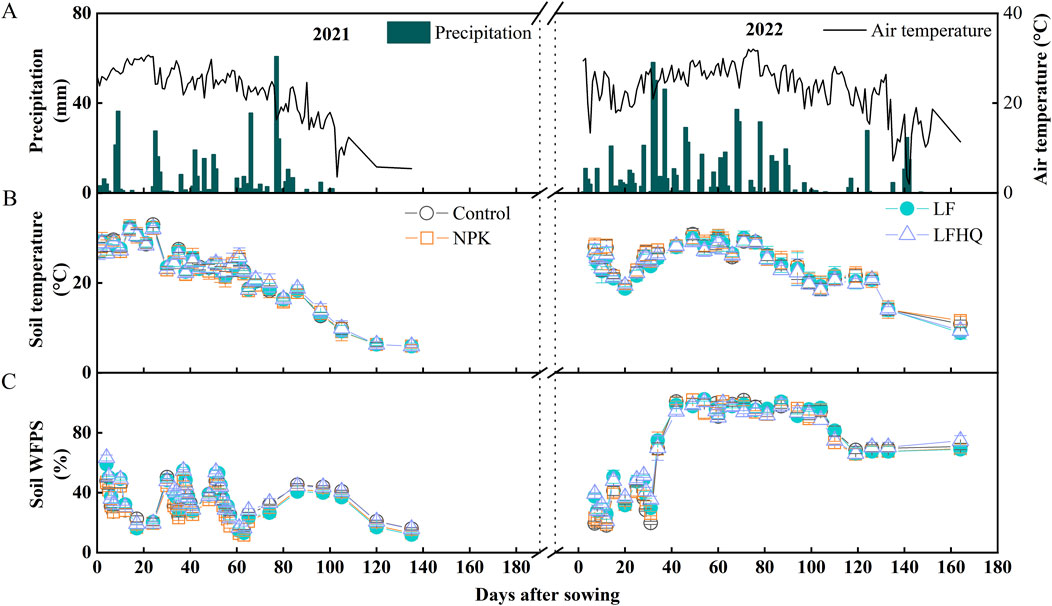
Figure 1. Temporal variation in air temperature and precipitation (A), soil temperature (B), and soil WFPS (C) during the 2021 and 2022 maize season. The vertical bars denote the standard error of the mean (n = 4). Control, no N fertilizer; NPK, N fertilizer urea; LF, dairy effluent; LFHQ, dairy effluent plus urease inhibitor.
Following basal fertilization and the first topdressing in the 2021 maize season, the NPK treatment exhibited significantly higher concentrations of soil NH4+-N and NO3−-N compared to the LF and LFHQ treatments (Figures 2A, B). After the second topdressing, soil NH4+-N and NO3−-N levels in the LF treatment showed a significant increase, surpassing those in the LFHQ treatment. The average concentration of NH4+-N, NO3−-N and TIN in the NPK treatment was 36.52, 11.63 and 48.15 mg N kg‒1, respectively, which was 46.90%, 4.88% and 33.94% higher than the correspondent values in the LF treatment (Figure 3). The average levels of NH4+-N, NO3−-N and TIN in the LFHQ treatment were 14.11, 9.41 and 23.52 mg N kg‒1, which decreased by 43.24%, 15.15% and 34.58%, respectively compared with the LF treatment.
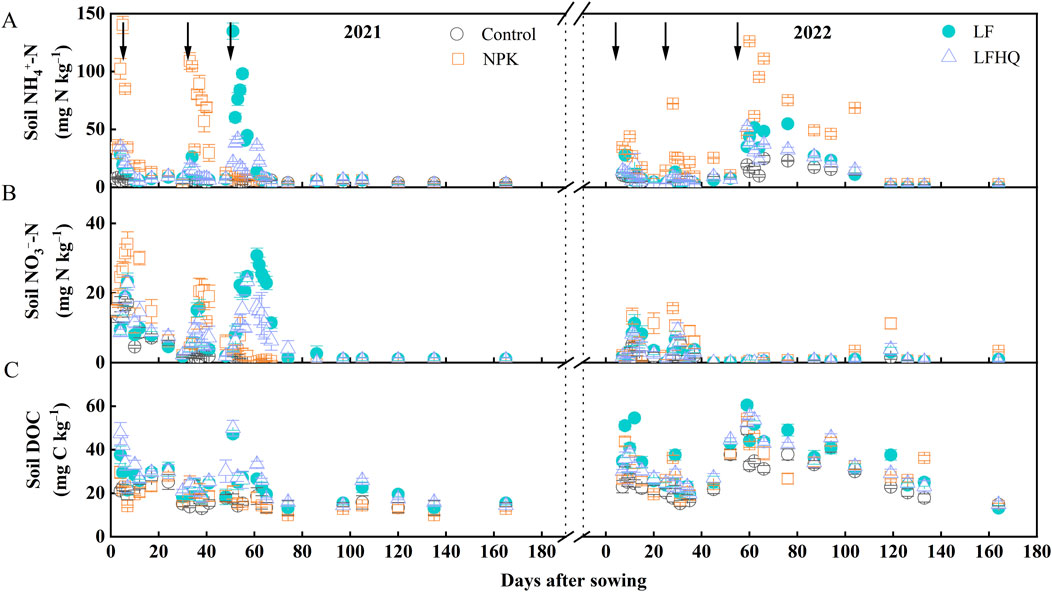
Figure 2. Variation of soil NH4+-N (A), NO3–-N (B) and soil DOC (C) concentration during the 2021 and 2022 maize season. Arrows indicate the application time of fertilizers. DOC, dissolved organic carbon (DOC). The vertical bars denote the standard error of the mean (n = 4). Control, no N fertilizer; NPK, N fertilizer urea; LF, dairy effluent; LFHQ, dairy effluent plus urease inhibitor hydroquinone.
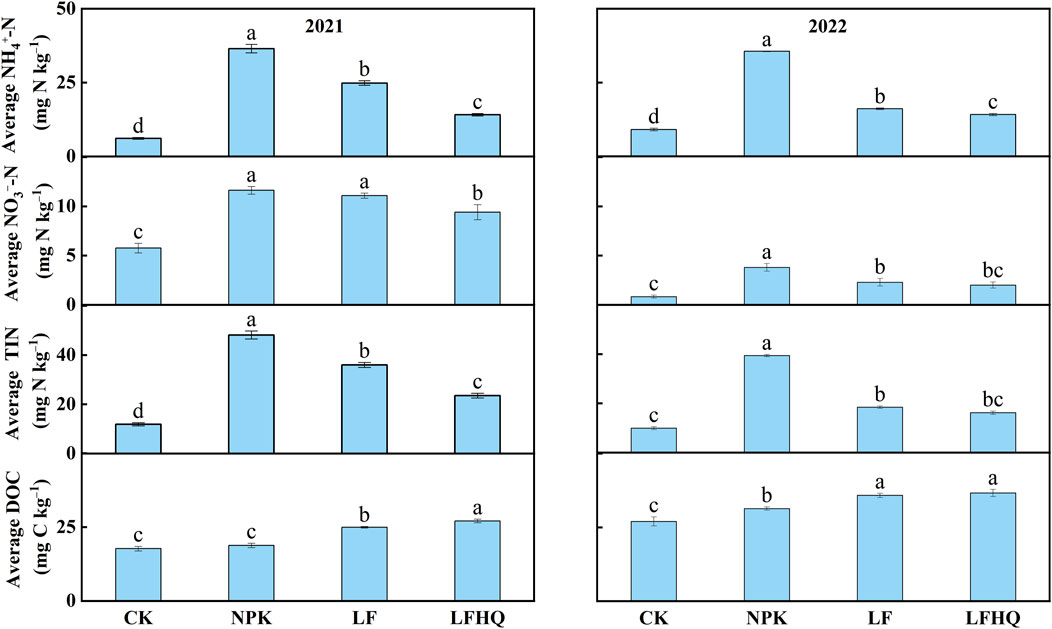
Figure 3. Average concentration of soil NH4+-N, NO3−-N, inorganic N (TIN, NH4+-N + NO3−-N) and dissolved organic carbon (DOC) during the 2021 and 2022 maize season. The vertical bars denote the standard error of the mean (n = 4). Control, no N fertilizer; NPK, N fertilizer urea; LF, dairy effluent; LFHQ, dairy effluent plus urease inhibitor hydroquinone. The different letters indicate significant differences among treatments at P < 0.05.
During the 2022 maize season, the soil NH4+-N and NO3−-N levels in all the treatments within 30 days after sowing were significantly lower than those during the 2021 maize season (Figures 2A, B). After the second topdressing, soil NH4+-N in the NPK treatment reached the highest level of 126.02 mg N kg‒1 on day 3. The dairy effluent application reduced the average levels of soil NH4+-N, NO3−-N and TIN from 35.61, 3.80, and 39.41 mg N kg‒1 in the NPK treatment to 16.14, 2.29, and 18.43 mg N kg‒1 in the LF treatment, respectively (Figure 3).
Soil DOC concentration in the LF and LFHQ treatment was higher than in the NPK treatment on all measurement of the 2-year trial, and the significant increase in DOC occurred within a week of fertilizer application (Figure 2C). The average soil DOC in the LF treatment during the 2021 and 2022 maize seasons were 24.95 and 35.82 mg C kg‒1, respectively, demonstrating increases of 32.6% and 14.29% compared to the NPK treatment, respectively (Figure 3). Compared with the LF treatment, the average DOC concentration of LFHQ treatment increased by 8.54% during the 2021 maize season.
Soil N2O fluxes in all the treatments were less than 100 μg N m‒2 h‒1 in the 2021 maize season, which was close to the values measured within 60 days after sowing during the 2022 maize season (Figure 4A). In 2022, in response to the continuous heavy precipitation and the end of the rainfall, soil moisture increased from 20% WFPS to more than 100% WFPS and then decreased, resulting in an abrupt change in N2O fluxes from a steady lower level to a peak, followed by a rapid decrease. The highest fluxes were observed at soil moisture levels down to 80–90% WFPS. The N2O peak fluxes in the N fertilized treatments appeared on day 50 after sowing during the 2021 maize season while on day 100 after sowing when continuous precipitation ended during the 2022 maize seasons. The NPK treatment had the highest N2O peak flux of 637 μg N m‒2 h‒1, which was significantly greater than in the LF (477 μg N m‒2 h‒1) and LFHQ (305 μg N m‒2 h‒1) treatments in the 2022 maize season.
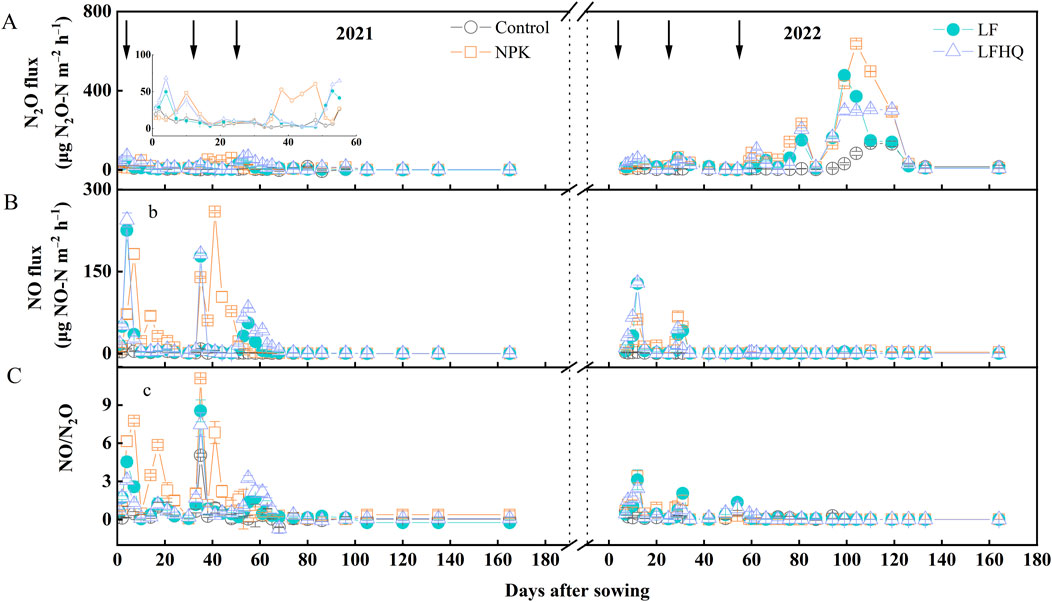
Figure 4. Temporal variation in N2O (A) and NO (B) fluxes, and the ratio of NO/N2O (C) during the 2021 and 2022 maize season. The vertical bars denote the standard error of the mean (n = 4). Control, no N fertilizer; NPK, N fertilizer urea; LF, dairy effluent; LFHQ: dairy effluent plus urease inhibitor hydroquinone. Arrows represent the application time of fertilizers.
The NO fluxes in the 2021 maize season were markedly higher than in the 2022 maize season (Figure 4B). After basal fertilization, the highest NO peak fluxes appeared in the LFHQ treatment, which were 244 and 129 μg N m‒2 h‒1 in the 2021 and 2022 maize season, respectively. After the first topdressing, the highest NO peak fluxes appeared in the NPK treatment, which were 259 and 68 μg N m‒2 h‒1 during the 2021 and 2022 maize season, respectively. In both maize seasons, the average ratio of NO flux to N2O flux (NO/N2O) was basically less than 1, except for 1 week after fertilization (Figure 4C). Additionally, the natural logarithm of the ratio between NO flux and N2O flux (ln (NO/N2O)) exhibited a negative correlation with soil WFPS during the 2021 maize season (Figure 5A). During the 2022 maize season, the ln (NO/N2O) showed a negative correlation with WFPS when soil WFPS was below 90%, while it showed a positive correlation with WFPS when soil WFPS was above 90% (Figure 5B).
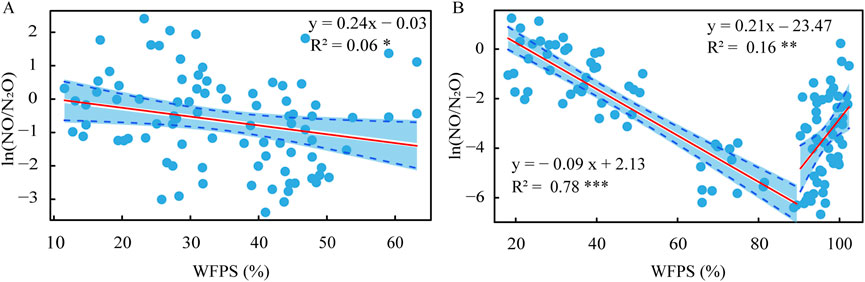
Figure 5. Relationship between soil moisture (WFPS) and the ratio of NO flux to N2O flux during the 2021 (A) and 2022 (B) maize season. The shadow represents the 95% confidence interval.
In the 2022 maize season, N2O emission in the same treatment exhibited an approximate tenfold increase compared to the emission of N2O in the 2021 maize season (Table 2). During the 2021 and 2022 maize seasons, the NPK treatment demonstrated the highest N2O emissions, with values of 0.44 and 5.21 kg N ha‒1, respectively. Compared to the NPK treatment, the sole application of dairy effluent (LF) resulted in a reduction of N2O emissions by 38.64% and 38.77% during the 2021 and 2022 maize seasons, respectively. Conversely, adding HQ to dairy effluent (LFHQ) significantly increased N2O emissions by 40.74% in 2021 and by 31.66% in 2022 compared with the LF treatment.
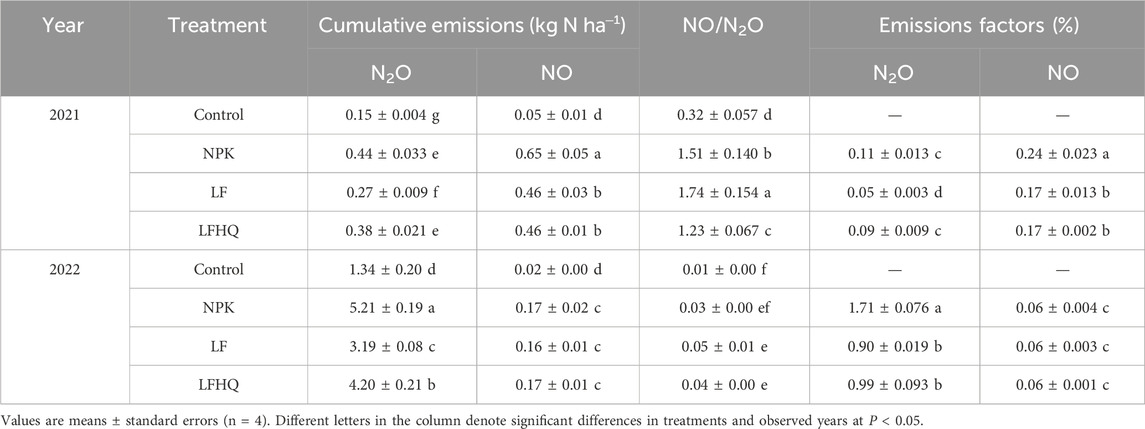
Table 2. Cumulative emissions and emission factors of N2O and NO.
During the 2022 maize season, the levels of NO emissions were lower compared to those observed in 2021 (Table 2). The NO emission in the NPK treatment was highest with 0.65 and 0.17 kg N ha‒1 in the 2021 and 2022 maize season, respectively. In the 2021 maize season, the LF treatment resulted in a 29.23% reduction in NO emissions compared to the NPK treatment. However, this reduction was not observed in the 2022 maize season.
For emission factors, the EF-N2O associated with the NPK treatment was 0.11% during the 2021 maize season, obviously greater than that in the LF treatment, and sharply increased to 1.71% in the 2022 maize season, significantly exceeding the value of 0.90% for the LF treatment and 0.99% for the LFHQ treatment. The EF-NO in the NPK treatment was highest at 0.24% during the 2021 maize season, 41.18% higher than those in the LF and LFHQ treatments.
Pearson correlation showed that N2O flux in the LF treatment was positively correlated with NH4+-N, TIN, DOC and WFPS in 2021 (Table 3). Throughout the monitoring period in 2022, no statistically significant linear relationship was found between N2O flux and substrate variables (NH4+-N, NO3−-N, TIN, DOC) or environmental factors (WFPS, T5) in all N fertilization treatments. In the 2021 maize season, there was a positive relationship between the NO flux in LFHQ treatment and soil NH4+-N and TIN. During the 2022 maize season, the NO flux showed a positive correlation with NO3− and a negative association with WFPS across all treatments.
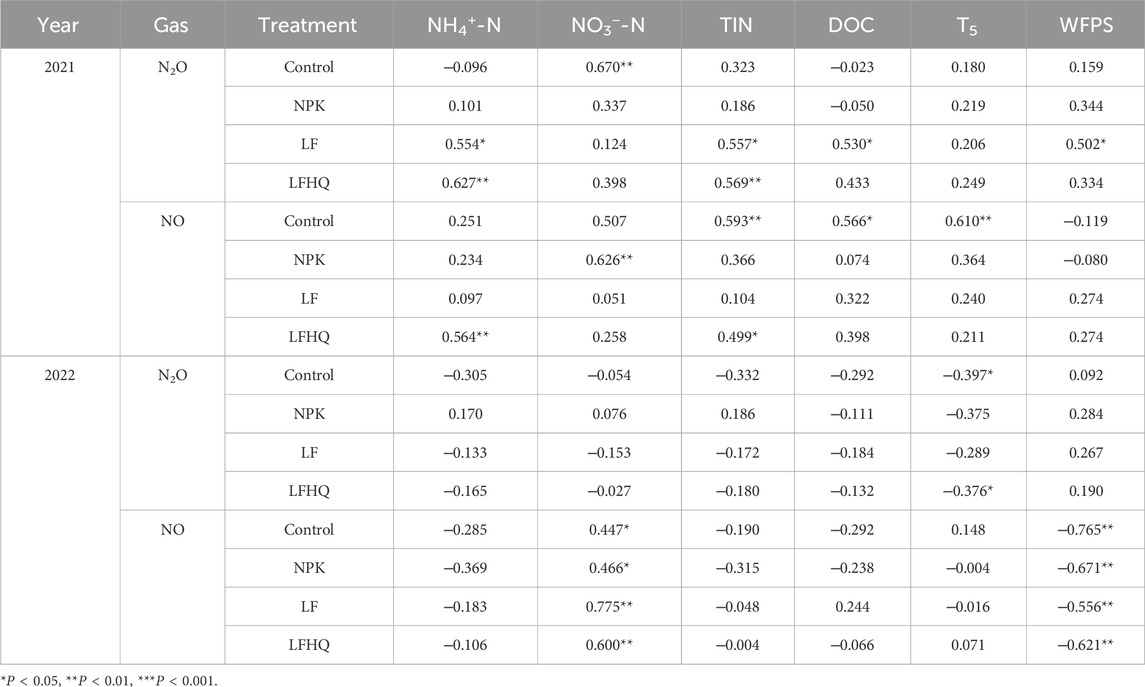
Table 3. Correlation between gaseous N fluxes (N2O, NO) and soil WFPS, dissolved organic carbon (DOC), temperature at 5 cm depth (T5), and ammonium (NH4+-N), nitrate (NO3−-N) or total inorganic nitrogen (TIN, NH4+-N + NO3−-N).
The random forest showed that, in order of importance, the top three factors that play an important role in affecting soil N2O emissions were TIN, NO3−, and WFPS in 2021 when rainfall was normal, and changed to WFPS, DOC, and TIN in 2022 when rainfall was abnormally high (Figures 6A, B). Accordingly, pathway analysis noted that the path coefficient of substrate to N2O emission was the largest (0.44, p < 0.001) in 2021, and soil WFPS to N2O was the largest (0.32, p < 0.01) in 2022 (Figures 6C, D).
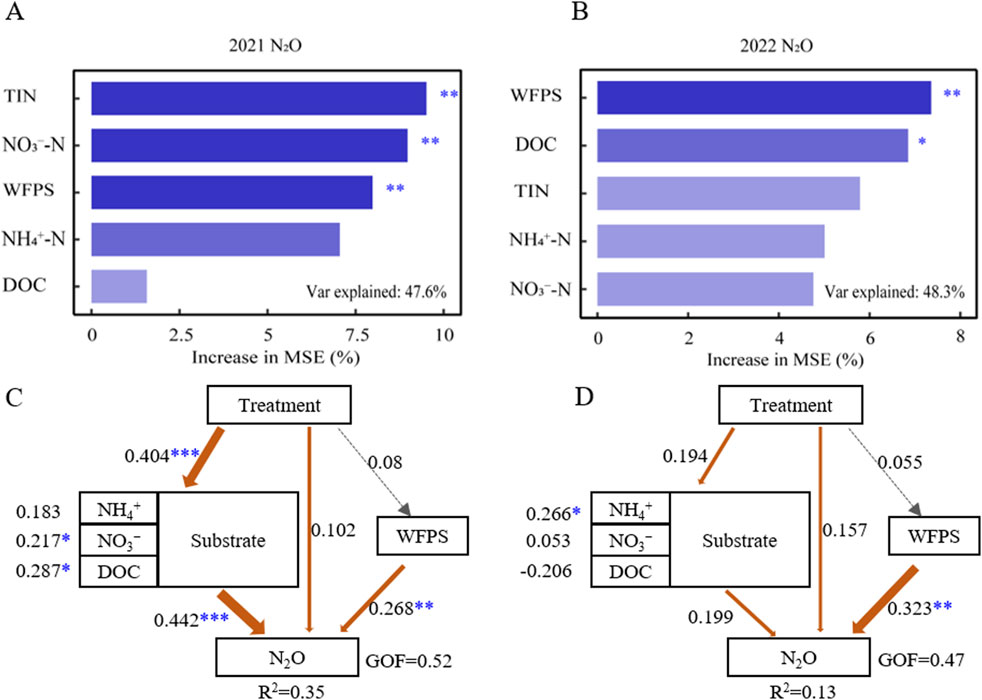
Figure 6. Random Forest analysis identifying the main drivers of N2O fluxes during the 2021 (A) and 2022 (B) maize season. Partial least squares path modeling (PLS-PM) showed the effect of soil NH4+-N, NO3–-N, DOC and WFPS on N2O fluxes during the 2021 (C) and 2022 (D) maize season. “Substrate” is latent variables indicated by NH4+-N, NO3–-N and DOC. “Treatment” is ordered by control, NPK, LF and LFHQ. Values adjoining the arrows represent the standardized path coefficients, and arrow widths are scaled proportionally to the path coefficients. *P < 0.05, **P < 0.01 , ***P < 0.001. Orange arrows refer to positive relationships. Gray lines denote insignificant paths (P > 0.05). R2 values indicate the variance of variables accounted for by the model.
Fitting of the data collected from previous studies indicated that there was a quadratic function relationship between N2O emission and annual precipitation in temperate light texture sandy soils (Figure 7A). When annual precipitation levels were below 690 mm, the EF-N2O exhibited an upward trend in response to increasing precipitation. However, when annual precipitation levels exceeded 690 mm, the EF-N2O demonstrated a decrease in response to further increases in precipitation. The meta-analysis revealed a consistent and direct relationship between the N2O peak fluxes and the soil WFPS measured at the time of N2O peak fluxes, indicating a positive linear correlation (Figure 7B).
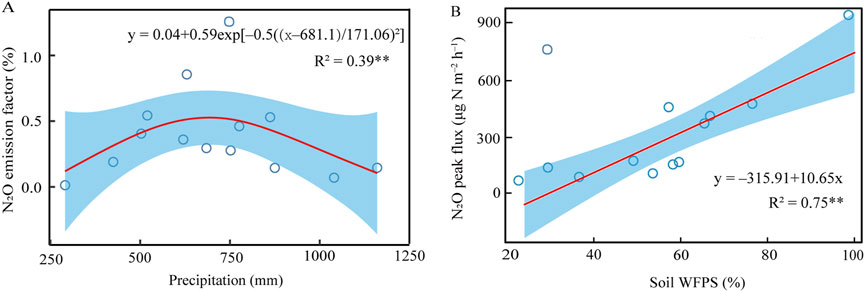
Figure 7. Correlation between fertilizer N induced N2O emission factor and annual precipitation (A) and between N2O peak fluxes and soil WFPS (B). The EF-N2O (y) and precipitation (x) satisfied: y = 0.04 + 0.59exp[‒ 0.5((x ‒ 681.1)/171.06)2], R2 = 0.39, P < 0.001; the N2O peak fluxes (y) and corresponding WFPS (x) satisfied: y = ‒ 315.91 + 10.65x, R2 = 0.75, P < 0.001.
Extreme precipitation is expected to increase with ongoing climate change (IPCC, 2013; Zhang and Zhou, 2019; Tan et al., 2021). In our study, extreme precipitation in the 2022 maize season increased N2O emissions by more than 10 times compared with conventional year 2021, regardless of the treatment (Table 2). The key driving factors affecting soil N2O production were the substrate inorganic N concentration during the 2021 maize season while soil WFPS during the 2022 season (Figures 6A, B). This inferred that changes in soil WFPS due to rainfall in 2022 may be the primary reason for the huge increase in N2O emissions. Granli and Bockman (1994) pointed out that N2O emissions from cultivated soils mainly resulted from nitrification when the soil WFPS ranges from 30% to 70%, and from denitrification when the soil WFPS is 70%–90%. An incubation experiment conducted by Liu et al. (2017) showed that nitrification was the main source of N2O production from soils WFPS at 50%–70%, while denitrification was the main source of N2O production from soils under 85% WFPS. When the soil WFPS is greater than 90%, soil N2O tends to be completely denitrified and reduced to N2. This is consistent with the negative correlation between ln(NO/N2O) and WFPS when WFPS is below 90%, and the positive correlation between ln(NO/N2O) and WFPS when WFPS is above 90% (Figure 5). In our study, the continuous precipitation since sowing during the 2022 maize season increased soil moisture over 70% WFPS, which was more inclined to denitrification for increased N2O emissions (Well et al., 2006). This was consistent with the results of a model simulated through 200 soil samples, where N2O fluxes increasing when the soil WFPS increased from 62% to 95% (Rabot et al., 2015). Chen et al. (2016) illustrated that extreme precipitation reduced N2O emissions during precipitation period since flooding suppressed soil nitrification and subsequent production of NO3− for denitrification in a clayey Mollisols. However, they observed that when soil moisture started to decrease during drying, a surge emission of N2O occurred. This is consistent with our finding that a spike in N2O flux appeared during drying process with soil moisture decreasing from over 100% WFPS to 80–90% WFPS after precipitation ended (Figure 1A; Figure 4A). This is partly due to the gradual recovery of oxygen supply during soil desiccation and the increased activity of microorganisms involved in nitrification in the soil microdomain (Lan et al., 2013), which increased the N2O production in the nitrification process. On the other hand, the N2O already produced by the denitrification process was not further converted to N2, and the lesser water resistance also made it easier for N2O to overflow the soil (Shang et al., 2016).
To gain a deeper understanding of the correlation between annual precipitation and N2O emissions, we compiled N2O emissions measured in temperate sandy soils with higher than 50% sand and less than 15% clay (Supplementary Table S1). The data showed that, the N2O peak fluxes increased with soil WFPS (Figure 7B), and the highest N2O peak flux reached 950 μg N m‒2 h‒1 at approximately 100% WFPS. For the purpose of excluding the potential influence of N application rate in different studies, fertilizer N-induced N2O emission factor was used. A quadratic relationship was found between EF-N2O of N fertilizer and annual precipitation in temperate sandy soils, with the maximum of N2O emission occurring at about 690 mm (Figure 7A). Keller and Reiners (1994) reported a similar exponential increase of N2O emission with soil WFPS from 60% to 80% WFPS in sandy loam. A 3-year trial conducted by Halvorson et al. (2016) showed that EF-N2O was 0.42% when rainfall plus irrigation was 650 mm during the 2012 maize season, whereas was reduced to only 0.16% when the rainfall plus irrigation increased to 730–750 mm during the 2013 and 2014 maize seasons. Our experiments and extracted data from previous studies have jointly expounded a phenomenon that the maximum N2O emission from temperate sandy soil may occur when the annual rainfall was nearly 690 mm, and the process of soil drying after flooding induced a large amount of N2O emission in a short time. Thus, rational water management system is required to avoid waterlogging and then a surge of N2O emission in temperate agricultural field.
Previous studies have indicated that the application of dairy effluent led to a 2–3 times increase in N2O emissions when compared to the use of mineral N fertilizer (Barton and Schipper, 2001; Li et al., 2015; Aita et al., 2019). On the contrary, we found that dairy effluent reduced N2O and NO emissions, and EF-N2O decreased from 1.71% under NPK treatment to 0.9% under LF treatment during the 2022 maize season (Table 3). The lower N2O and NO emissions in the LF treatment are attributed to three reasons. Firstly, it was found that approximately 90% of urea was generally hydrolyzed within 2 days after fertilization (Hojito et al., 2010; Dawar et al., 2011), which in turn led to a rapid increase in soil NH4+-N levels for nitrifiers and then NO3−-N for denitrifying bacteria (Tilsner et al., 2003; Asgedom et al., 2014). Conversely, the LF treatment demonstrated lower levels of free NH4+-N and NO3−-N (Figures 2A, B), consequently reducing N2O production, as a result of the slower mineralization of organic N from the dairy effluent (Bristow et al., 1992). Secondly, on the one hand, the high-water content of the dairy effluent might contribute to carry more N into the deeper soil layers than NPK treatment, thus reduced the risk of its loss as N-containing gases, such as N2O in the surface layer. On the other hand, the high-water content of the dairy effluent also increased the resistance of N2O to escape into the air and the probability of its further reduction to N2 (Shang et al., 2016). Thirdly, volatile fatty acids (VFA) were produced during 2-month open-air fermentation of dairy effluents in oxidation ponds (Cooper and Cornforth, 1978). The VFA as an easily decomposable C source caused soil-available inorganic N fixation during decomposition by microorganisms (Velthof et al., 2003), and there was a significant correlation between the concentration of initial fatty acids in slurry and the amount of fixed N (Kirchmann and Lundvall, 1993). While, the degradation products of VFA like acetic acid and propanoic acid exhibited an inhibitory effect on the oxidation of ammonium and nitrite (Jensen, 1950; Eilersen et al., 1994), thereby affecting the production of N2O and NO. Hooper and Terry (1973) reported that the rate of ammonia oxidation driven by Nitrosomonas europaea was inhibited by 30% and 9% under addition of 100 mM formate and acetate, respectively.
Urease inhibitors are expected to retard the process of urea hydrolysis by obstructing the active site of the urease enzyme and changing the redox conditions of soil microenvironment (Mobley and Hausinger, 1989), and have been widely used as amendments to alleviate NH3 loss after fertilization (Zaman et al., 2009; Silva et al., 2017). They also affected soil N2O emissions (Abalos et al., 2012). Xu et al. (2002) reported a 11.4% reduction in N2O emissions when urea was applied with HQ during a culture trial. A field experiment by Boeckx et al. (2005) found an analogous 11.0% reduction in N2O emissions in the presence of HQ. However, there are some field studies have showed that urease inhibitors mixed with urea do not have a significant effect on N2O emissions (Akiyama et al., 2010). Out of expectation, combination application of dairy effluent with HQ increased N2O emissions by 31.7%–40.7% compared with the LF treatment in this study (Table 3). There are three possible explanations for this unexpected phenomenon. Firstly, the HQ can avoid the large volatilization of NH3 caused by a sudden increase in NH4+-N concentrations and pH on topsoil (Sanz-Cobena et al., 2011; Silva et al., 2017). The NH4+-N produced gradually has more opportunities to be utilized by plants (Zaman et al., 2009; Silva et al., 2017), and also be converted into NO2−-N and NO3−-N (Xu et al., 2002; Martins et al., 2017), which in turn increased the substrates for N2O production through nitrification and denitrification (Bremner et al., 1981). It was verified that the maize yield and N uptake increased by 17% and 20% in the LFHQ treatment compared to LF treatment during the 2021 maize season, respectively (Supplementary Table S2). In our study, the lower ratio of NO flux to N2O flux in the LFHQ treatment than in the LF and no difference in NO emission between the two treatments (Table 2) indicated that higher N2O emissions in the LFHQ treatment was primarily attributed to denitrification (Ding et al., 2015). Secondly, the utilization of urease inhibitor merely postponed the hydrolysis of urea, and all urea-N ultimately underwent hydrolysis to form NH4+-N (Akiyama et al., 2010). The initial less supply of NH4+-N for crops may induce the mineralization of soil organic N (Parkin and Hatfield, 2014). This fraction of mineralized N may also be involved in the microbial production of N2O, and together with the N2O converted by the NH4+-N from the gradual hydrolysis of urea, the total N2O emissions were higher than that of the treatment without urease inhibitor. Thirdly, the initial N deficiency in the presence of urease inhibitors probably induced plants to deliver more photosynthates into underground for absorption of nutrients (Balachandran et al., 1997; Glynn et al., 2003), resulting in higher DOC levels in the LFHQ treatment in comparison to the LF treatment (Figure 3). Therefore, initial plant growth was not affected immediately and the subsequent gradual release of effluent N ensured the N availability to plant for a longer period. In turn, the higher DOC in the LFHQ treatment than the LF treatment may favor denitrification and N2O production (Chen et al., 2016). Overall, our study highlighted that under the conditions of our study, the application of a urease inhibitor (HQ) alone and dairy effluent has the risk of increasing N2O losses, and the concurrent application of nitrification inhibitors is recommended to reduce N2O emissions.
The N2O emission during the 2022 maize season was over 10 times higher than that during the 2021 maize season, whereas the emission of NO displayed an opposite pattern. The main driving factor related to N2O fluxes was soil inorganic N during the 2021 maize season while soil WFPS during the 2022 maize season with extreme precipitation. There is a quadratic function relationship between EF-N2O of N fertilizer and precipitation in temperate sandy soils, with the highest N2O emission occurring at ∼690 mm. The application of dairy effluent reduced N2O and NO emissions regardless of precipitation due to the reduction of soil available N, compared with the NPK treatment. Unexpectedly, combination application of dairy effluent with urease inhibitors stimulated N2O emission but not NO emission primarily due to stimulated soil intrinsic N mineralization and increased denitrification with enhanced DOC. Our findings suggested that drainage system could be effective in avoiding the surge of N2O emission under heavy rainfall in temperate sandy regions. Furthermore, urease inhibitors in combination with nitrification inhibitors is recommended toward co-benefits of agricultural productivity and greenhouse gas mitigation under dairy effluent application.
The original contributions presented in the study are included in the article/Supplementary Material, further inquiries can be directed to the corresponding authors.
CY: Conceptualization, Data curation, Formal Analysis, Investigation, Methodology, Software, Visualization, Writing–original draft, Writing–review and editing. DL: Conceptualization, Investigation, Methodology, Supervision, Validation, Writing–review and editing. YL: Supervision, Writing–review and editing. JL: Supervision, Writing–review and editing. HZ: Supervision, Writing–review and editing. YD: Supervision, Writing–review and editing. JY: Supervision, Writing–review and editing. ZC: Supervision, Writing–review and editing. LC: Supervision, Writing–review and editing. WD: Conceptualization, Data curation, Investigation, Project administration, Supervision, Validation, Writing–review and editing.
The author(s) declare that financial support was received for the research and/or publication of this article. This work was supported by National Key Research and Development Program of China (2022YFD1500303), Strategic Priority Research Program of Chinese Academy of Sciences (XDA28010302), the Natural Sciences Foundation (BK20230050) and Carbon Peak & Carbon Neutral Science and Technology Innovation Project of Jiangsu Province (BK20220020), Frontier Project from the Institute of Soil Science, Chinese Academy of Sciences (ISSASIP2212), and International Atomic Energy Agency Coordinated Research Project (D15020).
The authors would like to extend their sincere thanks for the help provided by YOURAN DAIRY Ranch, LLC.
Author LC was employed by Inner Mongolia Youran Dairy Group Ltd.
The remaining authors declare that the research was conducted in the absence of any commercial or financial relationships that could be construed as a potential conflict of interest.
The author(s) declare that no Generative AI was used in the creation of this manuscript.
All claims expressed in this article are solely those of the authors and do not necessarily represent those of their affiliated organizations, or those of the publisher, the editors and the reviewers. Any product that may be evaluated in this article, or claim that may be made by its manufacturer, is not guaranteed or endorsed by the publisher.
The Supplementary Material for this article can be found online at: https://www.frontiersin.org/articles/10.3389/fenvs.2025.1558934/full#supplementary-material
Abalos, D., Sanz-Cobena, A., Andreu, G., and Vallejo, A. (2017). Rainfall amount and distribution regulate DMPP effects on nitrous oxide emissions under semiarid Mediterranean conditions. Agric. Ecosyst. Environ. 238, 36–45. doi:10.1016/j.agee.2016.02.003
Abalos, D., Sanz-Cobena, A., Misselbrook, T., and Vallejo, A. (2012). Effectiveness of urease inhibition on the abatement of ammonia, nitrous oxide and nitric oxide emissions in a non-irrigated Mediterranean barley field. Chemosphere 89, 310–318. doi:10.1016/j.chemosphere.2012.04.043
Aita, C., Chantigny, M. H., Gonzatto, R., Miola, E. C., Rochette, P., Pujol, S. B., et al. (2019). Winter-season gaseous nitrogen emissions in subtropical climate: impacts of pig slurry injection and nitrification inhibitor. J. Environ. Qual. 48, 1414–1426. doi:10.2134/jeq2018.04.0137
Akiyama, H., Yan, X., and Yagi, K. (2010). Evaluation of effectiveness of enhanced-efficiency fertilizers as mitigation options for N2O and NO emissions from agricultural soils: meta-analysis. Glob. Chang. Biol. 16, 1837–1846. doi:10.1111/j.1365-2486.2009.02031.x
Aranibar, J. N., Otter, L., Macko, S. A., Feral, C. J., Epstein, H. E., Dowty, P. R., et al. (2004). Nitrogen cycling in the soil-plant system along a precipitation gradient in the Kalahari sands. Glob. Chang. Biol. 10, 359–373. doi:10.1111/j.1365-2486.2003.00698.x
Asgedom, H., Tenuta, M., Flaten, D. N., Gao, X. P., and Kebreab, E. (2014). Nitrous oxide emissions from a clay soil receiving granular urea formulations and dairy manure. Agron. J. 106, 732–744. doi:10.2134/agronj2013.0096
Balachandran, S., Hull, R. J., Martins, R. A., Vaadia, Y., and Lucas, W. J. (1997). Influence of environmental stress on biomass par-titioning in transgenic tobacco plants expressing the movement protein of tobacco mosaic virus. Plant Physiol. 114, 475–481. doi:10.1104/pp.114.2.475
Barton, L., and Schipper, L. A. (2001). Regulation of nitrous oxide emissions from soils irrigated with dairy farm effluent. J. Environ. Qual. 30, 1881–1887. doi:10.2134/jeq2001.1881
Boeckx, P., Xu, X., and Van Cleemput, O. (2005). Mitigation of N2O and CH4 emission from rice and wheat cropping systems using dicyandiamide and hydroquinone. Nutr. Cycl. Agroecosyst. 72, 41–49. doi:10.1007/s10705-004-7352-4
Bolan, N. S., Saggar, S., Luo, J. F., Bhandral, R., and Singh, J. (2004). Gaseous emissions of nitrogen from grazed pastures: processes, measurements and modelling, environmental implications, and mitigation. Adv. Agron. 84, 37–120. doi:10.1016/S0065-2113(04)84002-1
Bouwman, A. F., Boumans, L. J., and Batjes, N. H. (2002). Emissions of N2O and NO from fertilized fields: summary of available measurement data. Glob. Biogeochem. Cycle 16, 6‒1‒6–13. doi:10.1029/2001GB001811
Bouwman, L., Stehfest, E., and van Kessel, C. (2010). “Nitrous oxide emissions from the nitrogen cycle in arable agriculture: estimation and mitigation,” in Nitrous oxide and climate change. London: Routledge, 85–106.
Bremner, J. M., Breitenbeck, G. A., and Blackmer, A. M. (1981). Effect of nitrapyrin on emission of nitrous oxide from soil fertilized with anhydrous ammonia. Geophys. Res. Lett. 8, 353–356. doi:10.1029/GL008i004p00353
Bristow, A. W., Whitehead, D. C., and Cockburn, J. E. (1992). Nitrogenous constituents in the urine of cattle, sheep and goats. J. Sci. Food Agric. 59, 387–394. doi:10.1002/jsfa.2740590316
Chen, Z. M., Ding, W. X., Xu, Y. H., Müller, C., Yu, H. Y., and Fan, J. L. (2016). Increased N2O emissions during soil drying after waterlogging and spring thaw in a record wet year. Soil Biol. Biochem. 101, 152–164. doi:10.1016/j.soilbio.2016.07.016
Cheng, Y., Xie, W., Huang, R., Yan, X. Y., and Wang, S. Q. (2017). Extremely high N2O but unexpectedly low NO emissions from a highly organic and chemical fertilized peach orchard system in China. Agric. Ecosyst. Environ. 246, 202–209. doi:10.1016/j.agee.2017.06.015
Cooper, P., and Cornforth, I. S. (1978). Volatile fatty-acids in storedanimal slurry. J. Sci. Food Agric. 29, 19–27. doi:10.1002/jsfa.2740290104
Corre, M. D., Schnabel, R. R., and Stout, W. L. (2002). Spatial and seasonal variation of gross nitrogen transformations and microbial biomass in a Northeastern US grassland. Soil Biol. Biochem. 34, 445–457. doi:10.1016/S0038-0717(01)00198-5
Dalal, R. C., Wang, W. J., Robertson, G. P., and Parton, W. J. (2003). Nitrous oxide emission from Australian agricultural lands and mitigation options: a review. Aust. J. Soil Res. 41, 165–195. doi:10.1071/SR02064
Dawar, K., Zaman, M., Rowarth, J. S., Blennerhassett, J., and Turnbull, M. H. (2011). Urease inhibitor reduces N losses and improves plant-bioavailability of urea applied in fine particle and granular forms under field conditions. Agric. Ecosyst. Environ. 144, 41–50. doi:10.1016/j.agee.2011.08.007
Ding, W. X., Chen, Z. M., Yu, H. Y., Luo, J. F., Yoo, G. Y., Xiang, J., et al. (2015). Nitrous oxide emission and nitrogen use efficiency in response to nitrophosphate, N-(n-butyl) thiophosphoric triamide and dicyandiamide of a wheat cultivated soil under sub-humid monsoon conditions. Biogeosciences 12, 803–815. doi:10.5194/bg-12-803-2015
Ding, W. X., Luo, J. F., Li, J., Yu, H. Y., Fan, J. L., and Liu, D. Y. (2013). Effect of long-term compost and inorganic fertilizer application on background N2O and fertilizer-induced N2O emissions from an intensively cultivated soil. Sci. Total Environ. 465, 115–124. doi:10.1016/j.scitotenv.2012.11.020
Ding, W. X., Meng, L., Yin, Y. F., Cai, Z. C., and Zheng, X. H. (2007). CO2 emission in an intensively cultivated loam as affected by long-term application of organic manure and nitrogen fertilizer. Soil Biol. Biochem. 39, 669–679. doi:10.1016/j.soilbio.2006.09.024
Eilersen, A. M., Henze, M., and Kløft, L. (1994). Effect of volatile fatty acids and trimethylamine on nitrification in activated sludge. Water Res. 28, 1329–1336. doi:10.1016/0043-1354(94)90298-4
Fan, D. J., He, W. T., Smith, W. N., Drury, C. F., Jiang, R., Grant, B. B., et al. (2022). Global evaluation of inhibitor impacts on ammonia and nitrous oxide emissions from agricultural soils: a meta-analysis. Glob. Chang. Biol. 28, 5121–5141. doi:10.1111/gcb.16294
Gimeno, L., Sorí, R., Vázquez, M., Stojanovic, M., Algarra, I., Eiras-Barca, J., et al. (2022). Extreme precipitation events. Wiley Interdiscip. Rev.-Water 9. doi:10.1002/wat2.1611
Glynn, C., Herms, D. A., Egawa, M., Hansen, R., and Mattson, W. J. (2003). Effects of nutrient availability on biomass allocation as well as constitutive and rapid induced herbivore resistance in poplar. Oikos 101, 385–397. doi:10.1034/j.1600-0706.2003.12089.x
Granli, T., and Bockman, O. C. (1994). “Nitrous oxide (N2O) from agriculture,” in 3rd congress of the European-Society-for-Agronomy. Abano Padova, Italy: European Society Agronomy, Padova Univ, 800–801.
Halvorson, A. D., Del Grosso, S. J., and Stewart, C. E. (2016). Manure and inorganic nitrogen affect trace gas emissions under semi-arid irrigated corn. J. Environ. Qual. 45, 906–914. doi:10.2134/jeq2015.08.0426
Hayakawa, A., Akiyama, H., Sudo, S., and Yagi, K. (2009). N2O and NO emissions from an Andisol field as influenced by pelleted poultry manure. Soil Biol. Biochem. 4, 521–529. doi:10.1016/j.soilbio.2008.12.011
He, T. H., Liu, D. Y., Yuan, J. J., Ni, K., Zaman, M., Luo, J. F., et al. (2018). A two years study on the combined effects of biochar and inhibitors on ammonia volatilization in an intensively managed rice field. Agric. Ecosyst. Environ. 264, 44–53. doi:10.1016/j.agee.2018.05.010
Hengl, T., de Jesus, J. M., Heuvelink, G. B. M., Gonzalez, M. R., Kilibarda, M., Blagotic, A., et al. (2017). SoilGrids250m: global gridded soil information based on machine learning. PLoS One 12, e0169748. doi:10.1371/journal.pone.0169748
Hojito, M., Hayashi, K., and Matsuura, S. (2010). Ammonia exchange on grasslands in an intensive dairying region in central Japan. Soil Sci. Plant Nutr. 56, 503–511. doi:10.1111/j.1747-0765.2010.00466.x
Hooper, A. B., and Terry, K. R. (1973). Specific inhibitors of ammonia oxidation in Nitrosomonas. J. Bact. 115, 480–485. doi:10.1128/jb.115.2.480-485.1973
Hu, X. K., Su, F., Ju, X. T., Gao, B., Oenema, O., Christie, P., et al. (2013). Greenhouse gas emissions from a wheat-maize double cropping system with different nitrogen fertilization regimes. Environ. Pollut. 176, 198–207. doi:10.1016/j.envpol.2013.01.040
IPCC (2013). Climate change 2013: the physical science basis: working group I contribution to the fifth assessment report of the intergovernmental panel on climate change. Cambridge University Press.
IPCC (2021). Climate change 2021: the Physical Science Basis. Working Group I Contribution to the Sixth Assessment Report addresses the most up-to-date physical understanding of the climate system and climate change, bringing together the latest advances in climate science. Cambridge University Press.
Jensen, H. L. (1950). Effect of organic compounds on Nitrosomonas. Nature 165, 974. doi:10.1038/165974a0
Karadag, D., Köroglu, O. E., Ozkaya, B., and Cakmakci, M. (2015). A review on anaerobic biofilm reactors for the treatment of dairy industry wastewater. Process Biochem. 50, 262–271. doi:10.1016/j.procbio.2014.11.005
Keller, M., and Reiners, W. A. (1994). Soil atmosphere exchange of nitrous-oxide, nitric-oxide, and methane under secondary succession of pasture to forest in the atlantic lowlands of costa-rica. Glob. Biogeochem. Cycle 8, 399–409. doi:10.1029/94GB01660
Kirchmann, H., and Lundvall, A. (1993). Relationship between N immobilization and volatile fatty acids in soil after application of pig and cattle slurry. Biol. Fertil. Soils 15, 161–164. doi:10.1007/BF00361605
Krol, D. J., Forrestal, P. J., Wall, D., Lanigan, G. J., Sanz-Gomez, J., and Richards, K. G. (2020). Nitrogen fertilisers with urease inhibitors reduce nitrous oxide and ammonia losses, while retaining yield in temperate grassland. Sci. Total Environ. 725, 138329. doi:10.1016/j.scitotenv.2020.138329
Lan, T., Han, Y., Roelcke, M., Nieder, R., and Cai, Z. C. (2013). Processes leading to N2O and NO emissions from two different Chinese soils under different soil moisture contents. Plant Soil 371, 611–627. doi:10.1007/s11104-013-1721-1
Lassaletta, L., Billen, G., Grizzetti, B., Garnier, J., Leach, A. M., and Galloway, J. N. (2014). Food and feed trade as a driver in the global nitrogen cycle: 50-year trends. Biogeochemistry 118, 225–241. doi:10.1007/s10533-013-9923-4
Li, J., Luo, J., Shi, Y., Lindsey, S., Houlbrooke, D., and Ledgard, S. (2015). Nitrous oxide emissions from dairy farm effluent applied to a New Zealand pasture soil. Soil Use Manage 31, 279–289. doi:10.1111/sum.12187
Li, L. F., Hao, Y. B., Wang, W. J., Biederman, J. A., Zheng, Z. Z., Wang, Y. F., et al. (2023). Effects of extra-extreme precipitation variability on multi-year cumulative nitrous oxide emission in a semiarid grassland. Agric. Meteorol. 343, 109761. doi:10.1016/j.agrformet.2023.109761
Liu, R., Hayden, H. L., Suter, H., Hu, H. W., Lam, S. K., He, J. Z., et al. (2017). The effect of temperature and moisture on the source of N2O and contributions from ammonia oxidizers in an agricultural soil. Biol. Fertil. Soils 53, 141–152. doi:10.1007/s00374-016-1167-8
Manunza, B., Deiana, S., Pintore, M., and Gessa, C. (1999). The binding mechanism of urea, hydroxamic acid and N-(N-butyl)-phosphoric triamide to the urease active site. A comparative molecular dynamics study. Soil Biol. Biochem. 31, 789–796. doi:10.1016/S0038-0717(98)00155-2
Martins, M. R., Sant'Anna, S. A. C., Zaman, M., Santos, R. C., Monteiro, R. C., Alves, B. J., et al. (2017). Strategies for the use of urease and nitrification inhibitors with urea: impact on N2O and NH3 emissions, fertilizer-15N recovery and maize yield in a tropical soil. Agric. Ecosyst. Environ. 247, 54–62. doi:10.1016/j.agee.2017.06.021
Matse, D. T., Krol, D. J., Richards, K. G., Danaher, M., Cummins, E., Wang, X., et al. (2024). Field efficacy of urease inhibitors for mitigation of ammonia emissions in agricultural field settings: a systematic review. Front. Environ. Sci. 12. doi:10.3389/fenvs.2024.1462098
Meng, L., Ding, W. X., and Cai, Z. C. (2005). Long-term application of organic manure and nitrogen fertilizer on N2O emissions, soil quality and crop production in a sandy loam soil. Soil Biol. Biochem. 37, 2037–2045. doi:10.1016/j.soilbio.2005.03.007
Mira, A. B., Cantarella, H., Souza-Netto, G. J., Moreira, L. A., Kamogawa, M. Y., and Otto, R. (2017). Optimizing urease inhibitor usage to reduce ammonia emission following urea application over crop residues. Agric. Ecosyst. Environ. 248, 105–112. doi:10.1016/j.agee.2017.07.032
Mobley, H. L., and Hausinger, R. P. (1989). Microbial ureases-significance, regulation, and molecular characterization. Microbiol. Rev. 53, 85–108. doi:10.1128/mr.53.1.85-108.1989
Nakahara, O., Yamagami, T., Koide, T., Sakai, K., and Hatano, R. (2003). Spatial variation in nitrogen deposition over five adjacent catchments in a larch forest. Soil Sci. Plant Nutr. 49, 741–746. doi:10.1080/00380768.2003.10410333
Nartey, O. D., Liu, D. Y., Luo, J. F., Lindsey, S., Di, H. J., Chen, Z. M., et al. (2021). Optimizing the application of dairy farm effluent and manure to mitigate gas emission. J. Soils Sed. 21, 2381–2393. doi:10.1007/s11368-021-02935-w
Pardo, G., Moral, R., Aguilera, E., and del Prado, A. (2015). Gaseous emissions from management of solid waste: a systematic review. Glob. Chang. Biol. 21, 1313–1327. doi:10.1111/gcb.12806
Park, S. H., Lee, B. R., and Kim, T. H. (2021). Urease and nitrification inhibitors with pig slurry effects on ammonia and nitrous oxide emissions, nitrate leaching, and nitrogen use efficiency in perennial ryegrass sward. Anim. Biosci. 34, 2023–2033. doi:10.5713/ab.21.0046
Parkin, T. B., and Hatfield, J. L. (2014). Enhanced efficiency fertilizers: effect on nitrous oxide emissions in Iowa. Agron. J. 106, 694–702. doi:10.2134/agronj2013.0219
Pereira, J., Barneze, A. S., Misselbrook, T. H., Coutinho, J., Moreira, N., and Trindade, H. (2013). Effects of a urease inhibitor and aluminium chloride alone or combined with a nitrification inhibitor on gaseous N emissions following soil application of cattle urine. Biosyst. Eng. 115, 396–407. doi:10.1016/j.biosystemseng.2013.05.002
Rabot, E., Cousin, I., and Hénault, C. (2015). A modeling approach of the relationship between nitrous oxide fluxes from soils and the water-filled pore space. Biogeochemistry 122, 395–408. doi:10.1007/s10533-014-0048-1
Ravishankara, A. R., Daniel, J. S., and Portmann, R. W. (2009). Nitrous oxide (N2O): the dominant ozone-depleting substance emitted in the 21st century. Science 326, 123–125. doi:10.1126/science.1176985
Reay, D. S., Davidson, E. A., Smith, K. A., Smith, P., Melillo, J. M., Dentener, F., et al. (2012). Global agriculture and nitrous oxide emissions. Nat. Clim. Chang. 2, 410–416. doi:10.1038/nclimate1458
Sanz-Cobena, A., Misselbrook, T., Camp, V., and Vallejo, A. (2011). Effect of water addition and the urease inhibitor NBPT on the abatement of ammonia emission from surface applied urea. Atmos. Environ. 45, 1517–1524. doi:10.1016/j.atmosenv.2010.12.051
Sarkar, B., Chakrabarti, P. P., Vijaykumar, A., and Kale, V. (2006). Wastewater treatment in dairy industries-possibility of reuse. Desalination 195, 141–152. doi:10.1016/j.desal.2005.11.015
Shang, F. Z., Ren, S. M., Yang, P. L., Chi, Y. B., and Xue, Y. D. (2016). Effects of different irrigation water types, N fertilizer types, and soil moisture contents on N2O emissions and N fertilizer transformations in soils. Water Air Soil Pollut. 227, 225. doi:10.1007/s11270-016-2920-1
Shi, Y. J., Wang, J. F., Ao, Y. N., Han, J. Y., Guo, Z. H., Liu, X. Y., et al. (2021). Responses of soil N2O emissions and their abiotic and biotic drivers to altered rainfall regimes and co-occurring wet N deposition in a semi-arid grassland. Glob. Chang. Biol. 27, 4894–4908. doi:10.1111/gcb.15792
Silva, A. G., Sequeira, C. H., Sermarini, R. A., and Otto, R. (2017). Urease inhibitor NBPT on ammonia volatilization and crop productivity: a meta-analysis. Agron. J. 109, 1–13. doi:10.2134/agronj2016.04.0200
Tan, X. Z., Wu, X. X., and Liu, B. J. (2021). Global changes in the spatial extents of precipitation extremes. Environ. Res. Lett. 16, 054017. doi:10.1088/1748-9326/abf462
Tian, H., Xu, R., Canadell, J. G., Thompson, R. L., Winiwarter, W., Suntharalingam, P., et al. (2020). A comprehensive quantification of global nitrous oxide sources and sinks. Nature 586, 248–256. doi:10.1038/s41586-020-2780-0
Tilsner, J., Wrage, N., Lauf, J., and Gebauer, G. (2003). Emission of gaseous nitrogen oxides from an extensively managed grassland in NE Bavaria, Germany. I. Annual budgets of N2O and NOx emissions. Biogeochemistry 63, 229–247. doi:10.1023/A:1023365432388
Vallejo, A., García-Torres, L., Díez, J. A., Arce, A., and López-Fernández, S. (2005). Comparison of N losses (NO3‒, N2O, NO) from surface applied, injected or amended (DCD) pig slurry of an irrigated soil in a Mediterranean climate. Plant Soil 272, 313–325. doi:10.1007/s11104-004-5754-3
Velthof, G. L., Kuikman, P. J., and Oenema, O. (2003). Nitrous oxide emission from animal manures applied to soil under controlled conditions. Biol. Fertil. Soils 37, 221–230. doi:10.1007/s00374-003-0589-2
Wang, Y., Yao, Z. S., Pan, Z. L., Guo, H. J., Chen, Y. C., Cai, Y. J., et al. (2024). Nonlinear response of soil nitric oxide emissions to fertilizer nitrogen across croplands. Biol. Fertil. Soils 60, 483–492. doi:10.1007/s00374-024-01818-9
Wang, Y. D., Hu, N., Ge, T. D., Kuzyakov, Y., Wang, Z. L., Li, Z. F., et al. (2017). Soil aggregation regulates distributions of carbon, microbial community and enzyme activities after 23-year manure amendment. Appl. Soil Ecol. 111, 65–72. doi:10.1016/j.apsoil.2016.11.015
Wang, Z. P., Cleemput, O. V., and Baert, L. (1990). Effect of urease inhibitors on nitrification in soil. Soil use Manage 6, 41–43. doi:10.1111/j.1475-2743.1990.tb00795.x
Well, R., Kurganova, I., Lopesdegerenyu, V., and Flessa, H. (2006). Isotopomer signatures of soil-emitted N2O under different moisture conditions-A microcosm study with arable loess soil. Soil Biol. Biochem. 38, 2923–2933. doi:10.1016/j.soilbio.2006.05.003
Well, R., Ruoss, N., Grosz, B., Brunotte, J., Buchen-Tschiskale, C., Lewicka-Szczebak, D., et al. (2024). Effect of agricultural management system (“cash crop”, “livestock” and “climate optimized”) on nitrous oxide and ammonia emissions. Biol. Fertil. Soils. doi:10.1007/s00374-024-01843-8
Williams, E. J., Hutchinson, G. L., and Fehsenfeld, F. C. (1992). NOX and N2O emissions from soil. Glob. Biogeochem. Cycles 6, 351–388. doi:10.1029/92GB02124
Xu, X. K., Boeckx, P., Van Cleemput, O., and Zhou, L. K. (2002). Urease and nitrification inhibitors to reduce emissions of CH4 and N2O in rice production. Nutr. Cycl. Agroecosyst. 64, 203–211. doi:10.1023/A:1021188415246
Zaman, M., Nguyen, M. L., Blennerhassett, J. D., and Quin, B. F. (2008). Reducing NH3, N2O and NO3‒ losses from a pasture soil with urease or nitrification inhibitors and elemental S-amended nitrogenous fertilizers. Biol. Fertil. Soils 44, 693–705. doi:10.1007/s00374-007-0252-4
Zaman, M., Nguyen, M. L., Matheson, F., Blennerhassett, J. D., and Quin, B. F. (2007). Can soil amendments (zeolite or lime) shift the balance between nitrous oxide and dinitrogen emissions from pasture and wetland soils receiving urine or urea-N? Aust. J. Soil Res. 45, 543–553. doi:10.1071/SR07034
Zaman, M., Saggar, S., Blennerhassett, J. D., and Singh, J. (2009). Effect of urease and nitrification inhibitors on N transformation, gaseous emissions of ammonia and nitrous oxide, pasture yield and N uptake in grazed pasture system. Soil Biol. Biochem. 41, 1270–1280. doi:10.1016/j.soilbio.2009.03.011
Zhang, K., Li, M. X., Yan, Z. Q., Li, M., Kang, E., Yan, L., et al. (2022). Changes in precipitation regime lead to acceleration of the N cycle and dramatic N2O emission. Sci. Total Environ. 808, 152140. doi:10.1016/j.scitotenv.2021.152140
Keywords: livestock slurry, greenhouse gas, urease inhibitors, temperate sandy soil, climate change
Citation: Yang C, Liu D, Li Y, Li J, Zheng H, Dong Y, Yuan J, Chen Z, Chen L and Ding W (2025) Dairy effluent mitigates N2O missions while extreme precipitation stimulates N2O losses in a sandy soil. Front. Environ. Sci. 13:1558934. doi: 10.3389/fenvs.2025.1558934
Received: 11 January 2025; Accepted: 05 March 2025;
Published: 25 March 2025.
Edited by:
Yuhan Huang, University of Technology Sydney, AustraliaReviewed by:
Jiangbing Xu, Nanjing University of Information Science and Technology, ChinaCopyright © 2025 Yang, Liu, Li, Li, Zheng, Dong, Yuan, Chen, Chen and Ding. This is an open-access article distributed under the terms of the Creative Commons Attribution License (CC BY). The use, distribution or reproduction in other forums is permitted, provided the original author(s) and the copyright owner(s) are credited and that the original publication in this journal is cited, in accordance with accepted academic practice. No use, distribution or reproduction is permitted which does not comply with these terms.
*Correspondence: Weixin Ding, d3hkaW5nQGlzc2FzLmFjLmNu; Deyan Liu, ZGV5YW5saXVAbmpmdS5lZHUuY24=
Disclaimer: All claims expressed in this article are solely those of the authors and do not necessarily represent those of their affiliated organizations, or those of the publisher, the editors and the reviewers. Any product that may be evaluated in this article or claim that may be made by its manufacturer is not guaranteed or endorsed by the publisher.
Research integrity at Frontiers
Learn more about the work of our research integrity team to safeguard the quality of each article we publish.