 Hebing Zhang1,2Zhiyong Zhu1Shidong Wang1,2*Youfeng Zou1Zhichao Chen1Yanling Zhao3Qiuji Chen4Yiheng Jiao1Yifu Li1Haoyang Du1
- 1School of Surveying and Engineering Information, Henan Polytechnic University (HPU), Jiaozuo, China
- 2Zhengzhou Advanced Institute of Henan Polytechnic University, Zhengzhou, China
- 3College of Geoscience and Surveying Engineering, China University of Mining and Technology-Beijing, Xuzhou, China
- 4College of Geomatics, Xi’an University of Science and Technology, Xi’an, China
The idea of green mining has attracted much attention over the past decade. Accurate identification of key elements of ecological restoration in mining areas is an important prerequisite for ecosystem restoration and reconstruction and improving the quality of ecological environment. The goal of this study is to develop a five-factor index system for ecological restoration in mining areas, with the Huojitu well serving as a case study of a typical western shallow-buried high-intensity mining area in China. The factors include vegetation cove, soil, ecological landscape, land damage and site condition. An obstacle factor diagnosis model based on the coupling of obstacle degree and Shefold restriction law has been established in this research. This model is used to identify the obstacle factors and analyze the key elements of ecological restoration in the mining area. The key elements of ecological restoration are identified by combining the obstacle degree of each obstacle factor. According to the findings, out of all the areas included in the study, the one pertaining to soil conditions was the biggest at 35.29 km2, or 31.91% of the total, followed by land damage condition (21.25 km2 ∼19.20%), site condition (19.74 km2∼17.84%), vegetation cover (3.34 km2, ∼3.02%), and ecological landscape (31.08 km2∼ 28.03%). Based on the identification results of critical elements in mining area ecological restoration, this study proposes targeted remediation strategies and formulates corresponding site-specific rehabilitation measures to facilitate efficient ecosystem recovery in mining regions. This approach not only advances the practical implementation of ecological restoration technologies but also provides a valuable reference framework for sustainable ecosystem management in post-mining landscapes.
1 Introduction
The utilization of coal resources has led to a series of ecological problems. With the increasing popularity of green mining and carbon neutrality concepts, the ecological restoration of mining areas has attracted widespread attention and has become an important part of ecological architecture and environmental protection (Xiao et al., 2023). Recently, there has been a considerable development in mining ecological restoration theory and technology in China, forming a number of theoretical and technical achievements (Chi et al., 2024; Yao et al., 2025; Peng and Bi, 2024; Chen et al., 2024; Lei et al., 2023; Sun et al., 2024; Almassi, 2021; Bendfeldt et al., 2001). For the construction of an ecological civilization, we must adhere to the principle of “saving priority, protection priority, natural recovery” (Lei et al., 2024), which indicates that the ecological restoration of mining areas should transition from manual intervention to manual guidance (Klaus and Kiehl, 2021; Hao et al., 2025; Li et al., 2024; Du et al., 2021; Crouzeilles et al., 2017).
The Huojitu well in the northwest mining area has a shallow coal seam, thin bedrock, large coal seam thickness, and simple geological conditions. Coal occurrence conditions are ideal for mechanized one-time full height and rapid mining, which is typical of high-intensity mining (Chen et al., 2016). Large-scale long-wall high-intensity mining causes intense roof movement, stope mine pressure (Yang et al., 2020; Yang and Liu, 2020; Gao et al., 2019), and greater damage to the overlying strata and surface ecology. The western region’s shallow buried depth and high intensity mining area has been the subject of increasing amounts of academic investigation. Based on the key stratum theory and CISPM (Comprehensive and Integrated Subsidence Prediction Model) comprehensive surface subsidence prediction model software, Xu et al. (2023) studied the characteristics of surface movement, the change of surface rock movement angle parameters and the development of ground fissures in the study area. Yang et al. (2019) determined the microscopic structure, mineral composition, and physical and mechanical properties of sandy mudstone mine roofs. A similar simulation test, theoretical analysis, CAN-II magnetotelluric detector, and field investigation were employed to thoroughly analyze the overburden failure. For a coordinated development of coal mining and ecological restoration, the coal industry must abandon the concept of “mining before restoration” (Guo et al., 2023) and establish the concept of “integrated development and utilization” (Hu and Xiao, 2020). Therefore, when implementing ecological restoration in mining areas, a scientific and targeted ecological restoration should be considered. Ecological restoration of mining areas must be executed meticulously to fulfill the objective of natural ecological rehabilitation.
At present, the research on the diagnosis model of obstacle factors is mainly divided into four domains: obstacle diagnosis model based on analytic hierarchy process (Zhao et al., 2023; Mao et al., 2007; Yang et al., 2022; Chai et al., 2022), obstacle diagnosis model based on principal component analysis (Li and Yang, 2010; Shi et al., 2024; Li et al., 2015), obstacle diagnosis model based on index deviation (Qu et al., 2017; Chen and Yang, 2013; Huang et al., 2018) and obstacle diagnosis model based on niche (Zhao et al., 2016; Xia et al., 2021; Sun et al., 2023; Zhao et al., 2022). These four types of models can better analyze obstacle factors and have been widely used in various fields of ecological resource research. Manhaes et al. (2022) evaluated the obstacle factors restricting forest restoration based on the functional trajectories of six forest communities 20 years of age, and identified the species that are most conducive to overcoming the obstacle factors of forest community restoration. Chen et al. (2020) employed the entropy weight TOPSIS model to assess the urban ecological level, identified the primary impediments hindering the enhancement of urban ecological standards through the obstacle factor diagnosis model, and proposed specific recommendations. Yi et al.(2023) constructed an index system for analyzing the rural resources and environment carrying capacity based on the social ecological framework given the interaction between human and environment as the core, and used the obstacle degree model to identify the key obstacles in this system. Cheng et al. (2018) used the obstacle degree model to calculate the obstacle degree of the obstacle factors affecting the green competitiveness of China’s provinces, and determined the key obstacles affecting the green competitiveness of each province. Wang et al. (2022) employed the obstacle degree model to assess the degree of 25 factors within the evaluation system of agricultural sustainable development. Cui et al.(2022) thoroughly evaluated the environmental carrying capacity and identified the main obstacle factors of three major urban agglomerations in Beijing-Tianjin-Hebei, Yangtze River Delta and Pearl River Delta by using the entropy weight extension matter-element model and obstacle diagnosis model. Jiang Long (Jiang et al., 2021)[43] analyzed the main obstacle factors restricting a high-quality development through the obstacle degree model, and simulated the future development changes of the provinces in the Yellow River Basin using the system dynamics model. Jia and Du (2024) assessed the obstacle degree of each index in the ecological security evaluation using the obstacle degree model, and conducted the ecological security evaluation of Qinghai Province from 2010 to 2020. Yang et al. (2023) used the obstacle degree model to identify the key factors affecting the land use performance in Ningxia. Lei et al. (2016) combined the entropy weight TOPSIS model and the obstacle degree model to evaluate the land use performance in Anhui Province over the past 15 years. The performance change trend of the land use subsystem in Anhui Province over the next 5 years was also predicted and analyzed. Liao Yuchen used the PSR model and the obstacle factor method to construct an evaluation system from 23 indicators such as resources, environment, social economy, etc., and comprehensively evaluated the dynamic changes of ecological security in the study area (Liao et al., 2021). In summary, although the obstacle degree model has been widely used, its application is limited to the calculation of each obstacle factor’s degree, and there is limited research on the identification of key obstacle factors.
In summary, this study takes the Huojitu well in a typical shallow-buried high-intensity mining area in the western region of China as the research area. We present the theory of key elements in the ecological restoration of mining areas, develop an index system for ecological restoration obstacles and establish a model for identifying key elements of ecological restoration based on the coupling of obstacle degree and Shefold’s restrictive law (Erofeeva, 2021). The quantitative diagnosis of the obstacle factors affecting the ecological restoration of the mining area is carried out, and the key elements affecting the ecological restoration are identified. Different restoration strategies are formulated for different key elements in order to achieve an efficient ecological restoration of the mining area. The results have important theoretical and practical significance for dealing with the relationship between artificial restoration and natural restoration and realizing the harmonious coexistence of man and nature in mining areas.
2 Overview of the study area and data sources
2.1 Overview of the study area
Huojitu Mine of Daliuta Coal Mine area is located in the transition zone between the northern Loess Plateau and the Mu Us Desert between 39°9′32′′∼39°16′ 51″ N and 110°6′11′′∼110°16′32″ E, with an area of 110 km2 (as depicted in Figure 1). This area belongs to the typical shallow-buried high-intensity mining areas in western China. As is typical of continental climates in arid and semi-arid plateau regions, the weather is dry and seldom rains more than 400 mm per year, most of which falls between the months of July and September (Wang et al., 2024). The terrain is characterized by “low around and high in the middle,” with an elevation of 1,025 ∼ 1,273 m. Erosion, poor corrosion resistance, and a generally loose structure characterize the soil. Vegetation is evenly distributed. Plant communities are mainly drought and cold-resistant psammophytes and xerophytes, showing a sparse shrub landscape. The ecological environment is very fragile and vulnerable to external influences. The coal reserves of the area are estimated to be approximately 950 million tons, with the recoverable reserves measuring 624 million tons. The substantial thickness of the coal mining faces, the shallow depth of the coal seam, the uncomplicated geological conditions. At the same time, the surface cracks in the study area are dense, the soil nutrients are lost and the micro-topography is broken., and the rapid advancement of the working face result in exacerbated overburden damage and significant surface ecological degradation.
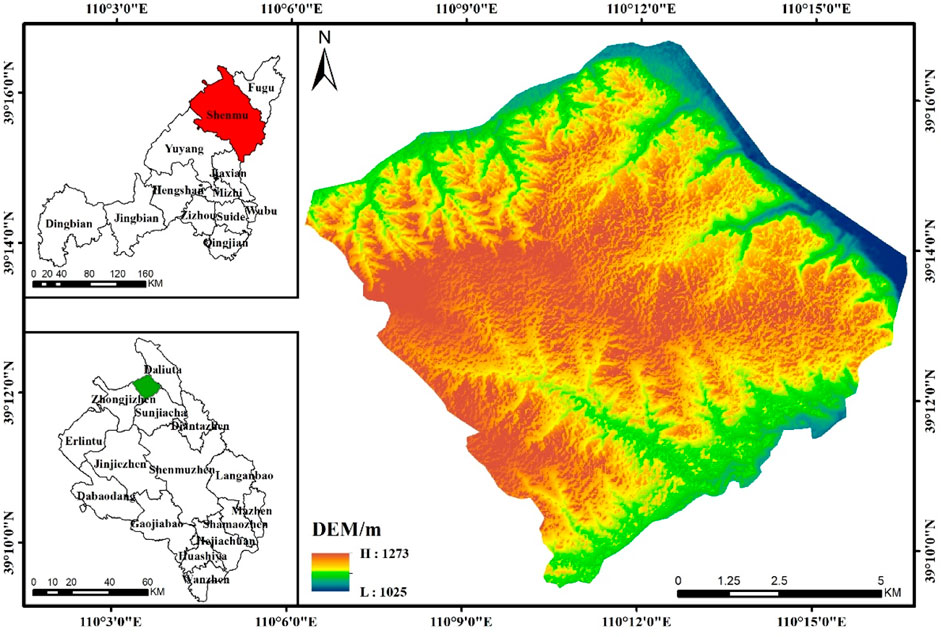
Figure 1. Geographical location of the study area.
2.2 Data sources and preprocessing
The main data sources used in this research are provided in Table 1.
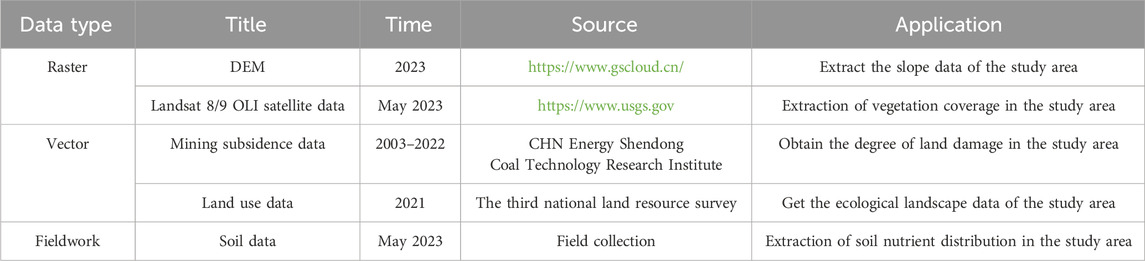
Table 1. Data source.
2.2.1 Raster data
Raster data mainly included digital elevation model (DEM) and Landsat 8/9 OLI satellite data. DEM data has a spatial resolution of 30 m (https://www.gscloud.cn/). ArcGIS 10.8 software is used to mosaic, splice and cut elevation data. Slope and aspect information were extracted using the spatial analysis module to obtain the terrain bit index. Landsat data was used to derive vegetation coverage. The data for May 2023 was obtained on the GEE cloud platform (https://code.earthengine.google.com/) with a temporal resolution of 16 days and a spatial resolution of 30 m. An NDVI image in 2023 was obtained on GEE. Finally, a vector file was used for clipping the NDVI layer to the boundary of the study area.
2.2.2 Vector data
Vector data included land use and mining subsidence data. Land use data in 2023 was provided by the department of natural resources. Mining subsidence data including the mining subsidence prediction and field subsidence monitoring data was provided by the mining enterprises. There are open-pit mines and underground mines in the study area. Open-pit mines have caused serious damage to the surface. The impact of mining activities on the surface include surface subsidence and surface cracks. Due to the timely of cracks in the mining area, the assessment of land damage in the disturbed area of the underground mine is based solely on surface subsidence data, and the evaluation results are converted into 30 m grid data.
2.2.3 Field data
The fieldwork data encompassed soil data, collected in May 2023. A total of 72 sample points was selected in the 110 km2 study area. The distribution of sample points is shown in Figure 2. The flora in the study area predominantly consists of drought-resistant species, including sea buckthorn. The roots are extensive, with the majority concentrated within the top 20 cm layer of the soil. Therefore, soil samples at the depth of 0 ∼ 20 cm were collected from each point to determine total nitrogen, total phosphorus, available nitrogen, available phosphorus and organic matter content (Table 2). The ordinary Kriging method was used to interpolate the soil data in the study area. The soil was resampled to 30 m, to maintain the spatial consistency with other data layers.
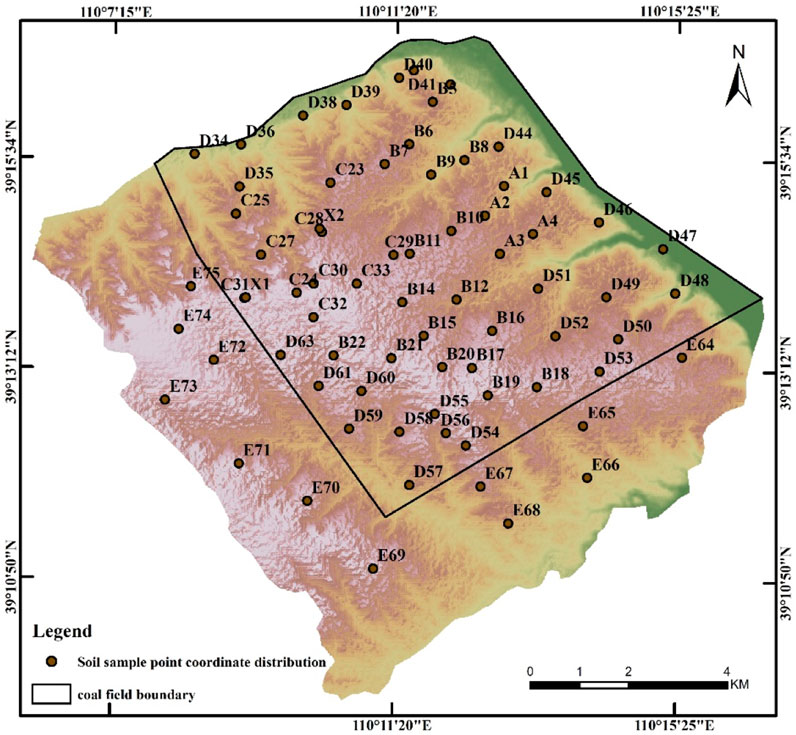
Figure 2. The distribution map of soil sampling points in the study area.
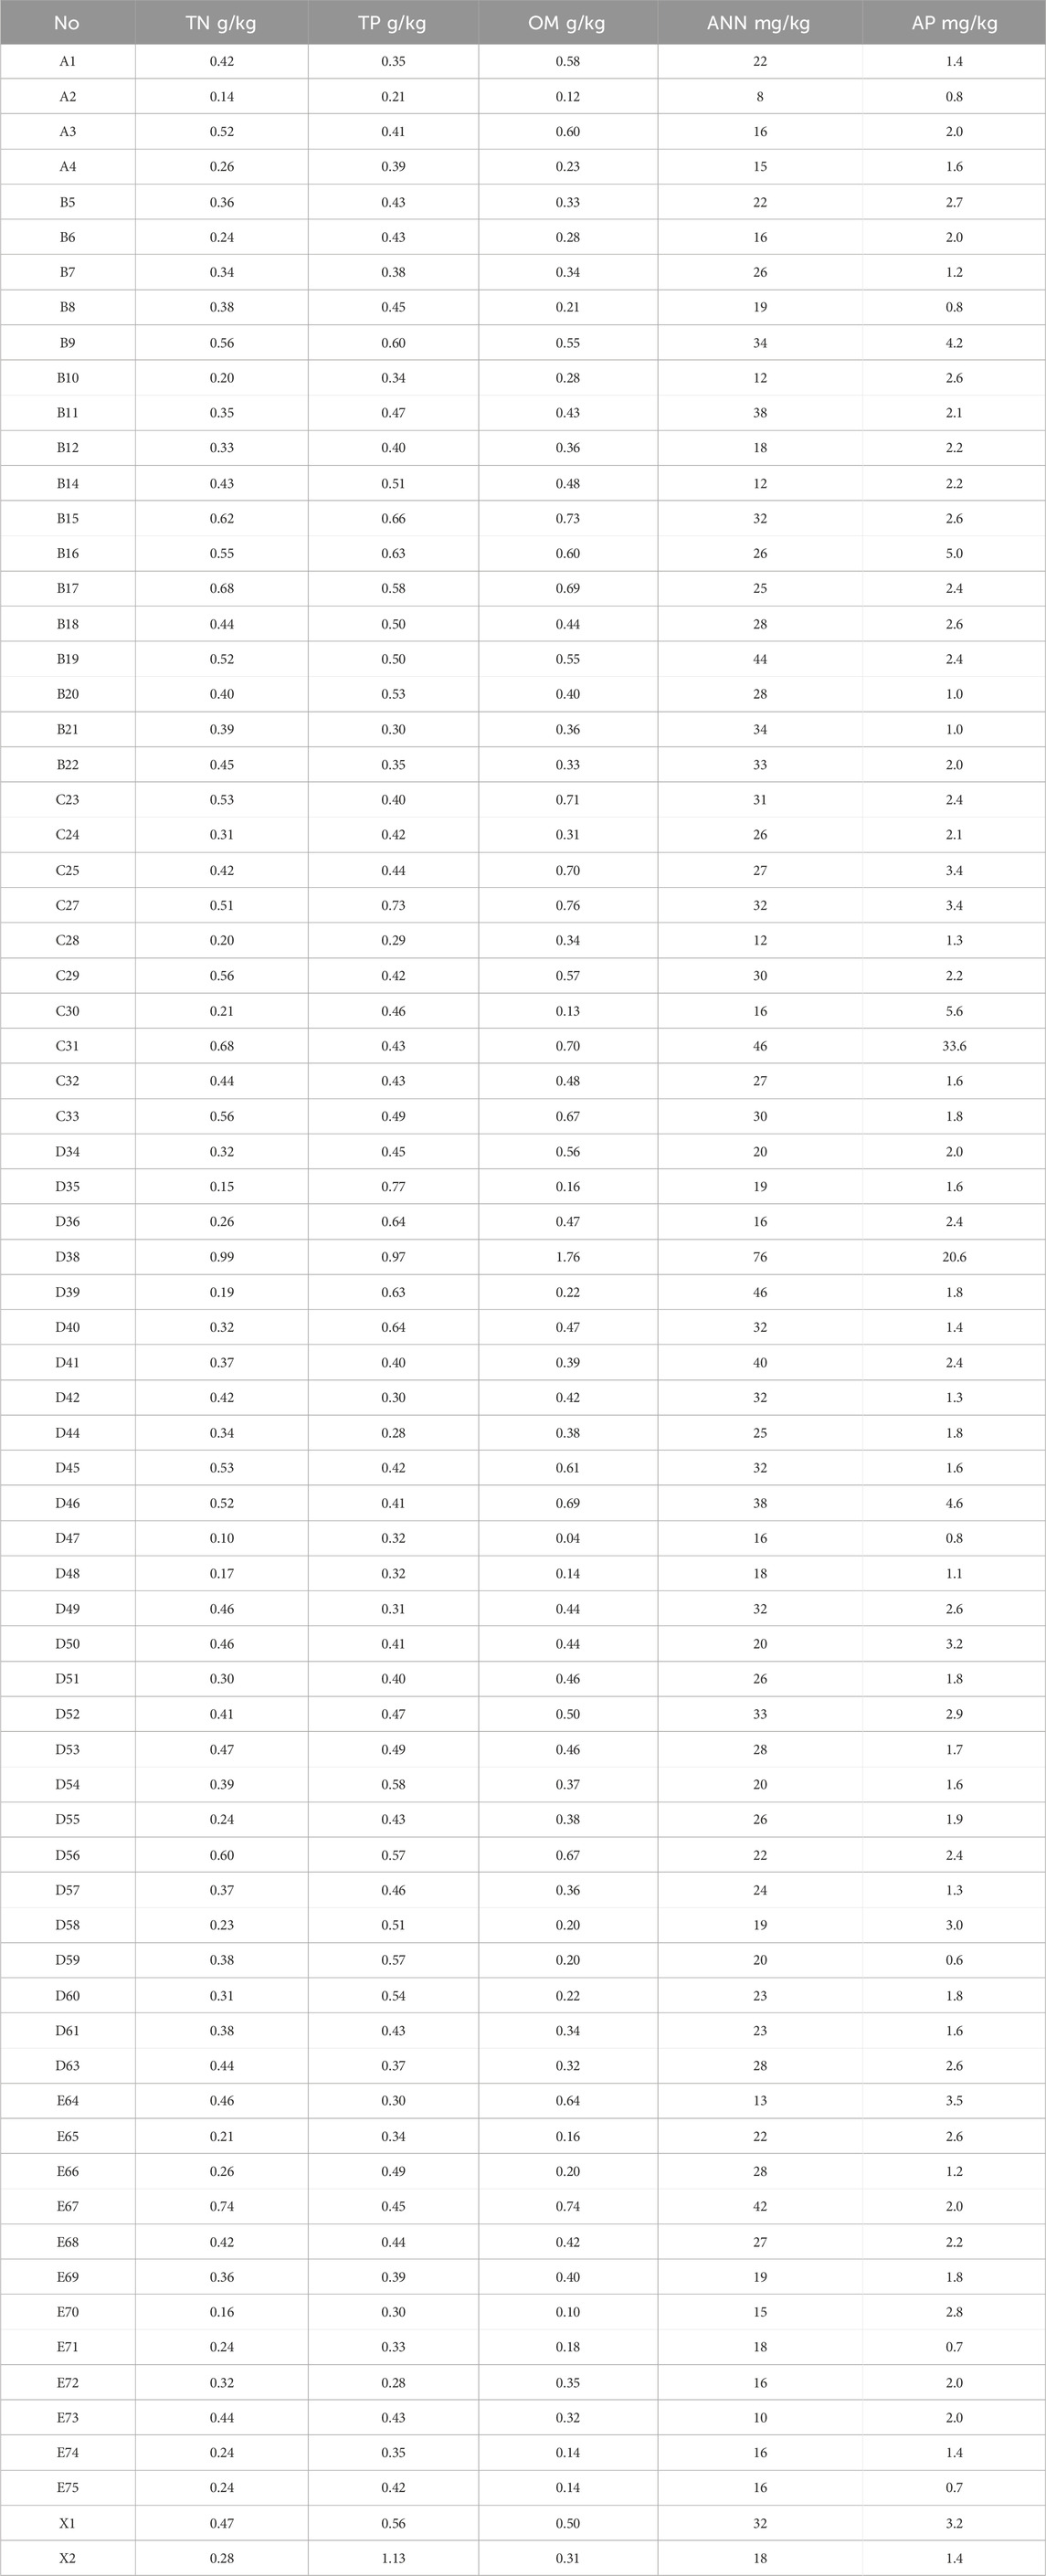
Table 2. Sampling point data.
3 Research methodology
The paradigm of ecological restoration in mining areas is undergoing a strategic transition from complete reliance on artificial interventions toward moderate human assistance to facilitate natural regeneration, ultimately establishing a hybrid framework where artificial restoration serves as supplementary support to nature-driven rehabilitation. This evolving approach, profoundly aligned with the inherent mechanisms of vegetation succession, demonstrates enhanced compatibility with ecosystem self-organization processes. Under this conceptual framework, blanket interventions targeting all restoration obstacles across the study area prove scientifically unsound.
To systematically identify critical limiting factors in different subregions, this study employs an obstacle degree model for quantitative assessment of ecological constraints. Grounded in Shelford’s Law of Tolerance (proposed by American ecologist Victor Ernest Shelford in 1913), which postulates that organism survival and reproduction are governed by multiple ecological factors operating within species-specific tolerance ranges, we conduct a rigorous analysis of ecosystem vulnerability thresholds. Through integration of Shelford’s limiting factor theory with spatial diagnostics, this research precisely pinpoints dominant obstacles as restoration priorities—those factors exceeding biological tolerance limits and constituting primary ecological bottlenecks.
This methodology enables science-based optimization of intervention intensity, strategically removing critical barriers while preserving ecosystem autonomy. The implemented measures effectively catalyze spontaneous vegetation recovery processes, ultimately achieving sustainable self-restoration and development of regional ecosystems through minimized yet targeted human assistance.
3.1 Obstacle factor index system
Table 3 shows the results of the study’s index system of ecological restoration obstacles in mining areas. The study area exhibits pronounced surface deformation induced by intensive anthropogenic excavation activities. Superimposed upon its unique geomorphic setting within the transitional zone of the Loess Plateau, this region demonstrates dramatic topographic relief. Concomitantly, the surface soil structure displays marked degradation trends, primarily manifested through enhanced sandification and organic matter depletion. Meanwhile, densely distributed industrial and mining operations have amplified regional ecological stress, while frequent human engineering activities (e.g., road construction and settlement expansion) have precipitated highly fragmented patterns in vegetation coverage zones. The synergistic interactions of these multiple stressors have resulted in direct vegetation destruction and progressive degradation of ecological functionality. Eleven factors were selected from five categories: vegetation cover, soil, ecological landscape, land damage, and site conditions.
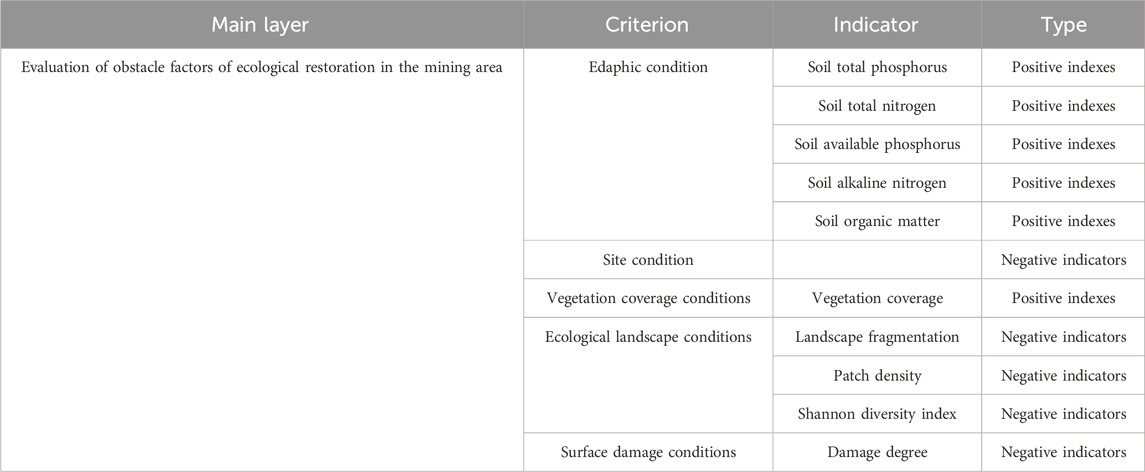
Table 3. Index system of ecological restoration obstacle factors in mining area.
3.2 Key elements of ecological restoration in the mining area based on the obstacle degree model
3.2.1 Obstacle factor and degree calculation based on the obstacle degree model
The identification of the key elements of ecological restoration in mining area based on obstacle degree model includes: determining the weight of each obstacle factor by entropy weight method, calculating the obstacle degree of each obstacle factor affecting the ecology of mining area, and calculating the obstacle degree of each target layer. After determining the obstacle degree of each obstacle factor, the obstacle factors are sorted. The specific steps are as follows:
(1) The entropy weight method is used to determine the factor contribution
The factor contribution reflects the importance of each obstacle factor to the ecological restoration of the mining area. This study employed the entropy weight method to ascertain the weight of each obstacle factor, effectively mitigating the impact of subjective evaluation on the weights and enhancing their accuracy. The procedure for ascertaining the weight of obstacle factors is as follows:
The values of
Normalized matrix
The meaning of
Here,
Then the entropy value is calculated as:
In Formula 4
Finally, n entropy weights corresponding to n indexes are calculated according to Formula 5:
The n entropy weights must satisfy the condition
(2) The deviation of the obstacle factor indicators is determined
The deviation of the obstacle factor indicators for the ecological restoration of the mining areas indicates the distance between each obstacle factor and the overall goal of ecological restoration in the mining area. It is calculated as:
Matrix
Where
Matrix
(3) The obstacle factor obstacle degree is determined
The obstacle degree signifies the extent to which each obstacle factor impedes ecological restoration in mining areas, which calculated as:
By assuming a matrix
3.2.2 Shefold’s restrictive law is used to identify key elements for ecological restoration
According to Equations 6–10, the obstacle degree
Where
4 Results
4.1 Indicator weight results
The weights of ecological restoration obstacle factors in the study area are provided in Table 4.

Table 4. The weights of ecological restoration obstacle factors in the study area.
4.2 Obstacle degrees
This study divided the research area into a grid of 450 rows and 495 columns, with each grid cell measuring 30 m × 30 m, using the grid as the evaluation unit. From five aspects—soil conditions, site, vegetation cover, ecological landscape, and surface damage—and after calculating the weights and obstacle degrees of various ecological restoration obstacle factors, the natural breaks method (Jenks optimization) was systematically applied to classify obstacle intensities into four distinct tiers, the distribution of obstacle degrees for each indicator was obtained (Table 5).
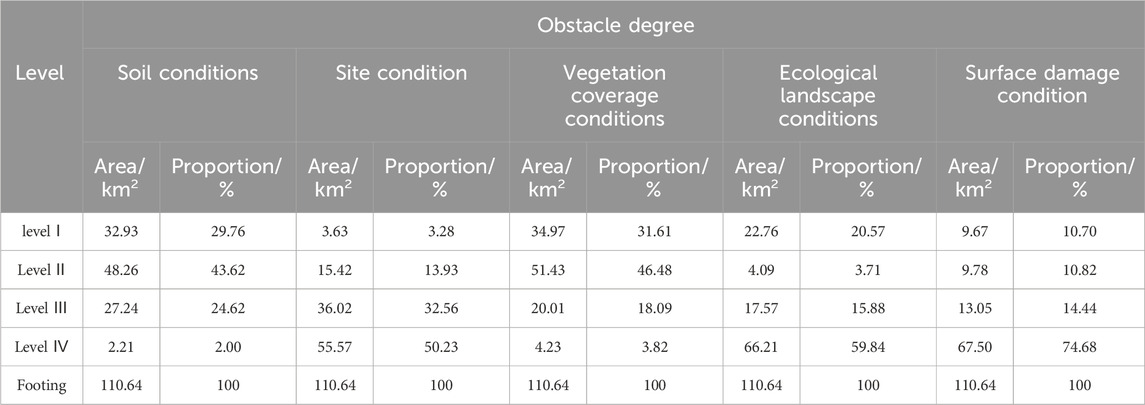
Table 5. Statistical classification of obstacle degrees for ecological restoration factors in the research area.
4.2.1 Soil conditions
The obstacle degree of soil conditions is calculated based on five nutrient indicators: soil alkaline hydrolysis nitrogen, available phosphorus, organic matter, total nitrogen, and total phosphorus. The distribution of soil nutrient obstacle degrees are shown in Figure 3. As can be seen in Figure 4, the obstacle degree of soil condition ranges from 0.00 to 0.10. The total area of the regions with an obstacle degree less than 0.07 (i.e., Level III and IV) was 29.45 km2, accounting for 26.62% of the total research area. The total area of the regions with an obstacle degree between 0.07 and 0.09 (i.e., Level II) was 48.26 km2, representing 43.62% of the total research area. These regions were mainly distributed outside the underground mining area and within the secondary mining area. The total area of the regions with an obstacle degree between 0.09 and 0.10 (i.e., Level I) was 32.93 km2, comprising 29.76% of the total research area, primarily located in the primary mining area and the eastern part of the research area. Overall, the soil condition in the research area was relatively good, with all regions having soil condition obstacles below 0.10.
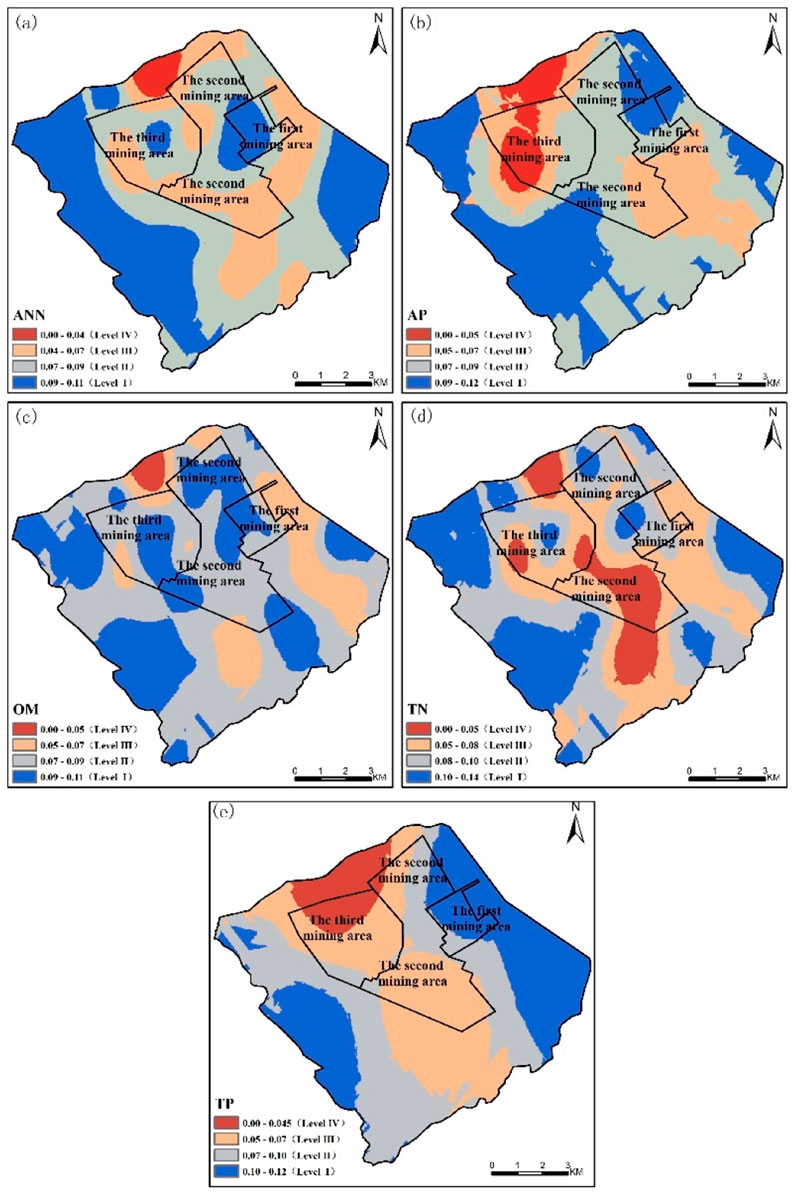
Figure 3. Obstacle Degree of Soil Condition (a) Alkaline Hydrolysis Nitrogen; (b) Available Phosphorus; (c) Organic Matter; (d) Total Nitrogen; (e) Total Phosphorus).
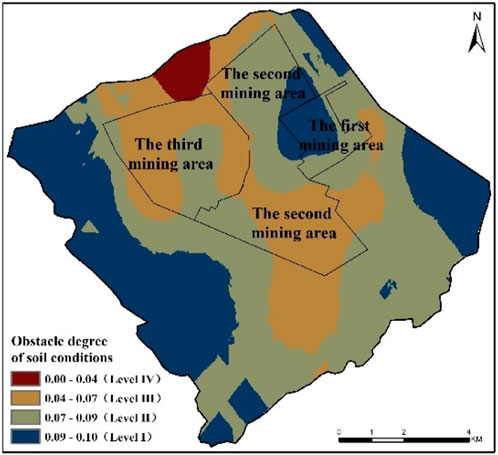
Figure 4. Comprehensive obstacle degree of soil condition in the research area.
4.2.2 Obstacle degree of site conditions
As in Figure 5, the obstacle degree of the site conditions was distributed between 0 and 0.62. However, areas with a higher obstacle degree were mainly located in the hilly regions surrounding the research area, with the eastern and northern regions being most prominent. The area where the obstacle degree of site conditions exceeds 0.24 was 3.63 km2, accounting for 3.28% of the total area of the research zone. In other areas, the overall site condition was relatively good, with essentially no obstacles.
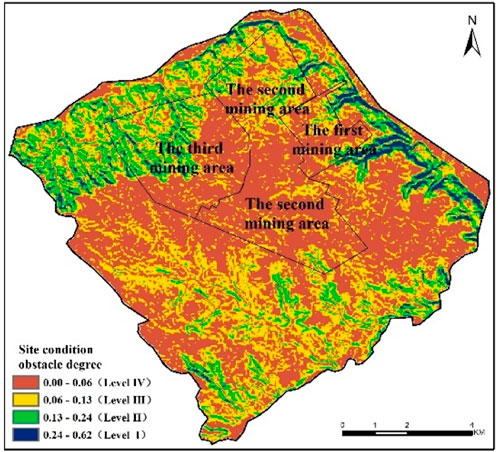
Figure 5. Obstacle degree of site conditions.
4.2.3 Obstacle degree of vegetation coverage conditions
From Figure 6, it can be seen that the obstacle degree of vegetation coverage conditions ranges from 0 to 0.10. The area with an obstacle degree of less than 0.08 (i.e., Level IV and Level III), primarily distributed in the southwestern part of the study area, was 24.24 km2, accounting for 21.91% of the total area. The area with an obstacle degree between 0.08 and 0.09 (i.e., Level II) was 51.43 km2, making up 46.48% of the total area of the research zone. The area with an obstacle degree between 0.09 and 0.10 (i.e., Level I) was 34.97 km2, accounting for 31.61% of the total area, mainly located in the open-pit mines in the northern part and the urban areas in the eastern part of the research area.
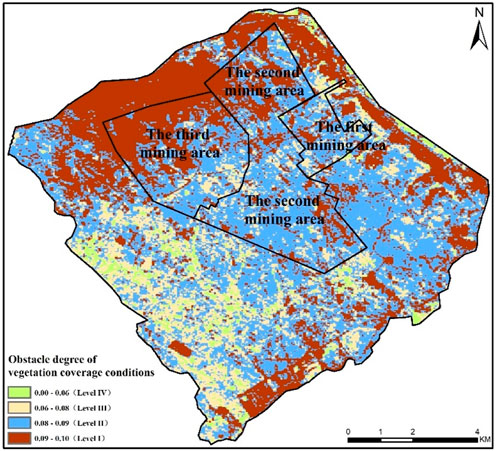
Figure 6. Obstacle degree of vegetation coverage conditions.
4.2.4 Obstacle degree of ecological landscape conditions
The ecological landscape condition included landscape diversity index, landscape patch density index, and landscape separation index as shown in Figure 7. Landscape diversity can increase the complexity and stability of the ecosystems, promoting ecological restoration in mining areas. The landscape fragmentation index and patch density index directly affect the difficulty of ecological restoration. Higher patch density and landscape fragmentation values indicate a higher degree of landscape fragmentation, necessitating proactive measures to reduce the number of patches, enhance patch connectivity, and promote ecological recovery. As seen in Figure 8, the obstacle degree of ecological landscape condition in the study area was relatively low, with an area greater than 0.11 (i.e., Levels I and II) covering 26.85 km2, accounting for 24.28% of the total area. The elevated obstacle degree was primarily attributable to fragmented plots, significantly influenced by the occupation and fragmentation of construction land, resulting in increased landscape fragmentation, which subsequently impairs ecological restoration efficiency in the mining area.
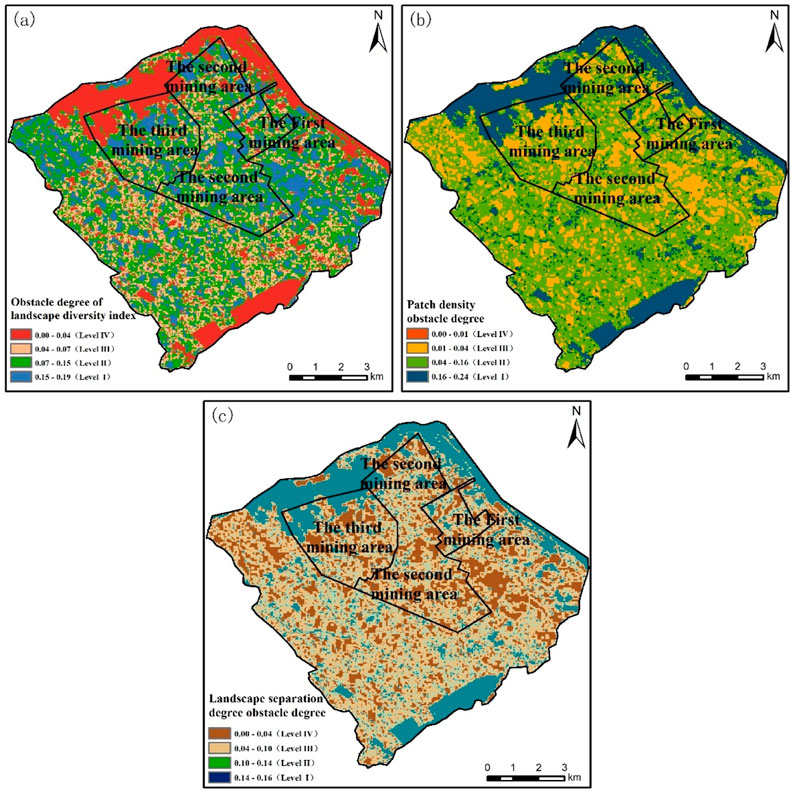
Figure 7. Obstacle degree of ecological landscape condition (a) landscape diversity index; (b) patch density; (c) landscape separation degree).
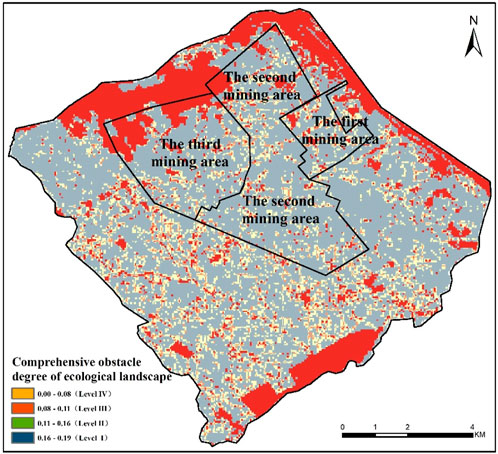
Figure 8. Comprehensive obstacle degree of ecological landscape condition.
4.2.5 Obstacle degree of surface damage conditions
The results of the obstacle degree of surface damage condition are shown in Figure 9. The undisturbed zone covered 74.68 km2, accounting for 67.50% of the total area. The area with an obstacle degree ranging from 0.03 to 0.22 (i.e., levels II and III) was 25.26 km2, accounting for 22.83% of the total area. This region was predominantly located within the disturbed zone of the subterranean mines. The area with an obstacle degree ranging from 0.22 to 0.59 (i.e., level I) covered 10.70 km2, accounting for 9.67% of the total. It was mainly located in the disturbed area of the open-pit mines in the northern part of the study area.
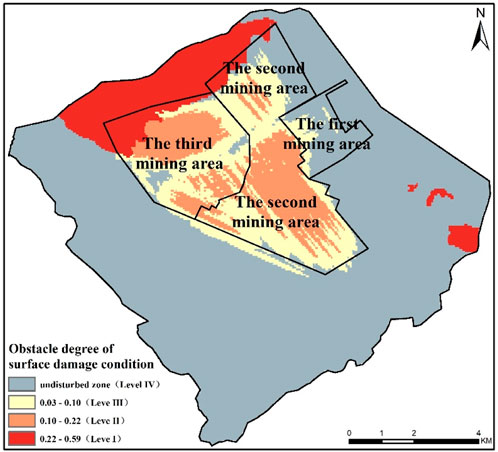
Figure 9. Obstacle degree of land damage level.
4.3 Identification of key elements for ecological restoration in mining areas
Ecological restoration in mining regions must identify the most pressing needs and key elements affecting restoration efforts, in order to specifically mitigate these obstacles during the restoration process and tackle the primary issues. Therefore, this paper analyzes the obstacle degree of various ecological restoration obstacle factors and calculates the key elements for ecological restoration in each region based on the Shefold’s restrictive law. The distribution of the key elements for ecological restoration in the study area is shown in Table 6; Figure 10.
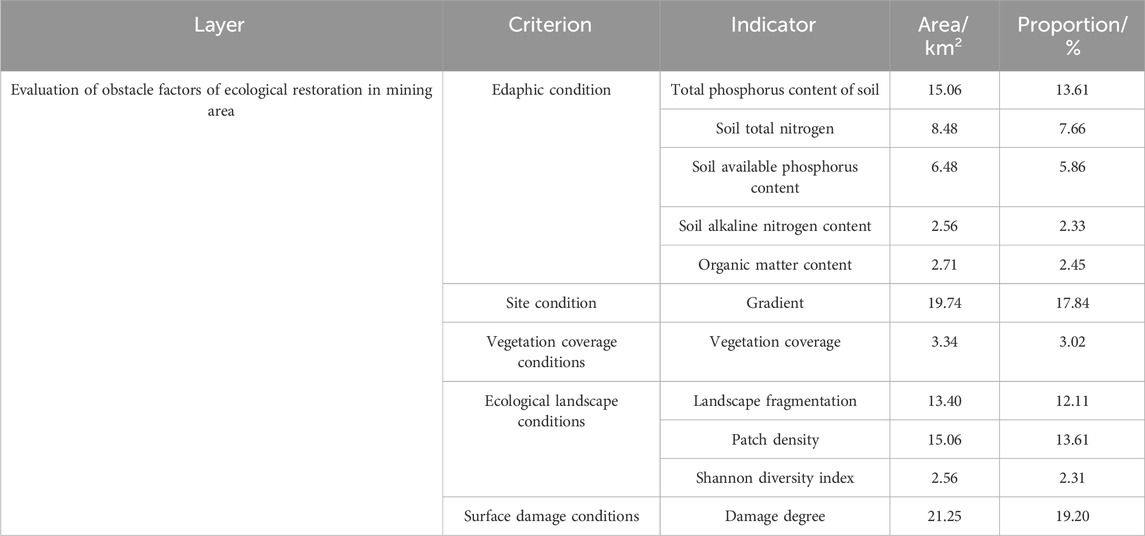
Table 6. Key elements Areal cover for ecological restoration in the study area.

Figure 10. Distribution of key elements for ecological restoration in the study area.
The distribution of key factors for ecological restoration in the study area is shown in Figures 5–8. The region affected by land degradation, which is pivotal for ecological restoration, spans 21.25 km2, representing 19.20% of the total study area, predominantly located in the open-pit mining zone, secondary mining zone, and tertiary mining zone. This is followed site condition (19.74 km2∼ 17.84%) in the hilly areas surrounding the study area; soil condition (35.29 km2∼31.91%) located in the cultivated land in the western and central parts of the study area, the observed phenomenon primarily stems from the gentle topography and peripheral positioning beyond underground mining disturbance zones in these areas, where land degradation remains comparatively mild. Such geomorphological advantages create fundamentally favorable edaphic conditions for spontaneous vegetation recovery. Paradoxically, despite these advantageous preconditions, soil nutrient constraint intensity emerges as the predominant limiting factor, presenting a critical bottleneck that substantially impedes ecological restoration progress in these specific sectors; vegetation cover (3.34 km2∼ 3.02%) distributed at the boundary between the disturbed open-pit mining area and the tertiary mining area, as well as the boundary of the primary mining area; and, ecological landscape (31.08 km2∼ 28.03%) located within the urban disturbance area.
Various levels of focused intervention strategies are necessary depending on the kinds of key elements for ecological restoration in the research region. In terms of area, regions where soil conditions and ecological landscape conditions were considered as key factors had the widest range, primarily distributed in relatively flat areas outside the disturbed zones of underground and open-pit mining area. This area poses relatively low restoration difficulty. Improving soil conditions and restoring surface vegetation are crucial steps in the subsequent ecological restoration process. These actions will help achieve the specific restoration goals of enhancing the continuity and diversity of the ecological landscape.
From the perspective of restoration difficulty, regions where land degradation and site conditions were the key factors for ecological restoration posed the greatest challenges. These areas were mainly distributed in the open-pit mining, underground mining, and the gully zones disturbed areas surrounding the study area. For those areas with significant site condition obstacles, techniques such as slope protection and anchor reinforcement should be employed for vegetation recovery, with long-term monitoring and maintenance afterward to prevent vegetation degradation. For areas with significant surface damage obstacles, different restoration methods should be applied based on the types of surface damage. It is recommended to employ geomorphological reconstruction and soil improvement techniques to make the restored ecosystem more self-sufficient in areas where land degradation has occurred as a result of excavation and compaction. In regions significantly impacted by surface subsidence, it is essential to consider factors such as mining face and extraction intensity parameters, and to develop a cooperative restoration model for source damage mitigation and vegetation rehabilitation.
Within subsurface mining zones exhibiting moderate disturbance intensities, soil nutrient deficiency emerges as the dominant constraint factor. Conversely, in intensively disturbed sectors and surface mining areas, geomorphological destruction constitutes the primary restoration bottleneck, where catastrophic terrain alterations necessitate landform reconstruction as the prerequisite rehabilitation objective. This spatial divergence in constraint mechanisms reveals a fundamental dichotomy between edaphic limitation and geotechnical challenges in post-mining ecosystem recovery.
5 Discussion
In this study, when calculating the degree of obstacles, the degrees of obstacles related to soil conditions, vegetation cover conditions, and ecological landscape conditions are generally low, distributed in the ranges of 0–0.1, 0–0.094, and 0–0.194, respectively. In contrast, the degrees of obstacles associated with site conditions and land damage conditions are relatively high, concentrated in the ranges of 0–0.62 and 0.033–0.589.
In the distribution of key ecological restoration factors, the area where soil conditions, vegetation cover conditions, and ecological landscape conditions are considered key factors for ecological restoration reaches 69.71 km2, accounting for 62.96% of the total area of the study area. This indicates that in the study area, the maximum degree of obstacle factors is primarily below 0.2 in most regions, suggesting that only positive interventions are needed in the subsequent restoration process to achieve ecological self-recovery. In contrast, the total area where site conditions and land damage conditions are key factors for ecological restoration is 40.99 km2, making up 37.04% of the total area, and the degree of obstacle factors in this portion is high, resulting in greater restoration difficulty.
Based on the Shefold restrictive theorem, this study identifies the obstacle factor with the highest degree of obstruction in the region as a key element for ecological restoration. Targeted restoration measures are further applied to different key ecological restoration factors to reduce the negative impacts of obstacle factors on the ecology of the mining area, enhance the ecological stability of the area, and promote ecological construction. The proposed management measures and recommendations are as follows:
(1) Conventional obstacle degree models predominantly focus on quantifying constraint intensities and analyzing their spatial distributions, yet critically lack systematic prioritization mechanisms for multiple coexisting constraints within defined geographical units. Addressing this methodological gap, our study introduces an innovative identification framework that integrates maximum constraint screening with traditional obstacle degree calculations. This advancement enables systematic identification of the dominant limiting factor—the variable exhibiting peak obstacle intensity—which constitutes the pivotal restoration determinant in target areas.
(2) This study reveals the spatial differentiation characteristics of key elements in mining area ecological restoration and their coupling mechanisms with mining activities. Spatial analysis demonstrates significant spatial coupling between regions where land damage constitutes the critical ecological restoration element and the distribution of underground mining subsidence zones and open-pit mining areas, indicating that mining engineering directly induces the destruction of surface soil structures. Restoration areas where site conditions are identified as the key ecological restoration element exhibit pronounced spatiotemporal heterogeneity, with their spatial distribution patterns showing a significant positive correlation with topographic factors (slope), which highlights the foundational control of terrain elements on ecological restoration processes. Notably, restoration units constrained by vegetation cover conditions and soil physicochemical properties display spatial distribution characteristics distinct from secondary mining disturbance zones, primarily concentrated in primary mining disturbance zones and non-disturbed areas. This phenomenon suggests that mining activities, by altering surface stress fields and material migration pathways, generate specific ecological degradation gradients. The spatial overlap between ecological degradation units and mining subsidence ranges in the study area conclusively corroborates mining disturbance as the primary driver of regional ecosystem degradation, with impact mechanisms involving multiple stressors such as physical destruction, chemical pollution, and biodiversity loss.
(3) For areas with high obstacle degrees in surface damage conditions, differentiated restoration techniques should be applied based on damage types. In regions impacted by surface excavation and compaction, landform reshaping and soil improvement technologies should be employed to enhance the self-sustaining capacity of reconstructed ecosystems. For areas severely affected by surface subsidence, parameters such as coal mining face configurations and extraction intensity must be considered to establish a collaborative restoration model integrating source damage control and vegetation reconstruction.
(4) In identifying key ecological restoration elements, this study utilized the entropy weight method to determine indicator weights. While this approach enhances objectivity, it assigns weights solely based on data dispersion without distinguishing between positive or negative directional impacts of indicators on ecological restoration. Future research could optimize directional sensitivity by incorporating models such as TOPSIS (Technique for Order Preference by Similarity to Ideal Solution).
6 Conclusion
This article takes the Huojitu mine in a typical shallow buried high-intensity mining area in the western region of China as the research area. From five aspects—vegetation cover, soil, ecological landscape, land degradation, and site conditions—an index system was constructed for the ecological restoration obstacles in the mining area. An identification model for key ecological restoration factors was established, which was based on the coupling of obstacle degree and Shefold’s restrictive law. The identification of key ecological restoration factors in the research area was carried out with the main conclusions as follows:
(1) The entropy weight method enhances objectivity in index weighting. The obstacle degree model quantifies deviation from ideal states. Their combination achieves precise identification of critical restoration elements.
(2) Soil condition emerges as the predominant obstacle (35.29 km2, 31.91%), followed by ecological landscape (31.08 km2), land damage (21.25 km2), and site conditions (19.74 km2).
(3) Differentiated strategies: Soil improvement (micro-topography remodeling + vegetation restoration), site condition areas (lattice slope protection + anchor reinforcement + long-term monitoring), land damage zones (landform reconstruction + source control collaborative restoration).
Data availability statement
The raw data supporting the conclusions of this article will be made available by the authors, without undue reservation.
Author contributions
HZ: Writing – original draft, Writing – review and editing. ZZ: Writing – original draft, Writing – review and editing. SW: Writing – original draft, Writing – review and editing. YoZ: Writing – original draft, Writing – review and editing. ZC: Writing – original draft. YaZ: Writing – original draft. QC: Writing – original draft. YJ: Writing – review and editing. YL: Writing – review and editing. HD: Writing – review and editing.
Funding
The author(s) declare that financial support was received for the research and/or publication of this article. This work was supported by the National Natural Science Foundation of China (Grants: U22A20620, U21A20108), Double First Class Discipline Creation Project of Surveying and Mapping Science and Technology (GCCRC202402). Heartfelt appreciation is also expressed to the anonymous reviewers and the editors, whose insightful comments significantly enhanced the quality of this manuscript.
Conflict of interest
The authors declare that the research was conducted in the absence of any commercial or financial relationships that could be construed as a potential conflict of interest.
Generative AI statement
The author(s) declare that no Generative AI was used in the creation of this manuscript.
Publisher’s note
All claims expressed in this article are solely those of the authors and do not necessarily represent those of their affiliated organizations, or those of the publisher, the editors and the reviewers. Any product that may be evaluated in this article, or claim that may be made by its manufacturer, is not guaranteed or endorsed by the publisher.
References
Almassi, B. (2021). Value disputes in urban ecological restoration: lessons from the Chicago Wilderness. Stud. Hist. Philosophy Sci. Part A 87, 93–100. doi:10.1016/j.shpsa.2021.03.007
Bendfeldt, E. S., Burger, J. A., and Daniels, W. L. (2001). Quality of amended mine soils after sixteen years. Soil Sci. Soc. Am. J. 65, 1736–1744. doi:10.2136/sssaj2001.1736
Chai, N., Zhou, W., and Wan, B. (2022). Research on performance evaluation and obstacle diagnosis for urban water ecological civilization construction based on GFAHP-cloud-FSE model: the case of Shizuishan, China. Stoch. Environ. Res. Risk Assess. 36, 3439–3465. doi:10.1007/s00477-022-02203-4
Chen, J. J., Nan, H., Yan, W. T., Guo, W. B., and Zou, Y. F. (2016). Features of surface dynamic movement and deformation caused by high intensity mining with shallow depth. Coal Sci. Technol. 44, 158–162. doi:10.13199/j.cnki.cst.2016.03.030
Chen, X. H., and Yang, L. (2013). Obstacle diagnosis model based on the catastrophe progression method and its applications for the small and medium-sized enterprises. Systeins Engineering-Theory and Pract. 33, 1479–1485. doi:10.12011/1000-6788(2013)6-1479
Chen, F., Song, X. J., Dong, W. X., Zhu, Y. F., You, Y. N., and Ma, J. (2024). Effects of land reclamation on soil bacterial community assembly and carbon sequestration function in coal mine subsidence area: taking Dongtan Mining Area as an example. Coal Sci. Technol. 52, 345–354. doi:10.12438/cst.2023-1221
Cheng, X., Long, R. Y., and Chen, H. (2018). Obstacle diagnosis of green competition promotion: a case study of provinces in China based on catastrophe progression and fuzzy rough set methods. Environ. Sci. Pollut. Res. 25, 4344–4360. doi:10.1007/s11356-017-0762-z
Chen, Y., Zhu, M. K., Lu, J. L., Zhou, Q., and Ma, W. B. (2020). Evaluation of ecological city and analysis of obstacle factors under the background of high-quality development: taking cities in the Yellow River Basin as examples. Ecol. Indic. 118, 106771. doi:10.1016/j.ecolind.2020.106771
Chi, G. M., Chen, S. S., Wang, W., Wang, S. D., Zhu, Z. Y., Jiao, Y. H., et al. (2024). Research on ecological restoration area delineation in mining area based on Entropy-weighted Extension Matter-element Model: a case study in Huojitu Mine. J. Henan Polytech. Univ. Sci., 1–16. doi:10.16186/j.cnki.1673-9787.2024030082
Crouzeilles, R., Ferreira, M. S., Chazdon, R. L., Lindenmayer, D. B., Sansevero, J. B. B., Monteiro, L., et al. (2017). Ecological restoration success is higher for natural regeneration than for active restoration in tropical forests. Sci. Adv. 3, e1701345. doi:10.1126/sciadv.1701345
Cui, Z., Wang, Z. G., Zhang, X. R., Wang, Y. Y., and Zhang, M. (2022). Evaluation of regional environmental carrying capacity and its obstacle indicators diagnosis: evidence from three major urban agglomerations in China. Front. Environ. Sci. 10. doi:10.3389/fenvs.2022.1015158
Du, H. D., Cao, Y. C., Nie, W. J., and Song, S. J. (2021). Evolution of soil properties under artificial and natural revegetation in loess gully coal mining subsidence area. J. China Coal Soc. 46, 1641–1649. doi:10.13225/j.cnki.jccs.st20.1784
Erofeeva, E. A. (2021). Plant hormesis and Shelford's tolerance law curve. J. For. Res. 32, 1789–1802. doi:10.1007/s11676-021-01312-0
Gao, C., Xue, N. Z., He, B. Q., and Deng, W. N. (2019). Study on influence of key strata on surface subsidence law of fully mechanized caving mining in extra-thick coal seam. Coal Sci. Technol. 47, 229–234. doi:10.13199/j.cnki.cst.2019.09.029
Guo, W. B., Wu, D. T., Bai, E. H., Zhang, P., Hou, J. J., and Zhang, Y. Z. (2023). Current situation and prospect of intelligent green mining technology in coal mines in China. J. Henan Polytech. Univ. Sci. 42, 1–17. doi:10.16186/j.cnki.1673-9787.2022060037
Hao, C. M., Wang, Y. T., Yi, S. H., and Liu, S. (2025). Evolution of microbial carbon sequestration potential in farmland soil driven by natural restoration in coal mine subsidence area. Coal Sci. Technol., 1–15. doi:10.12438/cst.2024-0681
Hu, Z. Q., and Xiao, W. (2020). Some thoughts on green development strategy of coal industry: from aspects of ecological restoration. Coal Sci. Technol. 48, 35–42. doi:10.13199/j.cnki.cst.2020.04.002
Huang, H. P., Li, Y. L., and Qiao, X. Z. (2018). Evaluation and barrier factors analysis of agricultural circular economy based on lUOCE: a case study of Jiangxi Province. Chin. J. Eco-Agriculture 26, 916–925. doi:10.13930/j.cnki.cjea.170963
Jia, H. F., and Du, P. Y. (2024). Ecological security evaluation and obstacle factor diagnosis in Qinghai Province based on DPSIR-TOPSIS and obstacle degree models. Res. Agric. Mod. 45, 296–305. doi:10.13872/j.1000-0275.2024.0020
Jiang, L., Zuo, Q. T., Ma, J. X., and Zhang, Z. Z. (2021). Evaluation and prediction of the level of high-quality development: a case study of the Yellow River Basin, China. Ecol. Indic. 129, 107994. doi:10.1016/j.ecolind.2021.107994
Klaus, V. H., and Kiehl, K. (2021). A conceptual framework for urban ecological restoration and rehabilitation. Basic Appl. Ecol. 52, 82–94. doi:10.1016/j.baae.2021.02.010
Lei, S. G., Wang, W. Z., Li, Y. Y., Yang, X. C., Zhou, Y. L., Zhao, X. T., et al. (2023). Study on disturbance and restoration of soil organic carbon pool in large-scale open-pit mining areas in Northern China. Coal Sci. Technol. 51, 100–109. doi:10.12438/cst.2023-0965
Lei, S. G., Xia, J. N., Bian, Z. F., and Cheng, W. (2024). Near-natural ecological restoration in open-pit mine area. J. China Coal Soc. 49, 2021–2030. doi:10.13225/j.cnki.jccs.XH23.1689
Lei, X. P., Qiu, R., and Liu, Y. (2016). Evaluation of regional land use performance based on entropy 'TOPSIS model and diagnosis of its obstacle factors. Trans. Chin. Soc. Agric. Eng. 32, 243–253. doi:10.11975/j.issn.1002-6819.2016.13.035
Li, C. H., Huo, H. Y., Li, Y. J., and Hou, Y. (2015). Evaluation of low-carbon city competitiveness and its obstacle indicators analysis in Shandong Province. Resour. Sci. 37, 1474–1481. doi:10.12438/cst.2023-1221
Li, J. Y., Chen, X. X., Li, M. W., Zhang, N. N., Zhou, Z. Q., Li, X. M., et al. (2024). Community composition and structure pathways in subalpine forest, Sichuan Province, China. Aeta Ecol. Sin. 44, 3471–3482. doi:10.20103/j.stxb.202308151766
Li, X. M., and Yang, J. S. (2010). Indication of diagnosing salinity-alkalinity hazard of typical area in the huanghuaihai plain. J. Irrigation Drainage 29, 56–58. doi:10.13522/j.cnki.ggps.2010.04.001
Liao, Y. C., Xie, Y., Liu, J. Y., Zhu, Z. F., and Wu, Y. (2021). Ecological security dynamic assessment and obstacle factors analysis in Jiuzhaigou National Nature Reserve. Acta Ecol. Sin. 41, 5950–5960. doi:10.5846/stxb202002130243
Manhaes, A. P., Pantaleao, L. C., Moraes, L. F. D., Amazonas, N. T., Saavedra, M. M., Mantuano, D., et al. (2022). Functional trajectory for the assessment of ecological restoration success. Restor. Ecol. 30. doi:10.1111/rec.13665
Mao, X. M., Yang, Q. Y., Xin, G. X., Lu, C. Y., and Peng, K. (2007). Analysis of the main barrier factors for large-scale management of farmland in chongqing municipality. J. Southwest Univ. Nat. Sci. Ed., 146–150. doi:10.13718/j.cnki.xdzk.2007.12.032
Peng, S. P., and Bi, Y. L. (2024). Properties of ecological environment damage and their mechanism of restoration in arid and semi-arid coal mining area of western China. J. China Coal Soc. 49, 57–64. doi:10.13225/j.cnki.jccs.YH24.0156
Qu, Y. B., Zhu, W. Y., Y, W. J., Zhang, Y., and Gao, Y. (2017). Land consolidation spatial pattern and diagnosis of its obstacle factors based on pressure-state-response model. Trans. Chin. Soc. Agric. Eng. 33, 241–249. doi:10.11975/j.issn.1002-6819.2017.03.033
Shi, H. L., Zhang, L. X., Gan, F. L., Pu, J. B., Gou, J. F., and Liu, J. (2024). Soil quality evaluation and obstacle factors of erosion slop in karst trough valley area. J. Soil Water Conservation 38, 126–135. doi:10.13870/j.cnki.stbcxb.2024.02.007
Sun, X. B., Cai, W. M., Kong, X. B., Li, Q. F., and Zhao, J. (2023). Quality regulation pattern and consolidation time zone of county-level-cultivated land based on multi agent collaboration. Trans. Chin. Soc. Agric. Eng. 39, 232–245. doi:10.11975/j.issn.1002-6819.202308105
Sun, H., Deng, W., and Zhang, H. (2024). Spatial analysis and planning strategy of Linpan in Western Sichuan based on productionliving-ecological space: a case study of Tianma Town, Dujiangyan. J. Spatio-temporal Inf. 31, 431–443. doi:10.20117/j.jsti.202403008
Wang, D. D., Xiao, L., Bi, Y. L., Nie, W. J., and Zhang, K. (2024). Effects of AMF inoculation on plant-soil ecological stoichiometry and nutrient recovery in Shendong mine. Coal Sci. Technol. 52, 354–363. doi:10.12438/cst.2023-0273
Wang, Z. G., Huang, L. F., Yin, L. S., Wang, Z. X., and Zheng, D. D. (2022). Evaluation of sustainable and analysis of influencing factors for agriculture sector: evidence from jiangsu province, China. Front. Environ. Sci. 10. doi:10.3389/fenvs.2022.836002
Xia, M. F., Yu, H. M., Li, S., and Dan, C. L. (2021). Obstacle factor diagnosis of well-facilitated farmland construction based on ecological niche in Poyang Lake Plain. J. China Agric. Univ. 26, 182–190. doi:10.11841/j.issn.1007-4333.2021.07.18
Xiao, W., Ren, H., Zhao, Y. L., Wang, Q. Y., and Hu, Z. Q. (2023). Monitoring and early warning the spontaneous combustion of coal waste dumps supported by unmanned aerial vehicle remote sensing. Coal Sci. Technol. 51, 412–421. doi:10.13199/j.cnki.cst.2022-1901
Xu, F. Y., Guo, W. B., and Wang, C. (2023). Research on surface subsidence law in high-intensity mining of shallow buried with thick coal seam. Coal Sci. Technol. 51, 11–20. doi:10.13199/j.cnki.cst.2021-0821
Yang, D. M., Guo, W. B., Tan, Y., Wang, Y. X., Ma, X. C., and Li, Z. (2019). Lithology and fissure characteristics of overburden in high-intensity mining. J. China Coal Soc. 44, 786–795. doi:10.13225/j.cnki.jccs.2018.6044
Yang, J. Z., and Liu, Q. J. (2020). Analysis and measured of strata behavior law and mechanism of 8.8 m ultra-high mining height working face. Coal Sci. Technol. 48, 69–74. doi:10.13199/j.cnki.cst.2020.01.009
Yang, Z. K., Zhang, J. H., and Zhang, N. (2020). Key technology in complete set of equipment for high cutting fully mechanized caving face in extra-thick soft coal. Coal Eng. 52, 123–126. doi:10.11799/ce202008026
Yang, F., Chen, Z. M., and Gong, S. L. (2022). Evaluation of land resource carrying capacity in Liaoning Province based on AHP-entropy weight TOPSIS model. Bull. Soil Water Conservation 42, 144–149. doi:10.13961/j.cnki.stbctb.2022.01.020
Yang, Z., Li, C. W., Ren, Z. Y., Li, P., Xu, Y. T., Han, J. C., et al. (2023). Evaluation of land use performance in ningxia, China based on entropy-weight TOPSIS model and diagnosis of its obstacle factors. J. Earth Sci. Environ. 45, 796–805+766. doi:10.19814/j.jese.2022.08039
Yao, Q. L., Yu, L. Q., Chen, S. Y., Lil, Y. H., and Li, X. H. (2025). Mining-affected water resources and ecological effects in ecologically fragile mining areas of western China. J. China Coal Soc., 1–22. doi:10.13225/j.cnki.jccs.2023.1695
Yi, D., Ding, G. Q., Han, Y., Yi, J. L., Guo, J., and Ou, M. H. (2023). Integrated assessment and critical obstacle diagnosis of rural resource and environmental carrying capacity with a social-ecological framework: a case study of Liyang county, Jiangsu Province. Enviroment Sci. Pollut. Res. 30, 76026–76043. doi:10.1007/s11356-023-27509-w
Zhao, B. H., Huang, J. H., Li, Z. B., Li, Q., and Zhou, C. Y. (2023). Comprehensive evaluation and influencing factor analysis of urban ecological water security in Gansu Province based on AHP-entropy method. Bull. Soil Wateronservation 43, 167–173+213. doi:10.13961/j.cnki.stbctb.2023.01.020
Zhao, S. X., Niu, H. P., Zhang, H. W., Zhang, H. B., and Zhang, X. H. (2016). Suitability evaluation on high quality capital farmland consolidation based on niche-fitness model. Trans. Chin. Soc. Agric. Eng. 32, 220–228. doi:10.11975/j.issn.1002-6819.2016.12.032
Keywords: shallow mining, land degradation, ecological restoration, obstacle factor diagnosis model, Huojitu
Citation: Zhang H, Zhu Z, Wang S, Zou Y, Chen Z, Zhao Y, Chen Q, Jiao Y, Li Y and Du H (2025) Identifying key elements of ecological restoration in shallow-buried high-intensity mining area based on obstacle degree model a case study in Huojitu mine. Front. Environ. Sci. 13:1552181. doi: 10.3389/fenvs.2025.1552181
Received: 27 December 2024; Accepted: 14 April 2025;
Published: 28 April 2025.
Edited by:
Tianjiao Feng, Beijing Forestry University, ChinaReviewed by:
Yaokun Fu, China Coal Research Institute, ChinaXiuli Wang, Jiangxi University of Science and Technology, China
Bolin Li, Chang’an University, China
Copyright © 2025 Zhang, Zhu, Wang, Zou, Chen, Zhao, Chen, Jiao, Li and Du. This is an open-access article distributed under the terms of the Creative Commons Attribution License (CC BY). The use, distribution or reproduction in other forums is permitted, provided the original author(s) and the copyright owner(s) are credited and that the original publication in this journal is cited, in accordance with accepted academic practice. No use, distribution or reproduction is permitted which does not comply with these terms.
*Correspondence: Shidong Wang, wsd0908@163.com