 Umar Saeed
 Rashmi Das
 Sk Zeeshan Ali
 Ashish Mani
 Ruchi Badola
 Syed Ainul Hussain
94% of researchers rate our articles as excellent or good
Learn more about the work of our research integrity team to safeguard the quality of each article we publish.
Find out more
ORIGINAL RESEARCH article
Front. Environ. Sci., 07 March 2025
Sec. Land Use Dynamics
Volume 13 - 2025 | https://doi.org/10.3389/fenvs.2025.1550450
Land-use/land-cover change is an essential factor for understanding the ecological degradation of forests under threat from different climatic and human-mediated activities. This study investigates the biodiversity and ecological significance of Kaziranga Tiger Reserve, situated in the Brahmaputra floodplain of Assam, India, known for its rich flora and fauna. Despite its ecological importance and rich biodiversity, the reserve faces increasing threats from habitat fragmentation, human-wildlife conflict, poaching, and the impacts of climate change, necessitating a thorough examination of its ecological dynamics. This study assesses land-use land-cover changes from 1913 to 2023, by analyzing the impacts on biodiversity, and assessing the relationship between climate trends and habitat loss. The methods involving geometric and radiometric corrections of historical maps and satellite images, identified key LULC classes such as agriculture, forest, waterbodies, settlements and grasslands. Climate trends were analyzed using statistical methods, including the Theil-Sen estimator and Mann-Kendall test, to determine significant changes. The analysis indicated a 15% increase in agricultural land and a 10% decline in forest cover, primarily due to encroachment and habitat conversion for farming. Furthermore, the correlation study revealed that climatic variability, such as rainfall and soil moisture, significantly influenced habitat conversion, driving agricultural expansion while restricting grasslands. The study emphasizes the critical importance of management approaches that link ecological monitoring with climate resilience efforts, reaching the need for collaborative conservation initiatives to safeguard reserve’s unique biodiversity and maintain its ecological functions.
Ecosystems have been rapidly transformed worldwide in the post-2000 period by human populations through increasingly permanent uses of land (Ellis et al., 2010). On account of their biodiversity maintenance and livelihood provisioning services, forests are important in addition to reducing emissions from deforestation and forest degradation benefits (Mertz et al., 2012).
In Brahmaputra floodplain of Assam, Kaziranga Tiger Reserve (hereafter KTR) faces mounting environmental challenges that threaten its ecological integrity. The location of KTR increases its susceptibility to both natural and human-induced disturbances. Habitat fragmentation, human-wildlife conflict, and climate change, all exacerbated by the dynamic and unpredictable flooding patterns of the Brahmaputra River, pose significant challenges (Deka et al., 2013). These challenges highlight the need for comprehensive conservation strategies that are informed by an overall understanding of the land use and land cover (LULC) dynamics of the region. LULC changes have emerged as a critical factor influencing the ecological health of Kaziranga and other protected areas in the Brahmaputra floodplain. Alterations in land cover, whether through deforestation, agricultural expansion, or infrastructure development, can lead to significant biodiversity loss, disruption of hydrological cycles, and degradation of ecosystem services (Roy and Tomar, 2000). Given the ecological sensitivity of Kaziranga, monitoring LULC changes is essential for devising effective conservation and management plans.
However, KTR is gradually threatened by environmental challenges, many of which are exacerbated by its location within the Brahmaputra floodplain. The dynamic flooding of the river patterns, while essential for replenishing the soil and maintaining productivity, also contributes to habitat fragmentation, human-wildlife conflict, and vulnerability to climate change (Deka et al., 2013). These challenges, including anthropogenic pressures such as agricultural expansion and infrastructure development, prioritize the need for comprehensive conservation strategies that address LULC dynamics. The LULC change is a dynamic and continuing process (Mondal et al., 2016) and changes in different land uses are vital for overall environmental monitoring. LULC changes are critical drivers of ecological health in KTR, influencing biodiversity, hydrological cycles, and ecosystem services. Alterations in land cover, whether through deforestation or land conversion, can lead to significant habitat degradation, biodiversity loss, and disruption of ecological functions (Roy and Tomar, 2000). Monitoring these changes is thus crucial for the effective management and conservation of the ecosystems of KTR. Despite various studies on the ecological dynamics of Kaziranga, there remains a significant gap in understanding the integrated impacts of land-use changes and climatic variables on its biodiversity and ecosystem services. Existing research has largely focused on either LULC changes or climate trends independently, without a comprehensive analysis of their interconnected effects on the ecological health of KTR.
An essential variable in understanding land cover changes is soil moisture, which plays a key role in water balance, plant growth, and ecological stability (Koster et al., 2004; James and Roulet, 2009). Soil moisture is influenced by a range of climatic factors, including air temperature and precipitation, both of which are affected by global climate change (O’Gorman, 2015). Rising temperatures and precipitation anomalies have altered soil moisture patterns worldwide, with significant implications for water resource management and ecosystem sustainability (Holsten et al., 2009; Gaur and Mohanty, 2013). While some studies report that precipitation affects soil moisture with land cover (Montzka et al., 2011; He et al., 2012), others show high temperatures can cause soil moisture deficits through evapotranspiration, though this relationship is non-linear (Mahmood and Hubbard, 2005; Wang et al., 2008). Seasonal, inter-annual, and decadal variations in temperature and precipitation influence soil moisture through infiltration, evapotranspiration, and runoff (Varallyay, 2010; Qian et al., 2011). Local factors such as relative humidity and wind speed also impact soil moisture, highlighting its role in moderating feedback between climate and soil processes. Therefore, understanding the interactions between LULC changes and climatic variables such as temperature, humidity, and rainfall is vital for predicting future environmental impacts on the reserve. This study addresses this gap by combining detailed LULC analysis with long-term climatic data, providing a more detailed understanding of how these factors interact to influence the ecological stability of KTR. By integrating high-resolution satellite imagery with advanced geospatial techniques, this research offers a more precise and comprehensive assessment of habitat transformation and its drivers.
Globally, the average surface temperature has increased about 0.85°C from 1880 to 2012, leading to significant changes in the hydrologic cycle (Stocker et al., 2014). These changes have particularly affected water resources in arid regions, emphasizing the need to study temperature and precipitation trends as key factors in climate change assessment (Parry, 2007).
This study provides a comprehensive assessment of LULC changes in KTR, employing advanced geospatial techniques to analyze high-resolution satellite imagery. By mapping and quantifying land cover changes over recent decades, the study aims to elucidate the spatial and temporal patterns of habitat transformation in the reserve. Additionally, this research explores the relationship between LULC changes and key climatic variables, such as mean and maximum temperature, humidity, and rainfall, which are crucial drivers of ecological processes in Kaziranga (Goswami et al., 2024). Understanding these interactions is crucial for predicting the impacts of future climate scenarios on the biodiversity of the KTR and for formulating adaptive management strategies. By bridging the existing gap in the literature, this study not only advances the understanding of the complex relationships between land cover changes and climate variables but also provides a foundation for future research on adaptive management strategies. The outcomes of this research are expected to provide valuable insights for the management of KTR. By integrating LULC analysis with climatic data, this study presents a holistic view of the environmental challenges faced by KTR, offering evidence-based recommendations for its preservation. The findings are particularly relevant for policymakers, conservationists, and researchers dedicated to safeguarding the biodiversity and ecological resilience of protected areas within the Brahmaputra floodplain and beyond.
The North-East region of India was brought under British rule relatively late in 1826. Transport, commerce, and trade were less developed in this region than elsewhere in India (Saikia, 2004). Although deforestation and forest degradation occurred more slowly in the face of limited accessibility, the government control of expanding tea plantations established on cleared forest lands and the encroachment of immigrant peasants from present-day Bangladesh onto forest lands were much more ineffective (Tucker R. P., 1988). Many Marwari and Bengali contractors immigrated to the commercialization of the upper Assam forests in the 1920s due to the opening of numerous timber mills (Tucker R. P., 1988).
The Brahmaputra floodplain of Assam, is a dynamic and ecologically significant landscape that is shaping the biodiversity and ecosystem functions of the KTR. It is a UNESCO World Heritage Site, spanning over 985.28 sq. km, and is renowned for its extraordinary species diversity, including the iconic Indian rhinoceros (Rhinoceros unicornis) and Bengal tiger (Panthera tigris tigris). The ecological productivity of KTR comprises a variety of habitats, from tropical moist deciduous forests to vast alluvial grasslands, along with wetland ecosystems (Talukdar et al., 2012). It lies between latitudes 26°31’26.88” N to 26°46’53.52” N and longitudes 92°52’26.76” E to 93°42’1.03” E (Figure 1). It was declared a National Park in 1974 and currently harbors the most extensive global population of Rhinoceros. The Reserve has a mean altitude of about 65 m and has a flat terrain with a gentle slope from east to west. It has rich alluvial deposits due to floods, and about three-quarters or more of the Park is submerged annually by the flood waters of the Brahmaputra. It has numerous water bodies (“beels”), which have often been formed due to the changing courses of the tributaries of the Brahmaputra. One such tributary, the Mora Diphlu, makes up most of the southern boundary of the Park (Vattakkavan et al., 2002).
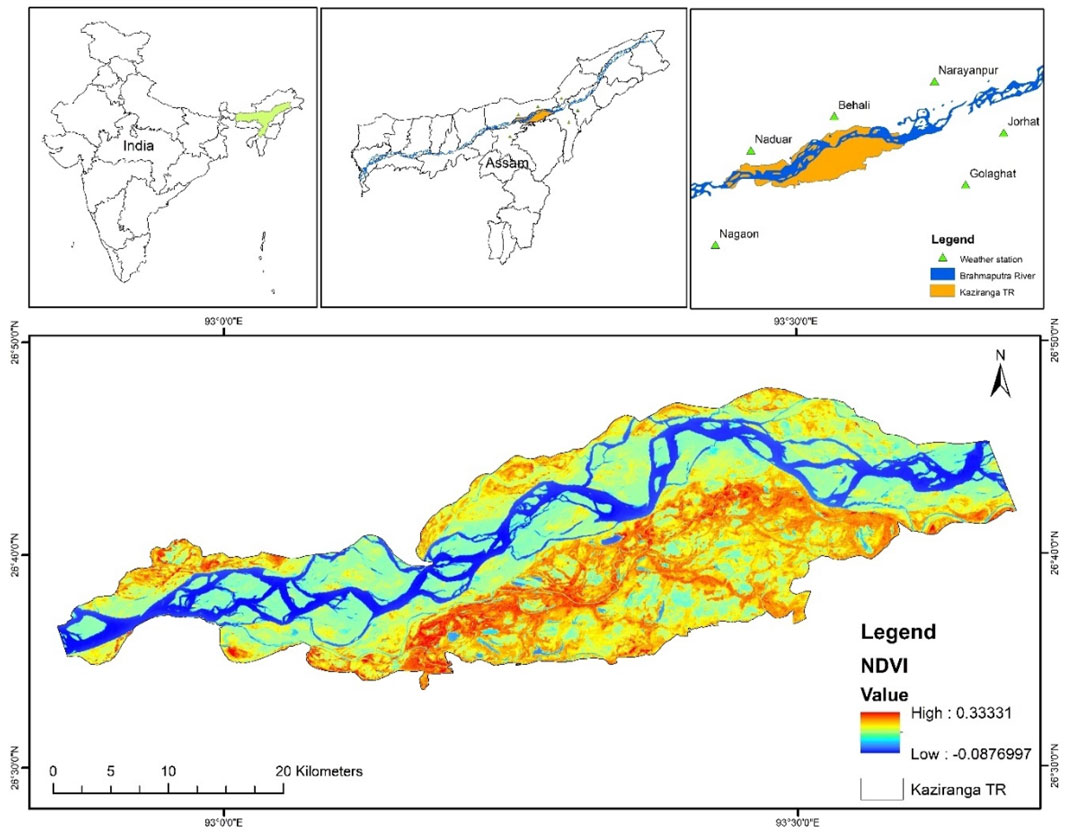
Figure 1. Location of the study area.
KTR is characterized by a humid subtropical climate and is known for recognizing six distinct seasons: summer, rainy, autumn, pre-winter, winter, and spring. The vegetation in this area primarily consists of tropical evergreen and mixed deciduous forests (Basumatary et al., 2021).
Topographical sheets from 1913 to 1960 and satellite images from 2013, 2018, and 2023 were used to analyze Land Use Land Cover (LULC) in KTR. Topographical sheets were geometrically corrected and registered, followed by on-screen classification for LULC at a 1: 50,000 scale (Puig et al., 2002). Satellite images underwent radiometric and geometric corrections, with LULC derived using digital classification methods by Yang et al. (2015). Five LULC classes- agriculture, forest, waterbodies, settlement, and grasslands-were identified.
The USGS sourced Landsat ETM + imagery from 2013 (30 m resolution); the NRSC derived 2018 LULC from AWiFS imagery (56 m resolution), and Sentinel 2 imagery (10 m resolution) for 2023 was provided by ESRI. The combined data provided insights into LULC changes over time. The ground-truthing of the study area was conducted in 2022 by a team of researchers using Garmin eTrex 10x GPS (Global Positioning System).
Climate data for Kaziranga was obtained from MERRA-2 dataset of NASA (National Aeronautics and Space Administration Langley Research Center, 2024), covering parameters such as maximum temperature (in °C), minimum temperature (in °C), rainfall (in mm), relative humidity (in %), and soil moisture (0–1) from 1981 to 2022. Annual averages for temperature, humidity, and soil moisture were computed, while total annual rainfall was the sum of monthly data. Further, the data was processed using Microsoft Excel to understand long-term climate patterns. The analysis of climate trends involved using the Theil-Sen estimator to determine the slopes and the Mann-Kendall test was performed to assess trend significance. The Trend-Free Pre-Whitening (TFPW) procedure, as outlined by Yue et al. (2002), was applied to correct for serial correlation, and fractional differencing was used to explore the persistence of climatic trends. In addition, the formulae for user accuracy, producer accuracy, overall accuracy (OA), and kappa coefficient (k) are mentioned in Equations 1–4 (Mani et al., 2024).
Further, Pearson correlation coefficients were computed between the area percentage of each LULC class and climate variables. To find correlations between climatic factors and LULC classes, the analysis was carried out independently for each class. The analysis was performed in R (version 4.4.2) using key libraries such as dplyr for data preprocessing, ggplot2 for visualization, and reshape2 for reshaping data when required. Moreover, Arc GIS and Microsoft Excel were also used for data analysis. We aimed to compare land-use changes over a 100-year period, selecting years (1913, 1960, 2013, 2018, and 2023) based on data availability. These years represent the oldest to the most recent datasets accessible, allowing us to analyze long-term trends and key shifts in land use (Figure 2). The limitations of the study include the partial unavailability of toposheet data from 1913. Additionally, the correlation analysis between LULC classes and climate data was restricted to the years 2013, 2018, and 2023. The absence of climate data for 1913 and 1960 prevented the inclusion of these years in the correlation analysis. The data coverage on community insights were also limited for the study area, hence the community information regarding climate and LULC changes were not included in this study.
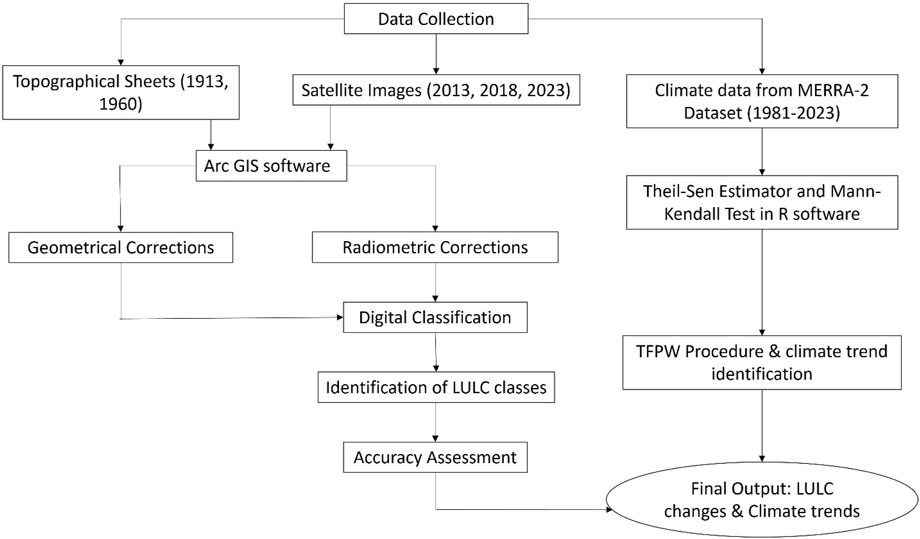
Figure 2. Flowchart of methodology.
LULC statistics from 1913 to 2023 in Kaziranga, Assam, show considerable changes throughout the five mentioned years. In 1913, grassland was the main land cover, accounting for 637.04 km2 (69.82% of the total area). The waterbodies covered 271.25 km2 (29.73%). At the time, there was little agriculture or forest/woodland, and just a few settlements (3.43 km2, 0.38%).
In 1960, there was a significant shift in LULC, with the waterbodies increasing to 454.10 km2 (46.09%) and grassland decreasing to 360.08 km2 (36.55%). During this time, agriculture expanded to 58.13 km2 (5.90%), while forest/woodland increased to 106.22 km2 (10.78%). Settlement grew significantly to 6.76 km2 (0.69%).
In 2013, the waterbodies increased to 588.78 km2 (59.76%), whereas grassland decreased to 262.42 km2 (26.63%). Forest/woodland expanded to 129.38 km2 (13.13%), while agriculture decreased to 4.12 km2 (0.42%). The settlement area declined significantly to 0.58 km2 (0.06%).
In 2018, the waterbodies decreased to 474.25 km2 (48.13%), while grassland recovered to 370.61 km2 (37.61%). Forest/woodland expanded to 134.44 km2 (13.65%). Agriculture and settlement had slight growth, spanning 4.99 km2 (0.51%) and 0.98 km2 (0.10%), respectively.
In 2023, the data forecasts a further decrease of the waterbodies to 411.02 km2 (41.72%) and a further loss in grassland to 318.71 km2 (32.35%). Forest/woodland have extended to 229.22 km2 (23.26%), indicating a considerable increase in vegetative cover in the recent decade. Agriculture rose to 24.97 km2 (2.53%), while settlements increased little to 1.36 km2 (0.14%). (Figure 3, Table 1).
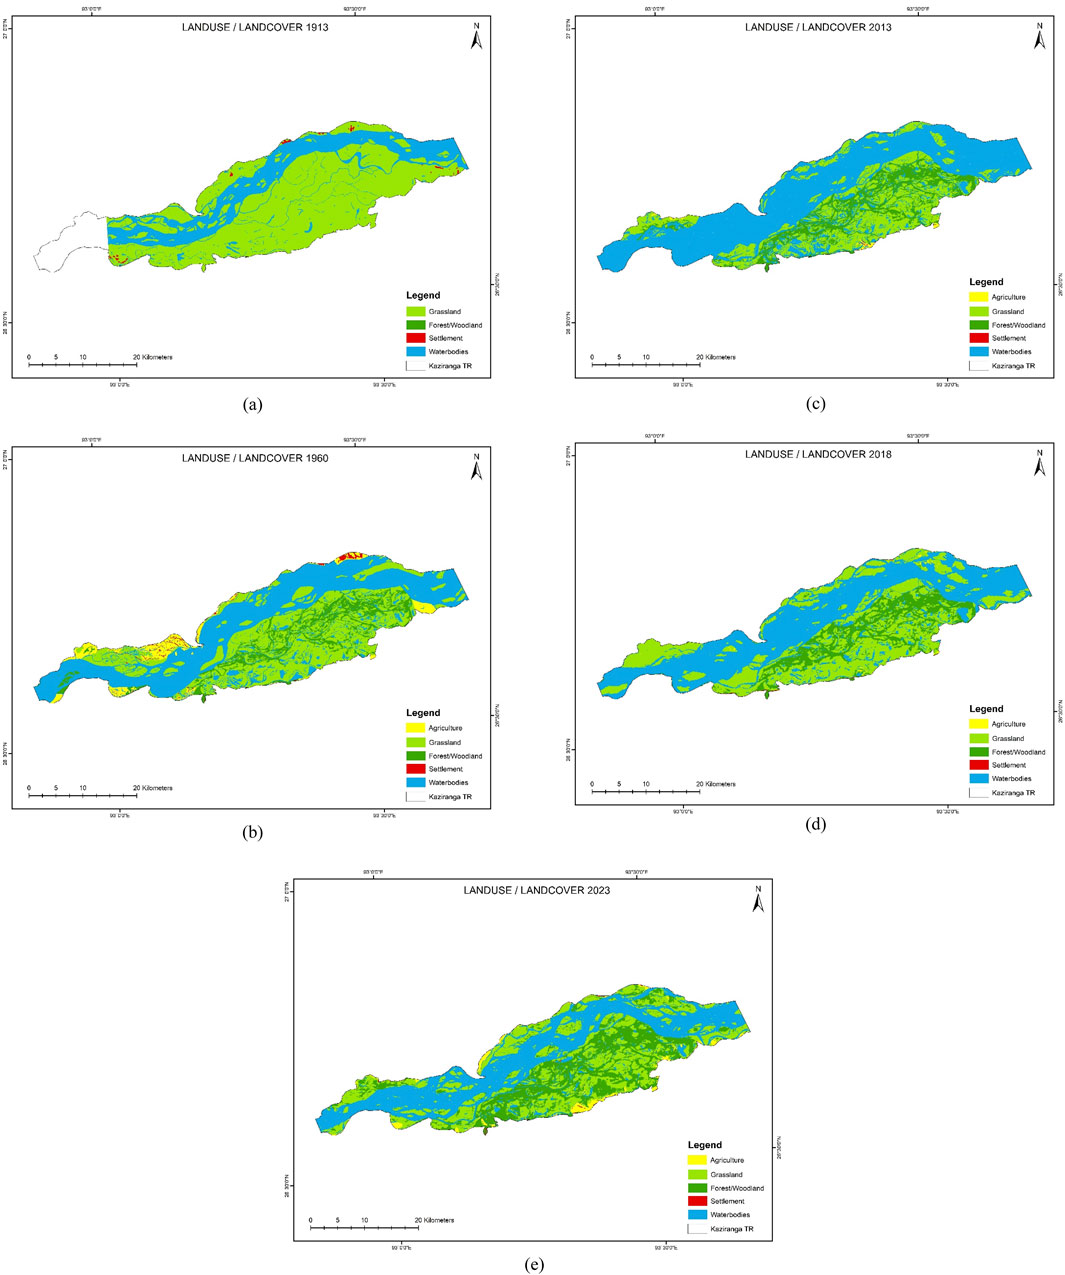
Figure 3. The figure shows the land use and land cover of Kaziranga in different years: (A) 1913, (B) 1960, (C) 2013, (D) 2018, and (E) 2023.
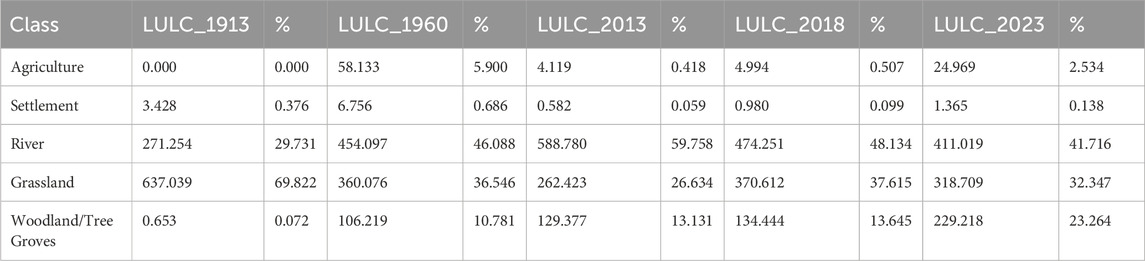
Table 1. Land Use and Land Cover (LULC) patterns for the years 1913, 1960, 2013, 2018, and 2023, with values expressed in both absolute terms (sq. km.) and relative percentages (%).
The LULC for 2023 has an overall accuracy (OA) of 0.91 and a kappa coefficient (κ) of 87% (Table 2). According to the kappa coefficient evaluation standards, the 87% κ value is significant (Islami et al., 2022). Overall, the statistics show a dynamic environment in Kaziranga, with considerable declines in grassland and waterbodies regions throughout time, but expansions in forest/woodland, agriculture, and settlement. The increase of forest/woodland and the shrinking of waterbodies and grassland regions might have a significant impact on the region’s biodiversity and ecosystem services.
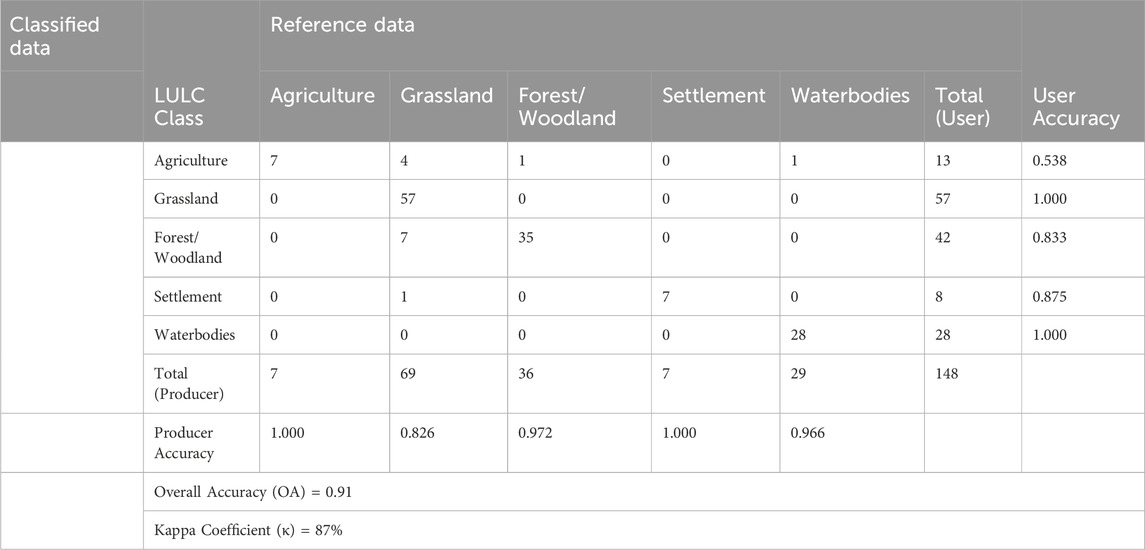
Table 2. Table of Accuracy Assessment for the year 2023.
The examination of changes in LULC from 1913 to 2023 demonstrates substantial patterns across many classes, with major dynamics in agriculture, settlement, waterbodies, grassland, and forest/woodland. Due to the limitations of topo sheets, no agricultural information was captured in 1913, hence percentage changes could not be estimated. However, the overall area growth is enormous, with 58.13 km2 of land converted to agricultural use by 1960, with an additional extension reaching 24.97 km2 by 2023.
Between 1913 and 1960, settlement increased by 3.33 km2 (97.05%) but then decreased by 2.85 km2 (−83.03%) by 2013. The trend continues, with a minor rebound in the following years, but the total shift is unfavorable. Waterbodies increased by 182.84 km2 (67.41%) from 1913 to 1960 and 317.53 km2 (117.06%) by 2013. Between 2013 and 2023, the waterbodies decreased by 139.77 km2 (51.53%), suggesting a probable alteration in river dynamics or land use practices. Grassland has consistently declined, losing 276.96 km2 (−43.48%) by 1960 and 374.62 km2 (−58.81%) by 2013. Despite a minor recovery in 2018, the trend continues primarily negative, with a total decline of 318.33 km2 (−49.97%) by 2023. Forest/woodland observed the greatest growth, beginning with a small area of 0.65 km2 in 1913. By 1960, the area had grown by 105.57 km2, an astounding rise of 16163.94%. By 2023, the area reached 229.22 km2, representing a 34997.34% increase (Figure 4, Table 3).
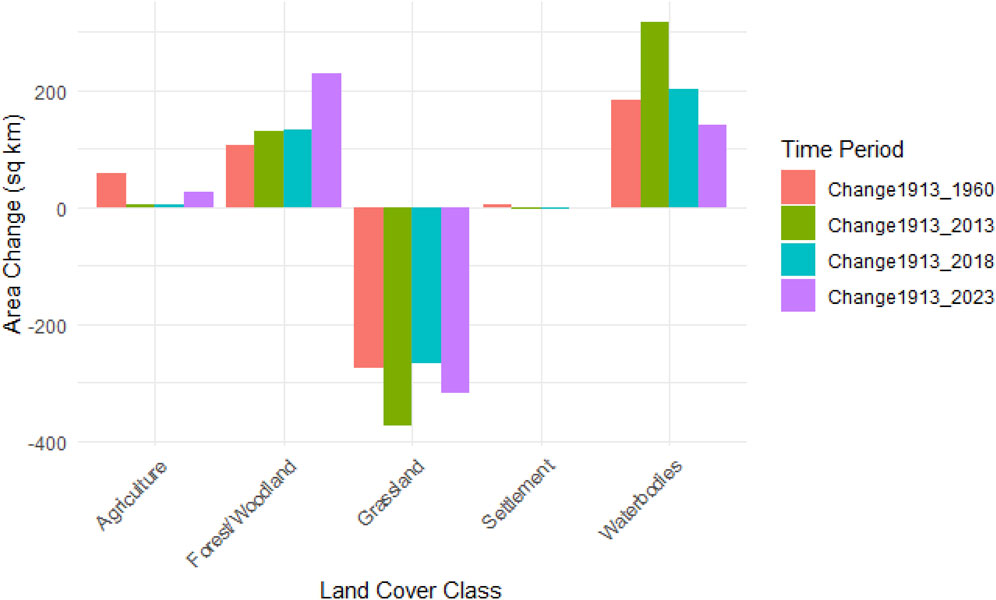
Figure 4. The figure shows the shift in land use and land cover in Kaziranga from 1913 to 1960, 2013, 2018, and 2023.
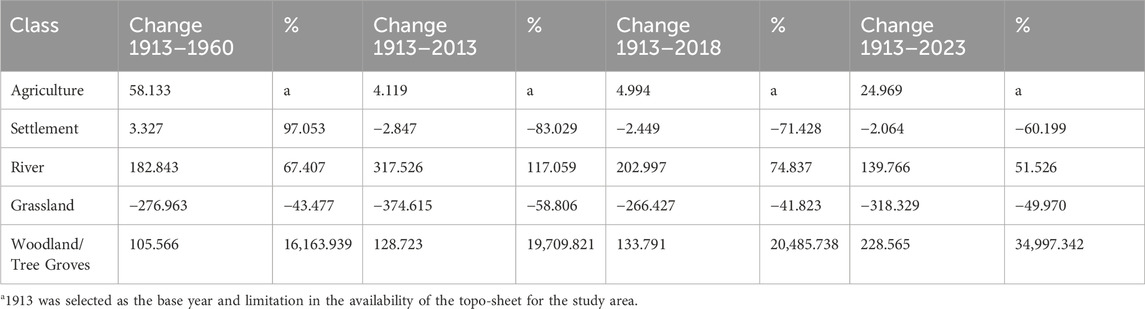
Table 3. Land use and land cover area changes in 1913, 1960, 2013, 2018, and 2023 of Kaziranga, with values expressed in both absolute terms (sq. km.) and relative percentages (%).
These LULC variations highlight the dynamic character of land use in the region, which is influenced by a variety of variables such as agricultural development, urbanization, river dynamics, and vegetation changes. The dramatic rise in forest/woodland indicates effective natural regeneration, but the loss in grassland areas may reflect changes in land management or environmental circumstances.
Maximum temperature trends exhibit different patterns among six meterological sites. Behali has a strong negative trend, with a slope of −0.040 (p = 0.0151) and a R2 of 0.139, showing 13.9% variability explained (Table 4). The Durbin-Watson score of 1.657 indicates moderate positive autocorrelation and regularly distributed residuals (p = 0.248). Golaghat has a nearly-significant slope of −0.035 (p = 0.0515), R2 of 0.092, Durbin-Watson statistic of 1.452, and borderline normality (p = 0.065). Jorhat has a non-significant slope of −0.019 (p = 0.3038), R2 of 0.026, Durbin-Watson of 1.508, and normal residuals (p = 0.238). Nadur and Nagaon exhibit significant negative slopes of −0.048 (p = 0.0048) and −0.052 (p = 0.0044), respectively, with R2 values of 0.182 and 0.186. Their Durbin-Watson statistics are 1.775 and 1.903, showing little autocorrelation, and the residuals are normally distributed (p = 0.839 and 0.922). Narayanpur has a significant negative slope of −0.040 (p = 0.0350) and R2 of 0.106. The Durbin-Watson score of 1.647 suggests a positive autocorrelation with normally distributed residuals (p = 0.921). Behali, Nadur, Nagaon, and Narayanpur have substantial declining tendencies, although Golaghat and Jorhat do not. Autocorrelation and residual normalcy vary per station.
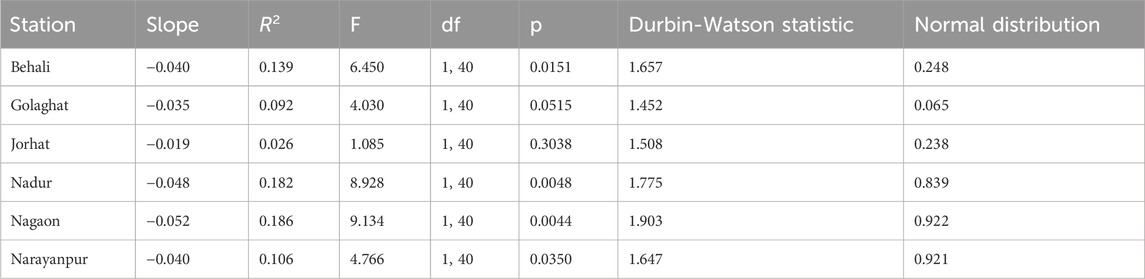
Table 4. Maximum temperature analysis from 1980 to 2022.
The examination of the lowest temperature trends from six meteorological stations showed considerable increases. Behali has a positive slope of 0.039 (p = 0.0039) and a R2 of 0.190, explaining 19.0% of the variability (Table 5). It exhibits significant positive autocorrelation (Durbin-Watson = 1.764) and a little departure from normality (p = 0.044). Golaghat has a greater slope (0.046, p = 0.0018) and slightly higher R2 (0.218), explaining 21.8% of the variability. The Durbin-Watson value (1.458) indicates significant positive autocorrelation, although the residuals are roughly normally distributed (p = 0.171). Jorhat has a slope of 0.047 (p = 0.0015) and a R2 of 0.225, explaining 22.5% of the variability. The Durbin-Watson value (1.696) indicates significant positive autocorrelation, with residuals close to the normal distribution (p = 0.134). Nadur shows the strongest trend, with a slope of 0.060 (p < 0.0001) and the greatest R2 of 0.390, accounting for 39.0% of the variability. The autocorrelation is mild (Durbin-Watson = 1.612), and the residuals are normally distributed (p = 0.233). Nagaon has a slope of 0.048 (p = 0.0004) and a R2 of 0.269, indicating that 26.9% of the variability is explained. The Durbin-Watson value (1.565) indicates moderate positive autocorrelation, with normally distributed residuals (p = 0.642). Narayanpur has a slope of 0.047 (p = 0.0003) and a R2 of 0.279, explaining 27.9% of the variability. The Durbin-Watson value (1.362) indicates positive autocorrelation, while the residuals are normally distributed (p = 0.724).
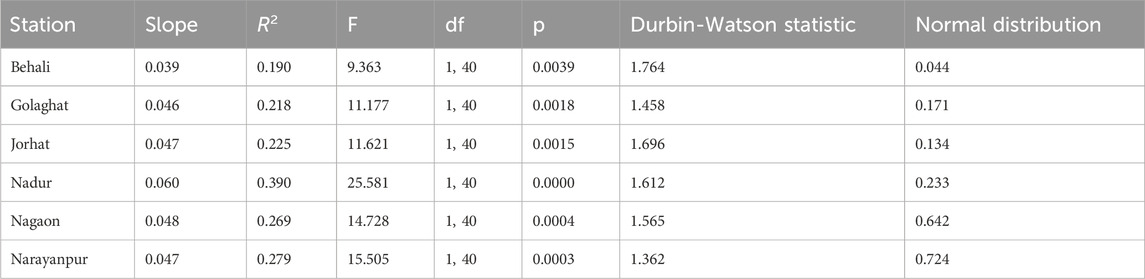
Table 5. Minimum temperature analysis from 1980 to 2022.
Relative humidity patterns demonstrate significant beneficial increases. Behali has a significant positive slope of 0.216 (p < 1.280E-07), R2 of 0.506, considerable positive autocorrelation (Durbin-Watson = 1.041), and normally distributed residuals (p = 0.256). Golaghat has a slope of 0.192 (p = 4.297E-07) and an R2 of 0.476, showing strong positive autocorrelation (Durbin-Watson = 1.011) and normally distributed residuals (p = 0.491). Jorhat has a slope of 0.181 (p = 6.136E-06), R2 of 0.404, significant positive autocorrelation (Durbin-Watson = 0.701), and normal residuals (p = 0.540). Nadur has a slope of 0.197 (p = 1.956E-07), an R2 of 0.496, showing strong positive autocorrelation (Durbin-Watson = 1.222), and normal residuals (p = 0.611). Nagaon likewise has a slope of 0.197 (p = 2.839E-07), an R2 of 0.487, mild autocorrelation (Durbin-Watson = 1.279), and normally distributed residuals (p = 0.482). Narayanpur has a slope of 0.196 (p = 5.012E-07), an R2 of 0.472, strong positive autocorrelation (Durbin-Watson = 0.987), and normal residuals (p = 0.351) (Table 6). All stations indicate substantial upward trends in relative humidity, with Behali and Nadur having the most explanatory power. Autocorrelation varies per station, although residuals are primarily normally distributed.
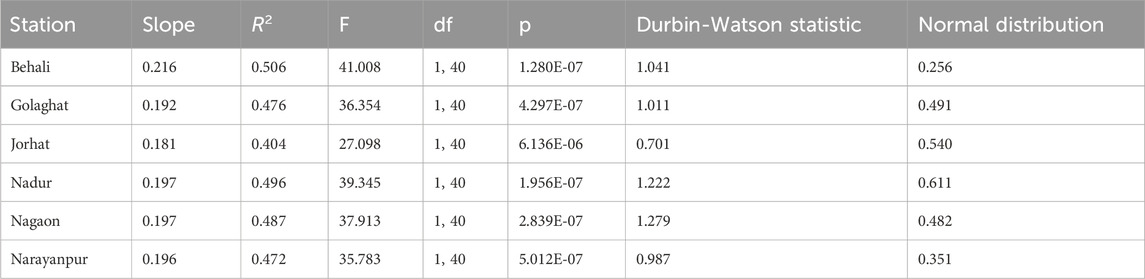
Table 6. Relative humidity analysis from 1980 to 2022.
Rainfall patterns reveal varied favorable shifts. Behali has a slope of 9.704 (p = 0.0068) and an R2 of 0.169, which shows that 16.9% of the variability is explained. The Durbin-Watson value of 2.147 indicates no substantial autocorrelation and regularly distributed residuals (p = 0.158). Golaghat has a steeper slope of 10.483 (p = 0.0015), an R2 of 0.225, considerable positive autocorrelation (Durbin-Watson = 1.897), and normally distributed residuals (p = 0.337). Jorhat has a slope of 12.424 (p = 0.0028), an R2 of 0.203, showing strong positive autocorrelation (Durbin-Watson = 1.275), and normal residuals (p = 0.185). Nadur has a slope of 7.510 (p = 0.0127), a lower R2 of 0.145, no significant autocorrelation (Durbin-Watson = 2.113), and residuals that are normally distributed (p = 0.196). Nagaon has a lower slope of 4.971 (p = 0.1047), an R2 of 0.064, no significant autocorrelation (Durbin-Watson = 2.162), and normally distributed residuals (p = 0.876). Narayanpur has the greatest slope (14.669, p = 0.0003) and R2 (0.278), with no significant autocorrelation (Durbin-Watson = 2.067) and a little divergence from normality (p = 0.055) (Table 7). Narayanpur observed the greatest rise in rainfall, followed by Jorhat and Golaghat. Most stations have normal residuals with little or no autocorrelation.
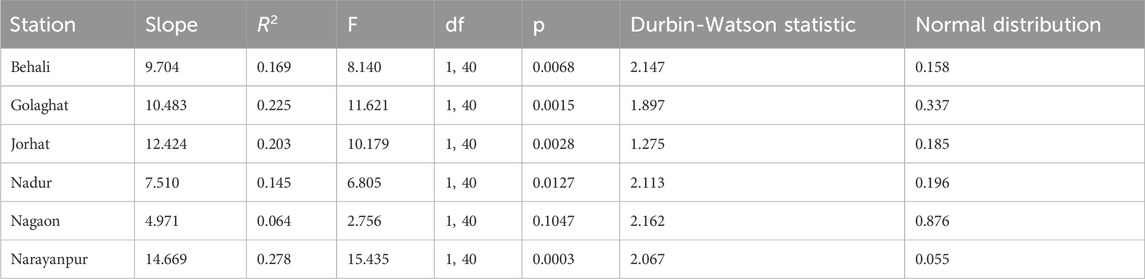
Table 7. Rainfall analysis from 1980 to 2022.
Behali has a slope of 0.002 (p = 0.0001) and a R2 of 0.312, showing low autocorrelation (Durbin-Watson = 1.755) and normal residuals (p = 0.386). Golaghat has a slope of 0.002 (p = 0.0003), R2 of 0.280, positive autocorrelation (Durbin-Watson = 1.226), and normal residuals (p = 0.751). Jorhat and Nadur had slopes of 0.002 (p = 0.0019 and p = 0.0018), R2 values of 0.216 and 0.218, with varied degrees of autocorrelation and normal residuals. Nagaon has a lower slope of 0.001 (p = 0.0238) and a R2 of 0.121, with negligible autocorrelation (Durbin-Watson = 1.794) and normal residuals (p = 0.545). Narayanpur has the greatest trend, with a slope of 0.002 (p < 0.0001) and the highest R2 of 0.357, with positive autocorrelation (Durbin-Watson = 1.403) and normal residuals (p = 0.353) (Table 8).
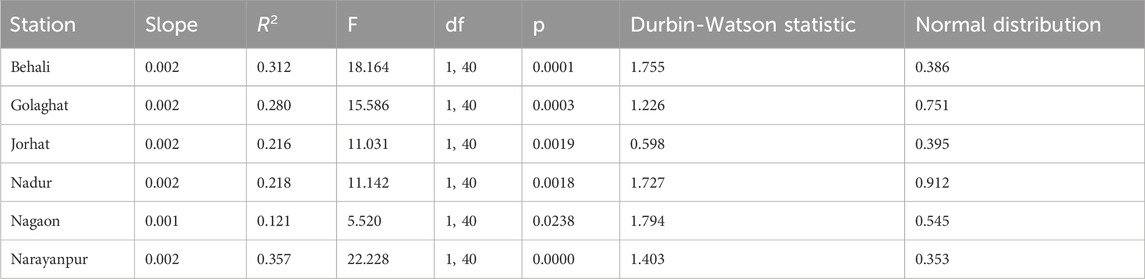
Table 8. Soil moisture analysis from 1980 to 2022.
The climatic variables across the dataset indicate the inside surplus of patterns, with relative humidity exhibiting the most significant shift. Relative humidity has a positive slope of 0.197 (p < 7.33E-34), with an R2 of 0.445, suggesting that the temporal trend explains 44.5% of its variability. The Durbin-Watson value 1.098 indicates minor positive autocorrelation, with roughly customarily distributed residuals (p = 0.070).
The highest temperature has a negative slope of −0.039 (p = 5.65E-05) and a significantly lower R2 of 0.063, explaining just 6.3% of the variability. The Durbin-Watson value of 0.910 indicates moderate positive autocorrelation, whereas the normality test result (p = 0.087) indicates a slight divergence from normality in the residuals.
The minimum temperature expresses a positive trend with a slope of 0.048 (p < 1.06E-13) and a R2 of 0.199, explaining 19.9% of its variability using the model. The Durbin-Watson score of 1.239 suggests negligible autocorrelation, and the residuals follow a normal distribution (p = 0.417).
Soil moisture has a positive slope of 0.002 (p < 2.33E-12) and a R2 of 0.179, which explains 17.9% of the variability. The Durbin-Watson value of 0.975 indicates positive autocorrelation, and the residuals are roughly normally distributed (p = 0.496).
Rainfall shows an increasing trend with a slope of 9.960 (p < 1.42E-08) and R2 of 0.121, explaining 12.1% of the variability. The Durbin-Watson score of 1.241 indicates negligible autocorrelation. However, the residuals are marginally out of normality (p = 0.005) (Table 9).

Table 9. Mean analysis of Relative humidity, Maximum temperature, Minimum temperature, Soil moisture, and Rainfall from 1980 to 2022.
The relative humidity and lowest temperature show strong tendencies with relatively high explanatory power, whereas maximum temperature and rainfall show weaker patterns. The degree of autocorrelation and normalcy varies among variables, with the majority exhibiting slight deviations from normality.
The temporal trends in temperature, rainfall, humidity, and soil moisture from 1980 to 2022 show a variety of patterns of climate change. While the mean temperature remained rather steady, with no significant trend (p = 0.6264), both the maximum and lowest temperatures showed significant changes in opposing directions. The maximum temperature decreased substantially (p = 0.01), dropping from roughly 37.5°C–36°C, while the lowest temperature climbed greatly (p = 0.00030), increasing from approximately 6°C–8°C. These patterns indicate a tendency for colder days and warmer nights across the observation period. Furthermore, relative humidity showed a substantial increase trend (p = 0), rising from around 70%–77.5%, adding to the observed climatic changes. In contrast, rainfall increased significantly (p = 0.0033), rising from around 1,500 mm in the 1980s to more than 2,000 mm by 2022, with narrow confidence intervals showing a steady trend. Similarly, soil moisture levels rose considerably (p = 5e-04), from around 0.66 to 0.72, despite slightly wider confidence ranges (Figure 5). These data reveal major alterations in climatic conditions, including rising humidity, more rainfall, higher soil moisture, and differential patterns in daily temperature extremes.
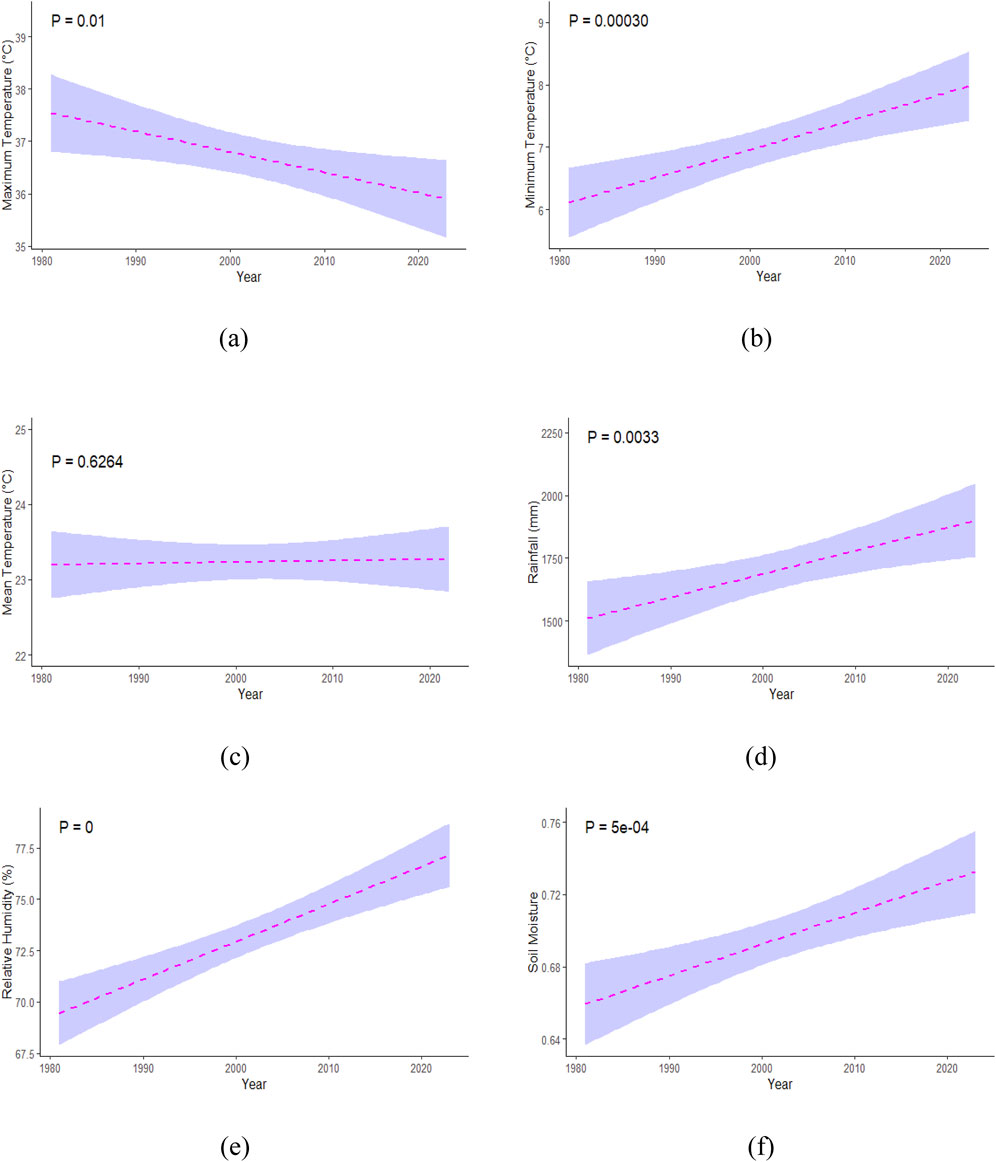
Figure 5. Trends in Climate Variables from 1980 to 2022: (A) maximum temperature has a statistically significant decreasing trend, showing a general reduction, (B) minimum temperature shows a statistically significant rising trend, indicating an increase, (C) mean temperature stays steady, with no significant trend, (D) rainfall has greatly risen, indicating an increasing tendency, (E) relative humidity also has a substantial rising trend, indicating an increase, (F) soil moisture has increased considerably, with an increasing trend shown over time.
The analysis revealed significant trends between climatic factors and LULC classes. Agriculture showed weak to moderate positive correlations with maximum temperature: 0.068 (R2 0.005), and minimum temperature: 0.486 (R2 0.236) and a robust positive correlation with rainfall (0.994, R2 0.988), while soil moisture (−1, R2 0.999) strongly restricted its expansion. Forests/woodlands showed a moderate positive correlation with minimum temperature (0.588, R2 0.346), rainfall (0.974, R2 0.948), and humidity (0.380, R2 0.145), but a strong negative correlation with soil moisture (−0.989, R2 0.978). Grasslands were weakly related to maximum temperature (0.007, R2 0) but contracted with higher minimum temperature (−0.550, R2 0.302), rainfall (−0.983, R2 0.967), and humidity (−0.337, R2 0.113), while soil moisture (0.995, R2 0.99) strongly supported their expansion. Settlements expanded with higher minimum temperature (0.871, R2 0.758), rainfall (0.791, R2 0.626), and humidity (0.730, R2 0.533) but contracted with increased soil moisture (−0.839, R2 0.703). Waterbodies showed strong negative correlations with minimum temperature (−0.588, R2 0.346), rainfall (−0.974, R2 0.948), and humidity (−0.380, R2 0.145), but expanded significantly with higher soil moisture (0.989, R2 0.978) (Table 10).
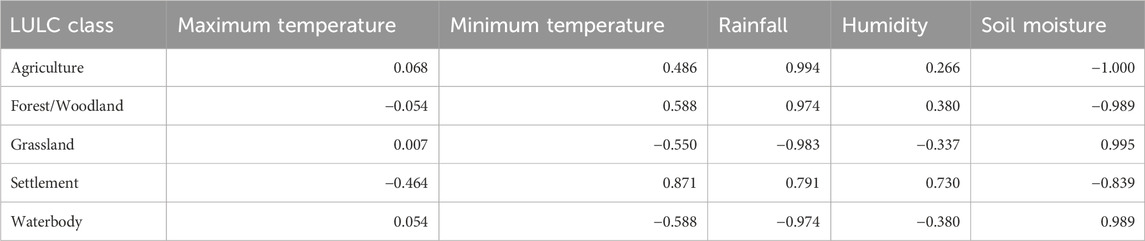
Table 10. Correlation between different LULC classes and climate variables.
The observed temporal trends in climate variables from 1980 to 2022 provide essential insights into the shifting patterns of regional climate, with implications for both ecological and human systems. The stability in mean temperature observed in this study aligns with some global trends where overall warming may not be uniformly distributed across regions or seasons (IPCC, 2021). However, the divergent trends in maximum and minimum temperatures-cooling during the day and warming at night-are consistent with other studies that have reported similar patterns, particularly in regions experiencing increased cloud cover or changes in land use (Vose et al., 2005; Makowski et al., 2009). This phenomenon may indicate the increasing urban heat island effect, where nighttime temperatures rise due to retained heat, while daytime temperatures can be moderated by cloud cover and vegetation changes (Zhou et al., 2014).
The significant rise in relative humidity over the observed period is notable. It can be linked to the increased atmospheric moisture availability, likely driven by the higher minimum temperatures and increased evaporation rates (Held and Soden, 2006). This finding corresponds with the observed upward trend in rainfall, which indicates a regional intensification of the hydrological cycle. The increase in annual rainfall from approximately 1,500 mm to over 2,000 mm aligns with projections of enhanced precipitation in some areas due to climate change, particularly in regions where warming leads to more intense and frequent rainfall events (Allan and Soden, 2008).
Basumatary et al. (2021) has shown a substantial area decline under dense forest, open forest, waterlogged wetland, and marsh/swamp, land cover classes between 1988 and 2018 whereas our study further in 2023 has shown increase in forest/woodland area as compared to 1913, developing ecosystem driven by a complex interaction of natural and man-made forces. Contradicting to our study, another study in Sri Lanka, (Samarasinghe et al., 2022), mentioned reduction in the agricultural areas over time in most of the subbasins.
One notable trend is the rise in agricultural land from 1960, which aligns with the Green Revolution and government-led agricultural intensification programs promoting higher productivity in the region (Pingali, 2012).
The concurrent increase in soil moisture levels suggests that the rising Rainfall effectively contributes to more excellent water retention in soils, which could positively affect agricultural productivity and ecosystem health in the short term (Betts et al., 2007). However, the widening confidence intervals in soil moisture trends indicate potential variability, which may reflect changes in land use, soil properties, or extreme weather parameters, such as droughts and floods (Seneviratne et al., 2006). The implications of these changes are significant, as they can affect the balance between water availability and demand, impacting agriculture, water resources management, and natural ecosystems.
These findings demonstrate the complex nature of regional climate change, where different variables may exhibit distinct trends based on local conditions, feedback mechanisms, and human activities. The observed increase in nighttime temperatures, rainfall, and soil moisture, coupled with rising humidity, could signal a shift towards a more humid and wetter climate regime in the region, with potential consequences for biodiversity, agriculture, and human health (Pachauri et al., 2014). Future research should explore the drivers behind these trends, particularly the role of land use changes, deforestation, and urbanization, which could provide a more detailed understanding of the underlying mechanisms and inform adaptive strategies (Lal, 2013).
The variations in LULC in Kaziranga, Assam, between 1913 and 2023 demonstrate a dynamic and developing ecosystem driven by a complex interaction of natural and manmade forces. The most noticeable tendency in Kaziranga’s LULC is the variation of waterbodies and grassland regions. From 1913 to 2013, the waterbodies rose rapidly, reaching a peak of 588.78 km2 (59.76%) before decreasing to 411.02 km2 (41.72%) by 2023. This increase and decrease in waterbodies might be due to both natural river dynamics and human-caused changes such as land reclamation or altered water management methods. The huge rise of 67.41% from 1913 to 1960, followed by a stunning 117.06% increase in 2013, indicating major geomorphological changes or land use influences on river systems. The 51.53% drop between 2013 and 2023 highlights potential changes in hydrology or land use that require additional examination (Mitsch and Gosselink, 2015).
Grassland lands have decreased during the century, from 637.04 km2 (69.82%) in 1913 to a predicted 318.71 km2 (32.35%) by 2023. This drop, despite a slight rebound in 2018, suggests a long-term deterioration in one of Kaziranga’s important ecosystems. The loss of 276.96 km2 (−43.48%) by 1960 and a total drop of 318.33 km2 (−49.97%) by 2023 indicate considerable environmental and potentially human stresses on grasslands. Grassland degradation might influence local biodiversity and ecosystem services since grasslands provide vital habitat for many species and play an important role in carbon sequestration (Sala et al., 2000).
The results show tremendous expansion in forest and woodlands. In 1913, the area was 0.65 km2. By 2023, it had grown to 229.22 km2, a 34997.34% growth. This growth might be ascribed to natural regeneration processes, conservation initiatives, or reduced demands on wooded regions as agricultural and settlement activities decline. The significant rise of 16,163.94% from 1913 to 1960, as well as continuous growth, implies excellent natural regeneration and, perhaps, successful conservation efforts. This pattern is consistent with findings from earlier research in which reforestation and afforestation operations dramatically enhance woodland cover over time (FAO, 2010).
The overall agricultural land area decreased from 58.13 km2 (5.90%) in 1960 to 24.97 km2 (2.53%) in 2023. Despite oscillations, this general decline shows that agricultural operations continue, but at a slower rate than in previous times. The initial expansion followed by stability may indicate changes in agricultural techniques, policies, or land availability. Settlement areas decreased from 3.43 km2 (0.38%) in 1913 to 1.36 km2 (0.14%) in 2023, with negligible expansion in urban areas. The decline in settlements between 1960 and 2013, followed by a minor increase, might be attributed to urbanization trends, land policy, or demographic changes.
The observed changes in LULC have serious consequences for biodiversity and ecological services in Kaziranga. The reduction of grasslands and shifting river basins might have a severe influence on animals that rely on these habitats. In contrast, the growth in forest/woodland indicates a favorable trend for forest-dwelling species and overall habitat connectivity. The changes emphasize the importance of integrated land management techniques that balance conservation and development to maintain biodiversity and ecosystem health. Finally, the dynamic integrity of LULC in Kaziranga reflects the region’s substantial environmental changes. The observed patterns represent the difficulties and possibilities for land management, conservation, and ecological balance.
The trends in land use and climate in Kaziranga, Assam, reveal a complex interaction where environmental changes influence and are influenced by climate variables. The expansion and subsequent reduction of waterbodies areas may be linked to regional precipitation changes and altered water management practices (Zhao et al., 2025). The decline in grassland and fluctuations in forest/woodland reflect impacts from both climate and land use practices. The increase in forest/woodland aligns with conservation efforts but highlights challenges like illegal logging (Jeza and Bekele 2024; Roy et al., 2022).
Climate trends support these observations, with rising humidity and rainfall affecting waterbodies dynamics and soil moisture levels. Increasing soil moisture could contribute to a slight recovery in grassland areas (Held and Soden, 2006). Rising nighttime temperatures and increased precipitation emphasize the need for integrated management strategies that address land use and climate (Zhou et al., 2014; Pachauri et al., 2014).
The correlation analysis between climatic factors and LULC classes highlights key patterns that align with findings from other studies. For agriculture, the very strong positive correlation with rainfall is consistent with the research of Babu and Uma, (2023), emphasizing rainfall as a critical driver of agricultural crop productivity and expansion. Similarly, the moderate positive correlation with minimum temperature suggesting that higher night temperatures promote crop growth by reducing frost risks. However, the strong negative correlation with soil moisture indicates potential challenges in waterlogged conditions, a finding aligned with observations in floodplain agriculture (Venkatesh et al., 2011). Forest/woodland areas displayed strong positive correlations with rainfall and moderate correlations with minimum temperature, similar with studies demonstrating the importance of precipitation and stable temperatures in promoting forest growth and regeneration. The strong negative correlation with soil moisture suggests that excessive moisture may deter forest expansion, likely due to waterlogging in certain terrains. Grasslands showed a strong negative correlation with rainfall and moderate negative correlations with minimum temperature and humidity, demonstrates that excessive moisture and warmer conditions often facilitate the conversion of grasslands into other vegetation types. The very strong positive correlation with soil moisture indicates its critical role in sustaining grasslands, particularly in semi-arid regions. Settlements exhibited strong positive correlations with minimum temperature and rainfall highlighting the role of climatic stability and water availability in urban expansion, a trend supported by recent urbanization studies (Srikanth and Swain, 2022). The moderate negative correlation with soil moisture reflects constraints on settlement development in areas prone to waterlogging. Waterbodies, possess very strong positive correlation with soil moisture highlighting the role of hydrological factors in maintaining aquatic systems. The strong negative correlations with rainfall and minimum temperature indicates potential shrinkage of waterbodies under these conditions, likely due to increased evaporation and reduced water retention capacity.
However, the persistent decline in grasslands highlights gaps in conservation policies, particularly in addressing invasive species and balancing tourism with habitat restoration efforts (Raha et al., 2020). Existing policies relevant to the conservation include the Indian Forest Act (1927), Wildlife Protection Act (1972), National Forest Policy (1988), Environment Protection Act (1986). Additionally, schemes like Compensatory Afforestation Fund Management and Planning Authority (CAMPA) contribute to addressing ecological and land-use challenges in the region. These conservation policies are important for protection of KTR. The Wildlife Protection Act (1972) has been influential in designating Kaziranga as a protected area, enforcing anti-poaching measures, and ensuring legal protection for its diverse flora and fauna. The Indian Forest Act (1927) has contributed to regulating forest use and preventing encroachments. The Environment Protection Act (1986) has provided a legal framework for mitigating environmental threats, including pollution and habitat degradation. The National Forest Policy (1988) emphasizes ecological stability and biodiversity conservation, aligning with management goals of KTR. Additionally, CAMPA has facilitated habitat restoration by funding afforestation and ecological restoration projects in degraded areas. Future research should focus on the correlation between land use changes and climate variables to develop effective conservation and adaptation strategies (Lal, 2013; Betts et al., 2007).
Our study highlights the significant shift in LULC in KTR from 1913 to 2023. Agricultural land has expanded by 15%, whereas forest cover has declined by 10%, and grassland areas have also observed a notable reduction. These substantial changes have contributed to habitat degradation, increasing the risks for species that are dependent on the undisturbed ecosystems. Climatic trends specify rising temperatures, increasing rainfall variability, and fluctuations in humidity, all of which have impacted soil moisture and water availability, further inducing LULC patterns in KTR.
The results of the study emphasize the need for comprehensive conservation strategies aimed at mitigating habitat loss, controlling encroachment, and securing vital conservation zones. These measures are crucial for preserving the ecological health of KTR and the biodiversity that sustains essential ecosystem services. Moreover, these findings add valuable insights to sustainable land use, and climate change adaptation. The Brahmaputra floodplain, could be attributed as a case study, offering valuable lessons on the interactions between LULC changes and climatic variables, providing guidance for managing similar ecosystems worldwide, particularly those susceptible to climate shifts and human encroachment. Future research could greatly benefit from including primary field studies, such as community surveys and biodiversity assessments, to enrich the understanding of local ecological dynamics and inform more precise conservation actions.
The original contributions presented in the study are included in the article/supplementary material, further inquiries can be directed to the corresponding author.
US: Conceptualization, Data curation, Formal Analysis, Methodology, Resources, Software, Validation, Visualization, Writing–original draft, Writing–review and editing. RD: Conceptualization, Data curation, Formal Analysis, Methodology, Resources, Software, Validation, Visualization, Writing–original draft, Writing–review and editing. SA: Data curation, Validation, Visualization, Writing–review and editing. AM: Data curation, Validation, Visualization, Writing–review and editing. RB: Funding acquisition, Investigation, Supervision, Writing–review and editing. SH: Funding acquisition, Project administration, Supervision, Resources, Writing–review and editing.
The author(s) declare that financial support was received for the research, authorship, and/or publication of this article. National Tiger Conservation Authority, Ministry of Environment Forest and Climate Change. Grant No. F.No. 5-5/2017-NTCA.
The study was funded by the National Tiger Conservation Authority, Ministry of Environment Forest and Climate Change, Government of India through the project “Management of invasive species in wet grasslands of Kaziranga Tiger Reserve. We thank the funding agency for providing their support. We thank the Director and Dean of the Wildlife Institute of India, Dehradun. We also sincerely thank the Director, Divisional Forest Officers, and Range Officers of Kaziranga Tiger Reserve for their support.
The authors declare that the research was conducted in the absence of any commercial or financial relationships that could be construed as a potential conflict of interest.
The author(s) declare that no Generative AI was used in the creation of this manuscript.
All claims expressed in this article are solely those of the authors and do not necessarily represent those of their affiliated organizations, or those of the publisher, the editors and the reviewers. Any product that may be evaluated in this article, or claim that may be made by its manufacturer, is not guaranteed or endorsed by the publisher.
Allan, R. P., and Soden, B. J. (2008). Atmospheric warming and the amplification of precipitation extremes. Science 321 (5895), 1481–1484. doi:10.1126/science.1160787
Babu, S., and Uma, G. (2023). Analyzing the impact of rainfall patterns on agriculture, economy and tourism in India: a Statistical Approach. Int. J. Environ. Clim. Change 13 (11), 4626–4637. doi:10.9734/IJECC/2023/v13i113642
Basumatary, H., Devi, H. S., Borah, S. B., and Das, A. K. (2021). Land cover dynamics and their driving factors in a protected floodplain ecosystem. River Res. Appl. 37 (4), 627–643. doi:10.1002/rra.3775
Betts, R. A., Boucher, O., Collins, M., Cox, P. M., Falloon, P. D., Gedney, N., et al. (2007). Projected increase in continental runoff due to plant responses to increasing carbon dioxide. Nature 448 (7157), 1037–1041. doi:10.1038/nature06045
Deka, R. L., Mahanta, C., Pathak, H., Nath, K. K., and Das, S. (2013). Trends and fluctuations of rainfall regime in the Brahmaputra and Barak basins of Assam, India. Theor. Appl. Climatol. 114, 61–71. doi:10.1007/s00704-012-0820-x
Ellis, E. C., Klein Goldewijk, K., Siebert, S., Lightman, D., and Ramankutty, N. (2010). Anthropogenic transformation of the biomes, 1700 to 2000. Glob. Ecol. Biogeogr. 19 (5), 589–606. doi:10.1111/j.1466-8238.2010.00540.x
Gaur, N., and Mohanty, B. P. (2013). Evolution of physical controls for soil moisture in humid and subhumid watersheds. Water Resour. Res. 49 (3), 1244–1258. doi:10.1002/wrcr.20069
Goswami, M., Prakash, S., Nautiyal, S., and Mukul, S. A. (2024). Potential environmental implications of sandbar afforestation: insights from ecosystem restoration initiatives in a sandbar of Brahmaputra River Assam, India. Land Use Policy 147, 107354. doi:10.1016/j.landusepol.2024.107354
He, Z., Zhao, W., Liu, H., and Chang, X. (2012). The response of soil moisture to rainfall event size in subalpine grassland and meadows in a semi-arid mountain range: a case study in northwestern China’s Qilian Mountains. J. Hydrology 420, 183–190. doi:10.1016/j.jhydrol.2011.11.056
Held, I. M., and Soden, B. J. (2006). Robust responses of the hydrological cycle to global warming. J. Clim. 19 (21), 5686–5699. doi:10.1175/JCLI3990.1
Holsten, A., Vetter, T., Vohland, K., and Krysanova, V. (2009). Impact of climate change on soil moisture dynamics in Brandenburg with a focus on nature conservation areas. Ecol. Model. 220 (17), 2076–2087. doi:10.1016/j.ecolmodel.2009.04.038
IPCC (2021). Climate change 2021: the physical science basis. Contribution of working group I to the sixth assessment report of the intergovernmental panel on climate change. V. Masson-Delmotte, P. Zhai, and A. Pirani, (Cambridge University Press).
Islami, F. A., Tarigan, S. D., Wahjunie, E. D., and Dasanto, B. D. (2022). Accuracy assessment of land use change analysis using google earth in sadar watershed mojokerto regency. IOP Conf. Ser. Earth Environ. Sci. 950 (1), 012091. doi:10.1088/1755-1315/950/1/012091
James, A. L., and Roulet, N. T. (2009). Antecedent moisture conditions and catchment morphology as controls on spatial patterns of runoff generation in small forest catchments. J. Hydrology 377 (3-4), 351–366. doi:10.1016/j.jhydrol.2009.08.039
Jeza, G. T., and Bekele, A. (2024). Land cover changes and impact on the African elephant (Loxodonta africana) conservation in Omo National Park, Ethiopia. Journal of Wildlife and Biodiversity 8 (2), 103–121. doi:10.5281/zenodo.11108561
Koster, R. D., Dirmeyer, P. A., Guo, Z., Bonan, G., Chan, E., Cox, P., et al. (2004). Regions of strong coupling between soil moisture and precipitation. Science 305 (5687), 1138–1140. doi:10.1126/science.1100217
Lal, R. (2013). Climate resilient agriculture and soil organic carbon. Indian J. Agron. 58 (4), 440–450. doi:10.59797/ija.v58i4.4224
Mahmood, R., and Hubbard, K. G. (2005). Assessing bias in evapotranspiration and soil moisture estimates due to the use of modeled solar radiation and dew point temperature data. Agric. For. meteorology 130 (1-2), 71–84. doi:10.1016/j.agrformet.2005.02.004
Makowski, K., Jaeger, E. B., Chiacchio, M., Wild, M., Ewen, T., and Ohmura, A. (2009). On the relationship between diurnal temperature range and surface solar radiation in Europe. J. Geophys. Res. Atmos. 114 (D10). doi:10.1029/2008JD011104
Mani, A., Guha, S., Sharma, S., Ali, S. Z., Badola, R., and Hussain, S. A. (2024). Morphometric analysis and LULC change dynamics of Nayar watershed for the sustainable watershed management. Discov. Geosci. 2 (1), 63. doi:10.1007/s44288-024-00064-8
Mertz, O., Müller, D., Sikor, T., Hett, C., Heinimann, A., Castella, J. C., et al. (2012). The forgotten D: challenges of addressing forest degradation in complex mosaic landscapes under REDD+. Geografisk Tidsskrift-Danish J. Geogr. 112 (1), 63–76. doi:10.1080/00167223.2012.709678
Mitsch, W. J., and Gosselink, J. G. (2015). Wetlands. John Wiley & Sons. Available at: https://epic.awi.de/id/eprint/37530/
Mondal, M. S., Sharma, N., Garg, P. K., and Kappas, M. (2016). Statistical independence test and validation of CA Markov land use land cover (LULC) prediction results. Egypt. J. Remote Sens. Space Sci. 19 (2), 259–272. doi:10.1016/j.ejrs.2016.08.001
Montzka, C., Moradkhani, H., Weihermüller, L., Franssen, H. J. H., Canty, M., and Vereecken, H. (2011). Hydraulic parameter estimation by remotely-sensed top soil moisture observations with the particle filter. J. hydrology 399 (3-4), 410–421. doi:10.1016/j.jhydrol.2011.01.020
National Aeronautics and Space Administration (NASA) Langley Research Center (LaRC) (2024). Prediction of worldwide energy resource (POWER). Available at: https://power.larc.nasa.gov/beta/data-access-viewer/(Accessed on: June 03, 2024).
O’Gorman, P. A. (2015). Precipitation extremes under climate change. Curr. Clim. change Rep. 1, 49–59. doi:10.1007/s40641-015-0009-3
Pachauri, R. K., and Meyer, L. A.Intergovernmental Panel on Climate Change (2014). Climate change 2014: synthesis report. Contribution of working groups I, II and III to the fifth assessment report of the intergovernmental panel on climate change, 151. IPCC.
M. L. Parry (2007). Climate change 2007-impacts, adaptation and vulnerability: working group II contribution to the fourth assessment report of the IPCC (Cambridge University Press), 4.
Pingali, P. L. (2012). Green revolution: impacts, limits, and the path ahead. Proc. Natl. Acad. Sci. 109 (31), 12302–12308. doi:10.1073/pnas.0912953109
Puig, C. J., Hyman, G., and Bolanos, S. (2002). Digital classification vs. Visual interpretation: a case study in humid tropical forests of the Peruvian amazon. Cali-Palmira, Colombia Int. Cent. Trop. Agric.
Qian, B., Gregorich, E. G., Gameda, S., Hopkins, D. W., and Wang, X. L. (2011). Observed soil temperature trends associated with climate change in Canada. J. Geophys. Res. Atmos. 116 (D2), D02106. doi:10.1029/2010JD015012
Roy, P. S., Ramachandran, R. M., Paul, O., Thakur, P. K., Ravan, S., and Behera, M. D. (2022). Anthropogenic land use and land cover changes―A review on its environmental consequences and climate change. J. Indian Soc. Remote Sens. 50 (8), 1615–1640. doi:10.1007/s12524-022-01569-w
Roy, P. S., and Tomar, S. (2000). Biodiversity characterization at landscape level using geospatial modelling technique. Biol. Conserv. 95 (1), 95–109. doi:10.1016/S0006-3207(99)00151-2
Saikia, A. (2004). “The region,” in Indigenous control and sustainability of common resources in the hills of North East India.
Sala, O. E., Stuart Chapin, F. I. I. I., Armesto, J. J., Berlow, E., Bloomfield, J., Dirzo, R., et al. (2000). Global biodiversity scenarios for the year 2100. science 287 (5459), 1770–1774. doi:10.1126/science.287.5459.1770
Samarasinghe, J. T., Makumbura, R. K., Wickramarachchi, C., Sirisena, J., Gunathilake, M. B., Muttil, N., et al. (2022). The assessment of climate change impacts and land-use changes on flood characteristics: the case study of the Kelani River Basin, Sri Lanka. Hydrology 9 (10), 177. doi:10.3390/hydrology9100177
Seneviratne, S. I., Lüthi, D., Litschi, M., and Schär, C. (2006). Land–atmosphere coupling and climate change in Europe. Nature 443 (7108), 205–209. doi:10.1038/nature05095
Srikanth, K., and Swain, D. (2022). Urbanization and Land surface temperature changes over Hyderabad, a semi-arid mega city in India. Remote Sens. Appl. Soc. Environ. 28, 100858. doi:10.1016/j.rsase.2022.100858
Stocker, T. F., Qin, D., Plattner, G. K., Tignor, M. M., Allen, S. K., Boschung, J., et al. (2014). Climate Change 2013: the physical science basis. contribution of working group I to the fifth assessment report of IPCC the intergovernmental panel on climate change. doi:10.1017/CBO9781107415324
Tucker, R. P. (1988a). “The depletion of India's forests under British imperialism: planters, foresters, and peasants in Assam and Kerala,” in The ends of the earth: perspectives on modern environmental history. Editor D. Worster (Cambridge: Cambridge University Press), 18–140.
Tucker, R. P. (1988b). “The British empire and India’s forest resources: the timberlands of Assam and Kumaon 1914-1950,” in World deforestation in the twentieth century. Editors J. F. Richards, and R. P. Tucker (Durham and London: Duke University Press), 91–111.
Varallyay, G. (2010). The impact of climate change on soils and their water management. Agron. Res. 8, 385–396.
Vattakkavan, J., Vasu, N. K., Varma, S., Gureja, N., and Aiyadurai, A. (2002). Silent stranglers: eradication of mimosa in Kaziranga national Park, Assam. Wildlife trust of India. New Delhi, 55.
Venkatesh, B., Lakshman, N., Purandara, B. K., and Reddy, V. B. (2011). Analysis of observed soil moisture patterns under different land covers in Western Ghats, India. J. hydrology 397 (3-4), 281–294. doi:10.1016/j.jhydrol.2010.12.006
Vose, R. S., Easterling, D. R., and Gleason, B.others (2005). Maximum and minimum temperature trends for the globe: an update through 2004. Geophys. Res. Lett. 32 (23). doi:10.1029/2005GL024379
Wang, G., Li, Y., Hu, H., and Wang, Y. (2008). Synergistic effect of vegetation and air temperature changes on soil water content in alpine frost meadow soil in the permafrost region of Qinghai-Tibet. Hydrological Process. Int. J. 22 (17), 3310–3320. doi:10.1002/hyp.6913
Yang, W., Yin, X., and Xia, G. (2015). Learning high-level features for satellite image classification with limited labeled samples. IEEE Trans. Geoscience Remote Sens. 53, 4472–4482. doi:10.1109/TGRS.2015.2400449
Yue, S., Pilon, P., Phinney, B., and Cavadias, G. (2002). The influence of autocorrelation on the ability to detect trend in hydrological series. Hydrol. Proc. 16, 1807–1829. doi:10.1002/hyp.1095
Zhao, G., Gao, H., Li, Y., Tang, Q., Woolway, R. I, Merder, J., et al. (2025). Decoupling of surface water storage from precipitation in global drylands due to anthropogenic activity. Nature Water, 1–9. doi:10.1038/s44221-024-00367-7
Keywords: Kaziranga tiger reserve, threats, land-use change, habitat alteration, climatic trends
Citation: Saeed U, Das R, Ali SZ, Mani A, Badola R and Hussain SA (2025) Evolving landscapes: long term land use and climate-induced changes in the Brahmaputra floodplain, India. Front. Environ. Sci. 13:1550450. doi: 10.3389/fenvs.2025.1550450
Received: 23 December 2024; Accepted: 14 February 2025;
Published: 07 March 2025.
Edited by:
Merja H. Tölle, University of Kassel, GermanyReviewed by:
Kushagra Rajendra, Amity University Gurgaon, IndiaCopyright © 2025 Saeed, Das, Ali, Mani, Badola and Hussain. This is an open-access article distributed under the terms of the Creative Commons Attribution License (CC BY). The use, distribution or reproduction in other forums is permitted, provided the original author(s) and the copyright owner(s) are credited and that the original publication in this journal is cited, in accordance with accepted academic practice. No use, distribution or reproduction is permitted which does not comply with these terms.
*Correspondence: Syed Ainul Hussain, YWludWwuaHVzc2FpbkBnbWFpbC5jb20=
†These authors have contributed equally to this work and share first authorship
Disclaimer: All claims expressed in this article are solely those of the authors and do not necessarily represent those of their affiliated organizations, or those of the publisher, the editors and the reviewers. Any product that may be evaluated in this article or claim that may be made by its manufacturer is not guaranteed or endorsed by the publisher.
Research integrity at Frontiers
Learn more about the work of our research integrity team to safeguard the quality of each article we publish.