 Zhenkai Qin
 Baozhong Wei1
 Hongfeng Zhang
94% of researchers rate our articles as excellent or good
Learn more about the work of our research integrity team to safeguard the quality of each article we publish.
Find out more
ORIGINAL RESEARCH article
Front. Environ. Sci., 17 March 2025
Sec. Big Data, AI, and the Environment
Volume 13 - 2025 | https://doi.org/10.3389/fenvs.2025.1549209
This article is part of the Research TopicDust and Polluted Aerosols: Sources, Transport and Radiative Effects Volume IIView all articles
Introduction: With the rapid advancement of industrialization and the prevalent occurrence of haze weather,
Methods: A novel predictive methodology has been developed. It integrates time seriesfrequency domain analysis with the decomposition of deep learning models. This approach facilitates the capture of interdependencies among high - dimensional features through time series decomposition, employs Fourier Transform to mitigate noise interference, and incorporates sparse attention mechanisms to selectively filter critical frequency components, thereby enhancing time - dependent modeling. Importantly, this technique effectively reduces computational complexity from
Results: Empirical findings substantiate that this methodology yields notably superior predictive accuracy relative to conventional models across a diverse array of real-world datasets.
Discussion: This advancement not only offers an efficacious resolution for
Over the past several decades, the rapid pace of industrialization has precipitated the frequent occurrence of smog, thereby intensifying environmental pollution. Fine particulate matter
Developing an efficient air pollution monitoring and prediction system is, consequently, imperative for safeguarding human health and alleviating economic losses. Nonetheless, the formation mechanism of
The advent of deep learning technologies has led to the emergence of Transformer-based deep learning models as innovative solutions for tackling complex problems and enhancing performance. These models are particularly efficacious as they account for the temporal correlations inherent in pollutant concentration sequences. To date, deep learning models have demonstrated state-of-the-art capabilities in time-series prediction tasks. By capitalizing on the neural networks’ ability to extract temporal features from time-series data, the precision of pollutant concentration predictions can be substantially improved. Empirical studies on air pollutant prediction have shown that deep learning models surpass traditional methods, including classical machine learning algorithms, by more effectively capturing high-dimensional feature dependencies and temporal patterns (Panneerselvam and Thiagarajan 2024). Nevertheless, conventional Transformer models encounter several challenges, particularly their substantial computational cost, which is especially significant when dealing with large-scale environmental datasets. The temporal continuity, dynamic fluctuations, and complex intercorrelations within pollutant concentration time-series data further complicate accurate prediction and analysis. Moreover, challenges such as noise, nonlinearity, and high-dimensional complexity inherent in environmental big data pose considerable obstacles for extracting temporal correlation information between pollutant concentrations and meteorological factors (Chen et al., 2024).
To tackle these challenges, this study introduces an end-to-end framework named Sparse Frequency Decomposition Transformer (SFDformer) for predicting the time series of pollutant concentrations. Figure 1 illustrates an overview of the proposed method. This approach uses time-series decomposition to capture the interdependencies among high-dimensional features and employs Fourier Transform to convert the data into the frequency domain, effectively reducing noise interference. The SFDformer integrates a sparse attention mechanism that selectively allocates weights to key frequency components, reducing the computational complexity from quadratic to linear time complexity. This design enhances computational efficiency while accurately extracting crucial features, providing a more accurate and efficient solution for forecasting pollutant concentrations. In summary, the main contributions of this paper are as follows.
• By fully considering the temporal dependencies in the time domain and the characteristic information in the frequency domain, a dual-domain modeling approach is used to accurately extract the complex correlation features between pollutant concentrations and meteorological data.
• We have introduced a frequency sparse attention mechanism based on Fourier transform, which combines sparse attention with Fourier transform to reduce the computational cost of self-attention layers and the impact of noise during the prediction process.
• In the issue of air pollution prediction, extensive experiments on eight real datasets have demonstrated the practicality and feasibility of the proposed model in
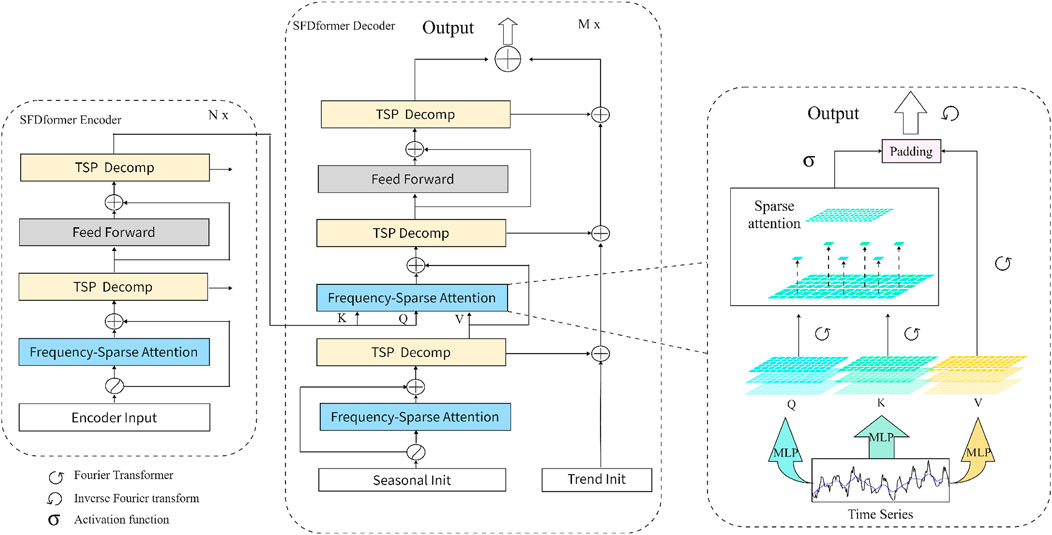
Figure 1. Schematic overview of the proposed SFDformer method. Initially, the Sparse Frequency Decomposition Attention module (Frequency-Sparse Attention, blue block) is designed to perform frequency transformation and reduce model parameters by leveraging Fourier transform and sparse attention mechanisms. More specifically, the Fourier transform converts time-domain data into the frequency domain to reduce the impact of noise, while sparse attention is employed to filter the critical frequency weight matrices. After that, the time series pooling decomposition (TSP Decomp, yellow block) method is utilized to extract seasonal and trend patterns from the input time series data.
The prediction of air pollutant concentrations is currently accomplished through two primary methodologies: physicochemical approaches and data-driven approaches. Physicochemical approaches entail the simulation and analysis of the physical and chemical processes that regulate air pollutants, employing fundamental physical and chemical principles to forecast pollutant behavior across diverse spatial and temporal scales (Thongthammachart et al., 2021; Kang et al., 2018; Hofman et al., 2022). Although these approaches can yield high prediction accuracy, they typically necessitate intricate model configurations and extensive parameter tuning, which may result in limited model generalization and diminished robustness in practical applications (Wang et al., 2020).
Emergence of meteorological stations and analogous monitoring devices, air quality monitoring stations, and meteorological satellites has enabled the gathering of data on air pollutant concentrations and meteorological conditions. This data provides strong support for research on air quality prediction (Gu et al., 2021; Kim et al., 2022). Data-driven methodologies have been increasingly employed to forecast air pollutant concentrations. In the nascent stages of air pollution prediction research, conventional machine learning models such as ARIMA and SARIMA were extensively utilized. These models forecast pollutant concentrations by examining the historical trends and periodic characteristics of time series data (Marvin et al., 2022). While these methods excel in modeling stationary time series and capturing short-term dependencies, they exhibit notable limitations when addressing complex nonlinear relationships and long-term sequence dependencies (Zhou et al., 2018). Specifically, the omission of high-frequency information in traditional machine models results in the loss of critical data, thereby constraining prediction accuracy and applicability. Furthermore, these methods encounter difficulties in leveraging multidimensional data (such as meteorological features and concentrations of other pollutants) to delineate more comprehensive pollutant characteristics (Tagliabue et al., 2021). With advancements in data scale and computational power, machine learning methodologies have progressively emerged as more versatile options. Models such as Support Vector Regression (SVR), Random Forest (RF), and Multi-Layer Perceptron (MLP) have gained widespread adoption due to their efficacy in managing nonlinear relationships (Haq and Ahmad Khan, 2022; Rybarczyk and Zalakeviciute, 2018). These methodologies demonstrate superior predictive performance compared to traditional statistical methods by utilizing multidimensional data for modeling (Ma X. et al., 2023; Pan et al., 2023). However, they depend on manually crafted feature engineering, and their capacity to model the interdependencies of other multidimensional data influencing air pollutant concentrations remains limited (Zaini et al., 2022). Nonetheless, these methodologies have furnished valuable insights into air pollution prediction and established a foundation for investigating hybrid models that integrate traditional methods with deep learning technologies (Kshirsagar and Shah, 2022; Méndez et al., 2023).
The rapid advancement of deep learning technologies has led to significant breakthroughs in their application to time series forecasting, especially in the realm of air pollution prediction. In comparison to traditional statistical methods and classical machine learning techniques, deep learning models exhibit considerable advantages due to their robust ability to model non-linearity and precisely capture temporal dependencies. Recurrent Neural Networks (RNNs) and their sophisticated variants, such as Long Short-Term Memory Networks [LSTMs Han et al. (2023)] and Gated Recurrent Units (GRUs), have been extensively utilized to process time series data (Espinosa et al., 2021). These models adeptly capture long-term dependencies through memory units, effectively mitigating the challenges of vanishing and exploding gradients (Athira et al., 2018; Faraji et al., 2022). Nonetheless, individual models still possess certain limitations in modeling high-dimensional features (Sarkar et al., 2022). To further enhance the performance of air pollution time series forecasting, researchers have devised hybrid architectures, such as LSTM-CNN (Ghimire et al., 2019), LSTM-RNN (Ozcanli et al., 2020), and CNN-LSTM-RNN (Ko and Jung, 2022). These models amalgamate the strengths of distinct neural networks: LSTM-CNN extracts intricate features via CNNs while LSTM captures temporal dependencies, rendering it suitable for managing complex time series data; LSTM-RNN integrates RNN’s capability to handle short-term dependencies with LSTM’s capacity to capture long-term trends, making it ideal for data exhibiting both short-term fluctuations and long-term patterns; CNN-LSTM-RNN consolidates the advantages of CNNs, LSTMs, and RNNs, enabling it to process more intricate air pollution data scenarios. Despite these hybrid models demonstrating substantial performance improvements, they are accompanied by several limitations, such as elevated model complexity, extended training times, substantial hardware resource demands, and difficulties in hyperparameter tuning, which escalate optimization costs. Furthermore, the intricacy of these models often results in overfitting, particularly when data is limited or of inferior quality (Wang et al., 2022; Yuan et al., 2020).
To address these challenges, Transformer-based models have demonstrated exceptional performance in tackling the intricacies of feature modeling, primarily due to their attention mechanism (Zhang and Zhang, 2023). However, conventional Transformer models typically exhibit high computational complexity and are susceptible to noise when managing high-dimensional dependencies (Guo and Mao, 2023). To alleviate these issues, researchers have introduced sparse attention mechanisms that concentrate on crucial dependencies, substantially reducing computational complexity to linear levels while maintaining robust global modeling capabilities (Al-qaness et al., 2023; Ma Z. et al., 2023). Considering that air pollutant concentrations frequently display significant seasonal variations influenced by meteorological factors, integrating time series decomposition and autocorrelation mechanisms can aid the model in better grasping the complex interdependencies among various features in the time series. Furthermore, frequency-domain enhancement techniques have substantially improved the overall performance and efficiency of the models by diminishing noise interference in long-term dependencies (Zeng et al., 2023). Inspired by these advancements, we propose the SFDformer method. This approach employs time series decomposition techniques to segregate the data into seasonal and trend components, effectively capturing factors such as air pollution, which are subject to seasonal fluctuations and trend variations. By employing Fourier transforms to transform time-domain data into frequency-domain data, we mitigate noise interference. The sparse attention mechanism further prioritizes essential frequency components and assigns them higher weights, enabling the model to capture critical short-term alterations while preserving vital long-term traits. This enhancement not only significantly boosts computational efficiency but also bolsters the model’s stability and robustness in capturing the dependencies between high-dimensional features of air pollution concentrations, offering a more efficient and precise solution for intricate air pollution forecasting tasks.
The air pollution forecasting problem can be defined in a rolling prediction setting, where the future air quality over a given time horizon is predicted based on historical observations within a fixed-size window. At each time point
In real-world air pollution time series data, intricate seasonal patterns often intertwine with trend components, making them difficult to disentangle. Traditional fixed-window average pooling methods struggle to effectively capture such diverse temporal characteristics. To address this challenge, as depicted in Figure 2, we introduce a Time Series Pooling Decomposition Module (TSP Decomp), meticulously designed to tackle the complexities inherent in environmental time series forecasting.
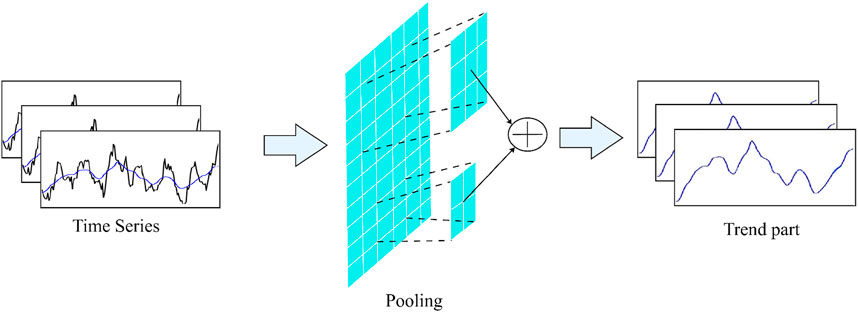
Figure 2. Time series pooling decomposition module.
This module incorporates a variety of average pooling filters with differing window sizes, allowing for the adaptable extraction of multiple trend components from the input signal. Furthermore, a dynamic weighting mechanism, based on the attributes of the input data, combines these trend components into a comprehensive final trend depiction. As shown in Equations 1, 2:
In these two formulas,
In the scholarly domain of air pollution time series forecasting, the Discrete Fourier Transform (DFT) and its counterpart, the Inverse Discrete Fourier Transform (IDFT), are instrumental in scrutinizing complex periodicity and trend variation patterns. This is accomplished by enabling the transition of time series data between the temporal and frequency domains. The DFT decomposes the time series into long-term trends and periodic components, which facilitates the identification of significant periodic features and the elimination of random noise. Subsequently, the IDFT reconstructs the processed signal back into the time domain.
For a time series
The IDFT uses Equation 4 to restore the frequency-domain data to the time domain:
In DFT, determines series length and frequency resolution, indexes frequency components, and
The conventional attention mechanisms utilize three inputs:
In the formulas, the matrices
The probability
In the traditional attention mechanisms, the attention distribution
In the above formula,
A higher
We apply the Discrete Fourier Transform (DFT) to transform the queries
In the above formula,
At the screening frequency, it is sufficient to randomly sample
This research employed historical data on pollutant concentrations and meteorological conditions, gathered from monitoring stations situated in eight different cities throughout China. The dataset spans the timeframe from 28 October 2013, to 31 May2021. The experimental data in this study is based on a city-level perspective, where daily sample data for each city is represented as a one-dimensional feature vector, with feature elements consisting of pollutants and meteorological factors. The eight selected cities are Baoding, Handan, Jingzhou, Shijiazhuang, Xingtai, Yulin, Lishui, Urumqi,Jingzhou are among the selected cities, each exhibiting unique economic development characteristics within China. These cities are strategically positioned across various geographical regions of the country(see Figure 3). In the analysis, six distinct types of pollutants were considered, alongside three indicators for evaluating pollution levels and three meteorological factors that influence pollutant concentrations. each of which has distinctive characteristics in terms of economic development in China. The selected cities are strategically located across diverse geographical regions within the nation, each presenting distinct pollution characteristics. (refer to Table 1 for details): air quality grade, AQI index, daily AQI ranking,
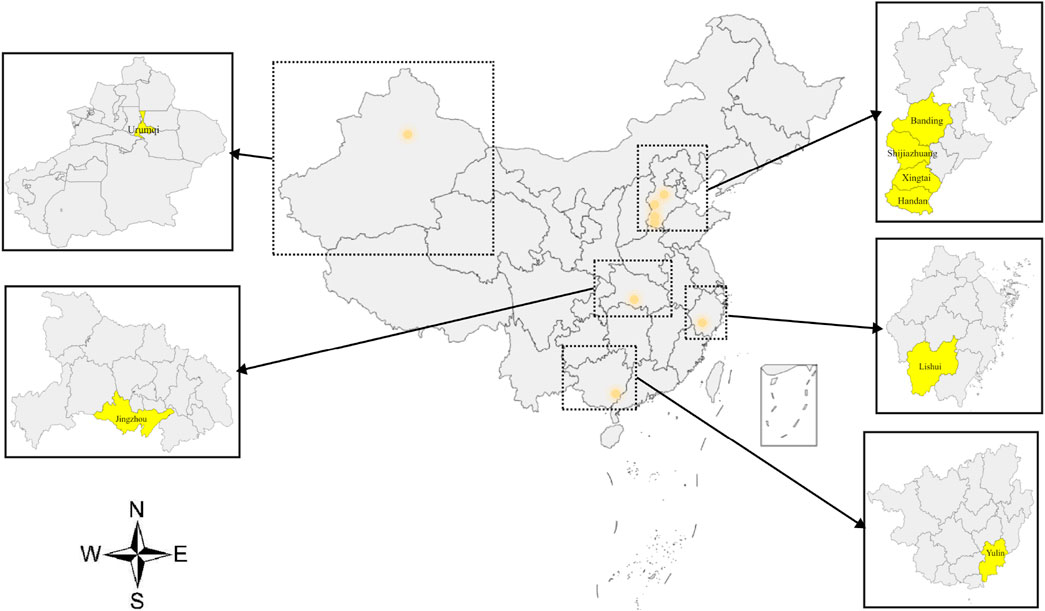
Figure 3. Geographical locations of cities.
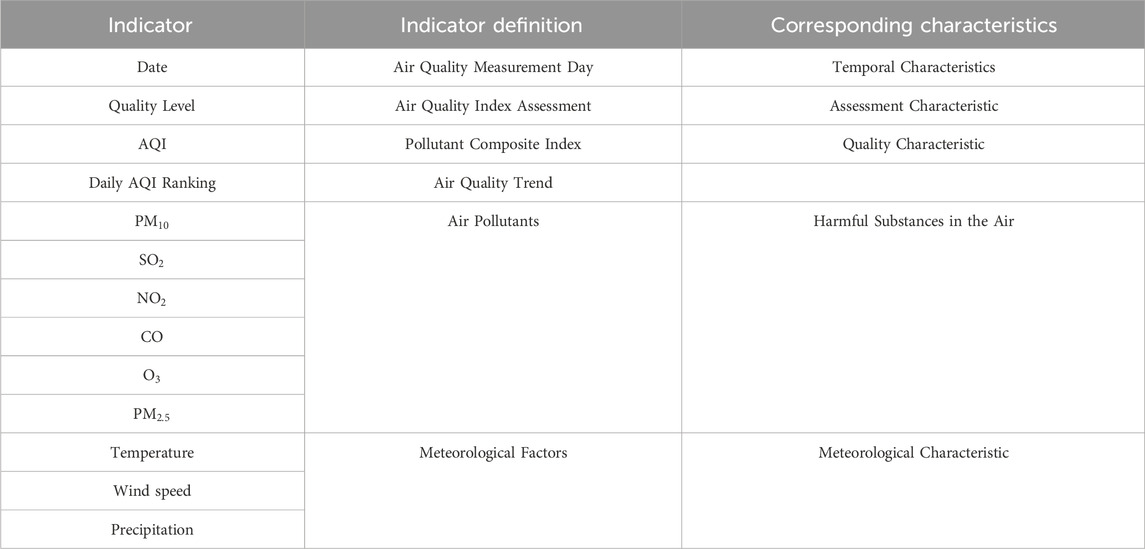
Table 1. Characteristic indicators of air pollution time prediction dataset. We utilize Indicator to represent various features within the air pollution dataset. The Indicator Definition elucidates the meaning of each feature, while the Corresponding Characteristics describe the specific attributes associated with these features.
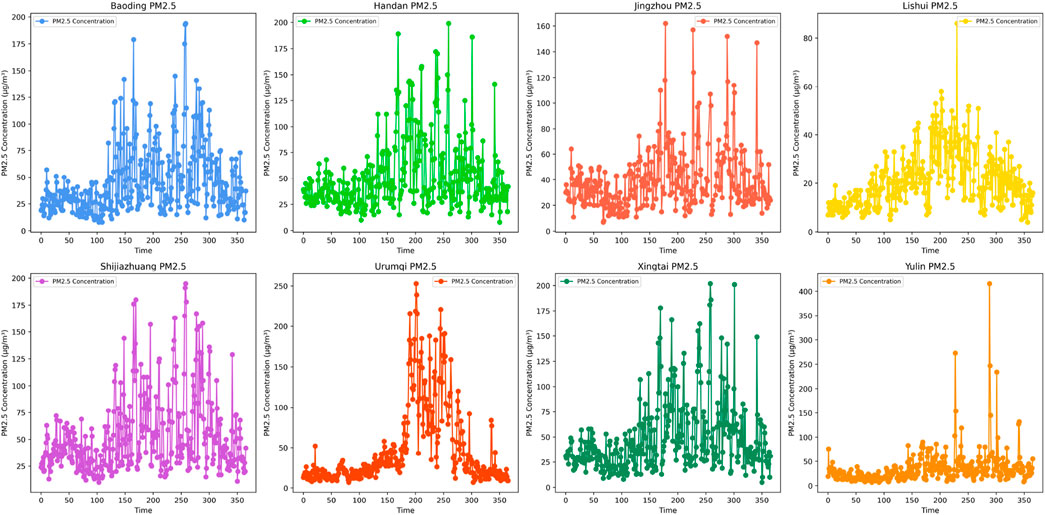
Figure 4.
Harnessing the benefits of Transformer architectures in managing time series information, we integrated residual connections into our model, embedding them within decomposition blocks (Yu et al., 2024). These blocks incorporate functionalities like moving averages, which assist in evening out periodic oscillations and highlighting long-term tendencies within the time series data. As a result, residual connections significantly improve the model’s ability to perceive and assimilate complex patterns inherent in time series, thereby significantly boosting its proficiency in long-term projections. To further enhance the self-attention mechanism, we subjected the input features to nonlinear transformations and dimensional alterations via a Multi-Layer Perceptron (MLP), resulting in innovative feature renditions. This tactic allows the model to more precisely detect intricate patterns and profound interconnections embedded in the time series information, ultimately refining its overall predictive capabilities. Our training methodology utilizes L2 loss along with the ADAM optimizer (Kingma and Ba, 2015), initiated with a learning rate of 0.0001 and a batch size of 32. The attention factor is established at 3, and weight decay is set to 0.1. Training concludes prematurely after 10 epochs. Every experiment was replicated thrice and executed using PyTorch (Paszke et al., 2019), facilitated on a solitary NVIDIA Tesla V100 32 GB GPU (Markidis et al., 2018).
In this study, we utilize Mean Squared Error (MSE), Mean Absolute Error (MAE), and Root Mean Squared Error (RMSE) as three essential criteria to assess the predictive accuracy of the SFDformer model. The detailed explanations for calculating these indicators are provided in Equations 13–15:
Where
We evaluated seven baseline methods for comparative analysis. In the multivariate setting, we selected four Transformer-based models: Autoformer (Wu et al., 2021), Informer (Zhou et al., 2021), Reformer (Kitaev et al., 2020), and Pyraformer Liu et al. (2022), in addition to one model based on linear networks: FiLM (Zhou et al., 2022a). For the univariate setting, we considered more competitive baselines: FEDformer (Zhou et al., 2022b), and a model based on MLP: LightTS (Campos et al., 2023).
Multivariate analysis involves the simultaneous consideration of multiple time series to examine the interrelationships and influences among them.In the multivariate settings, we conducted experiments using eight different datasets. The results indicate that SFDformer consistently achieved state-of-the-art performance across most baseline and prediction horizon configurations (see Table 2). Specifically, under the input-96-predict-58 (The model utilizes 96 historical data points to forecast 58 future data points) configuration, SFDformer reduces the MSE by 0.9% in Baoding (0.328
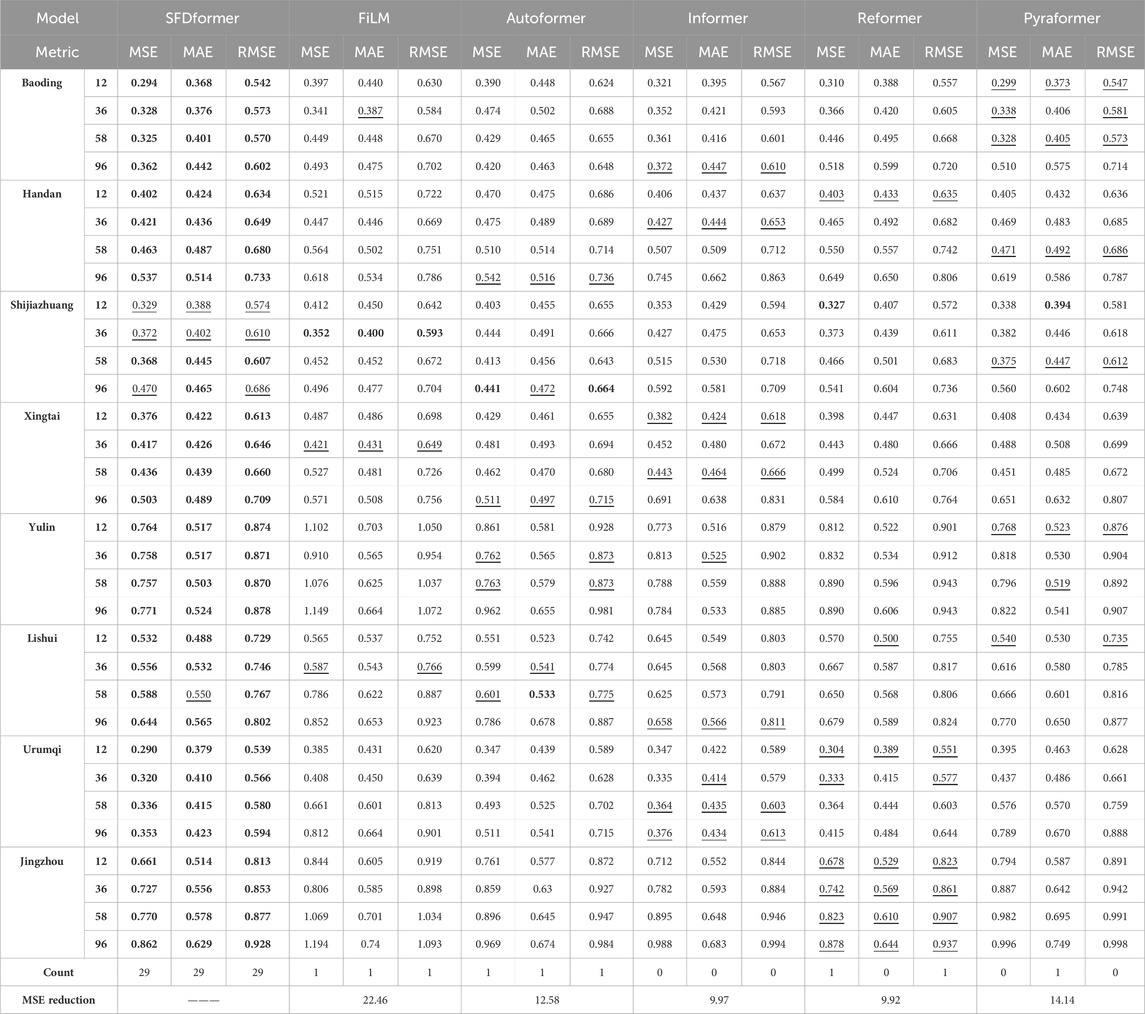
Table 2. Multivariate results with different prediction lengths
Univariate analysis predicts future values based solely on the historical data of a single time series. We showcase the univariate outcomes for eight illustrative datasets, as depicted in Table 3. In contrast with numerous baseline models, SFDformer achieves cutting-edge performance in prediction tasks. Notably, under the input-96-predict-58 setup, our model diminishes the mean absolute error (MAE) on the Baoding dataset by 1.1% (0.339
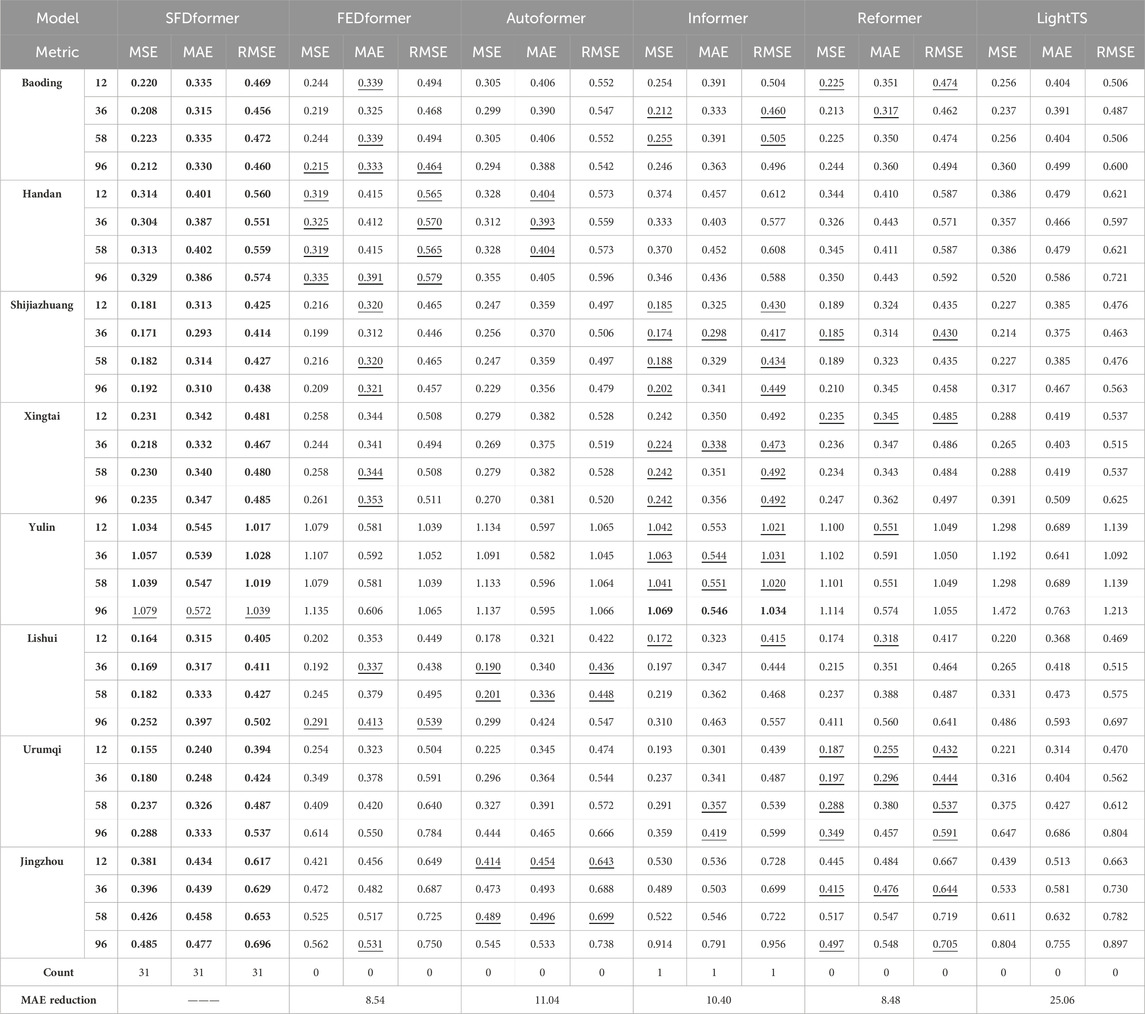
Table 3. Univariate results with different prediction lengths
This study assesses the impact of the Sparse Frequency Domain Attention (SFDA) module on model performance via an ablation experiment. Three variants of SFDformer were tested: KEDformer, which entirely substitutes both the self-attention and cross-attention mechanisms with SFDA; SFDformerV1, which replaces only the self-attention mechanism with SFDA while maintaining the cross-correlation attention mechanism; and SFDformerV2, which employs self-correlation attention to manage both mechanisms. The experiments were conducted on eight datasets, as illustrated in Table 4. SFDformer exhibited performance enhancements in 90 out of 96 test cases. Importantly, the SFDformer integrated with the SFDA module consistently demonstrated improvements across all cases, corroborating the effectiveness of SFDA in substituting traditional attention mechanisms and significantly improving the model’s performance.

Table 4. Ablation study results with different prediction lengths
The present study comprehensively evaluates the impact of various self-attention mechanisms on model performance and computational efficiency, with a detailed analysis of the trade-offs between these two aspects (see Figure 5). To further verify the model’s generalization capability across regions with different levels of air pollution, two distinct locations were selected: Handan, situated in northern China and characterized by relatively severe air pollution, and Lishui, located in eastern China with relatively mild air pollution. The SFDformer model stands out from other models by integrating Fourier transform and sparse attention techniques into its attention mechanism, thereby significantly enhancing prediction accuracy. Compared with traditional Transformer models, SFDformer effectively mitigates the inherent quadratic complexity of conventional attention mechanisms, leading to a substantial improvement in operational efficiency. This feature makes SFDformer particularly well-suited for handling large-scale time series datasets, such as those used in air pollution forecasting tasks.
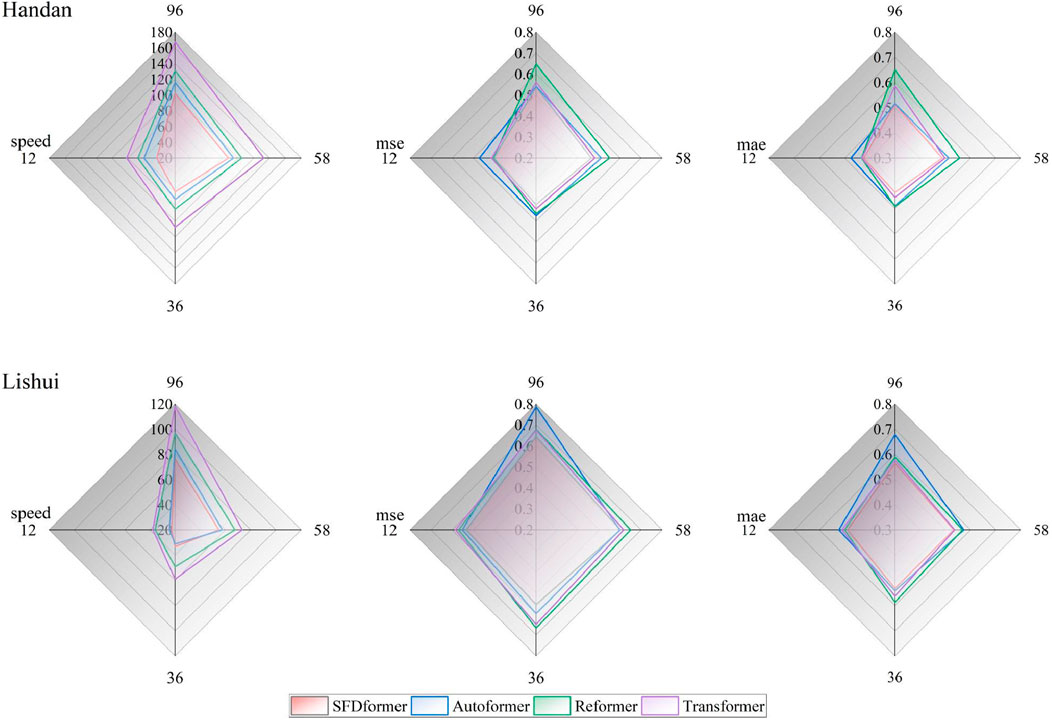
Figure 5. Experiment for evaluating computational efficiency and performance. The input length was fixed at
In the multivariate setting and with the current optimal implementation of all methods, SFDformer has achieved a significant enhancement in computational efficiency compared to conventional Transformer models. This improvement effectively addresses the challenges associated with the quadratic time complexity

Table 5. Comparison of accuracy and efficiency metrics for different methods.
To explore the effectiveness of time series decomposition and Fourier transform techniques, we conducted experimental studies using datasets from Handan and Lishui, two regions with significantly different levels of air pollution. As illustrated in Figure 6, the SFDformer model integrates both techniques, whereas the SFDformer-NF model excludes the Fourier transform step, and the SFDformer-NFD model omits both techniques. The experimental results elucidate that the SFDformer model surpasses the other two models, with performance enhancements stemming from several pivotal factors. Primarily, the time series decomposition technique enables the model to directly emulate the seasonal variations in air pollutant concentrations, thereby more accurately capturing periodic patterns and significantly improving the model’s ability to make predictions based on historical data. Secondly, the application of the Fourier transform allows the model to discern and accentuate crucial features in the data while mitigating noise interference, ensuring the model concentrates on the most pertinent information during predictions. These findings substantiate the efficacy of time series decomposition and Fourier transform techniques in improving model performance. This version adheres to the standards for scientific articles, employing clear and precise language.
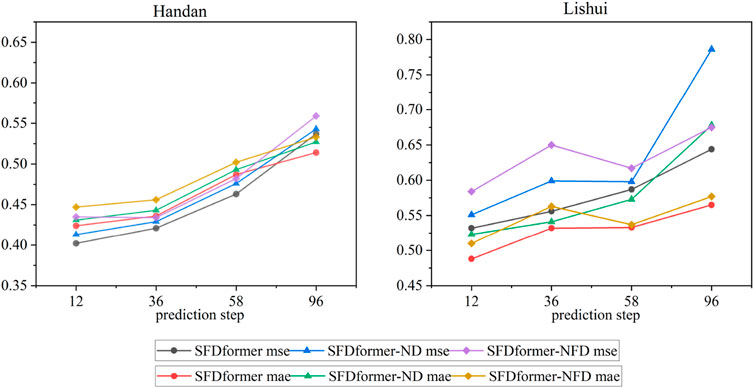
Figure 6.
In this study, the SFDformer model demonstrated remarkable precision in predicting
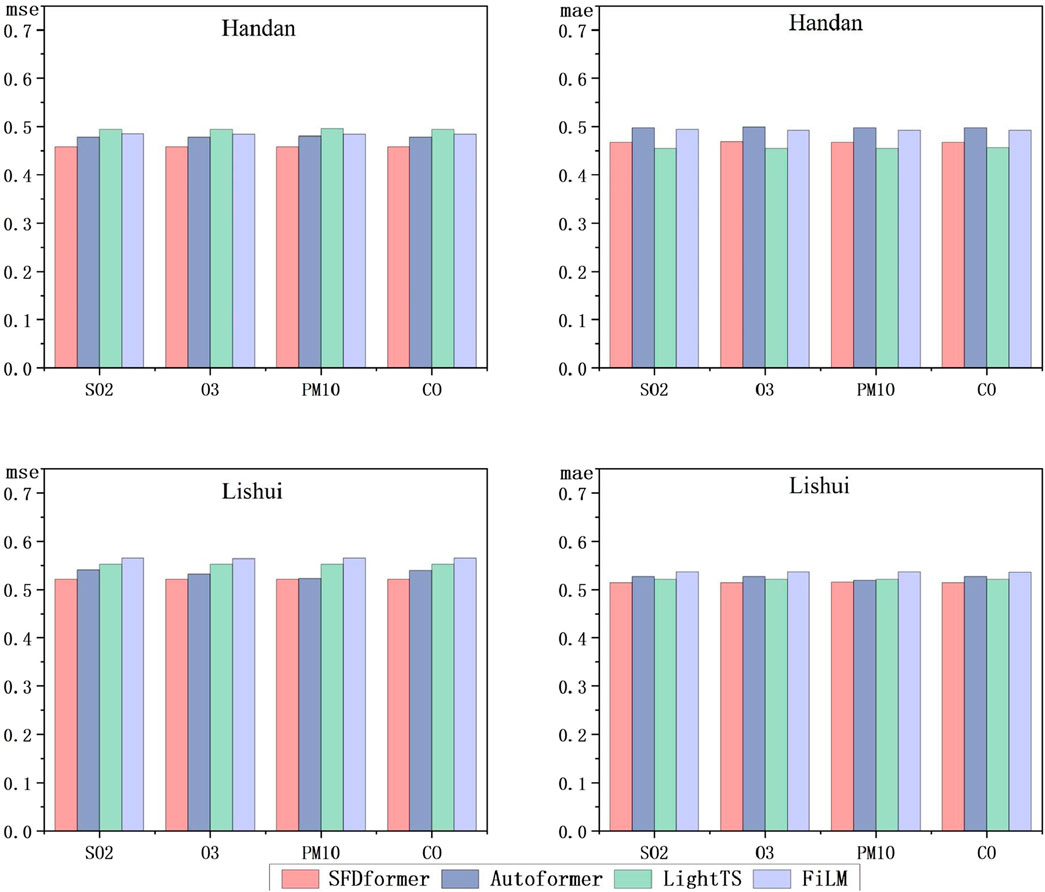
Figure 7. Prediction results for
The rapid advancement of deep learning technologies has led to their widespread adoption across both academia and industry. This paper presents a novel framework, SFDformer, which seamlessly integrates time series decomposition, Fourier transform, and sparse attention mechanisms. Through the employment of time series decomposition, SFDformer adeptly captures the seasonal fluctuations and long-term trends of
In future research, we will focus on enhancing the adaptability of SFDformer to diverse datasets, especially those with irregular patterns. We are confident that through further optimization and expansion, SFDformer will achieve even more remarkable results in the highly challenging field of air pollution time-series forecasting. In summary, SFDformer has made significant breakthroughs in addressing the complexities of air pollution time-series forecasting. This achievement not only demonstrates its strong effectiveness but also highlights its great potential and broad application prospects in this critical field.
The datasets presented in this study can be found in online repositories. The names of the repository/repositories and accession number(s) can be found in the article/supplementary material.
ZQ: Conceptualization, Methodology, Formal Analysis, Investigation, Writing–original draft. BW: Methodology, Software, Investigation, Data curation, Writing–original draft, Visualization. CG: Investigation, Methodology, Validation, Writing–original draft. XC: Conceptualization, Investigation, Resources, Writing–review and editing, Supervision, Project administration. HZ: Conceptualization, Validation, Formal analysis, Resources, Writing–review and editing, Supervision, Project administration. CUIW: Validation, Resources, Writing–review and editing.
The author(s) declare that no financial support was received for the research, authorship, and/or publication of this article.
The authors declare that the research was conducted in the absence of any commercial or financial relationships that could be construed as a potential conflict of interest.
The author(s) declare that no Generative AI was used in the creation of this manuscript.
All claims expressed in this article are solely those of the authors and do not necessarily represent those of their affiliated organizations, or those of the publisher, the editors and the reviewers. Any product that may be evaluated in this article, or claim that may be made by its manufacturer, is not guaranteed or endorsed by the publisher.
Ailshire, J. A., and Crimmins, E. M. (2014). Fine particulate matter air pollution and cognitive function among older us adults. Am. J. Epidemiol. 180, 359–366. doi:10.1093/aje/kwu155
Al-qaness, M. A., Dahou, A., Ewees, A. A., Abualigah, L., Huai, J., Abd Elaziz, M., et al. (2023). Resinformer: residual transformer-based artificial time-series forecasting model for pm2. 5 concentration in three major Chinese cities. Mathematics 11, 476. doi:10.3390/math11020476
Athira, V., Geetha, P., Vinayakumar, R., and Soman, K. (2018). Deepairnet: Applying recurrent networks for air quality prediction. Procedia Comput. Sci. 132, 1394–1403. doi:10.1016/j.procs.2018.05.068
Campos, D., Zhang, M., Yang, B., Kieu, T., Guo, C., and Jensen, C. S. (2023). Lightts: Lightweight time series classification with adaptive ensemble distillation. Proc. ACM Manag. Data 1, 1–27. doi:10.1145/3589316
Chen, S., He, L., Shen, S., Zhang, Y., and Ma, W. (2024). Improving air quality prediction via self-supervision masked air modeling. Atmosphere 15, 856. doi:10.3390/atmos15070856
Deng, Y., Zhi, P., Zhu, W., Sang, T., and Li, Y. (2024). Prediction of pm2. 5 concentration based on bayesian optimization random forest, in 2024 43rd Chinese Control conference (CCC) (IEEE), 8507–8511.
Du, Y., Xu, X., Chu, M., Guo, Y., and Wang, J. (2016). Air particulate matter and cardiovascular disease: the epidemiological, biomedical and clinical evidence. J. Thorac. Dis. 8, E8–E19. doi:10.3978/j.issn.2072-1439.2015.11.37
Espinosa, R., Palma, J., Jiménez, F., Kamińska, J., Sciavicco, G., and Lucena-Sánchez, E. (2021). A time series forecasting based multi-criteria methodology for air quality prediction. Appl. Soft Comput. 113, 107850. doi:10.1016/j.asoc.2021.107850
Faraji, M., Nadi, S., Ghaffarpasand, O., Homayoni, S., and Downey, K. (2022). An integrated 3d cnn-gru deep learning method for short-term prediction of pm2. 5 concentration in urban environment. Sci. Total Environ. 834, 155324. doi:10.1016/j.scitotenv.2022.155324
Ghimire, S., Deo, R. C., Raj, N., and Mi, J. (2019). Deep solar radiation forecasting with convolutional neural network and long short-term memory network algorithms. Appl. Energy 253, 113541. doi:10.1016/j.apenergy.2019.113541
Gu, J., Yang, B., Brauer, M., and Zhang, K. M. (2021). Enhancing the evaluation and interpretability of data-driven air quality models. Atmos. Environ. 246, 118125. doi:10.1016/j.atmosenv.2020.118125
Guo, Y., and Mao, Z. (2023). Long-term prediction model for nox emission based on lstm–transformer. Electronics 12, 3929. doi:10.3390/electronics12183929
Han, J., Lin, H., and Qin, Z. (2023). Prediction and comparison of in-vehicle co2 concentration based on arima and lstm models. Appl. Sci. 13, 10858. doi:10.3390/app131910858
Haq, M. A., and Ahmad Khan, R. (2022). Smotednn: a novel model for air pollution forecasting and aqi classification. Comput. Mater. & Continua 71, 1403–1425. doi:10.32604/cmc.2022.021968
He, J., Gong, S., Yu, Y., Yu, L., Wu, L., Mao, H., et al. (2017). Air pollution characteristics and their relation to meteorological conditions during 2014–2015 in major Chinese cities. Environ. Pollut. 223, 484–496. doi:10.1016/j.envpol.2017.01.050
Hofman, J., Do, T. H., Qin, X., Bonet, E. R., Philips, W., Deligiannis, N., et al. (2022). Spatiotemporal air quality inference of low-cost sensor data: evidence from multiple sensor testbeds. Environ. Model. & Softw. 149, 105306. doi:10.1016/j.envsoft.2022.105306
Hua, Y., Zhao, Z., Li, R., Chen, X., Liu, Z., and Zhang, H. (2019). Deep learning with long short-term memory for time series prediction. IEEE Commun. Mag. 57, 114–119. doi:10.1109/mcom.2019.1800155
Kang, G. K., Gao, J. Z., Chiao, S., Lu, S., and Xie, G. (2018). Air quality prediction: big data and machine learning approaches. Int. J. Environ. Sci. Dev. 9, 8–16. doi:10.18178/ijesd.2018.9.1.1066
Kim, M. K., Cremers, B., Liu, J., Zhang, J., and Wang, J. (2022). Prediction and correlation analysis of ventilation performance in a residential building using artificial neural network models based on data-driven analysis. Sustain. Cities Soc. 83, 103981. doi:10.1016/j.scs.2022.103981
Kingma, D. P., and Ba, J. (2015). Adam: a method for stochastic optimization 3rd international conference on learning representations, in ICLR 2015-Conference Track Proceedings, 1.
Kitaev, N., Kaiser, Ł., and Levskaya, A. (2020). Reformer: the efficient transformer. arXiv preprint arXiv:2001.04451.
Ko, K. K., and Jung, E. S. (2022). Improving air pollution prediction system through multimodal deep learning model optimization. Appl. Sci. 12, 10405. doi:10.3390/app122010405
Kshirsagar, A., and Shah, M. (2022). Anatomization of air quality prediction using neural networks, regression and hybrid models. J. Clean. Prod. 369, 133383. doi:10.1016/j.jclepro.2022.133383
Liu, H., and Yang, R. (2021). A spatial multi-resolution multi-objective data-driven ensemble model for multi-step air quality index forecasting based on real-time decomposition. Comput. Industry 125, 103387. doi:10.1016/j.compind.2020.103387
Liu, S., Yu, H., Liao, C., Li, J., Lin, W., Liu, A. X., et al. (2022). Pyraformer: low-complexity pyramidal attention for long-range time series modeling and forecasting. ICLR.
Lu, D., Mao, W., Xiao, W., and Zhang, L. (2021). Non-linear response of pm2. 5 pollution to land use change in China. Remote Sens. 13, 1612. doi:10.3390/rs13091612
Luo, H., Han, Y., Cheng, X., Lu, C., and Wu, Y. (2020). Spatiotemporal variations in particulate matter and air quality over China: National, regional and urban scales. Atmosphere 12, 43. doi:10.3390/atmos12010043
Ma, X., Chen, T., Ge, R., Xv, F., Cui, C., and Li, J. (2023a). Prediction of pm2. 5 concentration using spatiotemporal data with machine learning models. Atmosphere 14, 1517. doi:10.3390/atmos14101517
Ma, Z., Luo, W., Jiang, J., Wang, B., Ma, Z., Lin, J., et al. (2023b). Spatial and temporal characteristics analysis and prediction model of pm2. 5 concentration based on spatiotemporal-informer model. Plos one 18, e0287423. doi:10.1371/journal.pone.0287423
Markidis, S., Der Chien, S. W., Laure, E., Peng, I. B., and Vetter, J. S. (2018). Nvidia tensor core programmability, performance & precision, in 2018 IEEE international parallel and distributed processing symposium workshops (IPDPSW) (IEEE), 522–531.
Marvin, D., Nespoli, L., Strepparava, D., and Medici, V. (2022). A data-driven approach to forecasting ground-level ozone concentration. Int. J. Forecast. 38, 970–987. doi:10.1016/j.ijforecast.2021.07.008
Méndez, M., Merayo, M. G., and Núñez, M. (2023). Machine learning algorithms to forecast air quality: a survey. Artif. Intell. Rev. 56, 10031–10066. doi:10.1007/s10462-023-10424-4
Neiburger, M. (1969). The role of meteorology in the study and control of air pollution. Bull. Am. Meteorological Soc. 50, 957–966. doi:10.1175/1520-0477-50.12.957
Ozcanli, A. K., Yaprakdal, F., and Baysal, M. (2020). Deep learning methods and applications for electrical power systems: a comprehensive review. Int. J. Energy Res. 44, 7136–7157. doi:10.1002/er.5331
Pan, Q., Harrou, F., and Sun, Y. (2023). A comparison of machine learning methods for ozone pollution prediction. J. Big Data 10, 63. doi:10.1186/s40537-023-00748-x
Panneerselvam, V., and Thiagarajan, R. (2024). Toward accurate multi-region air quality prediction: integrating transformer-based deep learning and crossover boosted dynamic arithmetic optimization (cdao). Signal Image Video Process 18, 4145–4156. doi:10.1007/s11760-024-03061-z
Paszke, A., Gross, S., Massa, F., Lerer, A., Bradbury, J., Chanan, G., et al. (2019). Pytorch: an imperative style, high-performance deep learning library. Adv. neural Inf. Process. Syst. 32. doi:10.48550/arxiv.1912.01703
Pöschl, U. (2005). Atmospheric aerosols: composition, transformation, climate and health effects. Angew. Chem. Int. Ed. 44, 7520–7540. doi:10.1002/anie.200501122
Rakholia, R., Le, Q., Vu, K., Ho, B. Q., and Carbajo, R. S. (2024). Accurate pm2. 5 urban air pollution forecasting using multivariate ensemble learning accounting for evolving target distributions. Chemosphere 364, 143097. doi:10.1016/j.chemosphere.2024.143097
Rybarczyk, Y., and Zalakeviciute, R. (2018). Machine learning approaches for outdoor air quality modelling: a systematic review. Appl. Sci. 8, 2570. doi:10.3390/app8122570
Sarkar, N., Gupta, R., Keserwani, P. K., and Govil, M. C. (2022). Air quality index prediction using an effective hybrid deep learning model. Environ. Pollut. 315, 120404. doi:10.1016/j.envpol.2022.120404
Tagliabue, L. C., Cecconi, F. R., Rinaldi, S., and Ciribini, A. L. C. (2021). Data driven indoor air quality prediction in educational facilities based on iot network. Energy Build. 236, 110782. doi:10.1016/j.enbuild.2021.110782
Thongthammachart, T., Araki, S., Shimadera, H., Eto, S., Matsuo, T., and Kondo, A. (2021). An integrated model combining random forests and wrf/cmaq model for high accuracy spatiotemporal pm2. 5 predictions in the kansai region of Japan. Atmos. Environ. 262, 118620. doi:10.1016/j.atmosenv.2021.118620
Wang, X., Ahmad, I., Javeed, D., Zaidi, S. A., Alotaibi, F. M., Ghoneim, M. E., et al. (2022). Intelligent hybrid deep learning model for breast cancer detection. Electronics 11, 2767. doi:10.3390/electronics11172767
Wang, Y., Wang, H., and Zhang, S. (2020). Prediction of daily pm2. 5 concentration in China using data-driven ordinary differential equations. Appl. Math. Comput. 375, 125088. doi:10.1016/j.amc.2020.125088
Wu, H., Xu, J., Wang, J., and Long, M. (2021). Autoformer: decomposition transformers with auto-correlation for long-term series forecasting. Adv. neural Inf. Process. Syst. 34, 22419–22430. doi:10.48550/arxiv.2106.13008
Yu, S., Peng, J., Ge, Y., Yu, X., Ding, F., Li, S., et al. (2024). A traffic state prediction method based on spatial–temporal data mining of floating car data by using autoformer architecture. Computer-Aided Civ. Infrastructure Eng. 39, 2774–2787. doi:10.1111/mice.13179
Yuan, Q., Shen, H., Li, T., Li, Z., Li, S., Jiang, Y., et al. (2020). Deep learning in environmental remote sensing: Achievements and challenges. Remote Sens. Environ. 241, 111716. doi:10.1016/j.rse.2020.111716
Zaini, N., Ean, L. W., Ahmed, A. N., and Malek, M. A. (2022). A systematic literature review of deep learning neural network for time series air quality forecasting. Environ. Sci. Pollut. Res. 29, 4958–4990. doi:10.1007/s11356-021-17442-1
Zeng, Q., Wang, L., Zhu, S., Gao, Y., Qiu, X., and Chen, L. (2023). Long-term pm2. 5 concentrations forecasting using ceemdan and deep transformer neural network. Atmos. Pollut. Res. 14, 101839. doi:10.1016/j.apr.2023.101839
Zhang, Z., and Zhang, S. (2023). Modeling air quality pm2. 5 forecasting using deep sparse attention-based transformer networks. Int. J. Environ. Sci. Technol. 20, 13535–13550. doi:10.1007/s13762-023-04900-1
Zhou, H., Zhang, S., Peng, J., Zhang, S., Li, J., Xiong, H., et al. (2021). Informer: beyond efficient transformer for long sequence time-series forecasting. Proc. AAAI Conf. Artif. Intell. 35, 11106–11115. doi:10.1609/aaai.v35i12.17325
Zhou, T., Ma, Z., Wen, Q., Sun, L., Yao, T., Yin, W., et al. (2022a). Film: frequency improved legendre memory model for long-term time series forecasting. Adv. neural Inf. Process. Syst. 35, 12677–12690. doi:10.48550/arxiv.2205.08897
Zhou, T., Ma, Z., Wen, Q., Wang, X., Sun, L., and Jin, R. (2022b). Fedformer: frequency enhanced decomposed transformer for long-term series forecasting, in International conference on machine learning (PMLR), 27268–27286.
Keywords: frequency, time series forecasting, air pollution, transformer, sparse attention mechanism
Citation: Qin Z, Wei B, Gao C, Chen X, Zhang H and In Wong CU (2025) SFDformer: a frequency-based sparse decomposition transformer for air pollution time series prediction. Front. Environ. Sci. 13:1549209. doi: 10.3389/fenvs.2025.1549209
Received: 24 December 2024; Accepted: 13 February 2025;
Published: 17 March 2025.
Edited by:
Chen Siyu, Lanzhou University, ChinaReviewed by:
Chunsong Lu, Nanjing University of Information Science and Technology, ChinaCopyright © 2025 Qin, Wei, Gao, Chen, Zhang and In Wong. This is an open-access article distributed under the terms of the Creative Commons Attribution License (CC BY). The use, distribution or reproduction in other forums is permitted, provided the original author(s) and the copyright owner(s) are credited and that the original publication in this journal is cited, in accordance with accepted academic practice. No use, distribution or reproduction is permitted which does not comply with these terms.
*Correspondence: Xiaolong Chen, Y2hlbl94aWFvbG9uZzEyM0AxMjYuY29t; Hongfeng Zhang, aGZlbmd6aGFuZ0BtcHUuZWR1Lm1v
†ORCID: Zhenkai Qin, orcid.org/0009-0002-8862-2439
Disclaimer: All claims expressed in this article are solely those of the authors and do not necessarily represent those of their affiliated organizations, or those of the publisher, the editors and the reviewers. Any product that may be evaluated in this article or claim that may be made by its manufacturer is not guaranteed or endorsed by the publisher.
Research integrity at Frontiers
Learn more about the work of our research integrity team to safeguard the quality of each article we publish.