 Zhang Lu
95% of researchers rate our articles as excellent or good
Learn more about the work of our research integrity team to safeguard the quality of each article we publish.
Find out more
ORIGINAL RESEARCH article
Front. Environ. Sci. , 10 March 2025
Sec. Environmental Informatics and Remote Sensing
Volume 13 - 2025 | https://doi.org/10.3389/fenvs.2025.1547530
This article is part of the Research Topic Climatic and Associated Cryospheric and Hydrospheric Changes on the Third Pole, Volume III View all articles
Introduction: The interplay between cutture and environment in the Third Pole Region holds profound implications for the region's socio-ecological resilience and long-term sustainability. However, existing research has largely relied onisolated analyses, often constrained by the absence of integrative frameworks capable of capturing the dynamic and interdependent nature of cultural and environmental systems. These conventional approaches frequently overlook the spatial-temporal complexity, synergistic relationships, and feedback mechanisms intrinsic to this interplay, thereby limiting their predictive accuracy and adaptability in addressing emerging challenges.
Methods: To bridge these gaps, we propose the Dynamic Cultural-Environmental Interaction Network (DCEN), a novel computational framework that integrates cultural metrics and environmental variables within a graph-based, multidimensional model. This approach systematically captures bidirectional interactions through coupled nonlinear equations, incorporating spatial and temporal dynamics while accounting for external stimuli and abrupt perturbations. Furthermore, we introduce the Adaptive Interaction Strategy for Cuttural-Environmental Systems (AIS-CES), which enables real-tme optimization of model parameters based on system feedback, ensuring stability, adaptability, and enhanced resilience.
Results: Experimental validation demonstrates that the proposed framework effectively simulates complex cultural-environmental interactions with high predictive accuracy, providing a robust foundation for policymaking, adaptive management, and disaster mitigation in the Third Pole Region.
Discussion: By addressing critical limitations in existng methodologies, this research advances a more holistic and actionable understanding of cultural-environmental dynamics, fostering regional sustainability and socio-ecological harmony.
The Third Pole region, encompassing the Himalayas and surrounding areas, plays a critical role in global climate regulation, ecological balance, and cultural diversity (Isensee et al., 2020). Its unique topography and climatic conditions not only influence local ecosystems but also sustain ancient cultural traditions deeply intertwined with the environment (Cao et al., 2021). Studying the interaction between culture and the environment in this region is vital for understanding how climate change, urbanization, and socio-economic shifts impact these delicate balances (Minaee et al., 2020). Traditional field-based studies are not only labor-intensive but also often restricted by the remoteness and harshness of the region (Cheng et al., 2021). Remote sensing technology offers a transformative solution by enabling large-scale, continuous monitoring of environmental and cultural patterns (Hatamizadeh et al., 2021). It not only facilitates the collection of high-resolution spatial and temporal data but also supports the integration of diverse datasets, offering deeper insights into the dynamic interactions between human societies and their environment in this fragile region.
To address the limitations of earlier methods, researchers initially relied on traditional symbolic AI and knowledge-based systems to study cultural and environmental interactions (Xu et al., 2023). These approaches focused on creating rule-based models that incorporated expert knowledge to analyze cultural and ecological phenomena (Huang et al., 2020). For example, early systems used symbolic representations to map historical land-use patterns or trace changes in sacred landscapes (Valanarasu and Patel, 2022). While these methods offered interpretable insights and highlighted the role of specific cultural practices in shaping the environment, they were constrained by their reliance on predefined rules and static datasets (Yu et al., 2023). The lack of scalability and adaptability to emerging complexities limited their effectiveness in capturing the dynamic and multi-dimensional nature of the Third Pole’s cultural-environmental interactions (Valanarasu et al., 2021).
The advent of data-driven approaches and machine learning marked a significant shift in remote sensing applications for this research area (Zhang Y. et al., 2021). Data-driven methods leveraged large-scale geospatial datasets to uncover patterns and correlations without explicit rule-based programming (Xie et al., 2021). Machine learning algorithms enabled automated classification of land use, detection of environmental changes, and identification of anthropogenic impacts on cultural sites (Wang et al., 2021). For instance, support vector machines and random forests were commonly employed to analyze satellite imagery, allowing researchers to detect subtle cultural markers such as terraced farming or sacred groves (Ghiasi et al., 2021). Despite these advancements, the dependency on labeled datasets and the difficulty of interpreting machine learning models posed challenges (Jain et al., 2022). Furthermore, these approaches often struggled to incorporate the rich contextual and temporal nuances necessary for understanding the interplay between culture and the environment.
The emergence of deep learning and pre-trained models revolutionized the field by offering unparalleled capabilities in feature extraction and pattern recognition (Müller et al., 2022). Neural networks, particularly convolutional neural networks (CNNs), excelled at processing high-resolution remote sensing imagery to identify intricate cultural and environmental features (Yin et al., 2022). Pre-trained models, such as those based on transfer learning, facilitated the integration of multispectral and temporal data, enabling robust analysis of complex phenomena like cultural heritage conservation amidst climate change (Wu et al., 2022). These methods also supported the development of multi-modal frameworks that combined remote sensing with ethnographic and historical data (Zhang W. et al., 2021). However, deep learning models often suffered from high computational costs and limited interpretability, necessitating efforts to balance accuracy with transparency (Malhotra et al., 2022). The lack of generalized datasets tailored to the Third Pole’s unique characteristics also highlighted the need for more customized solutions.
Based on the aforementioned limitations, this study proposes a novel framework that integrates the strengths of deep learning with domain-specific cultural and environmental knowledge to overcome existing gaps. Our approach combines pre-trained neural networks with tailored data augmentation techniques to capture the diverse and dynamic nature of the Third Pole region. by incorporating hybrid models that merge statistical and rule-based systems, we address the challenges of interpretability and context-awareness. This method not only enhances the scalability of remote sensing applications but also ensures that cultural insights are preserved in the analysis.
Remote sensing technologies have increasingly been utilized to analyze cultural landscapes, enabling the study of human-environment interactions at a regional scale (Jha et al., 2020). In the Third Pole region, cultural landscapes are heavily influenced by environmental conditions, traditional practices, and socio-economic dynamics (Luo et al., 2020). By employing high-resolution satellite imagery and geospatial analysis, researchers can identify patterns of settlement distribution, agricultural practices, and infrastructure development that reflect the adaptation of human populations to the unique environmental conditions of this area (Lüddecke and Ecker, 2021). For example, spectral indices such as the Normalized Difference Vegetation Index (NDVI) allow for the mapping of cultivated lands and pasturelands, providing insights into traditional subsistence strategies (Wang et al., 2024). The integration of temporal remote sensing data further supports the monitoring of changes in cultural landscapes over time, such as shifts in land use driven by climate change, policy interventions, or economic development (Wang et al., 2023). Beyond physical mapping, remote sensing supports the identification of intangible cultural features by assessing proxies such as the spatial arrangement of religious sites, traditional architecture, and sacred natural sites. Multispectral and hyperspectral imaging techniques reveal the material composition of historical and cultural structures, enabling conservation and heritage management. Combined with ground-truthing and ethnographic studies, remote sensing data contribute to a holistic understanding of how cultural landscapes are shaped and maintained in response to environmental dynamics. As the Third Pole faces increasing pressures from climate change and modernization, remote sensing provides a crucial tool for documenting and preserving the cultural heritage embedded in its landscapes.
Remote sensing is a powerful tool for studying environmental changes and their impact on cultural systems, especially in the Third Pole region, where rapid environmental transformations are occurring (Chaitanya et al., 2020). Glacier retreat, permafrost thaw, and alterations in hydrological systems are key environmental changes that significantly affect human livelihoods and cultural practices (Atigh et al., 2022). Satellite-based remote sensing, including data from Landsat, Sentinel, and MODIS platforms, enables the detection and quantification of these changes with high temporal and spatial resolution (Chen et al., 2020). For instance, glacier monitoring using Synthetic Aperture Radar (SAR) and optical imagery has revealed significant ice loss in the Himalayas, directly impacting water availability for downstream communities (Wang et al., 2022). The implications of such environmental changes on cultural adaptation can be examined through remote sensing by linking ecological variables with human activities (Jiang et al., 2024). For example, remote sensing of vegetation cover can illustrate the resilience or vulnerability of traditional pastoral systems to climatic stressors. Changes in river dynamics, detectable through remote sensing, reveal the effects on irrigation-dependent agricultural practices that are central to local cultures. Remote sensing also supports the study of disaster impacts on cultural systems, such as landslides or floods, providing data critical for understanding recovery processes and long-term adaptations. By integrating remote sensing with socio-cultural data, researchers gain insights into how communities in the Third Pole adapt their cultural practices in response to environmental challenges.
Sacred natural sites, often associated with religious and cultural significance, serve as critical nodes of cultural-environmental interaction in the Third Pole region (Ouyang et al., 2020). Remote sensing technologies provide an effective means to study these sites, their environmental settings, and the surrounding landscapes (Gao et al., 2021). High-resolution imagery and LiDAR data are particularly useful for delineating sacred sites and analyzing their spatial relationships with ecological features such as water bodies, forests, and mountain peaks (Lin et al., 2021). These analyses reveal how sacred natural sites are integrated into broader cultural and ecological systems, reflecting traditional beliefs about the environment (Liu et al., 2021). Remote sensing also facilitates the monitoring of environmental conditions around sacred natural sites, supporting conservation efforts and understanding human impacts (Liu et al., 2024). For example, changes in vegetation health around sacred groves or water quality in sacred rivers can be detected using multispectral and hyperspectral sensors (Arosio et al., 2024). Such data provide empirical evidence for evaluating the effectiveness of traditional conservation practices associated with these sites. Furthermore, remote sensing can uncover the threats posed by anthropogenic activities, such as urban expansion, tourism, and resource extraction, to the integrity of sacred natural landscapes. By bridging cultural and environmental studies, remote sensing offers a framework for assessing the role of sacred sites in sustainable environmental management. Combining remote sensing data with participatory mapping and community engagement enhances the understanding of local knowledge systems and their alignment with ecological conservation goals. In the context of the Third Pole, where sacred natural sites often intersect with biodiversity hotspots, remote sensing serves as a critical tool for promoting culturally sensitive environmental stewardship.
The intricate interplay between culture and environment has been a focal point across diverse disciplines, ranging from anthropology to computational modeling. This section explores how these factors coalesce to influence the studied phenomenon. The goal is to systematically decompose the complexities into comprehensible frameworks, paving the way for a nuanced understanding. In preliminaries, we formalize the research problem, contextualizing culture and environment as intertwined systems. This involves defining key variables, structural relationships, and underlying principles that anchor our analysis. The approach synthesizes theoretical models and empirical observations, aiming to articulate the multifaceted dynamics precisely.
The next focus is on the novel model we propose, described in Dynamic Cultural-Environmental Interaction Network (DCEN). The model innovatively integrates cultural metrics and environmental variables into a coherent computational framework. By leveraging advanced techniques, it extends existing paradigms, offering greater adaptability and predictive accuracy. The structural details and theoretical underpinnings of this model are elucidated to highlight its contributions to the field. in Adaptive Interaction Strategy for Cultural-Environmental Systems (AIS-CES), we delve into the strategic methodologies enabling the application of the model. This includes the design principles guiding its deployment, mechanisms addressing real-world challenges, and the theoretical rigor behind these solutions. Emphasis is placed on bridging the gap between theoretical formulation and practical execution, demonstrating the utility of the proposed framework in diverse scenarios.
To explore the interaction between culture and environment, this section formalizes the research problem and establishes the mathematical notations and theoretical foundation necessary for subsequent analysis. We focus on characterizing culture and environment as dynamic systems with interdependent variables. By defining these elements symbolically, we aim to construct a unified framework conducive to both qualitative and quantitative exploration.
Let
The interaction between
where
To decompose this relationship, we define conditional dependencies using probabilistic frameworks. Let
allowing us to examine how environmental conditions influence cultural configurations.
A critical aspect of this study involves modeling temporal evolution. We define the time-dependent state of the system as
where
Moreover, cultural traits often diffuse spatially and temporally. This process is described by a partial differential equation Formula 4:
where
Environmental influences are similarly expressed via spatially-dependent variables Formula 5:
with
For analytical tractability, we linearize
where
To address the intricate relationship between culture and environment, we propose the Dynamic Cultural-Environmental Interaction Network (DCEN). This model captures the bidirectional interactions between cultural systems and environmental dynamics, employing a graph-structured framework that integrates temporal and spatial dimensions (As shown in Figure 1).
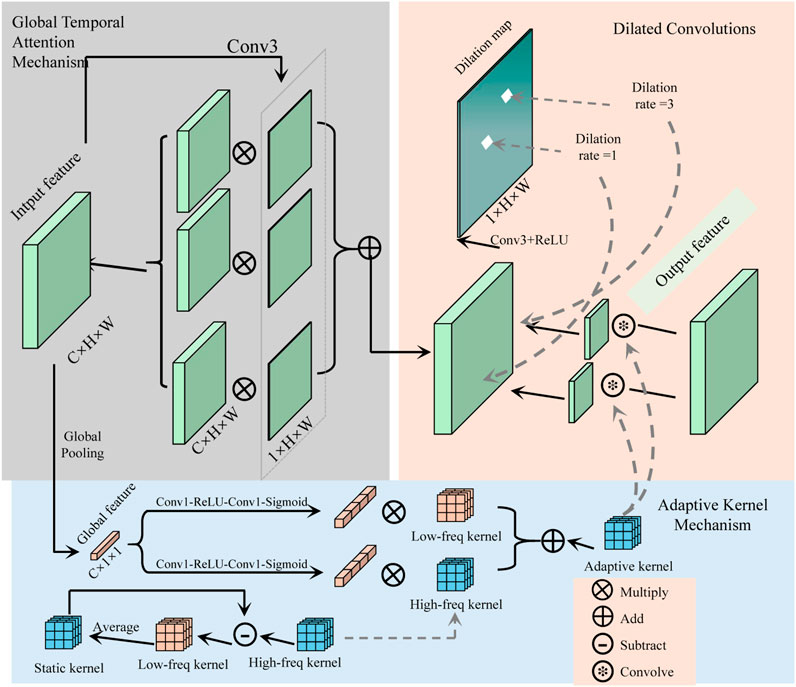
Figure 1. Diagram illustrating the Dynamic Cultural-Environmental Interaction Network (DCEN), showcasing bidirectional interactions between cultural and environmental systems. The framework employs a graph-structured approach with cultural and environmental networks represented by nodes and edges, capturing intra- and inter-system dynamics. Key components include temporal evolution equations, cross-system feedback mechanisms, adaptive influence weights, and stability analysis via Jacobian matrix eigenvalues. This architecture models the complex interplay between culture and environment, enabling dynamic adjustments and resilience under external stimuli.
The cultural and environmental systems are conceptualized as two interconnected networks, denoted by
The dynamics of cultural attributes in
where
Similarly, the dynamics of environmental attributes in
where
The interdependence between the cultural and environmental networks is captured by a bipartite graph
where
To ensure a flexible representation of cross-system dependencies, the bipartite graph
where
To analyze the overall system dynamics, the state of the combined network is represented as
where
Stability analysis of
The eigenvalues of
The interactions between the cultural system
where
where
where
where
where
where
is used to evaluate the stability of equilibrium points. The eigenvalues of
We model the temporal evolution of the system state
where
The Jacobian matrix
where
To study how the system evolves under perturbations, we consider the eigenvalues
where
For external stimuli,
where
The interaction between cultural and environmental systems is further influenced by cross-system feedback. The interdependencies are modeled by the terms Formula 25:
where
where
To ensure adaptability, the system incorporates time-varying parameters, allowing it to respond dynamically to evolving conditions. The parameters evolve as Formula 27:
where
The temporal evolution of stability can be tracked by the largest eigenvalue
These adjustments may involve modifying external stimuli
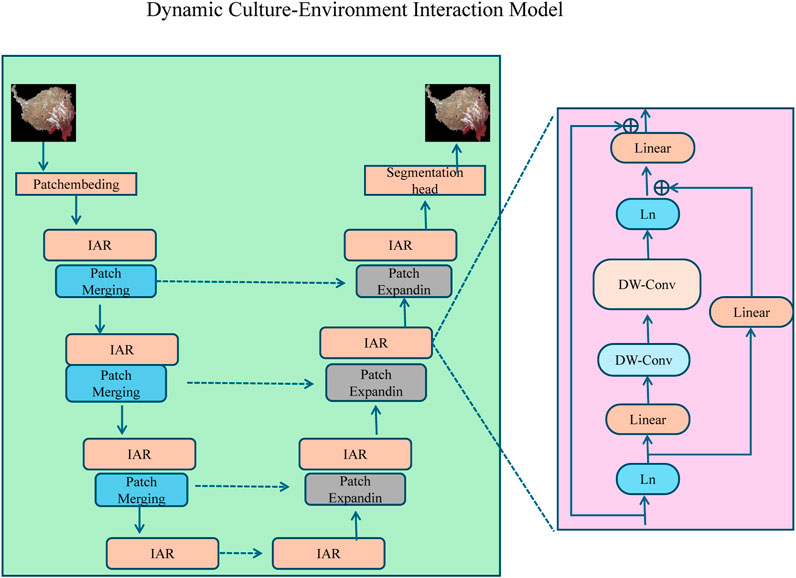
Figure 2. Diagram illustrating the Integrated State-Space and Stability Analysis framework, which models the temporal evolution of cultural and environmental systems using a combined state-space representation. The process involves patch embedding, merging, and expansion, supported by Iterative Attention Refinement (IAR) modules for dynamic feature processing. The system incorporates a Jacobian matrix for stability analysis, enabling the evaluation of eigenvalues to ensure resilience and adaptability in response to external stimuli or perturbations.
To leverage the Dynamic Cultural-Environmental Interaction Network (DCEN), we introduce the Adaptive Interaction Strategy for Cultural-Environmental Systems (AIS-CES). This strategy aims to enhance the model’s capacity to resolve domain-specific challenges by dynamically tailoring interaction mechanisms based on observed patterns and emergent phenomena (As shown in Figure 3).
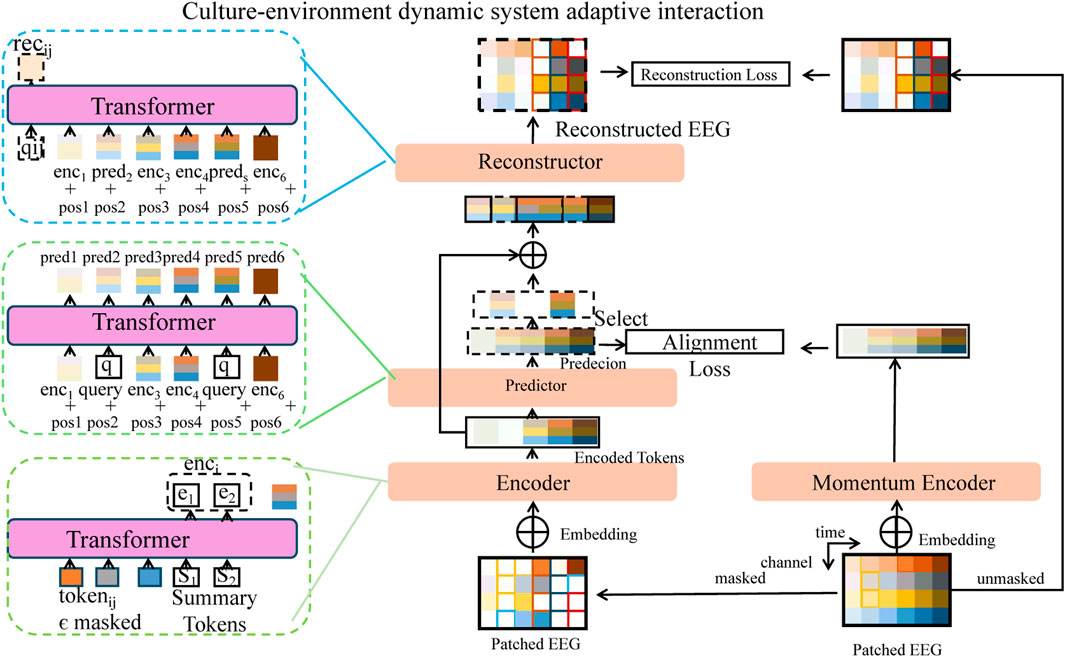
Figure 3. An intricate diagram depicting the Adaptive Interaction Strategy for Cultural-Environmental Systems (AIS-CES). The framework integrates multiple components, including transformers for encoding and reconstructing inputs, reconstructor modules for EEG signal reconstruction, and momentum encoders for embedding and alignment. Dynamic feedback loops, loss functions, and weight optimization mechanisms are emphasized to demonstrate the interplay between cultural and environmental dynamics. The illustration highlights processes such as alignment loss minimization, coherence constraints, and adaptive interactions for stability, resilience, and system-wide optimization in a multi-scale cultural-environmental network.
The interplay between culture and environment often involves complex feedback loops, nonlinear interactions, and emergent behaviors, which require dynamic adaptation to maintain system stability and functionality. In the proposed AIS-CES framework, the interaction parameters, specifically the influence weights
where
The loss function
where
To ensure stability, the eigenvalues
where
The system also incorporates mechanisms to adaptively reallocate interaction weights in response to abrupt changes or external stimuli. The rate of reallocation is driven by a gradient-descent approach to minimize a local imbalance function
where
To improve global alignment of the network, a coherence constraint is introduced to minimize disparities between subsystems. This constraint is expressed as Formula 33:
where
The temporal evolution of the weights can also be influenced by external factors, such as policy interventions or shocks. These influences are incorporated through external stimuli
where
The optimization process iteratively refines the weights based on the convergence of the loss function
where
To maintain stability under varying conditions, AIS-CES actively monitors the spectral properties of the Jacobian matrix
where
The eigenvalues
where
To further enhance stability, AIS-CES introduces damping terms into the system dynamics. The damping term for a cultural node
where
where
AIS-CES also incorporates external stimuli through the functions
where
To allocate stimuli effectively, the spatial distribution of
where
The temporal evolution of the risk function
where
To ensure stability across the entire system, AIS-CES implements a global coherence constraint, which aligns the cultural and environmental dynamics. This is expressed as Formula 43:
where
In cases where external shocks destabilize the system, AIS-CES introduces corrective interventions by modifying the eigenvalue spectrum of the Jacobian matrix. This is achieved through targeted changes in the weight matrix Formula 44:
ensuring the system remains resilient under evolving conditions.
AIS-CES operates at both local and global scales to ensure that interventions are context-aware, targeted, and harmonized across the entire cultural-environmental network. Local interventions are applied to subsystems or nodes exhibiting instability or undesirable behaviors, dynamically adjusting interaction weights and stimuli to restore stability. Simultaneously, global coherence is maintained by enforcing alignment between the dynamics of cultural and environmental systems through a global coherence constraint Formula 45:
where
At the local level, interventions are implemented by adjusting node-specific parameters such as interaction weights and external stimuli. The adjustment to a cultural node
where
For environmental nodes, a similar feedback mechanism is applied. The dynamic adjustment for a node
where
At the global scale, AIS-CES introduces constraints to align the overall dynamics of cultural and environmental systems, minimizing discrepancies between their aggregated states. The aggregated state vector
where
To optimize the distribution of external stimuli, AIS-CES dynamically solves a risk minimization problem Formula 49:
where
where
The iterative update of interaction weights
where
AIS-CES operates iteratively to refine system parameters and ensure coherence. The iterative steps include Formula 52:
where
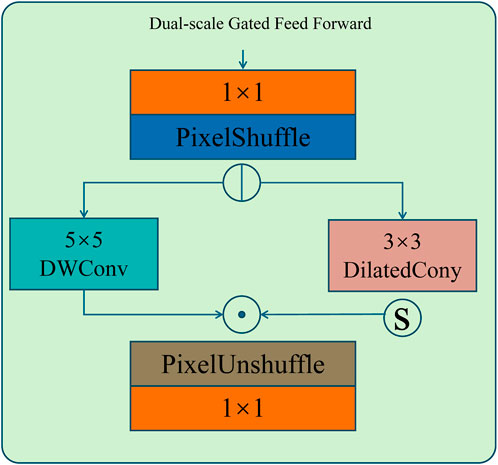
Figure 4. Diagram showcasing the Multiscale and Iterative Adaptation for Coherent Interventions, illustrating a dual-scale gated feed-forward architecture. The module leverages PixelShuffle and PixelUnshuffle for multiscale feature transformation, along with
The ICIMOD Regional Dataset (Khatiwada et al., 2024) provides extensive coverage of the Hindu Kush Himalayan region, incorporating high-resolution satellite imagery and detailed geographic data for monitoring environmental changes, land cover, and socio-economic factors. This dataset supports diverse applications such as climate change studies and disaster management with its rich multi-temporal and multi-sensor imagery. The Landsat Dataset (Ranjan et al., 2022) offers a decades-long record of earth observations, including spectral bands from visible to thermal wavelengths. Its multi-decade coverage enables the analysis of long-term environmental trends, land use changes, and ecosystem dynamics. The dataset’s high spatial resolution facilitates precise mapping and monitoring of surface features and vegetation health across the globe. The OpenSentinelMap Dataset (Broni-Bediako et al., 2024) aggregates imagery from Sentinel-1 and Sentinel-2 satellites, focusing on wide-scale monitoring of agricultural, forest, and urban areas. This dataset is especially valuable for environmental researchers due to its combination of radar and optical data. It offers continuous updates and high-resolution information, enabling the detection of subtle temporal changes and supporting real-time environmental assessment. The CloudSEN12 Dataset (Aybar et al., 2024) is a cloud-rich dataset designed to advance remote sensing and machine learning research. It includes synthetic and real imagery, simulating various cloud cover conditions, essential for training robust algorithms. CloudSEN12 supports cloud masking, classification, and detection studies, bridging the gap between real-world challenges and algorithm development in remote sensing.
The experimental setup was designed to evaluate the effectiveness of the proposed method across multiple remote sensing datasets, ensuring comprehensive analysis under diverse conditions. All experiments were conducted on a high-performance computing cluster equipped with NVIDIA A100 GPUs, leveraging PyTorch 2.0 as the primary deep learning framework. The models were trained using an Adam optimizer with an initial learning rate of
Algorithm 1.Training Process for DCEN Network on Remote Sensing Datasets.
Input: Datasets
Hyperparameters:
Pretrained weights
Output: Trained model
Initialize: Learning rate
foreach
Split
Normalize
end
for
foreach batch
Forward Pass: Resize
Extract features using backbone network
Compute logits
Compute predictions
Compute Loss: Cross-entropy loss for classification:
Total loss:
Backward Pass: Compute gradients
end
end
Evaluate: foreach metric
Compute
Save
end
if Ablation studies enabled then
Repeat training process with variations:
end
return
The performance of the proposed method was evaluated against state-of-the-art (SOTA) models for the task of image segmentation on four datasets: ICIMOD Regional Dataset, Landsat Dataset, OpenSentinelMap Dataset, and CloudSEN12 Dataset. Tables 1, 2 present detailed comparisons of metrics, including Intersection over Union (IoU), Accuracy, Precision, and Recall. The results demonstrate the superiority of our approach across all datasets and metrics. For the ICIMOD Regional Dataset, our method achieved the highest IoU of
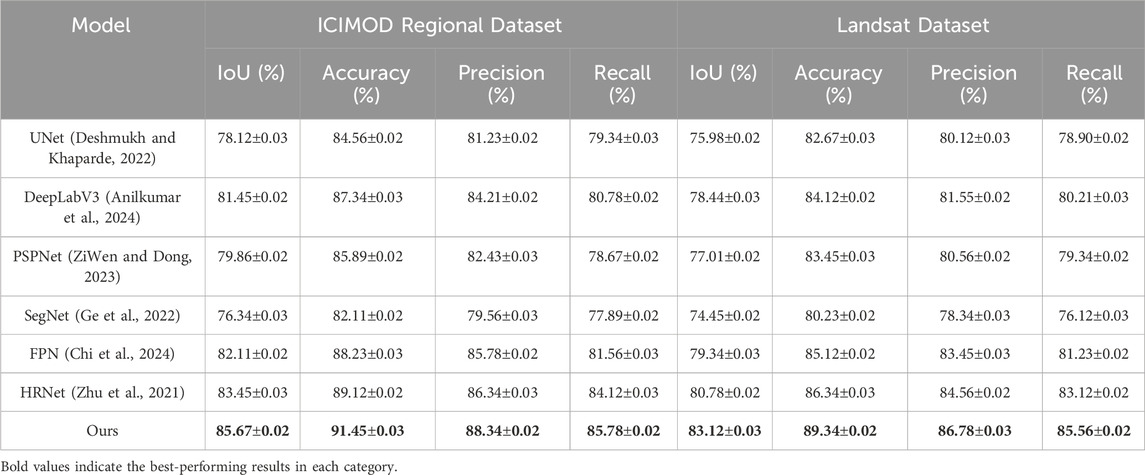
Table 1. Comparison of ours with SOTA methods on ICIMOD regional dataset and landsat dataset for image segmentation task.
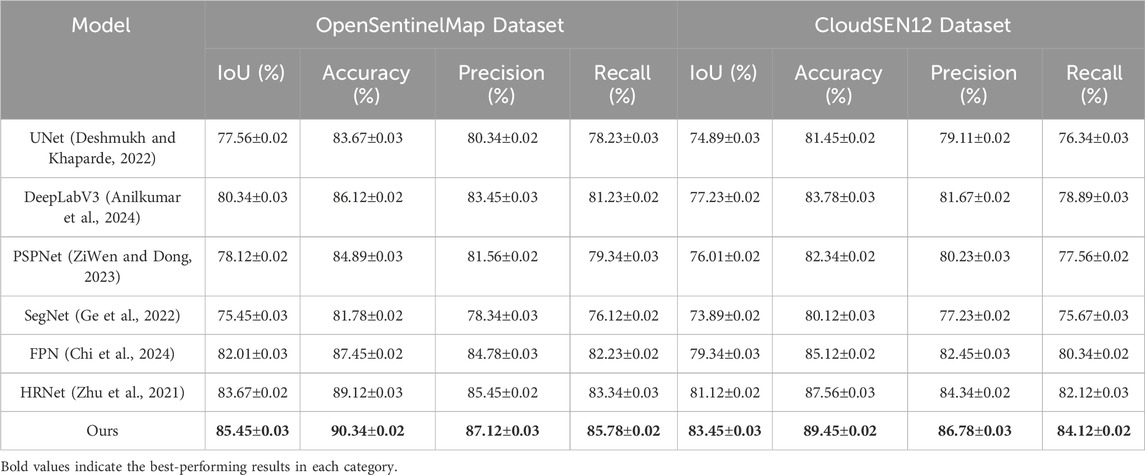
Table 2. Comparison of ours with SOTA methods on OpenSentinelMap dataset and CloudSEN12 dataset for image segmentation task.
In Figures 5, 6, On the OpenSentinelMap Dataset, our method continued to outperform other models, with an IoU of
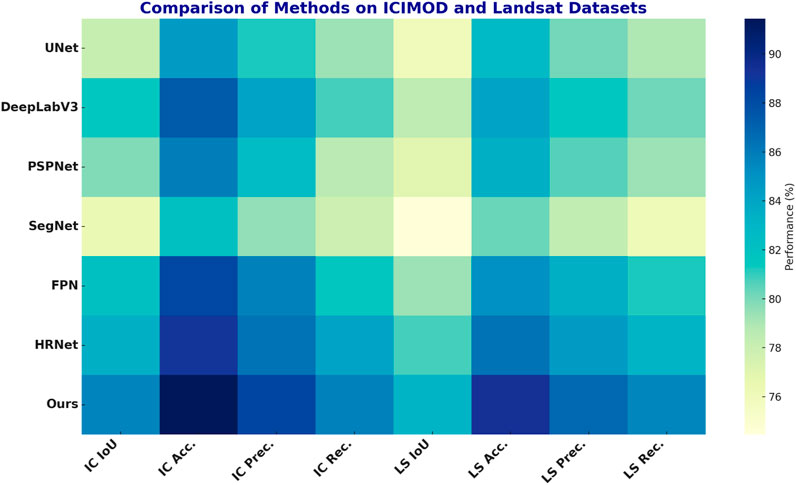
Figure 5. Performance comparison of SOTA methods on ICIMOD regional dataset and landsat dataset datasets.
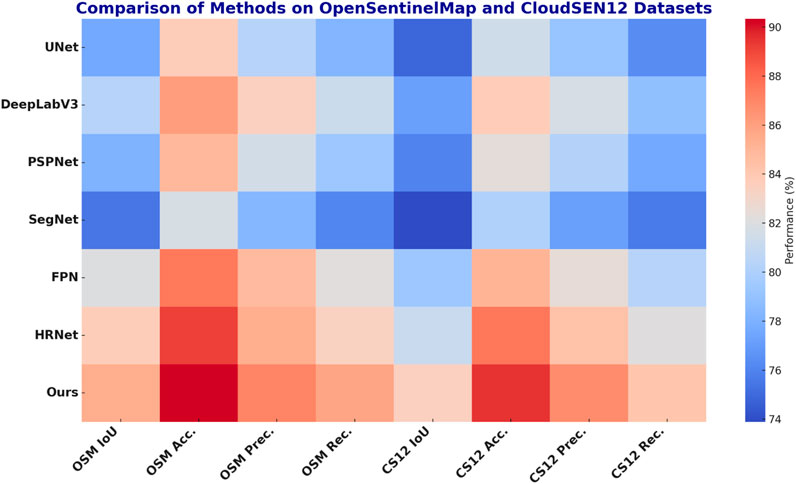
Figure 6. Performance comparison of SOTA methods on OpenSentinelMap dataset and CloudSEN12 dataset datasets.
To evaluate the contributions of individual modules within our proposed architecture, we conducted an ablation study on four datasets: ICIMOD Regional Dataset, Landsat Dataset, OpenSentinelMap Dataset, and CloudSEN12 Dataset. Tables 3, 4 present the results, demonstrating the impact of removing key components, denoted as Representation Systems, Coupled Nonlinear Dynamical, and Feedback-Driven Weights, on segmentation performance. The results clearly highlight the significant role each module plays in achieving optimal performance. For the ICIMOD Regional Dataset, removing Representation Systems resulted in a
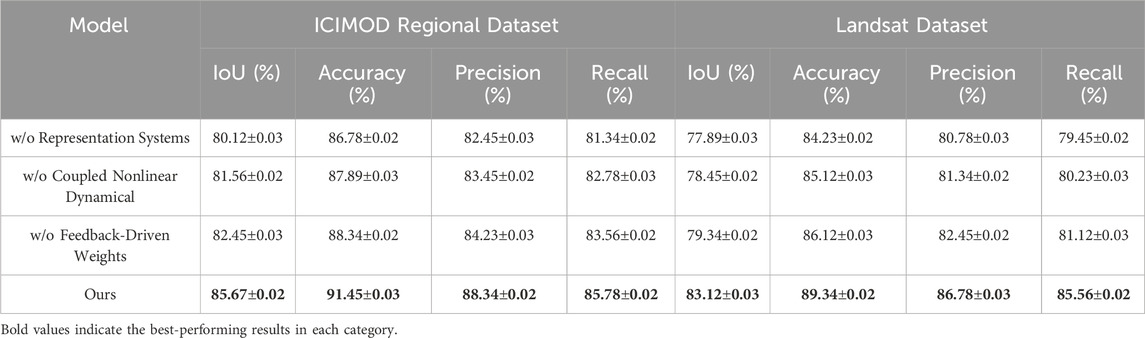
Table 3. Ablation study results on ICIMOD regional dataset and landsat dataset for image segmentation task.
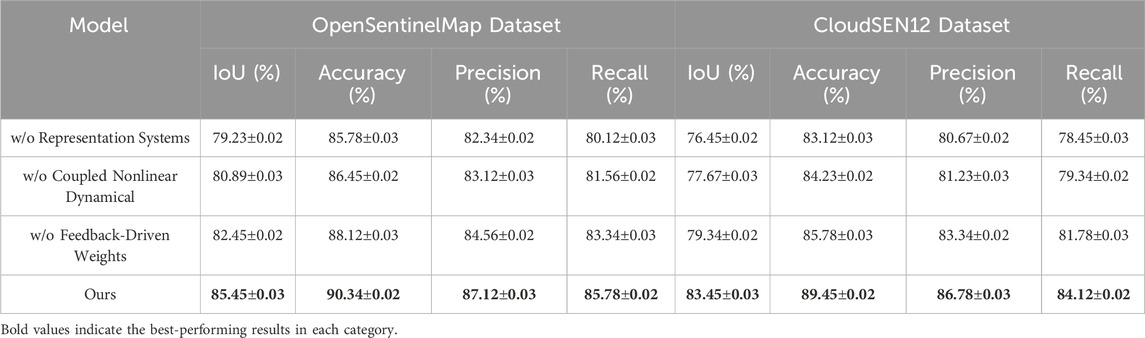
Table 4. Ablation study results on OpenSentinelMap dataset and CloudSEN12 dataset for image segmentation task.
In Figures 7, 8, On the OpenSentinelMap and CloudSEN12 Datasets, the impact of the modules remained consistent. Representation Systems significantly improved accuracy and recall by integrating global and local context. Coupled Nonlinear Dynamical enhanced robustness against noise and variability in input data, while Feedback-Driven Weights improved precision by refining boundary segmentation. The full model achieved the best results across all metrics, with IoU improvements of up to
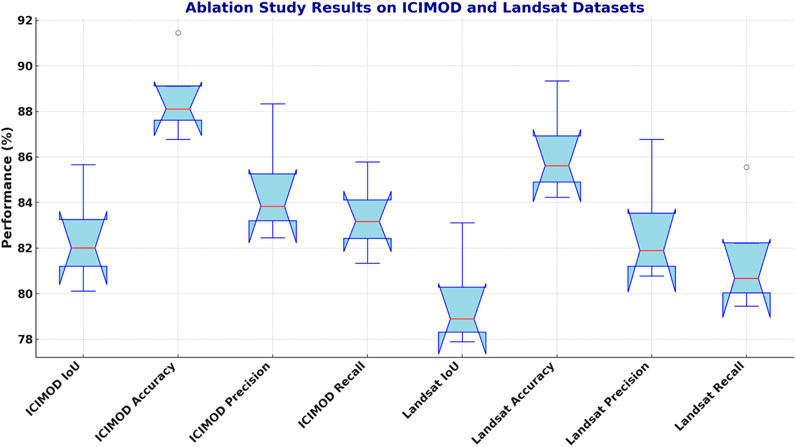
Figure 7. Ablation study of our method on ICIMOD regional dataset and landsat dataset datasets.
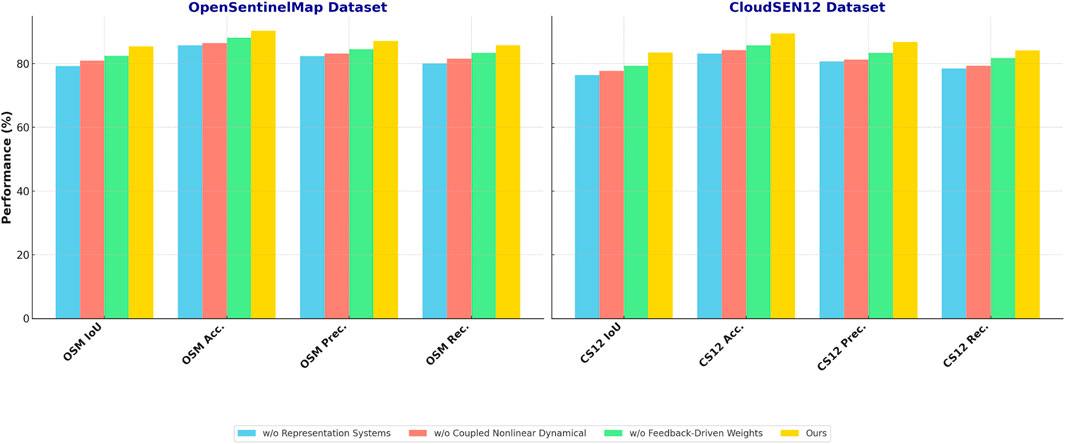
Figure 8. Ablation study of our method on OpenSentinelMap dataset and CloudSEN12 dataset datasets.
This study, while building on symbolic AI and knowledge-based systems, introduces significant advancements by integrating these traditional methods with modern computational frameworks to overcome existing limitations and provide new insights. Symbolic AI excels in rule-based representations and expert-driven modeling, but it often struggles to address the dynamic, nonlinear, and time-sensitive interactions inherent in complex cultural-environmental systems. By employing the Dynamic Cultural-Environmental Interaction Network (DCEN), we enable a multidimensional representation of these interactions, incorporating spatial-temporal dynamics and emergent properties. This capacity allows the model to simulate complex feedback mechanisms and predict the system’s response to abrupt changes, which are difficult to capture with traditional symbolic AI. This study introduces an adaptive optimization mechanism, the Adaptive Interaction Strategy for Cultural-Environmental Systems (AIS-CES), which dynamically adjusts the model’s parameters in response to real-time system feedback. This feature enhances the model’s adaptability to rapid environmental or cultural shifts, a capability that symbolic AI methods, constrained by fixed rules and static frameworks, lack. Furthermore, our approach integrates diverse datasets, including remote sensing imagery, environmental metrics, and cultural data, leveraging their synergies to derive holistic insights. The hybrid framework bridges the gap between data-driven approaches and knowledge-based systems, enabling a nuanced understanding of regional dynamics that transcends the limitations of conventional methods. Our framework also emphasizes practical applicability by linking theoretical models with actionable insights for policymaking and management strategies. While symbolic AI methods often require additional layers of interpretation to translate their outputs into real-world applications, our model directly generates robust, context-sensitive solutions for complex challenges in the Third Pole Region. These contributions collectively advance the field by addressing critical gaps in scalability, adaptability, and interpretability, providing a foundation for more effective analysis and decision-making in this unique and fragile socio-ecological system.
This study introduces several key innovations that extend beyond the typical applications of existing techniques in the region, addressing both methodological and practical limitations. While prior approaches have primarily relied on static or linear models, our work incorporates the Dynamic Cultural-Environmental Interaction Network (DCEN), which leverages graph-based structures and coupled nonlinear dynamical systems to capture the complex interdependencies between cultural and environmental factors. This innovation enables a bidirectional and dynamic representation of these interactions, allowing the model to accommodate spatial-temporal variations and emergent phenomena that traditional techniques cannot effectively model. By integrating these nonlinear dynamics, the study offers a more nuanced understanding of cultural-environmental systems that reflects their inherent complexity. Another significant advancement is the development of the Adaptive Interaction Strategy for Cultural-Environmental Systems (AIS-CES), a feedback-driven optimization mechanism that dynamically adjusts system parameters based on real-time changes. This adaptive capability ensures that the model remains robust and effective even in the face of abrupt perturbations or evolving system states, such as those driven by rapid climate change or socio-economic transitions. Unlike typical applications that often treat cultural and environmental systems in isolation or rely on predefined rules, our approach emphasizes the dynamic co-evolution of these systems, ensuring greater predictive accuracy and adaptability. Our framework integrates diverse data modalities, including remote sensing, environmental metrics, and cultural indicators, to provide a holistic analysis that transcends conventional techniques. By combining domain-specific knowledge with advanced machine learning methods, the study ensures both interpretability and scalability. This hybrid approach not only enhances the capacity to uncover subtle patterns in the region’s cultural-environmental systems but also provides actionable insights that can directly inform policy and sustainable management strategies. These innovations collectively position this study as a significant contribution to advancing both the methodology and the practical application of cultural-environmental interaction models in the Third Pole Region.
The study specifically addresses the known limitations of existing models by tailoring its approach to accommodate the unique environmental and cultural characteristics of the Third Pole Region. This region presents a highly dynamic and heterogeneous landscape, characterized by complex interactions between its diverse ecosystems and deeply rooted cultural practices. To address these challenges, our proposed Dynamic Cultural-Environmental Interaction Network (DCEN) is designed with a flexible, graph-based structure that integrates region-specific cultural and environmental variables. This allows the model to effectively capture spatial and temporal heterogeneity, as well as the intricate feedback loops between cultural practices and environmental changes, which are often oversimplified in conventional models. A key limitation of traditional approaches is their reliance on static datasets and predefined rules that struggle to adapt to rapid or nonlinear changes in the region. Our study overcomes this limitation through the Adaptive Interaction Strategy for Cultural-Environmental Systems (AIS-CES), which incorporates real-time feedback mechanisms to dynamically update interaction parameters. This ensures that the model can respond to abrupt perturbations such as glacier retreat, permafrost thaw, or shifts in cultural resource management practices, while maintaining stability and predictive accuracy. By embedding adaptive optimization within the modeling framework, the study aligns closely with the Third Pole’s dynamic socio-ecological systems. The study also introduces innovations in data integration to address the diverse and often sparse data availability in the region. By combining remote sensing imagery with cultural metrics and environmental indicators, the framework provides a comprehensive, multi-modal perspective that captures both tangible and intangible aspects of cultural-environmental interactions. Furthermore, customized data augmentation techniques are employed to enhance the representativeness of the model’s training data, addressing the challenge of limited labeled datasets specific to the Third Pole’s unique context. These methodological advancements ensure that the model not only accounts for but also leverages the distinctive characteristics of the region, providing a robust foundation for future research and sustainable policy development.
The novelty of our hybrid model lies in its ability to combine domain-specific cultural and environmental knowledge with the computational power of advanced machine learning, addressing critical gaps left by previous studies. While earlier approaches have utilized symbolic AI or machine learning independently, our framework integrates these methodologies into a cohesive system that is both interpretable and adaptive. This hybrid approach enables the model to capture the complex, bidirectional interactions between culture and environment in the Third Pole region, including spatial-temporal dynamics and emergent patterns, which were previously either oversimplified or ignored. One significant perspective offered by this framework is its capacity to harmonize expert-driven insights with data-driven discoveries. The inclusion of symbolic components ensures that cultural nuances, such as traditional practices or localized environmental stewardship, are embedded into the model’s structure, maintaining interpretability and contextual relevance. At the same time, the integration of machine learning enables the model to uncover hidden correlations and adapt to unforeseen challenges. This dual capability bridges the gap between theoretical understanding and empirical observation, providing a more comprehensive view of how cultural and environmental systems co-evolve. The practical solutions offered by this hybrid framework include enhanced predictive accuracy and actionable insights for sustainable management. By incorporating the Adaptive Interaction Strategy for Cultural-Environmental Systems (AIS-CES), the model dynamically adjusts its parameters based on real-time feedback, allowing it to respond to abrupt changes such as extreme weather events, rapid glacier melting, or shifts in land use. This adaptability ensures that the model is not only robust in its predictions but also capable of guiding policy interventions tailored to the Third Pole’s unique challenges. Unlike previous studies, which often struggle with data sparsity or lack of scalability, our approach leverages a multi-modal dataset encompassing remote sensing, environmental metrics, and cultural indicators. The result is a framework capable of capturing both tangible and intangible aspects of cultural-environmental interactions. This combination of scalability, adaptability, and contextual sensitivity sets our hybrid framework apart, offering new pathways for research and practical solutions for managing this fragile and vital region.
While previous studies have explored the integration of remote sensing, ethnographic, and historical data, our work distinguishes itself by introducing a more systematic and dynamic methodology for combining these diverse data types. Traditional approaches often rely on static or loosely coupled frameworks, which limit their ability to capture the evolving, bidirectional interplay between cultural and environmental systems. Our study advances this integration through the development of the Dynamic Cultural-Environmental Interaction Network (DCEN), a computational framework that leverages graph-based structures and nonlinear dynamics to seamlessly merge spatial-temporal remote sensing data with qualitative cultural and historical insights. This enables a more holistic representation of the complex interactions in the Third Pole region. The primary innovation lies in our use of adaptive optimization techniques, particularly through the Adaptive Interaction Strategy for Cultural-Environmental Systems (AIS-CES). This strategy allows the model to dynamically update interaction weights and parameters based on system feedback, making it highly responsive to new information and environmental changes. Unlike earlier studies that often treat ethnographic and historical data as supplementary, our methodology embeds these data directly into the model’s structure, ensuring that cultural and historical nuances actively shape the interpretation of environmental patterns and predictions. This dynamic feedback loop ensures that the integration is not only thorough but also contextually relevant and scalable. our study introduces novel data preprocessing and augmentation techniques to enhance the alignment of heterogeneous data types. For example, spatially explicit features from remote sensing are correlated with localized ethnographic and historical records through advanced embedding techniques that preserve the spatial and temporal coherence of the data. This approach allows the model to draw deeper insights, such as identifying how historical land-use practices influence current environmental dynamics or how cultural adaptation strategies are shaped by spatial environmental changes. These innovations ensure that the integration of diverse datasets in our study goes beyond conventional overlay analyses, offering a unified, dynamic, and scalable framework that provides actionable insights for both research and regional management.
This study explores the intricate and dynamic interplay between cultural and environmental systems in the Third Pole Region, a critical area for socio-ecological research. Traditional analytical approaches often fail to fully capture the bidirectional, nonlinear, and spatiotemporal complexities inherent in these interactions. To address this gap, we introduce the Dynamic Cultural-Environmental Interaction Network (DCEN), a multidimensional computational framework that integrates cultural metrics with environmental variables. This framework employs a graph-based approach and coupled nonlinear equations to model interactions, accounting for spatial-temporal dynamics and external influences. Additionally, we propose the Adaptive Interaction Strategy for Cultural-Environmental Systems (AIS-CES), a mechanism that dynamically optimizes model parameters based on real-time feedback, enhancing system stability, adaptability, and resilience. Experimental validation confirms the efficacy of this approach, demonstrating its capability to simulate complex cultural-environmental interactions with high predictive accuracy. These findings offer valuable insights for policy formulation, adaptive management, and disaster mitigation strategies in this ecologically fragile yet geopolitically significant region.
Despite its contributions, this study presents two key limitations. First, the reliance on computational models may lead to an oversimplification of cultural nuances and localized dynamics, which are inherently difficult to quantify and may fluctuate significantly over short timeframes. Future research should integrate qualitative data and participatory methodologies to enhance the cultural contextualization of these models. Second, the real-time optimization strategy (AIS-CES) may face computational bottlenecks when applied across broader temporal or spatial scales. Addressing this challenge will require advancements in high-performance computing or the development of more efficient and scalable algorithms.
The original contributions presented in the study are included in the article/supplementary material, further inquiries can be directed to the corresponding author.
ZL: Writing–original draft, Writing–review and editing.
The author(s) declare that financial support was received for the research, authorship, and/or publication of this article. Construction and Practice of Blended Learning Mode Empower College English Learning for Electronic and Information Majors: A Case Study of Chaoxing Learning Platform.
The author declares that the research was conducted in the absence of any commercial or financial relationships that could be construed as a potential conflict of interest.
The authors declare that no Generative AI was used in the creation of this manuscript.
All claims expressed in this article are solely those of the authors and do not necessarily represent those of their affiliated organizations, or those of the publisher, the editors and the reviewers. Any product that may be evaluated in this article, or claim that may be made by its manufacturer, is not guaranteed or endorsed by the publisher.
Anilkumar, P., Tokmakov, D., Venugopal, P., Koppu, S., Mileva, N., and Bekyarova-Tokmakova, A. (2024). A multi-objective derived adaptive transdeeplabv3 using electric fish optimization algorithm for aerial image semantic segmentation. IEEE Access 12, 147723–147738. doi:10.1109/access.2024.3476157
Arosio, T., Büntgen, U., Nicolussi, K., Moseley, G. E., Saurer, M., Pichler, T., et al. (2024). Tree-ring δ 18 o and δ 2 h stable isotopes reflect the global meteoric water line. Front. Earth Sci. 12, 1440064. doi:10.3389/feart.2024.1440064
Atigh, M. G., Schoep, J., Acar, E., Noord, N. V., and Mettes, P. (2022). Hyperbolic image segmentation. in Computer vision and pattern recognition.
Aybar, C., Bautista, L., Montero, D., Contreras, J., Ayala, D., Prudencio, F., et al. (2024). Cloudsen12+: the largest dataset of expert-labeled pixels for cloud and cloud shadow detection in sentinel-2. Data Brief 56, 110852. doi:10.1016/j.dib.2024.110852
Broni-Bediako, C., Xia, J., Song, J., Chen, H., Siam, M., and Yokoya, N. (2024). Generalized few-shot semantic segmentation in remote sensing: challenge and benchmark. IEEE Geoscience Remote Sens. Lett. 21, 1–5. doi:10.1109/lgrs.2024.3489634
Cao, H., Wang, Y., Chen, J., Jiang, D., Zhang, X., Tian, Q., et al. (2021). Swin-unet: unet-like pure transformer for medical image segmentation. in ECCV Workshops. 205–218.
Chaitanya, K., Erdil, E., Karani, N., and Konukoglu, E. (2020). Contrastive learning of global and local features for medical image segmentation with limited annotations. in NIPS’20: Proceedings of the 34th international conference on neural information processing systems.
Chen, C., Dou, Q., Chen, H., Qin, J., and Heng, P. (2020). Unsupervised bidirectional cross-modality adaptation via deeply synergistic image and feature alignment for medical image segmentation. IEEE Trans. Med. Imaging 39, 2494–2505. doi:10.1109/tmi.2020.2972701
Cheng, B., Misra, I., Schwing, A., Kirillov, A., and Girdhar, R. (2021). Masked-attention mask transformer for universal image segmentation. in Computer vision and pattern recognition.
Chi, G., Huang, Y., Ma, C., and Yan, C. (2024). Defect detection and localization in fiber optic panels based on discrete wavelet and multi-objective morphological optimization. IEEE Sensors J. 24, 30726–30735. doi:10.1109/jsen.2024.3447122
Deshmukh, S., and Khaparde, A. (2022). Multi-objective segmentation approach for bone age assessment using parameter tuning-based u-net architecture. Multimedia Tools Appl. 81, 6755–6800. doi:10.1007/s11042-021-11793-0
Gao, Y., Zhou, M., and Metaxas, D. N. (2021). Utnet: a hybrid transformer architecture for medical image segmentation. in International conference on medical image computing and computer-assisted intervention. 61–71.
Ge, Y.-F., Zhan, Z.-H., Cao, J., Wang, H., Zhang, Y., Lai, K.-K., et al. (2022). Dsga: a distributed segment-based genetic algorithm for multi-objective outsourced database partitioning. Inf. Sci. 612, 864–886. doi:10.1016/j.ins.2022.09.003
Ghiasi, G., Gu, X., Cui, Y., and Lin, T.-Y. (2021). Scaling open-vocabulary image segmentation with image-level labels. in European conference on computer vision.
Hatamizadeh, A., Yang, D., Roth, H., and Xu, D. (2021). Unetr: transformers for 3d medical image segmentation. in IEEE workshop/winter conference on applications of computer vision. Waikoloa, HI, USA, 03-08 January 2022 (IEEE).
Huang, H., Lin, L., Tong, R., Hu, H., Zhang, Q., Iwamoto, Y., et al. (2020). Unet 3+: a full-scale connected unet for medical image segmentation. in IEEE international conference on acoustics, speech, and signal processing. (IEEE).
Isensee, F., Jaeger, P., Kohl, S. A. A., Petersen, J., and Maier-Hein, K. (2020). nnu-net: a self-configuring method for deep learning-based biomedical image segmentation. Nat. Methods 18, 203–211. doi:10.1038/s41592-020-01008-z
Jain, J., Li, J., Chiu, M., Hassani, A., Orlov, N., and Shi, H. (2022). Oneformer: one transformer to rule universal image segmentation. in Computer vision and pattern recognition.
Jha, D., Riegler, M., Johansen, D., Halvorsen, P., and Johansen, H. D. (2020). Doubleu-net: a deep convolutional neural network for medical image segmentation. in 2020 IEEE 33rd international symposium on computer-based medical systems (CBMS). (IEEE), 558–564.
Jiang, G., Wang, J., Wen, J., Liu, X., Yu, B., and Wang, Y. (2024). Evolution of the internal structure and physical properties of Tongxin sandstone under high temperature. Front. Earth Sci. 12, 1502647. doi:10.3389/feart.2024.1502647
Khatiwada, K. R., Pradhananga, S., and Nepal, S. (2024). Inferring the impacts of climate extreme in the kabul river basin. Reg. Environ. Change 24, 17. doi:10.1007/s10113-023-02167-3
Lin, A.-J., Chen, B., Xu, J., Zhang, Z., Lu, G., and Zhang, D. (2021). Ds-transunet: dual swin transformer u-net for medical image segmentation. IEEE Trans. Instrum. Meas. 71, 1–15. doi:10.1109/tim.2022.3178991
Liu, L., Yang, B., and Zhang, Y. (2024). Inverting magnetotelluric data using a physics-guided auto-encoder with scaling laws extension. Front. Earth Sci. 12, 1510962. doi:10.3389/feart.2024.1510962
Liu, X., Song, L., Liu, S., and Zhang, Y. (2021). A review of deep-learning-based medical image segmentation methods. Sustainability 13, 1224. doi:10.3390/su13031224
Lüddecke, T., and Ecker, A. S. (2021). Image segmentation using text and image prompts. in Computer Vision and Pattern Recognition.
Luo, X., Chen, J., Song, T., Chen, Y., Wang, G., and Zhang, S. (2020). Semi-supervised medical image segmentation through dual-task consistency. in AAAI conference on artificial intelligence.
Malhotra, P., Gupta, S., Koundal, D., Zaguia, A., and Enbeyle, W. (2022). Deep neural networks for medical image segmentation. J. Healthc. Eng. 2022, 1–15. doi:10.1155/2022/9580991
Minaee, S., Boykov, Y., Porikli, F., Plaza, A., Kehtarnavaz, N., and Terzopoulos, D. (2020). Image segmentation using deep learning: a survey. IEEE Trans. Pattern Analysis Mach. Intell. 44, 3523–3542. doi:10.1109/tpami.2021.3059968
Müller, D., Soto-Rey, I., and Kramer, F. (2022). Towards a guideline for evaluation metrics in medical image segmentation. BMC Res. Notes 15, 210. doi:10.1186/s13104-022-06096-y
Ouyang, C., Biffi, C., Chen, C., Kart, T., Qiu, H., and Rueckert, D. (2020). Self-supervision with superpixels: training few-shot medical image segmentation without annotation. in European conference on computer vision.
Ranjan, A. K., Parida, B. R., Dash, J., and Gorai, A. K. (2022). Quantifying the impacts of opencast mining on vegetation dynamics over eastern India using the long-term landsat-series satellite dataset. Ecol. Inf. 71, 101812. doi:10.1016/j.ecoinf.2022.101812
Valanarasu, J. M. J., Oza, P., Hacihaliloglu, I., and Patel, V. M. (2021). Medical transformer: gated axial-attention for medical image segmentation. in International conference on medical image computing and computer-assisted intervention.
Valanarasu, J. M. J., and Patel, V. M. (2022). Unext: mlp-based rapid medical image segmentation network. in International conference on medical image computing and computer-assisted intervention.
Wang, L., Cuo, L., Luo, D., Su, F., Ye, Q., Yao, T., et al. (2022). Observing multisphere hydrological changes in the largest river basin of the Tibetan plateau. Bull. Am. Meteorological Soc. 103, E1595–E1620. doi:10.1175/bams-d-21-0217.1
Wang, L., Liu, H., Bhlon, R., Chen, D., Long, J., and Sherpa, T. C. (2024). Modeling glacio-hydrological processes in the himalayas: a review and future perspectives. Geogr. Sustain. 5, 179–192. doi:10.1016/j.geosus.2024.01.001
Wang, Z., Lu, Y., Li, Q., Tao, X., Guo, Y., Gong, M., et al. (2021). Cris: clip-driven referring image segmentation. in Computer vision and pattern recognition.
Wang, L., Song, C., Li, X., Conradt, T., and Rasmy, M. (2023). Climatic and associated cryospheric and hydrospheric changes on the third pole-volume ii. Front. Earth Sci. 11, 1255039. doi:10.3389/feart.2023.1255039
Wu, J., Fang, H., Zhang, Y., Yang, Y., and Xu, Y. (2022). Medsegdiff: medical image segmentation with diffusion probabilistic model. in International conference on medical imaging with deep learning.
Xie, Y., Zhang, J., Shen, C., and Xia, Y. (2021). Cotr: efficiently bridging cnn and transformer for 3d medical image segmentation. in International conference on medical image computing and computer-assisted intervention.
Xu, J., Liu, S., Vahdat, A., Byeon, W., Wang, X., and Mello, S. D. (2023). Open-vocabulary panoptic segmentation with text-to-image diffusion models. in Computer vision and pattern recognition.
Yin, X., Sun, L., Fu, Y., Lu, R., and Zhang, Y. (2022). U-net-based medical image segmentation. J. Healthc. Eng. 2022, 1–16. doi:10.1155/2022/4189781
Yu, Y., Wang, C., Fu, Q., Kou, R.-J., Huang, F., Yang, B., et al. (2023). Techniques and challenges of image segmentation: a review. Electronics 12, 1199. doi:10.3390/electronics12051199
Zhang, W., Pang, J., Chen, K., and Loy, C. C. (2021a). K-net: towards unified image segmentation. in NIPS’21: Proceedings of the 35th international conference on neural information processing systems. 10326–10338.
Zhang, Y., Liu, H., and Hu, Q. (2021b). Transfuse: fusing transformers and cnns for medical image segmentation. in International conference on medical image computing and computer-assisted intervention.
Zhu, R., Fan, C., Chen, Z., and Yao, R. (2021). Bio-invasion: a prediction model based on multi-objective optimization. in 2021 IEEE international conference on signal processing, communications and computing (ICSPCC). (IEEE), 1–5.
Keywords: culture-environment interactions, dynamic networks, Third Pole Region, computational modeling, adaptive strategies
Citation: Lu Z (2025) Application of remote sensing technology in studying the interaction between culture and environment in the Third Pole Region. Front. Environ. Sci. 13:1547530. doi: 10.3389/fenvs.2025.1547530
Received: 19 December 2024; Accepted: 06 February 2025;
Published: 10 March 2025.
Edited by:
Xiuping Li, Chinese Academy of Sciences (CAS), ChinaReviewed by:
Muhammad Shahid, Brunel University London, United KingdomCopyright © 2025 Lu. This is an open-access article distributed under the terms of the Creative Commons Attribution License (CC BY). The use, distribution or reproduction in other forums is permitted, provided the original author(s) and the copyright owner(s) are credited and that the original publication in this journal is cited, in accordance with accepted academic practice. No use, distribution or reproduction is permitted which does not comply with these terms.
*Correspondence: Zhang Lu, c3l4eXp4eUAxNjMuY29t
Disclaimer: All claims expressed in this article are solely those of the authors and do not necessarily represent those of their affiliated organizations, or those of the publisher, the editors and the reviewers. Any product that may be evaluated in this article or claim that may be made by its manufacturer is not guaranteed or endorsed by the publisher.
Research integrity at Frontiers
Learn more about the work of our research integrity team to safeguard the quality of each article we publish.