
94% of researchers rate our articles as excellent or good
Learn more about the work of our research integrity team to safeguard the quality of each article we publish.
Find out more
ORIGINAL RESEARCH article
Front. Environ. Sci., 31 January 2025
Sec. Environmental Informatics and Remote Sensing
Volume 13 - 2025 | https://doi.org/10.3389/fenvs.2025.1546190
 Kaimin Wang1,2
 Min Xu1*
 Shaohua Wang1
 Lin Wang3
 Haijing Tian3
 Sornkitja Boonprong4Xiaotong Gao1,2Xinwei Yang1Heyi Guo1,2Jingbo Li1,2Yujie Yang1,2Ruichen Hu1,2Yu Zhang1,2
 Chunxiang Cao1
The Central and West Asia Economic Corridor (CWAEC) is a critical component of the Belt and Road Initiative (BRI), and that vegetation changes in the region are under significant uncertainty due to fragile ecological conditions, diverse climatic variability, and that these uncertainties are compounded by the interaction of natural factors and human activities. For the sustainable development of the CWAEC, it is urgent to pay attention to its regional environmental health. Using MOD13A3 NDVI data and ERA5 meteorological reanalysis data, this study evaluated the spatiotemporal changes in NDVI across the CWAEC over the past decade of BRI implementation. A trend analysis method was applied to assess NDVI development, and the relative impacts of climate change and human activities were explored through a multivariate regression residual analysis. The results revealed a declining trend in NDVI across the CWAEC, with an average rate of −0.26 × 10⁻2 a⁻1, and 50.74% of the region exhibiting insignificant degradation. Significant degradation was observed in the hilly areas of northern Kazakhstan, the low-altitude areas bordering the Tian Shan and Hindu Kush mountains, and the central part of the corridor. Conversely, significant restoration was concentrated in the hinterland of Kazakhstan and the coastal areas of the Caspian Sea. Climate change inhibited NDVI changes in 65.24% of the region, while human activities facilitated changes in 49.64%, indicating that the variations in NDVI were primarily driven by the combined effects of these factors. This study identifies the key drivers of NDVI changes in the CWAEC since the implementation of the BRI, provides scientific evidence to support the sustainable development of green BRI initiatives, and offers valuable insights for future ecological restoration and engineering projects within the corridor.
The Belt and Road Initiative (BRI) seeks to enhance international cooperation and promote green development. It emphasizes sustainable, low-carbon production and lifestyles, fosters environmental collaboration, supports the construction of ecological civilizations, and aligns with the 2030 Sustainable Development Goals (Xi, 2017). While the BRI has delivered substantial economic benefits to countries along its route (Huang, 2016), a significant portion of the initiative traverses arid, semi-arid, and sub-humid regions with fragile ecological systems. These regions, already vulnerable, are expected to face increasing environmental challenges due to global climate change and intensified human activities (Zhang et al., 2021). Therefore, maintaining a focus on regional environmental sustainability is crucial throughout the implementation of the BRI.
The Central and West Asia Economic Corridor (CWAEC) serves as a key hub of the BRI and is one of the regions most affected by fragile ecological conditions and severe desertification issues along the route. Its spatial extent roughly coincides with the ancient Silk Road, encompassing areas characterized by temperate continental and subtropical desert climates. The Central Asian portion features vast stretches of Gobi, intense evapotranspiration, and arid conditions, while the West Asian region consists of high plateaus, expansive deserts, and low precipitation. Together, these areas face critical environmental challenges such as drought and desertification (Wu et al., 2018). Land cover in the region is primarily composed of grassland, cropland, and bare land, which collectively account for over 85% of the total area (Naboureh et al., 2023). Studies have highlighted that water resources in the CWAEC are expected to become increasingly scarce in the future, potentially exacerbating environmental degradation (Masson-Delmotte et al., 2021; Zhou et al., 2020). Quantitative modeling and identification of ecosystem change trends in the region are essential to ensuring the sustainable development of the BRI and advancing the goals of the Green Belt and Road initiative (Liu, 2015).
With advancements in Earth observation technology, remote sensing has become an efficient and effective tool for evaluating surface vegetation changes (Cao, 2013). Among various indicators, the normalized difference vegetation index (NDVI) plays a crucial role due to its strong linear relationship with vegetation productivity, biomass, and leaf area index. NDVI provides an accurate measure of vegetation growth status and serves as a valuable tool for monitoring vegetation cover and growth over large areas. It has been widely used to assess the health of diverse land cover types, including forests, grasslands, wastelands, and deserts, particularly in arid and semi-arid regions (Bashir et al., 2020; Xie et al., 2021; Wang et al., 2022; Gao et al., 2023).
Previous studies have shown that vegetation cover in the CWAEC region is generally low, with NDVI values below 0.27 (Fan et al., 2020; Yang et al., 2020). In the context of global warming, understanding how vegetation trends respond to rising temperatures and decreasing precipitation is essential for assessing the impacts of climate change on ecosystem structure and function (Xu et al., 2020). Climate change and human activities have introduced substantial disturbances and threats to terrestrial ecosystems (Tian et al., 2024; Xi et al., 2024). Research indicates that rising temperatures and drought conditions contribute significantly to vegetation changes in the CWAEC. Additionally, human activities, especially land-use changes associated with increased foreign trade, play a critical role in driving these changes (Xu et al., 2021; Hai et al., 2022; Fan and Li, 2019). However, most existing studies focus on periods before or shortly after the implementation of the BRI, with limited research exploring developments in the years since its introduction. Even fewer studies address ecological and environmental issues specifically along the BRI. Therefore, a comprehensive analysis of the patterns and drivers of vegetation change in the CWAEC during the BRI’s implementation is urgently needed to support the long-term objectives of the Green BRI.
Therefore, this study focuses on seven countries along the CWAEC, addressing gaps in vegetation dynamics research in this ecologically fragile region. By integrating robust methods such as Theil-Sen analysis, Mann-Kendall tests, and multivariate regression residual analysis, it analyzed the spatial and temporal evolution of NDVI in the region over the past decade since the implementation of the BRI, quantified the driving forces behind NDVI variations, and emphasized the relative contributions of climate change and human activities using MOD13A3 NDVI and ERA5 meteorological reanalysis data. The study aims to provide insights for balancing economic development and ecological preservation, offering valuable guidance for sustainable management under the Green BRI.
The study area includes Kazakhstan (KAZ), Kyrgyzstan (KGZ), Tajikistan (TJK), Uzbekistan (UZB), Turkmenistan (TKM), Iran (IRN), and Turkey (TUR) within the CWAEC, covering approximately 6.53 million km2 with geographic coordinates ranging from 25.06°N to 55.43°N and 25.66°E to 87.21°E (Figure 1). The region’s elevation varies from −140 m to 7,217 m, with an average height of 755 m. Higher altitudes are found in the western and southern Iranian Plateau and the eastern Tian Shan regions, while the rest of the area has relatively flat terrain. The region’s elevation varies from −140 m to 7,217 m, with an average height of 755 m. Higher altitudes are found in the western and southern Iranian Plateau and the eastern Tian Shan regions, while the rest of the area has relatively flat terrain (Wang et al., 2017). The annual average temperature is approximately 15°C, while the yearly cumulative precipitation averages around 170 mm, with notable spatial heterogeneity. Temperature tends to increase toward the south and decrease toward the north, while precipitation is concentrated in mountainous and hilly areas. The deserts of Central Asia and the Gobi region experience higher temperatures, whereas areas surrounding the Tian Shan Mountains have much cooler conditions, with average annual temperatures below 0°C. The Kavel Desert, located in the eastern part of West Asia, has an extremely arid climate with annual rainfall ranging from 30 to 250 mm. In contrast, the central area enjoys more favorable hydrothermal conditions, and the western region features a typical Mediterranean climate (Chen et al., 2020). Land cover in the study area is predominantly composed of grasslands, deserts, and sparse vegetation, with a few scattered forests, resulting in generally low vegetation greenness.

Figure 1. Distribution of the seven countries along the CWAEC: (A) Elevation, and (B) Land cover type.
This study utilized Moderate-resolution Imaging Spectroradiometer (MODIS) NDVI data, ERA5 reanalysis data, and relevant statistics covering the seven countries along the CWAEC from 2013 to 2022.
The NDVI data were derived from the National Aeronautics and Space Administration’s (NASA) MODIS MOD13A3 NDVI 16-day composite product (https://ladsweb.modaps.eosdis.nasa.gov), with a spatial resolution of 1,000 m and a temporal resolution of 16 days. The data acquisition track numbers included h19v04, h19v05, h20v03, h20v04, h20v05, h21v03, h21v04, h21v05, h21v06, h22v03, h22v04, h22v05, h22v06, h23v03, h23v04, h23v05, h23v06, h24v04, and h24v05, with data collected from 2013 to 2022. Using the study area boundaries obtained from the Resource and Environmental Science and Data Platform (https://www.resdc.cn), NDVI data were preprocessed on the Google Earth Engine platform. This involved batch projection, splicing, cropping, and quality control based on the MOD13A3 quality control field. Yearly NDVI data products were generated using the maximum value synthesis method. Meteorological data were obtained from the ERA5-Land Monthly Aggregated dataset provided by the European Centre for Medium-Range Weather Forecasts (ECMWF) Climate Reanalysis of the Copernicus Climate Change Service (https://climate.copernicus.eu). These data have a horizontal resolution of 0.1° × 0.1° (original resolution: 9 km). Monthly temperature and precipitation data from 2013 to 2022 were extracted using the Google Earth Engine platform (Xu et al., 2019; Chen et al., 2019). Bilinear interpolation was applied to resample the meteorological data to match the spatial resolution of the NDVI data (Guo et al., 2018; Wang et al., 2024; Wei et al., 2022; Zandler et al., 2020), and ArcGIS 10.2 was used to derive annual mean temperature and cumulative precipitation figures. Given the generally low NDVI values in the CWAEC, a spatial mask was applied to include only data where NDVI values were greater than zero. All datasets were projected using the GCS_WGS_1984 coordinate system for uniformity.
Theil-Sen Median trend analysis and the Mann-Kendall (MK) test were employed to examine changes in the spatial trend of NDVI and its significance. Theil-Sen Median trend analysis is a robust non-parametric statistical approach utilized for calculating trends (Sen, 1968; Hoaglin et al., 2000), which can reduce the influence of data anomalies and is applicable to trend analysis of long-term time series data (Cai and Yu, 2009; Lunetta et al., 2022). The formula is shown in Equation 1:
In the formula, Median refers to the median value and
Here,
Multiple regression residual analysis was employed to examine the impacts and relative contributions of climatic variation and anthropogenic activities on changes in NDVI (Evans and Geerken, 2004; Wessels et al., 2007). Based on NDVI, temperature, and precipitation time series data, a binary linear regression model was established, with NDVI as the independent variable and the rest serving as the dependent variables. The predicted NDVI (
Where T and P referred to the annual mean temperature and cumulative precipitation in °C and mm respectively, and a, b, and c were the model parameters.
Where

Table 1. Classification of slope (NDVICC) and slope (NDVIHA).
The criteria for distinguishing the dominant drivers of NDVI variation and assessing the relative influence of climatic alterations and anthropogenic activities on NDVI variation are outlined in Table 2 (Sun et al., 2015). When the signs of
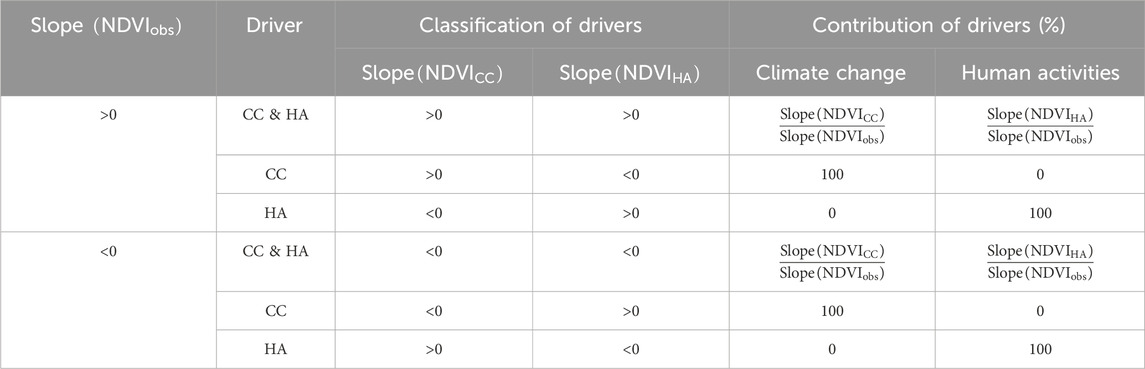
Table 2. Determination of drivers and calculation of contribution rate of NDVI changes.
The average spatial distribution of NDVI in the CWAEC from 2013 to 2022 showed a gradual decline from north to south, with values ranging from 0 to 0.93. The overall multi-year regional average was 0.34 (Figure 2). High NDVI values were concentrated in the northern Kazakh hills, the low-altitude areas of the eastern Tian Shan and the Altai Mountains, the Elburz Mountains in northern IRN, and the coastal regions of TUR. These areas benefited from favorable thermal and hydrological conditions and were predominantly grassland, with NDVI values exceeding 0.50. In contrast, low NDVI values were observed in the central Turan lowlands and the southern Iranian Plateau, primarily due to desertification in regions such as the Kyzylkum Desert, Karakum Desert, and Kavir Salt Desert, where NDVI values were below 0.30. Among the countries, TUR recorded the highest average NDVI at 0.55, followed by KGZ at 0.46, while IRN had the lowest average NDVI at 0.19.
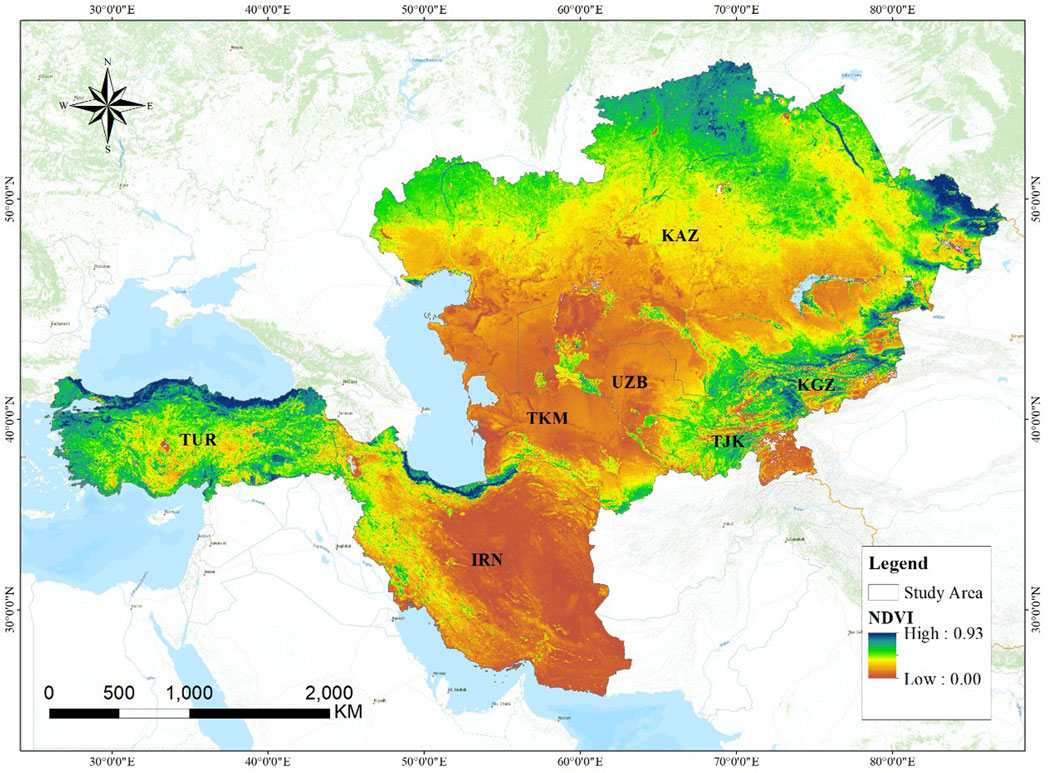
Figure 2. Spatial distribution of average NDVI in CWAEC from 2013–2022.
Regarding temporal changes, the mean NDVI in the CWAEC varied between 0.30 and 0.37 over the past decade, peaking in 2016 and reaching its lowest point in 2021, as shown in Figure 3. Over this period, the average NDVI exhibited a declining trend at an annual rate of −0.23 × 10⁻2. From 2013 to 2016, NDVI increased at an annual rate of 1.2 × 10⁻2. But from 2016 to 2022, it showed a declining trend at an average annual rate of −0.78 × 10⁻2, which may be related to a stronger increase in evapotranspiration than precipitation during the dry season from April to September (Ren et al., 2022), as well as to the depletion of groundwater due to land reclamation, mineral development (Yu et al., 2023).
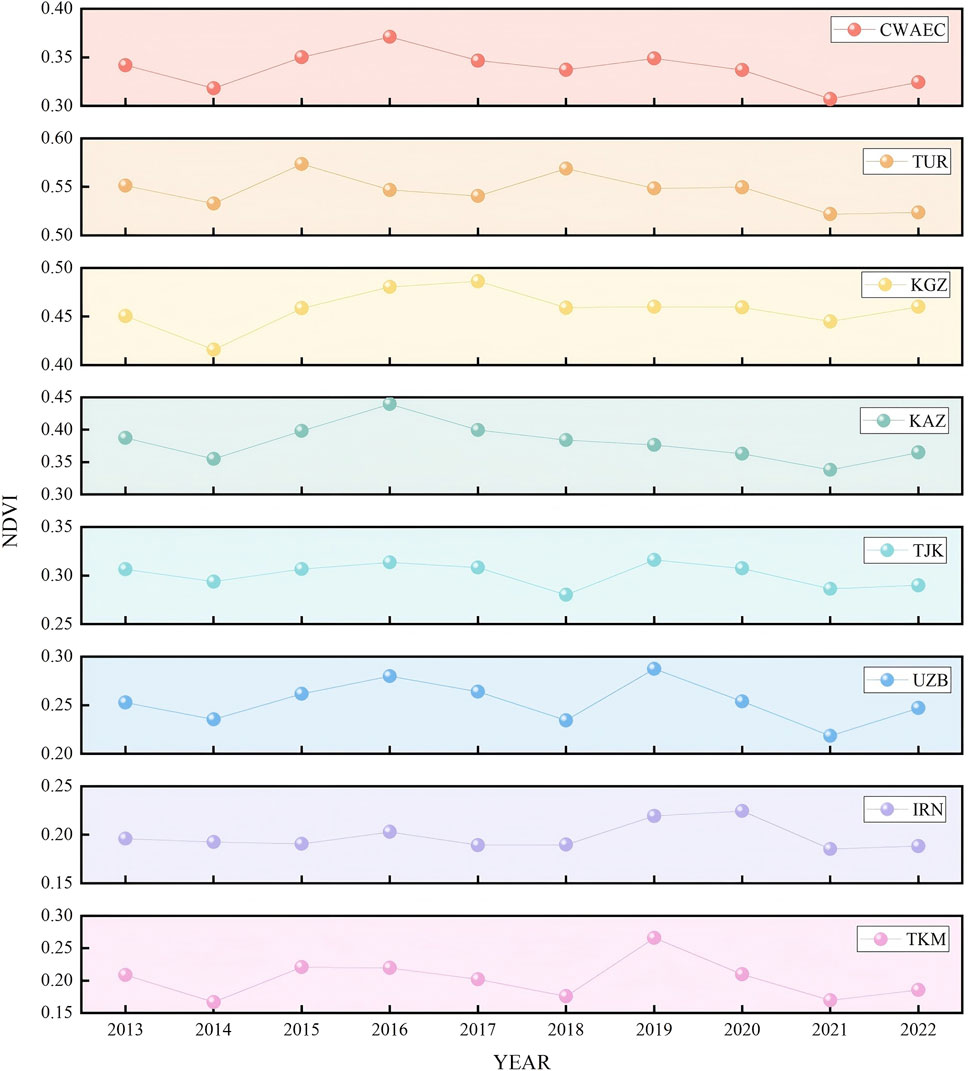
Figure 3. Temporal changes of NDVI in CWAEC countries, 2013–2022.
NDVI changes also varied among the seven countries. TUR fluctuated around 0.54, peaking at 0.57 in 2015. KGZ showed fluctuations near 0.46, with a peak of 0.49 in 2017. KAZ displayed a declining trend with an average rate of −0.42 × 10⁻2, fluctuating around 0.38 and peaking at 0.44 in 2016. TJK, UZB, and TKM exhibited more consistent interannual changes, all peaking in 2019 despite significant interannual variations and instability. Meanwhile, IRN and TKM fluctuated around 0.20. These findings suggest that regions with low vegetation cover are more vulnerable to perturbations, leading to greater variability in NDVI trends.
Figure 4 illustrates the trend of NDVI changes in the CWAEC over the past decade. The trend ranged from −0.11 to 0.12 a⁻1, with an average change rate of −0.0026 a⁻1. Significant vegetation degradation was observed in the hilly regions of northern KAZ and the central low-altitude areas bordering the Tian Shan and Hindu Kush mountains ranges. Conversely, notable vegetation recovery occurred in the hinterlands of KAZ and along the Caspian Sea coastline. The statistical results of trend significance categories are also shown in Figure 4. The findings revealed that insignificant degradation (ISD) dominated NDVI change trends, covering 50.74% of the total area, followed by insignificant improvement (ISI) at 28.58%. Significant degradation (SD) and significant improvement (SI) were less prevalent, accounting for 5.69% and 2.21% of the area, respectively. Areas with no change (NC) in NDVI represented 12.78% of the total region.
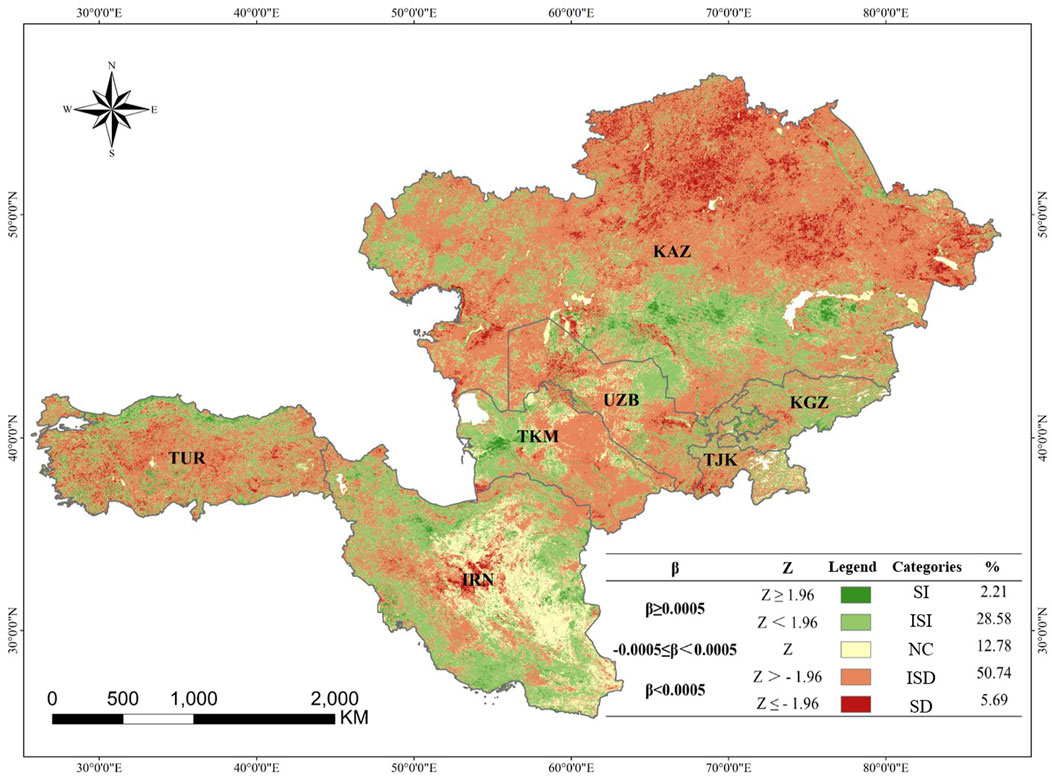
Figure 4. Changing trend of NDVI in CWAEC.
Except for KGZ, which had the highest percentage of ISI at 46.51%, all other countries along the route exhibited the highest percentage of ISD. KAZ recorded the highest ISD percentage at 60.85% (Figure 5). The proportions of SI and SD areas were relatively low in each country. TUR had the highest percentage of SI areas at 3.38%, primarily concentrated along the northern Caspian Sea coast. Meanwhile, KAZ had the highest percentage of SD areas at 8.11%, which were widely distributed across its northern and eastern regions. NC areas were most prominent in IRN, with the highest percentage at 28.19%, predominantly located in the hinterlands of the Iranian Plateau.
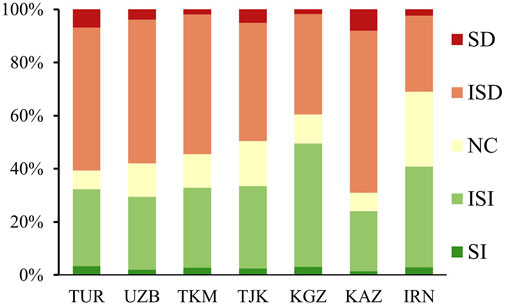
Figure 5. Statistical results for trend significance categories.
The effects of climate change and human activities on NDVI changes in the CWAEC exhibited significant spatial heterogeneity, with notable differences in how these factors influenced NDVI changes within the same region. As shown in Figure 6A climate change hindered NDVI growth in 65.24% of the region, with 38.57% of this area experiencing significant inhibition. These areas were primarily located in the northern Kazakh hills, the Ustyurt Plateau (spanning western KAZ and northwestern UZB), the central Karakum Desert in TKM, and the Zagros Mountains in eastern TUR and southwestern IRN. Conversely, climate change contributed to NDVI increases in 23.11% of the total area. Among these, slight enhancement covered the largest proportion at 10.28%, while obvious enhancement accounted for only 6.84%. These increases were concentrated in high-elevation regions, such as the Tian Shan Mountains around KGZ and the southeastern part of TKM. In 11.65% of the region, climate change had no noticeable effect on NDVI changes.
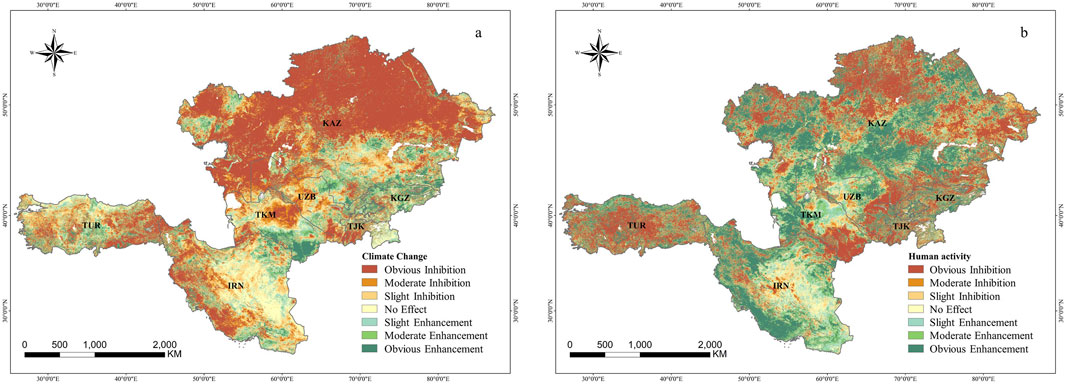
Figure 6. Impact of drivers on NDVI change: (A) Climate change, and (B) Human activities.
Human activities contributed to NDVI increases in 49.64% of the region, with a distinct strip stretching from northeastern KAZ to southwestern IRN (Figure 6B). Compared to climate change, human activities had a more significant impact on NDVI increases, affecting a larger area. Regions with obvious enhancement accounted for 27.21% of the total area, primarily found in south-central KAZ, the Caspian Sea coastal region, southwestern IRN, and the Black Sea coastal region in northern TUR. These areas were predominantly coastal or riverine. Conversely, human activities hindered NDVI increases in 42.66% of the region, with obvious inhibition accounting for 25.82%. This was mainly observed in the southeastern Tian Shan Mountains, the Pamir Plateau at lower altitudes, the north-central and eastern regions of KAZ, and the Anatolian Plateau in central TUR. Approximately 7.70% of the area showed no impact from human activities on NDVI changes. Analysis indicated that from 2013 to 2022, the average effects of climate change and human activities on NDVI changes in the CWAEC were −0.23 × 10⁻2 a⁻1 and −0.95 × 10⁻⁴ a⁻1, respectively.
Figure 7 illustrates the spatial distribution of the factors driving NDVI changes in the CWAEC. Among the areas experiencing positive impacts, the combined influence of CC&HA was the primary driver of NDVI increases, accounting for 15.98% of the region. In contrast, NDVI increases attributed solely to CC made up only 3.25% of the area and were relatively scattered. Areas where HA alone drove NDVI increases constituted 18.69%, primarily located in south-central KAZ, western TKM, and the north-south coastal regions of IRN. For areas experiencing negative impacts, 33.92% of the region showed that CC & HA jointly contributed to NDVI decreases. These declines were mainly concentrated in the northern and central parts of the CWAEC, as well as in the hinterlands of IRN and TUR. NDVI decreases driven solely by CC accounted for 19.00% of the area, and their spatial distribution largely overlapped with the previously mentioned regions. Meanwhile, areas where NDVI decline was attributed exclusively to HA comprised 9.17%, concentrated in the southeastern parts of TKM and the interior regions of TUR. Overall, the joint effects of CC & HA were the dominant drivers of NDVI changes in the CWAEC during the past decade of BRI implementation.
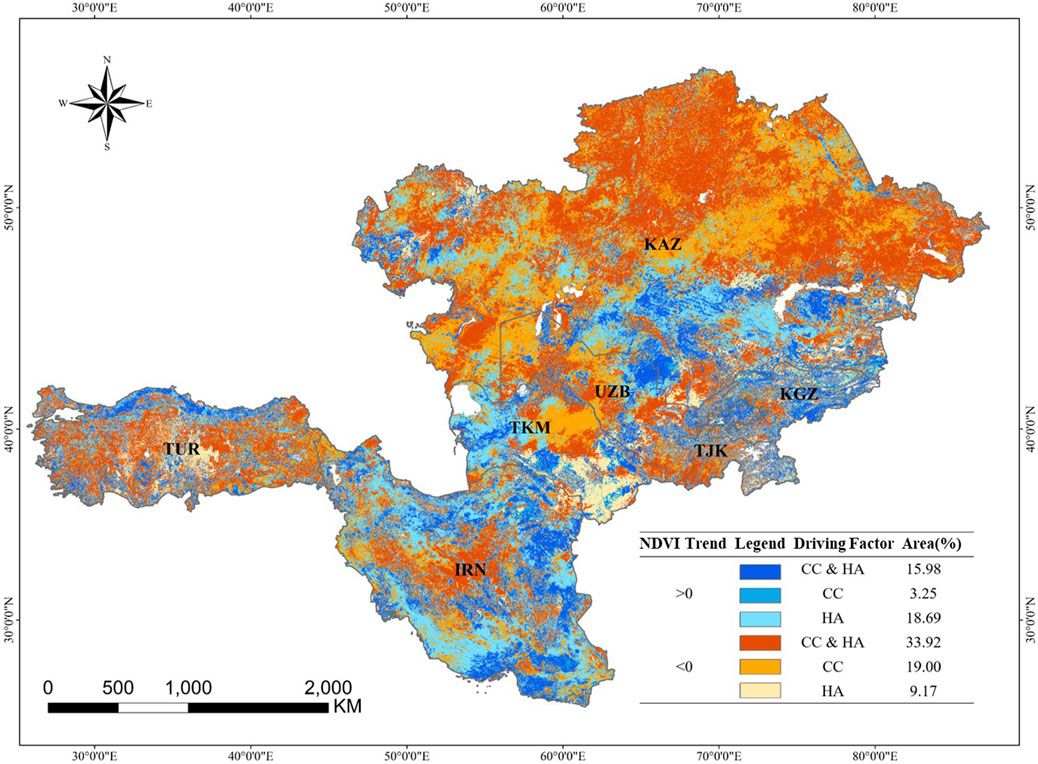
Figure 7. Spatial distribution of driving factors of NDVI change in the CWAEC, 2013–2022.
Driver analysis was conducted for each country and summarized in Table 3. In IRN, NDVI changes were solely influenced by HA, whereas in the other six countries, the driving factors were a combination of CC&HA. The calculation of Slope (NDVICC) and Slope (NDVIHA) by country revealed considerable variation in the effects of CC and HA on NDVI changes. The impact of CC ranged from −0.40 × 10⁻2 a⁻1 in KAZ to 0.07 × 10⁻2 a⁻1 in KGZ, while the influence of HA varied from −0.17 × 10⁻2 a⁻1 in TUR to 0.13 × 10⁻2 a⁻1 in IRN. Except for TKM and KGZ, CC suppressed NDVI changes in all countries. KAZ experienced significant inhibition, UZB moderate inhibition, and TUR, TJK, and IRN slight inhibition. Conversely, CC slightly enhanced NDVI in KGZ and had almost no effect in TKM. HA slightly suppressed NDVI in KAZ, TJK, and TKM, with moderate inhibition observed in TUR. In contrast, HA slightly enhanced NDVI in KGZ, moderately enhanced it in IRN and had minimal impact in UZB. Overall, climate change and human activities predominantly suppressed NDVI changes across the countries, with only a few exceptions where they had a positive impact. KGZ was the only country where both CC and HA positively contributed to NDVI changes.
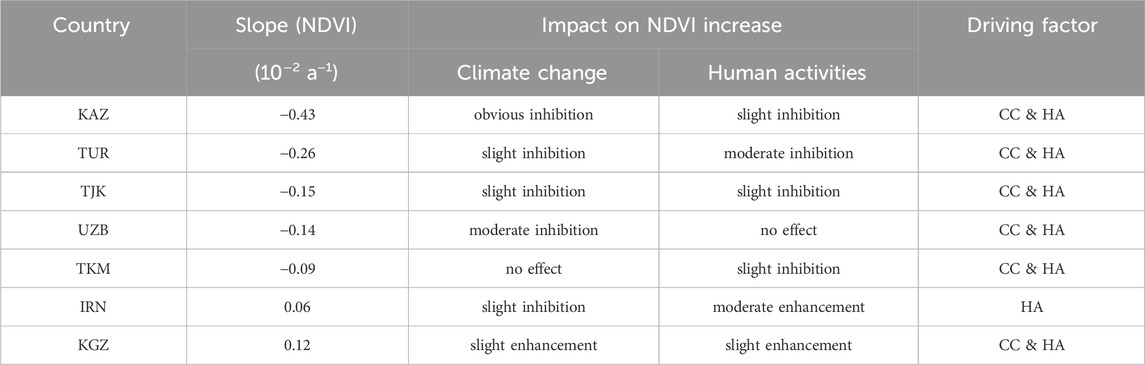
Table 3. Statistics of driving factors by country.
Climate alterations and human intervention jointly influenced the variations of NDVI across the CWAEC, but their relative contributions varied spatially. Figure 8 illustrates the relative contributions of CC and HA to NDVI changes within the region. Areas where CC contributed between 0% and 20% represented the largest portion, covering 39.42% of the total area. This was followed by areas where CC contributed between 80% and 100%, accounting for 29.63%. These high-contribution zones were primarily distributed in a band stretching from the Caspian coast to northwestern KAZ and in the central-northern part of the Karakum Desert in TKM. These regions, characterized predominantly by grasslands and deserts, were significantly influenced by CC.
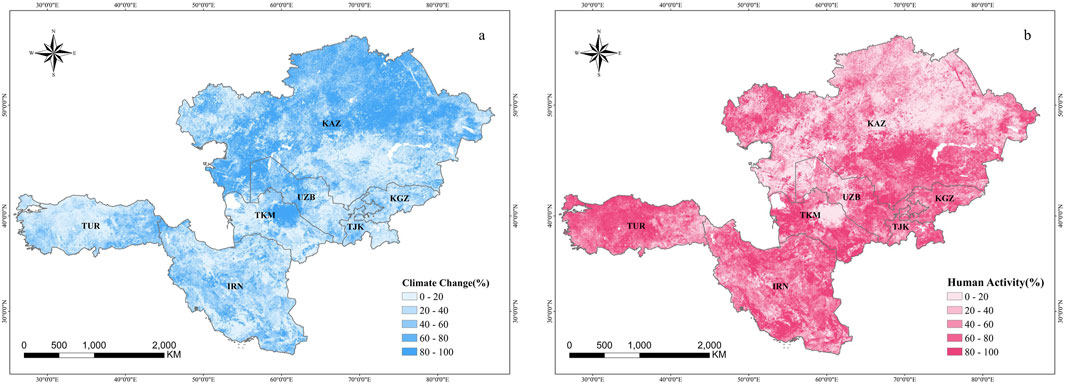
Figure 8. Relative contribution of (A) climate change and (B) human activities to NDVI change.
In contrast, the spatial distribution of HA’s relative contribution to NDVI change was the inverse of CC. Areas where HA contributed 80%–100% of the changes accounted for 39.42%, primarily located in the southwestern parts of Central Asia, the southern Iranian Plateau, and the Anatolian Plateau in TUR. These regions were densely populated and heavily affected by anthropogenic activities such as agriculture and mining, overlapping with core BRI construction zones. Meanwhile, areas where HA contributed between 0% and 20% made up 29.63% of the total region. The relative contributions of CC and HA in the 20%–40%, 40%–60%, and 60%–80% ranges were each approximately 10% and were scattered across the CWAEC.
HA contributed more to NDVI variations than CC, accounting for 54.78% of the changes, while CC accounted for 45.22%. At the national level, CC contribution to NDVI change ranged from 31.27% to 54.89%, with only KAZ exceeding 50%, followed by UZB at 48.09%. In contrast, HA’s contribution to NDVI changes ranged from 45.11% to 68.73%. TUR had the highest contribution from HA at 68.73%, followed by TJK at 66.98%, KGZ at 64.76%, IRN at 63.69%, and TKM at 63.33%. In these five countries, the relative contribution of HA to NDVI changes was greater than that of CC. However, in KAZ and UZB, NDVI changes were more strongly influenced by CC.
The study indicated that the NDVI in the CWAEC along the BRI demonstrated a significant degradation trend from 2013 to 2022, marked by considerable spatial heterogeneity. The combined effects of CC&HA were identified as the primary drivers of NDVI degradation. Over the past decade, the climate has shown a warming and drying trend, with temperatures increasing at a rate of 0.06°C a⁻1 and annual precipitation decreasing by 4.74 mm a⁻1. Regions with insignificantly rising temperatures accounted for 83.16% of the area, while those with insignificantly declining precipitation represented 63.79% (Figure 9). These conditions have been particularly unfavorable for vegetation growth in the hills, sandy areas, and deserts of arid and semi-arid regions (Jiang and Zhou, 2023). Sparse vegetation in these regions has been heavily influenced by precipitation, and rising temperatures have further exacerbated land surface evapotranspiration, limiting vegetation growth due to increased water scarcity. Consequently, ecological conditions in desert areas, especially the Karakum Desert, have worsened under climate change.

Figure 9. Changes and significance of precipitation (A, B) and temperature (C, D) in the CWAEC.
Human activities have also negatively impacted vegetation. Overgrazing, agriculture, industrial activities, and population pressures have all significantly contributed to degradation. Practices such as animal feeding and trampling have altered the surface vegetation structures in low-cover areas, particularly in traditional pasturelands like the Kazakh steppe and the northern foothills of the Tian Shan Mountains (Zhu et al., 2022). The increased intensity of livestock husbandry and grazing pressure in TKM, KAZ, and UZB has led to a further reduction in grassland NDVI (Chen et al., 2020). In Central Anatolia of TUR, the combination of warm-drying climates and strong winds, along with overgrazing and intensive farming, has severely degraded ecosystems, resulting in greatly reduced or completely absent natural plant cover (Yıldız et al., 2022).
Additionally, the reclamation of cropland and changes in land use have contributed to vegetation loss. In northern KAZ, where agriculture relied heavily on rain-fed cultivation, the decline in precipitation has adversely affected cropland productivity. Conversely, the development of irrigation-based agriculture along the Amu Darya and Syr Darya river basins in southern KAZ, UZB, and TKM has resulted in land salinization, further decreasing vegetation cover (Ruan and Yu, 2019).
Industrial activities, such as mining, petroleum extraction, and chemical operations along the mineral-rich Tian Shan Mountains, have caused extensive damage to the surrounding steppes, diminishing productivity and leading to the destruction of surface vegetation and groundwater pollution (Chen et al., 2020; Liu et al., 2021). Population growth has exacerbated regional water scarcity, further worsening vegetation degradation (Abuduwaili et al., 2019). Inconsistent land management practices, deforestation, and soil erosion in semi-arid regions have also contributed to soil degradation and the loss of plant species, accelerating the decline in NDVI (Sivakumar, 2007; Mutlu, 2019).
Vegetation cover in the CWAEC improved due to the combined effects of CC&HA. Climate warming, particularly the melting of glaciers, has led to increased precipitation and surface runoff in high-altitude regions. As shown in Figure 9B, areas with non-significant increases in precipitation accounted for 27.11% of the region, mainly concentrated in the high-altitude areas of the Tian Shan extension vein in the east-central region, the Pamir Plateau, and the southern Iranian Plateau (Dastigerdi et al., 2024). Furthermore, warming has enhanced the photosynthesis of vegetation, improving productivity and effectively promoting growth in these areas (Gong et al., 2017). Along the Black Sea coast in northern TUR and the Mediterranean coast in southwestern TUR, vegetation recovery has been driven by favorable regional climate conditions (Aktürk and Güney, 2021). Parts of southern TUR have also experienced vegetation restoration due to the combined effects of slightly lower temperatures and slightly higher precipitation. In the Central Asian region, where steppe vegetation is sparse, annual herbaceous plants have shown rapid growth in response to increased precipitation.
Human activities have further contributed to vegetation recovery, primarily through ecological restoration projects. For instance, TUR has planted black pines in semi-arid artificial grasslands to restore ecosystems (Ayan et al., 2021), while TKM has implemented a national forest program to improve land conditions (Kust et al., 2022). These ecological initiatives have notably increased forest cover, and maintaining appropriate planting densities has supported the restoration of understory vegetation (Yıldız et al., 2022).
In sparsely vegetated areas, such as the deltas of Lake Balkhash and the Amu Darya, cultivation has improved vegetation cover. However, increased irrigation water usage due to reclamation efforts in southern TKM has exacerbated ecological water shortages downstream, contributing to land degradation around the Aral Sea. In IRN, the establishment of ecological reserves has effectively improved overall ecosystem functioning (Mashizi and Sharafatmandrad, 2020).
The combined effects of climate CC&HA were identified as the dominant driving forces behind NDVI changes in 49.90% of the study area over the past decade. Within these regions, 15.98% showed signs of vegetation recovery, while 33.92% showed vegetation degradation. In areas where vegetation recovered, the contribution of CC was approximately 33.74%, whereas HA accounted for 66.26%. In contrast, areas with vegetation degradation showed a higher contribution from CC at 51.82%, while HA contributed only 45.18%. These findings emphasize the crucial role of human intervention in improving the ecological environment within the CWAEC.
The fragile ecological environment of the CWAEC presents significant challenges for resource exploitation and sustainable development. Considering the similarities between the climate and environment of the CWAEC and northwestern China, the successful experiences in ecological and environmental management from China could serve as valuable examples. Initiatives such as the Beijing-Tianjin-Hebei sandstorm control initiative, the Three-North Shelterbelt Program, and the national desertification control scheme (Niu et al., 2023; Zhu and Zheng, 2019; Zhang and Huisingh, 2018) exemplify these efforts. Key technologies from these projects include efficient water resource management, techniques for sand prevention and control, and strategies for managing saline-alkaline land (Yue et al., 2022).
Despite its contributions, this study has certain limitations. The original spatial resolution of the ERA5 reanalysis meteorological data (9 km) differs from that of the MOD13A3 data (1,000 m). Although the meteorological data were resampled to 1,000 m, the spatial resolution of the ERA5-Land Monthly Aggregated datasets is indeed relatively coarse compared to the MOD13A3 NDVI data, which introduces limitations in the regression analysis. Additionally, the regression model for NDVI prediction considered only temperature and precipitation, which are dominant climatic factors in arid and semi-arid zones. Furthermore, temperature and precipitation data have high temporal and spatial resolution, and are consistent with the NDVI data, ensuring the reliability of the regression analysis. However, other factors such as wind speed, hours of sunshine, relative humidity, altitude, and slope also affect NDVI. Consequently, the residuals of NDVI likely reflect not only human impacts but also the influence of unaccounted factors. The 10-year study period may also limit the analysis of long-term trends. However, the primary objective of this research was to explore environmental changes in the CWAEC since the implementation of the Belt and Road Initiative (BRI). The findings provide valuable insights for comparative analyses of conditions before and after the policy’s implementation. Future studies could focus on core BRI areas, further incorporate more variables through multiple regression analysis or machine learning methods to comprehensively assess the combined effects of these factors on NDVI change, integrate land cover and vegetation type changes on longer time scales, downscale the spatial resolution of the ERA5-land product using more rigorous methods to enhance the accuracy of this data in climate change simulation, thereby providing a more complete understanding of the complex drivers of vegetation change in CWAEC.
Using MOD13A3 and meteorological data, this study investigated the evolution of NDVI trends and identified the dominant driving forces behind NDVI changes in seven countries along the CWAEC from 2013 to 2022. The key findings are as follows.
(1) The average spatial distribution of NDVI in the CWAEC from 2013 to 2022 showed a gradual decline from north to south, with an overall average NDVI value of 0.34. Over the decade, the region exhibited a downward trend, with an average rate of −0.26 × 10⁻2 a⁻1. The dominant change trend was non-significant degradation, accounting for 50.74% of the total changes.
(2) The combined effects of CC&HA were the primary drivers of NDVI variations. Negative impacts of CC included climate warming and drying, while positive impacts arose from warming and humidifying trends. Human activities had both detrimental effects, such as overgrazing, intensive agriculture, mineral resource extraction, and deforestation, and beneficial effects tied to ecological restoration initiatives. As for the future construction of the BRI, the ecological environment of arid areas can be improved through the efficient utilization and protection of water resources, sand suppression and saline-alkali land management.
(3) The impacts of CC and HA on NDVI changes exhibited significant spatial heterogeneity. Climate change primarily exerted negative impacts, with an average effect of −0.23 × 10⁻2 a⁻1, while HA contributed slightly more positive effects than negative ones, with an average impact of −0.95 × 10⁻4 a⁻1. The influence of CC on NDVI changes ranged from −0.40 × 10⁻2 a⁻1 in KAZ to 0.07 × 10⁻2 a⁻1 in KGZ. In contrast, the impact of HA ranged from −0.17 × 10⁻2 a⁻1 in TUR to 0.13 × 10⁻2 a⁻1 in IRN. Human activities contributed 54.78% to the relative impact on NDVI changes in the region, while CC accounted for 45.22%. KAZ and UZB experienced greater influence from CC, whereas in the other countries, HA had a more significant impact on NDVI changes than CC.
The original contributions presented in the study are included in the article/supplementary material, further inquiries can be directed to the corresponding authors.
KW: Data curation, Formal Analysis, Investigation, Methodology, Software, Validation, Visualization, Writing–original draft, Writing–review and editing. MX: Writing–review and editing, Project administration. SW: Writing–review and editing, Funding acquisition, Supervision. LW: Writing–review and editing, Resources. HT: Writing–review and editing, Methodology. SB: Writing–review and editing, Funding acquisition. XG: Formal Analysis, Writing–review and editing. XY: Investigation, Writing–review and editing. HG: Software, Writing–review and editing. JL: Validation, Writing–review and editing. YY: Visualization, Writing–review and editing. RH: Data curation, Writing–review and editing. YZ: Data curation, Writing–review and editing. CC: Supervision, Writing–review and editing.
The author(s) declare that financial support was received for the research, authorship, and/or publication of this article. This research was funded by Lhasa key technology plan project grant number LSKJ202407, Talent Introduction Program Youth Project of the Chinese Academy of Sciences grant number E43302020D and Research Funding for Academic Staff, Faculty of Social Sciences, Aimed at Publishing in International Journals, grant year: 2024–2025.
The authors declare that the research was conducted in the absence of any commercial or financial relationships that could be construed as a potential conflict of interest.
The author(s) declare that no Generative AI was used in the creation of this manuscript.
All claims expressed in this article are solely those of the authors and do not necessarily represent those of their affiliated organizations, or those of the publisher, the editors and the reviewers. Any product that may be evaluated in this article, or claim that may be made by its manufacturer, is not guaranteed or endorsed by the publisher.
Abuduwaili, J., Issanova, G., Saparov, G., Abuduwaili, J., Issanova, G., and Saparov, G. (2019). Water resources and impact of climate change on water resources in Central Asia. Hydrology and Limnology of Central Asia, 1–9.
AktüRK, E., and GüNEY, K. (2021). Vegetation cover change analysis of phytogeographic regions of Turkey based on CORINE land cover datasets from 1990 to 2018. Kastamonu Univ. J. For. Fac. 21, 150–164. doi:10.17475/kastorman.1000406
Ayan, S., YüCEDAĞ, C., and Simovski, B. (2021). A major tool for afforestation of semi-arid and anthropogenic steppe areas in Turkey: pinus nigra JF Arnold subsp. pallasiana (Lamb.) Holmboe. J. For. Sci. 67, 449–463. doi:10.17221/74/2021-jfs
Bashir, B., Cao, C., Naeem, S., Zamani Joharestani, M., Bo, X., Afzal, H., et al. (2020). Spatio-temporal vegetation dynamic and persistence under climatic and anthropogenic factors. Remote Sens. 12, 2612. doi:10.3390/rs12162612
Cai, B., and Yu, R. (2009). Advance and evaluation in the long time series vegetation trends research based on remote sensing. J. Remote Sens. 13, 1170–1186. doi:10.11834/jrs.20090614
Chen, T., Bao, A., Jiapaer, G., Guo, H., Zheng, G., Jiang, L., et al. (2019). Disentangling the relative impacts of climate change and human activities on arid and semiarid grasslands in Central Asia during 1982–2015. Sci. Total Environ. 653, 1311–1325. doi:10.1016/j.scitotenv.2018.11.058
Chen, T., Tang, G., Yuan, Y., Guo, H., Xu, Z., Jiang, G., et al. (2020). Unraveling the relative impacts of climate change and human activities on grassland productivity in Central Asia over last three decades. Sci. Total Environ. 743, 140649. doi:10.1016/j.scitotenv.2020.140649
Dastigerdi, M., Nadi, M., Sarjaz, M. R., and Kiapasha, K. (2024). Trend analysis of MODIS NDVI time series and its relationship to temperature and precipitation in Northeastern of Iran. Environ. Monit. Assess. 196, 346. doi:10.1007/s10661-024-12463-y
Evans, J., and Geerken, R. (2004). Discrimination between climate and human-induced dryland degradation. J. Arid Environ. 57, 535–554. doi:10.1016/s0140-1963(03)00121-6
Fan, D., Ni, L., Jiang, X., Fang, S., Wu, H., and Zhang, X. (2020). Spatiotemporal analysis of vegetation changes along the belt and road initiative region from 1982 to 2015. IEEE Access 8, 122579–122588. doi:10.1109/access.2020.3007073
Fan, Z., and Li, S. (2019). Change pattern of land cover and its driving force since 2001 in the new eurasian continental bridge economic corridor. Acta Ecol. Sin. 39, 5015–5027. doi:10.5846/stxb201903150492
Gao, X., Cao, C., Xu, M., Yang, X., Li, J., Duerler, R. S., et al. (2023). Ecological risk assessment of grassland vegetation change based on Bayesian model in Xilin Gol League, China. Ecol. Indic. 157, 111199. doi:10.1016/j.ecolind.2023.111199
Gong, Z., Peng, D. L., Wen, J. Y., Cai, Z. Q., Wang, T. T., Hu, Y. K., et al. (2017). Research on trend of warm-humid climate in Central Asia. 3rd Int. Symposium Earth Observation Arid Semi-Arid Environ. (ISEO), Sep 19-21 2016 Acad Sci Republ Tajikistan, Dushanbe, TAJIKISTAN 74, 012017. doi:10.1088/1755-1315/74/1/012017
Guo, H., Bao, A., Liu, T., Ndayisaba, F., Jiang, L., Kurban, A., et al. (2018). Spatial and temporal characteristics of droughts in Central Asia during 1966–2015. Sci. total Environ. 624, 1523–1538. doi:10.1016/j.scitotenv.2017.12.120
Hai, K., Wang, S., Tu, P., Yang, R., Ma, Y., Liang, J., et al. (2022). Spatio-temporal patterns and driving forces of recent(1992—2015) land cover change in countries along the Belt and Road Initiative. Natl. Remote Sens. Bull. 26, 1220–1235. doi:10.11834/jrs.20219201
Hoaglin, D. C., Mosteller, F., and Tukey, J. W. (2000). Understanding robust and exploratory data analysis. John Wiley & Sons.
Huang, Y. (2016). Understanding China's Belt & Road initiative: motivation, framework and assessment. China Econ. Rev. 40, 314–321. doi:10.1016/j.chieco.2016.07.007
Jiang, J., and Zhou, T. J. (2023). Agricultural drought over water-scarce Central Asia aggravated by internal climate variability. Nat. Geosci. 16, 154–161. doi:10.1038/s41561-022-01111-0
Jiang, W., Yuan, L., Wang, W., Cao, R., Zhang, Y., and Shen, W. (2015). Spatio-temporal analysis of vegetation variation in the yellow river basin. Ecol. Indic. 51, 117–126. doi:10.1016/j.ecolind.2014.07.031
Jin, K., Wang, F., Han, J., Shi, S., and Ding, W. (2020). Contribution of climatic change and human activities to vegetation NDVI change over China during 1982-2015. ACTA Geogr. SIN. 75. doi:10.11821/dlxb202005006
Kust, G. S., Durikov, M. K., Lobkovsky, V. A., Andreeva, O. V., Nepesov, M. D., Mamedov, B. K., et al. (2022). The scientific basis for the statement of achievement objectives for the land degradation neutrality in Turkmenistan. Arid. Ecosyst. 12, 441–454. doi:10.1134/s2079096122040114
Liu, W. (2015). Scientific understanding of the belt and road initiative of China and related research themes progress in geography, 34, 538–544.
Liu, Y., Wang, P., Gojenko, B., Yu, J. J., Wei, L. Z., Luo, D. G., et al. (2021). A review of water pollution arising from agriculture and mining activities in Central Asia: facts, causes and effects. Environ. Pollut. 291, 118209. doi:10.1016/j.envpol.2021.118209
Lunetta, R. S., Knight, J. F., Ediriwickrema, J., Lyon, J. G., and Worthy, L. D. (2022). Land-cover change detection using multi-temporal MODIS NDVI data. Geospatial Inf. Handb. Water Resour. Watershed Manag. Vol. II, 65–88. doi:10.1201/9781003175025-5
Mashizi, A. K., and Sharafatmandrad, M. (2020). Assessing ecological success and social acceptance of protected areas in semiarid ecosystems: a socio-ecological case study of Khabr National Park, Iran. J. Nat. Conservation 57, 125898. doi:10.1016/j.jnc.2020.125898
Masson-Delmotte, V., Zhai, P., Pirani, A., Connors, S. L., PéAN, C., Berger, S., et al. (2021). Climate change 2021: the physical science basis. Contribution of working group I to the sixth assessment report of the intergovernmental panel on climate change, 2, 2391.
Mutlu, B. (2019). The effect of afforestation on biodiversity in malatya, Turkey. Appl. Ecol. Environ. Res. 17, 12787–12798. doi:10.15666/aeer/1706_1278712798
Naboureh, A., Li, A., Bian, J., Lei, G., and Nan, X. (2023). Land cover dataset of the China central-asia west-asia economic corridor from 1993 to 2018. Sci. Data 10, 728. doi:10.1038/s41597-023-02623-z
Niu, L., Shao, Q., Ning, J., Liu, S., Zhang, X., and Zhang, T. (2023). The assessment of ecological restoration effects on Beijing-Tianjin Sandstorm Source Control Project area during 2000–2019. Ecol. Eng. 186, 106831. doi:10.1016/j.ecoleng.2022.106831
Ren, Y., Yu, H., Liu, C., He, Y., Huang, J., Zhang, L., et al. (2022). Attribution of dry and wet climatic changes over central Asia. J. Clim. 35, 1399–1421. doi:10.1175/jcli-d-21-0329.1
Ruan, H., and Yu, J. (2019). Changes in land cover and evapotranspiration in the five Central Asian countries from 1992 to 2015. Acta Geogr. Sin. 74, 1292–1304. doi:10.11821/dlxb201907002
Sen, P. K. (1968). Estimates of the regression coefficient based on Kendall's tau. J. Am. Stat. Assoc. 63, 1379–1389. doi:10.2307/2285891
Sivakumar, M. V. K. (2007). Interactions between climate and desertification. Agric. For. Meteorology 142, 143–155. doi:10.1016/j.agrformet.2006.03.025
Sun, W., Song, X., Mu, X., Gao, P., Wang, F., and Zhao, G. (2015). Spatiotemporal vegetation cover variations associated with climate change and ecological restoration in the Loess Plateau. Agric. For. Meteorology 209-210, 87–99. doi:10.1016/j.agrformet.2015.05.002
Tian, H., Huang, W., Wang, L., Fan, Y., Zhao, H., Huang, W., et al. (2024). Evaluation on the contribution of the policy of grazing constraint and grassland conservation for 20 Years to grassland vegetation restoration in ningxia. Acta Agrestia Sin. 32, 37–45. doi:10.11733/j.issn.1007-0435.2024.01.004
Wang, F., Ding, J., and Wei, Y. (2017). Analysis of drought characteristics over countries and regions of “the Belt and Road Initiatives” in recent one hundred years. J. Geogr. Sci. 19, 1442–1455. doi:10.3724/SP.J.1047.2017.01442
Wang, K., Cao, C., Xie, B., Xu, M., Yang, X., Guo, H., et al. (2022). Analysis of the spatial and temporal evolution patterns of grassland health and its driving factors in xilingol. Remote Sens. 14, 5179. doi:10.3390/rs14205179
Wang, Y., He, J., He, L., Zhang, Y., and Zhang, X. (2024). Vegetation phenology and its response to climate change in the Yellow River Basin from 2001 to 2020. Acta Ecol. Sin. 44, 844–857. doi:10.20103/j.stxb.202302220311
Wei, Y., Sun, S., Liang, D., and Jia, Z. (2022). Spatial-temporal variations of NDVI and its response to climate in China from 2001 to 2020. Int. J. DIGITAL EARTH 15, 1463–1484. doi:10.1080/17538947.2022.2116118
Wessels, K. J., Prince, S. D., Malherbe, J., Small, J., Frost, P. E., and Vanzyl, D. (2007). Can human-induced land degradation be distinguished from the effects of rainfall variability? A case study in South Africa. J. Arid Environ. 68, 271–297. doi:10.1016/j.jaridenv.2006.05.015
Wu, S., Liu, L., Liu, Y., Gao, J., Dai, E., and Feng, A. (2018). Geographical patterns and environmental change risks in terrestrial areas of the Belt and Road. Acta Geogr. Sin. 73, 1214–1225. doi:10.11821/dlxb201807003
Xie, B., Cao, C., Xu, M., Duerler, R. S., Yang, X., Bashir, B., et al. (2021). Analysis of regional distribution of tree species using multi-seasonal sentinel-1&2 imagery within google earth engine. Forests 12, 565. doi:10.3390/f12050565
Xl, J. (2017). Work together to build the silk road economic belt and the 21st century maritime silk road. Opening Ceremony of the Belt and Road Forum for International Cooperation. Beijing, 2017.
XI, L., Qi, Z., Cao, X., Cui, M., Zou, J., and Feng, Y. (2024). Impact analysis of vegetation FVC changes and drivers in the ring-tarim basin from 1993 to 2021. Remote Sens. 16, 2625. doi:10.3390/rs16142625
Xu, H., Wang, X., Zhao, C., and Zhang, X. (2019). Responses of ecosystem water use efficiency to meteorological drought under different biomes and drought magnitudes in northern China. Agric. For. Meteorology 278, 107660. doi:10.1016/j.agrformet.2019.107660
Xu, X., Liu, H., Jiao, F., Gong, H., and Lin, Z. (2020). Time-varying trends of vegetation change and their driving forces during 1981–2016 along the silk road economic belt. CATENA 195, 104796. doi:10.1016/j.catena.2020.104796
Xu, X., Liu, H., Jiao, F., Gong, H., and Lin, Z. (2021). Nonlinear relationship of greening and shifts from greening to browning in vegetation with nature and human factors along the Silk Road Economic Belt. Sci. Total Environ. 766, 142553. doi:10.1016/j.scitotenv.2020.142553
Yang, Y., Bai, X., Tan, Q., Luo, G., and Shiqi, T. (2020). Analysis of the spatiotemporal evolution of NDVI and its influencing factors in the “belt and road” region from 1982 to 2015. Mt. Res. 38, 252–264. doi:10.16089/j.cnki.1008-2786.000507
YıLDıZ, O., Eşen, D., SargıNCı, M., Çetin, B., Toprak, B., and DöNMEZ, A. H. (2022). Restoration success in afforestation sites established at different times in arid lands of Central Anatolia. For. Ecol. Manag. 503, 119808. doi:10.1016/j.foreco.2021.119808
Yu, Z. X., Zhang, Y. C., Wang, P., Yu, J. J., Wang, T. Y., and Shi, S. Y. (2023). Detection of the nonlinear response of vegetation to terrestrial water storage changes in central Asian endorheic basins. Ecol. Indic. 154, 110901. doi:10.1016/j.ecolind.2023.110901
Yue, L., Shi, Q., and Jingjing, L. (2022). Research on ecological restoration technology in arid or semi-arid areas from the perspective of the belt and road initiative. J. Resour. Ecol. 13, 964–976. doi:10.5814/j.issn.1674-764x.2022.06.002
Zandler, H., Senftl, T., and Vanselow, K. A. (2020). Reanalysis datasets outperform other gridded climate products in vegetation change analysis in peripheral conservation areas of Central Asia. Sci. Rep. 10, 22446. doi:10.1038/s41598-020-79480-y
Zhang, C., Hu, Y., and Shi, X. (2016). Analysis of spatial-temporal evolution of vegetation cover in loess Plateau in recent 33 Years based on AVHRR NDVI and MODIS NDVI. J. Appl. Sci. 34, 702–712. doi:10.3969/j.issn.0225-8297.2016.06.006
Zhang, D., Wu, L., Huang, S., Zhang, Z., Ahmad, F., Zhang, G., et al. (2021). Ecology and environment of the Belt and Road under global climate change: a systematic review of spatial patterns, cost efficiency, and ecological footprints. Ecol. Indic. 131, 108237. doi:10.1016/j.ecolind.2021.108237
Zhang, Z., and Huisingh, D. (2018). Combating desertification in China: monitoring, control, management and revegetation. J. Clean. Prod. 182, 765–775. doi:10.1016/j.jclepro.2018.01.233
Zhou, B., Xu, Y., Han, Z., Shi, Y., Wu, J., and Li, R. (2020). CMIP5 projected changes in mean and extreme climate in the Belt and Road region. Trans. Atmos. Sci. 43, 255–264. doi:10.13878/j.cnki.dqkxxb.20191125009
Zhu, J., and Zheng, X. (2019). The prospects of development of the Three-North Afforestation Program (TNAP): on the basis of the results of the 40-year construction general assessment of the TNAP. Chin. J. Ecol. 38, 1600. doi:10.13292/j.1000-4890.201905.038
Keywords: central and west asia, multivariate regression residual analysis, driving forces, NDVI change, belt and road initiatives, climate change, human activities
Citation: Wang K, Xu M, Wang S, Wang L, Tian H, Boonprong S, Gao X, Yang X, Guo H, Li J, Yang Y, Hu R, Zhang Y and Cao C (2025) Spatiotemporal patterns and driving factors of NDVI changes in the central and Western Asia economic corridor over the past decade. Front. Environ. Sci. 13:1546190. doi: 10.3389/fenvs.2025.1546190
Received: 16 December 2024; Accepted: 16 January 2025;
Published: 31 January 2025.
Edited by:
Sawaid Abbas, University of the Punjab, PakistanCopyright © 2025 Wang, Xu, Wang, Wang, Tian, Boonprong, Gao, Yang, Guo, Li, Yang, Hu, Zhang and Cao. This is an open-access article distributed under the terms of the Creative Commons Attribution License (CC BY). The use, distribution or reproduction in other forums is permitted, provided the original author(s) and the copyright owner(s) are credited and that the original publication in this journal is cited, in accordance with accepted academic practice. No use, distribution or reproduction is permitted which does not comply with these terms.
*Correspondence: Min Xu, eHVtaW5AYWlyY2FzLmFjLmNu
Disclaimer: All claims expressed in this article are solely those of the authors and do not necessarily represent those of their affiliated organizations, or those of the publisher, the editors and the reviewers. Any product that may be evaluated in this article or claim that may be made by its manufacturer is not guaranteed or endorsed by the publisher.
Research integrity at Frontiers
Learn more about the work of our research integrity team to safeguard the quality of each article we publish.