 Ya’nan Zhou1,2*
 Jinke He
 Binyao Wang
 Yuehong Chen
 Lingzhan Miao
94% of researchers rate our articles as excellent or good
Learn more about the work of our research integrity team to safeguard the quality of each article we publish.
Find out more
ORIGINAL RESEARCH article
Front. Environ. Sci., 20 February 2025
Sec. Water and Wastewater Management
Volume 13 - 2025 | https://doi.org/10.3389/fenvs.2025.1544078
Quantifying the impact of landscape metrics on water quality can offer scientific supports for water conservation and land use planning. However, previous studies mainly relied on coarse land use maps, and were lack of understanding of effects from physiographic metrics. Here, based on the in-situ water quality monitoring data in the Fujiang river basin, we used redundancy analysis, variation partitioning analysis, and Shapley Additive exPlanations methods to assess the impact of landscape metrics on water quality. We use these analyses in the dry and wet season, in circular buffer zone, in riparian buffer zone, and at the sub-basin scale, we are able to analyze and understand the complex interactions between landscape features and water quality, as well as spatial and temporal scale effects. The results indicated that the impact of landscape metrics on water quality variation can be ranked in the following order: landscape composition (15.8%–32.2%) > landscape configuration (1.2%–19.5%)> physiographic metrics (−2.0%-0.6%). Forests and grasslands improved water quality, whereas farmland and impervious surfaces degraded water quality. At a finer scale of land use types, closed broadleaf evergreen forests improved water quality, while rainfed cropland had the opposite effect. The 1500 m circular buffer was the key scale with the highest rate of interpretation. The relationship between landscape metrics and water quality was marginally stronger during the wet season than the dry season. Water quality was improved by large relief amplitude and slope standard deviation. The water quality is not significantly affected by the river network density, the length of the river, or the basin area. These conclusions could provide science-informed information and support to the study between landscape metrics and water quality.
Water is universally recognized as the most crucial natural resource (Shi et al., 2017). Nevertheless, due to the intensified anthropogenic activities, the decline in water quality has become an almost unavoidable worldwide ecological issue (Basu et al., 2022; Li et al., 2022). Water quality is affected by the interaction of various natural and human factors, including pollutant discharges, changing climate, land cover, land use intensity, and various anthropogenic activities (Ai et al., 2015; Naderian et al., 2024; Li et al., 2022; Lausch et al., 2025). Anthropogenic activities, especially agricultural practices and rapid urbanization, have caused a growing shift of vegetated landscapes into agricultural and urban regions (Peng and Li, 2021). This shift has exacerbated the decline in water quality in most regions of the world. Most of the damage to water quality originates from non-point source (NPS) pollution caused by farming production (Xu et al., 2022a) and point source (PS) pollution caused by urban living and production (Zhou et al., 2016). However, at a large watershed scale, the degradation of water quality (especially surface water) is spatially and temporally variable, and is determined by various factors, including topography, hydrology, land use, and other related variables (Liu et al., 2016; Shen et al., 2014; Ongley et al., 2010). Therefore, it is vital to comprehend the quantitative connections between land use and water quality for efficiently manage watersheds and water quality conservation.
Much research effort has been devoted to understand and quantify the relationship between land use and surface water quality. In terms of land use indicators, initial research linked the chemical composition of water to various land use types within a stream basin (Donohue et al., 2006).These studies suggested that urbanization, arable land, and pastureland are the main factors affecting river water quality. Recently, with the development of earth observation techniques and landscape ecology, more and more studies are attempting to quantify the impacts of land use on water quality using more integrated indicators of landscape structure. Landscape structure mainly consist of landscape compositions and landscape configurations. Landscape compositions mainly refer to the relative proportions of different landscape types, and landscape configurations, pertain to the geographical distribution of various types of landscape (Xu et al., 2021; Shu et al., 2022). For instance, only the effects of landscape composition on water quality were considered in some studies (Wang et al., 2023; Sun et al., 2023), and they found that the land use types cropland, woodland, and urban area, showed negative impacts to water quality, whereas grassland has been associated with positive impacts on water quality. In addition, Shi et al. (2017) and Shu et al. (2022) considered the effects of both landscape composition and landscape configuration on water quality, the conclusion show that both landscape composition and landscape configuration have important effects on water quality. However, at a larger watershed scale, spatial variability in surface properties, local physiographic metrics, such as elevation, slope, basin area, magnitude of relief amplitude (HD), and topographic wetness index (TWI), also can contribute to differences in water quality (Xu et al., 2023; Wu and Lu, 2021; Alakbar and Burgan, 2024). However, these factors have not been properly discussed in previous studies. At the same time, the river network (which can be quantitively expressed as river network density, RND) as the flowing structure of the watershed, also have an impact on water quality. Thus, it is necessary to incorporate the RND into water quality analyses.
Furthermore, regarding landscape composition, the majority of studies grouped land use types into broad categories such as farmland, forestland, grassland, and residential land (Caldwell et al., 2023; Xu et al., 2021). However, it is known that there are many subtypes under these coarse divisions. For example, forestland includes mixed forest and deciduous forest, which show different impacts for water quality (Wang et al., 2020). And farmland also includes paddy field and dry land crop field (Wang et al., 2020).Therefore, Some studies have suggested that, a more comprehensive categorization of landscape types would likely provide a more accurate representation of how landscape compositions impacts the water quality (Xu et al., 2021).
As an integrated reflection of multi-scale landscape structure, watershed water quality is responsive to seasonal and spatial scales (Li et al., 2018; Zhang et al., 2018). Therefore, spatial and temporal scale is another issue when understanding the impacts from landscape metrics on water quality, due to spatial-temporal heterogeneity in water quality and landscape. In the current study, sub-basin and buffer scales are widely utilized, additionally, the buffer zone can be classified into riparian buffer zone and circular buffer zone (Wu and Lu, 2021). However, there is not a consensus among researchers on the best scale to use to describe variation in water quality (Xu et al., 2021; Cheng et al., 2023). Some researchers contended that land use at buffer scale provided more precise forecasts of water quality (Xu et al., 2021; Cheng et al., 2023; Wu and Lu, 2021). Conversely, others maintained that land use at the sub-basin scale could offer a more thorough depiction of information (Ding et al., 2016). Furthermore, the optimal buffer widths were inconsistent. For riparian buffer zone scale, the results for optimal riparian buffer zone widths ranged from 100, 300–2,000 m (Xu et al., 2021; Wang et al., 2024; Cheng et al., 2023). The varied results can be due to the distinct features of each watershed, which have an impact on water quality. Therefore, it is imperative to conduct more studies in different study areas and at different scales to quantify the impacts of landscape metrics on water quality.
Although encouraging and important findings have been produced in the previous studies, there are several limitations that need to be explored further: (1) the absence of comprehensive investigation of fine-grained land use on water quality, (2) the influence of natural physiographic properties of the watershed on water quality needs to be further investigated, and (3) the optimal scale for interpreting landscape impacts on water quality has not yet been harmonized.
In this study, we try to quantify the multi-scale contributions of fine-grained landscape and physiographic metrics to water quality in the Fujiang river basin, which is situated in the upper region of the Yangtze River with high-intensity agricultural activities. Initially, we analyzed spatial-temporal variations in water quality, landscape composition, and landscape configuration. Secondly, the impact of different metrics on water quality was explored through redundancy analysis and the optimal scale was determined. Furthermore, the contribution of the three types of metrics to water quality was quantified through variation partitioning analysis. Lastly, in addition to the traditional statistical methodology, the explanatory rates of the different factors on water quality were investigated through the Shapley Additive exPlanations (SHAP) method. Compared to previous studies, the contributions of this study are as follows: (1) fine-grained land use data was employed to examine the correlation between landscape and water quality, especially, rainfed cropland, irrigated cropland, open forest, closed forest. This is a lack of discussion in previous studies, and the use of fine-grained land use maps is precisely the novelty of this study. (2) we considered combined effects of landscape and physiographic metrics (particularly river network density) on water quality. (3) identify the spatial scale effects and seasonal variations of the influence of landscape metrics on water quality, and determine the scale at which landscape metrics best reflects water quality.
The Fujiang river basin (FRB), mainly in central Sichuan Province, China (29°30′to 33°05′N, 103°44′to 106°16′E), is one of the most ecologically fragile areas in the upper reaches of the Yangtze River (Wang et al., 2020; Wang et al., 2024) (Figure 1). It covers an area of 35,509 km2, and the elevation above sea level ranges from 180 to 5,502 m. The upper reaches of the FRB are at a high altitude, and the middle and lower reaches are dominated by hilly landscapes with low forest cover and serious soil erosion. The FRB is dominated by the subtropical monsoon climate, which is characterized by an average annual temperature of 17.9°C, an average annual precipitation of 1,102 mm, an average wind speed of 1.28 m/s, and relative humidity of 77.3%. Since more over half of the total precipitation falls in the summer, the year may be divided into two seasons: the wet (June to August) and the dry (September to May).
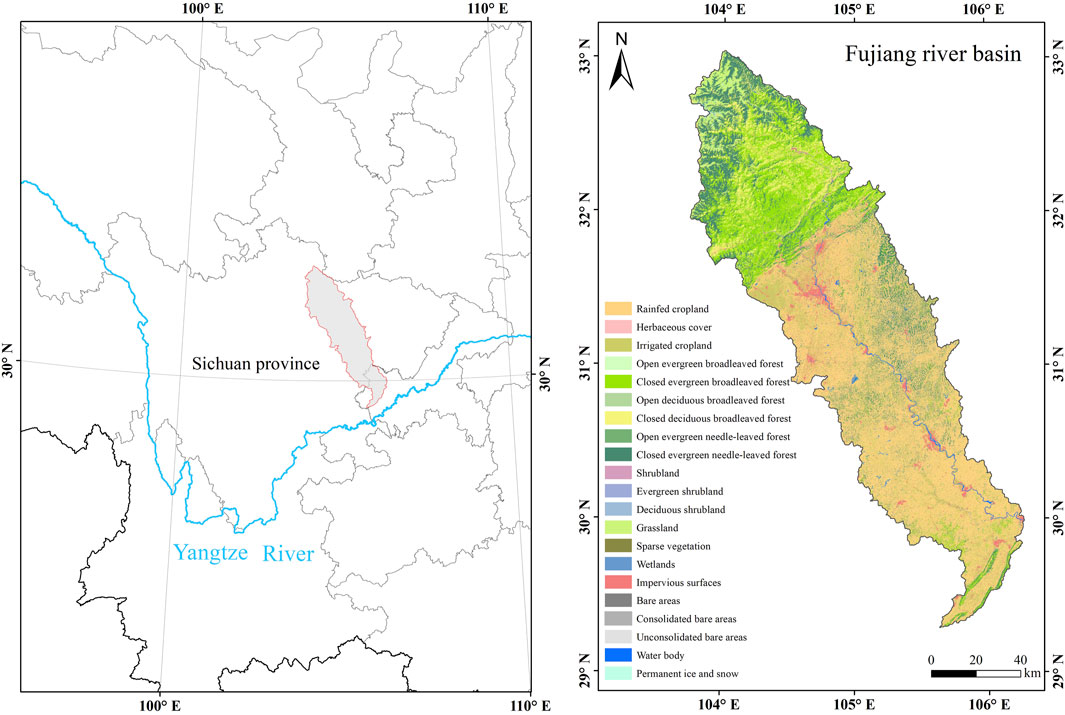
Figure 1. The location and land use map of the FRB.
Generally, the FRB has the largest proportion of cropland. The upper reaches are dominated by forested land with high vegetation cover, while the middle and lower reaches dominated by cropland and construction land.
In the FRB, unique natural conditions, including abundant rainfall, hilly and mountainous topography, and soil erosion, provide the foundation and possibility for NPS pollution. Additionally, the dense agricultural population, well-developed agricultural activities and rough production patterns in FRB (Zhang et al., 2016) further contribute to the severe deterioration of river water quality. Therefore, the FRB is an ideal area for analyzing the multiscale impacts of landscape metrics on water quality based on fine-grained land use maps.
The data used in the study are described in Table 1. Monthly averages were calculated for the water quality data. And we used Kolmogorov-Smirnov test to assess the normality of water quality data in SPSS. We extracted the land use data separately according to different scales and calculated Landscape configuration metrics. DEM data were extracted based on the extent of the study area. We extracted Sub-basin boundaries within the study area and calculated the basin area. We counted vector lengths of river network data in the study area. These data processing operations are performed in ArcGIS.
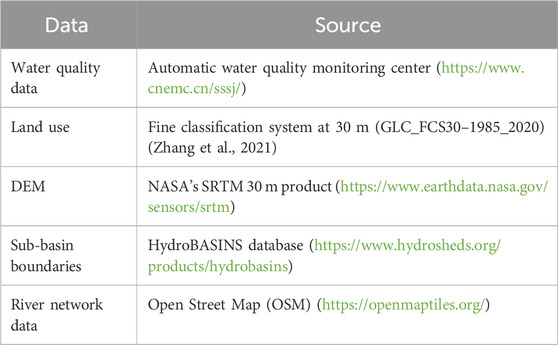
Table 1. Datasets for quantifying the relationship between water quality and landscape metrics.
In this study, water quality data at 14 sampling sites (Figure 2A) was obtained from the National Surface Water Quality Automatic Monitoring System (https://szzdjc.cnemc.cn:8070/GJZ/Business/Publish/Main.html). The dataset covers the period from June 2017 to May 2022. The detailed records primarily consisted of water quality parameters, including dissolved oxygen (DO), chemical oxygen demand (COD), permanganate index (CODmn), biochemical oxygen demand (BOD), ammonia nitrogen (NH4+-N), total nitrogen (TN), and total phosphorus (TP). DO, NH4+-N, and CODmn, measurement by electrode method, TN and TP are measured photometrically, BOD is measured using the microbial membrane method (The National Standards of the People’s republic of China: environmental quality Standards for surface Water (GB 3838-2002)). These data were recorded six times per day. To further eliminate noise, the monthly average of each water quality parameters was calculated to express changes in water quality.
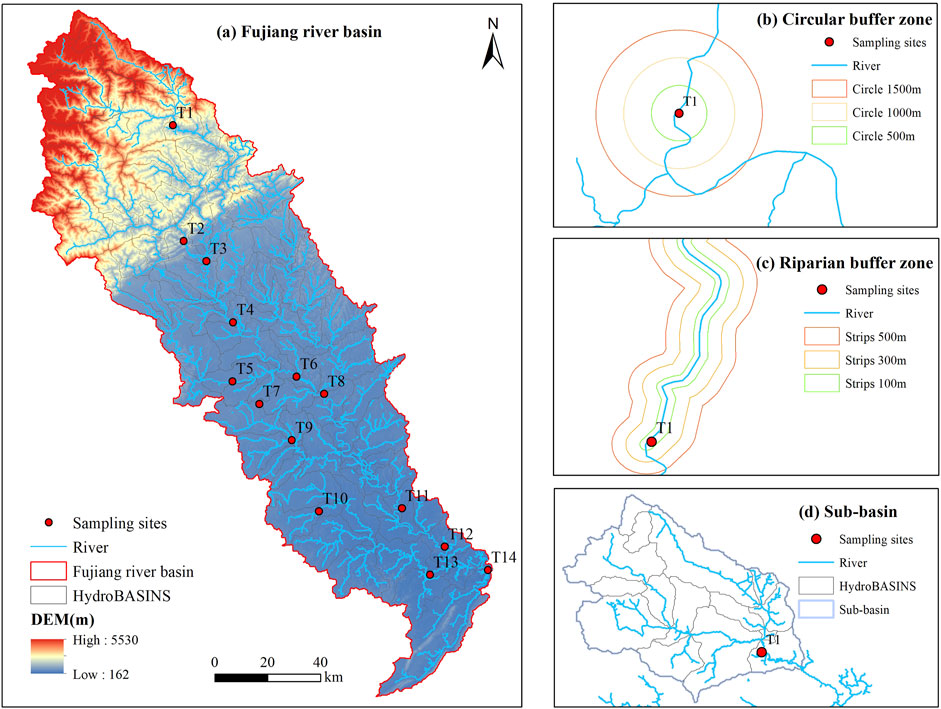
Figure 2. The digital elevation model (DEM) and distribution of the 14 sampling sites of the FRB (A), and schematic diagrams of the three scales used in this study: (B) circular buffer zone (the widths of buffer zones included 500, 1,000, 1,500 m); (C) riparian buffer zone (the widths of buffer zones included 100, 300, 500 m); and (D) sub-basin (the entire catchment upstream from the sampling site).
To measure the multi-scale impacts from landscape metrics on water quality, three types of spatial buffers were employed, including circular buffer zones, riparian buffer zones and the sub-basin regions (Figures 2B–D). After comprehensively considering the optimal buffer scales of previous studies (Dou et al., 2022; Cheng et al., 2023; Xu et al., 2021), for the circular buffer zones, we established three buffer zones centered on monitoring stations, each with widths of 500, 1,000 and 1,500 m (Figure 2B). In riparian buffer zones, we constructed three buffer zones with a buffer radius of 100,300 and 500 m, with the central line of the river as the central axis (Figure 2C). And for the sub-basin regions, these include the entire catchment upstream from the sampling site (Figure 2D).
The landscape metrics we established can be categorized into three groups: landscape composition, landscape configuration and physiographic metrics. The landscape composition metrics contains the percentages of rainfed cropland (RC), herbaceous cover (HC), irrigated cropland (IC), open evergreen broadleaved forest (FORoeb), closed evergreen broadleaved forest (FORceb), closed deciduous broadleaved forest (FORcdb), closed evergreen needle-leaved forest (FORcen), grassland (GRA), wetlands (WET), impervious surfaces (IS), and water body (WAT). The landscape configuration consists of patch density (PD), largest patch index (LPI), landscape shape index (LSI), contagion index (CONTAG), proportion of like adjacencies (PLADJ), patch cohesion index (COHESION), and Shannon’s diversity index (SHDI)were calculated at the landscape level using the FRAGSTAT 4.2 software. The physiographic metrics includes relief amplitude (HD), slope standard deviation (Slope_sd) and topographic wetness index (TWI), at the riparian buffer zone scale it also includes river length (RL) and buffer zone area (AREA), at the sub-basin scale it also includes river network density (RND). Table 2 contained a list of each landscape category’s individual metrics.
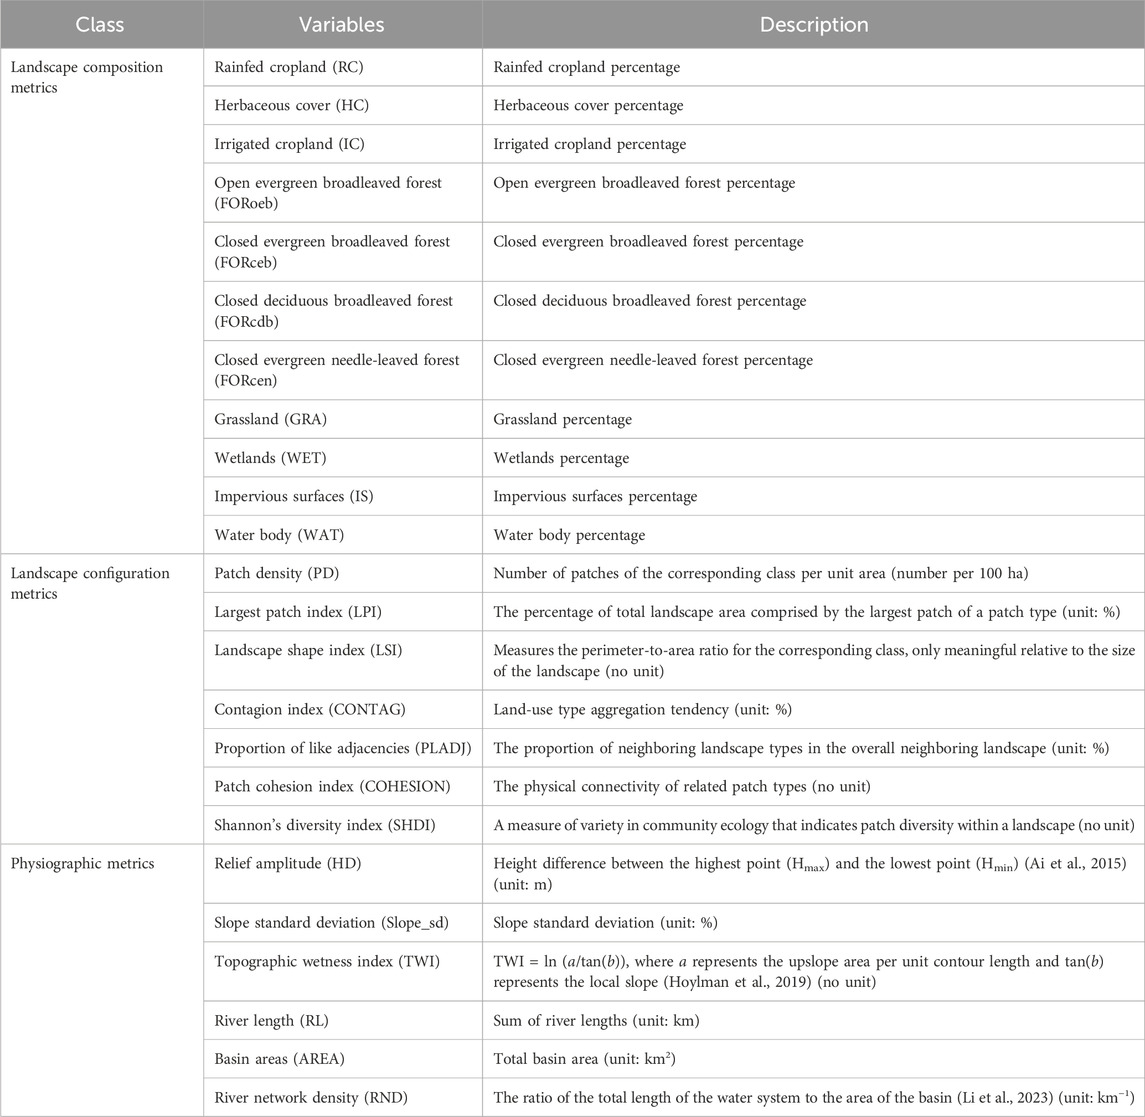
Table 2. Variables and descriptions of the landscape metrics.
We employed the Kolmogorov-Smirnov test to assess the normality of water quality data. Due to the non-normal distribution of the data, the Mann-Whitney test was employed to assess the disparity in water quality across various seasons. In order to exclude covariance between metrics, the collinearity among explanatory variables was assessed using a variance inflation factor (VIF). When the VIF value is less than 10, there is no collinear relationship between the explanatory variables (Ding et al., 2016).
Redundancy analysis (RDA) is commonly used to ascertain the correlation between environmental factors and landscape features (Shi et al., 2017). Detrended correspondence analysis (DCA) was first performed to decide whether to use a linear or unimodal models. The results of DCA indicated that the maximum length of the gradient for the four ordination axes was below 3. Consequently, this study employed the RDA method to evaluate the connections between water quality and landscape metrics at multiple scales.
The variation partitioning analysis (VPA) method was employed to evaluate the proportional impacts of three types of landscape metrics on variations in water quality. Specifically, important landscape compositions, landscape configuration and physiographic metrics were selected at the spatial scales that had the greatest rates of interpretation. In order to fully consider the differences at different scales, the scale with the highest impacts under each scale division was selected, and the 1,500 m circular buffer zone scale, and the sub-basin were selected for further VPA analysis.
Shapley Additive exPlanations (SHAP) was created to provide a more efficient and consistent interpretation of machine learning models that aligns with human intuition (Lundberg and Lee, 2017). Research has demonstrated that the SHAP method is an effective machine learning model interpreter (Wang et al., 2021). As a game-theoretic methodology, SHAP can assess the significance of feature in machine learning models. Based on its marginal contribution, each feature’s share of the model’s output was assigned. Several studies have successfully used the SHAP method to offer a credible explanation of the relationship between land use and water quality (Zhang et al., 2022; Liu et al., 2025). The SHAP method incorporating XGBoost models was employed in this study. A greater SHAP value indicates a more pronounced influence. When the SHAP value is positive, it signifies that the feature acts as a positive force, contributing to the increase in the concentration of water quality parameters. The flow chart of this study is shown in Figure 3.
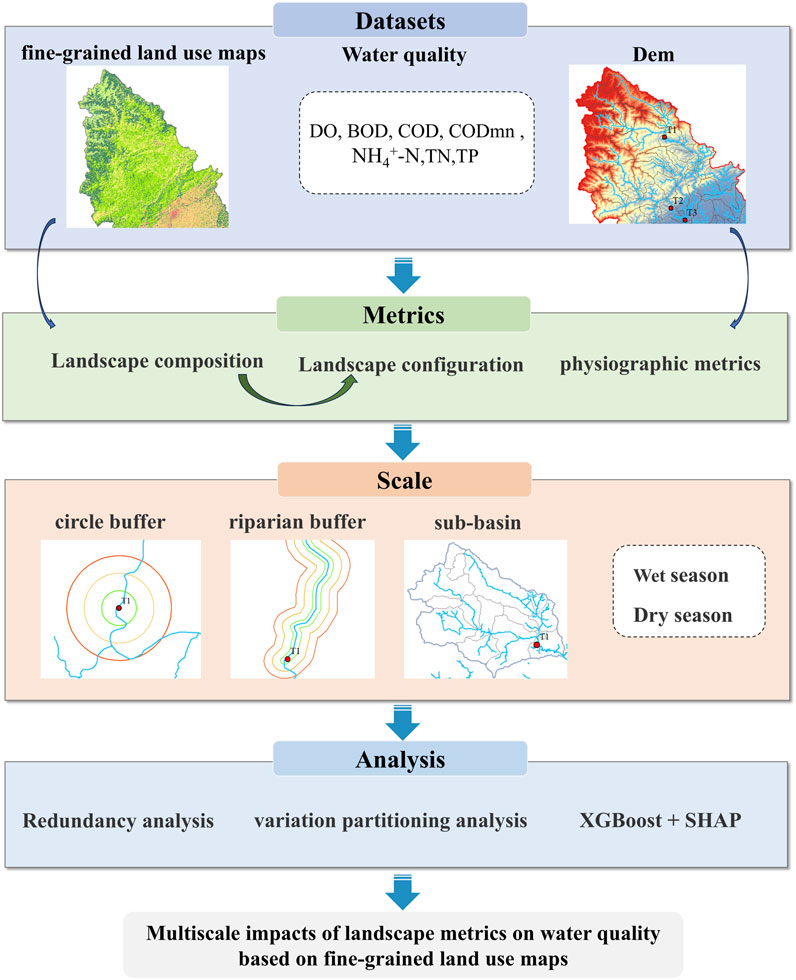
Figure 3. Water quality parameters of wet and dry season from 14 sampling sites in the FRB, including DO, COD, CODmn, BOD, NH4+-N, TN, and TP variables.
Figure 4 illustrates the differences in water quality metrics between the dry and wet seasons in the FRB. According to the Mann-Whitney test, the majority of water quality parameters exhibited significant seasonal fluctuations (p < 0.05), with the exception of BOD, NH4+-N, and TP. In most cases, concentrations of CODmn, COD, and TN tended to increase during the wet season, where concentrations of DO and TP were higher during the dry season.
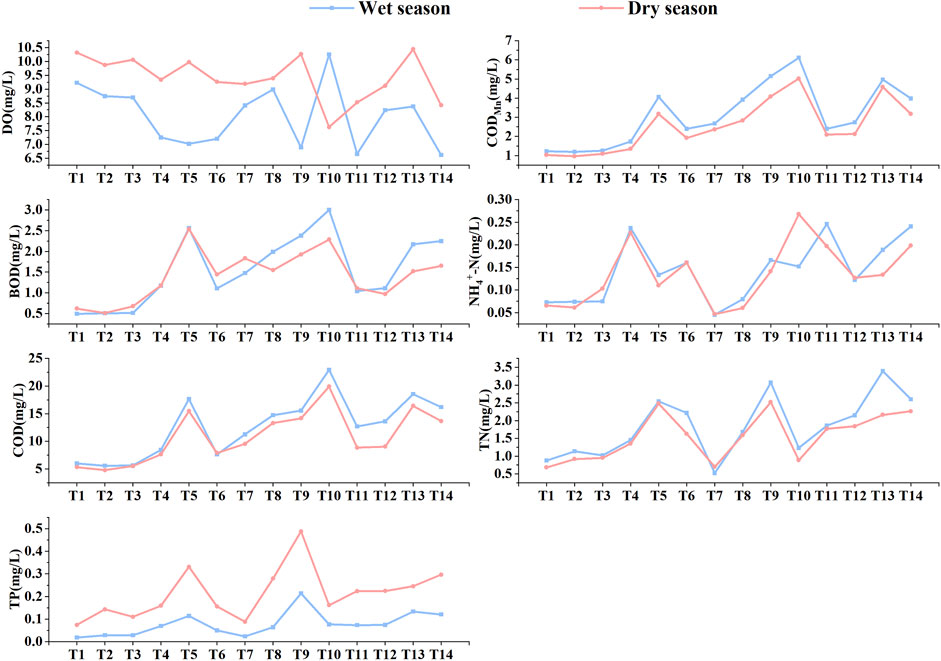
Figure 4. Landscape configuration metrics (PD, LPI, LSI, CONTAG, PLADJ, COHESION, and SHDI) at scales ranging from the buffer zone to sub-basin.
The primary landscape types at the circular buffer zone size were farmland (including rainfed and irrigated cropland), woodland (including closed evergreen broadleaved forest, closed deciduous broadleaved forest, and closed evergreen needle-leaved forest), impermeable surfaces, and water bodies (Table 3). As the buffer distance increased at the circular buffer zone, there was an increase in the proportion of farmland and a decrease in the proportion of forest land, impermeable surfaces, and water bodies. The primary landscape types seen at the riparian buffer zone size were farmland, grassland, and impervious surfaces. With an increase in the buffer distance at the riparian buffer zone, there was a corresponding rise in the proportion of forest land, while the proportions of farming, grassland, impermeable surfaces, and water bodies declined. Farmland and forest were the primary landscape types at the sub-basin scale.
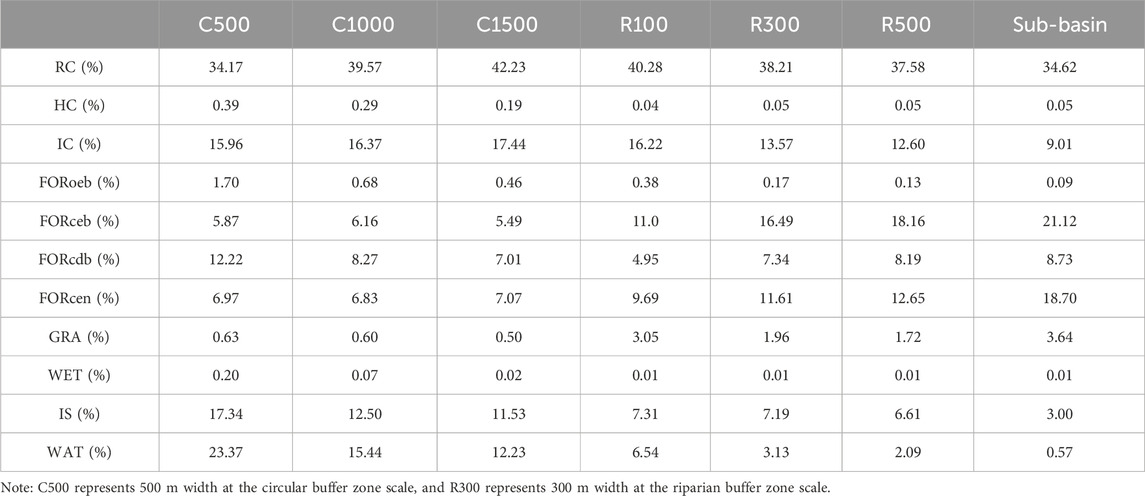
Table 3. Landscape composition at different scales.
Figure 5 displays the values of seven landscape configuration metrics across the seven distinct regional division levels. LPI, PLADJ, and COHESION metrics were lowest at the 100 m width of the riparian buffer zone, and increased with increasing buffer zone width. At buffer scale, CONTAG, PLADJ, and COHESION metrics increased with buffer width, while PD metrics are the opposite, decreasing with buffer width.
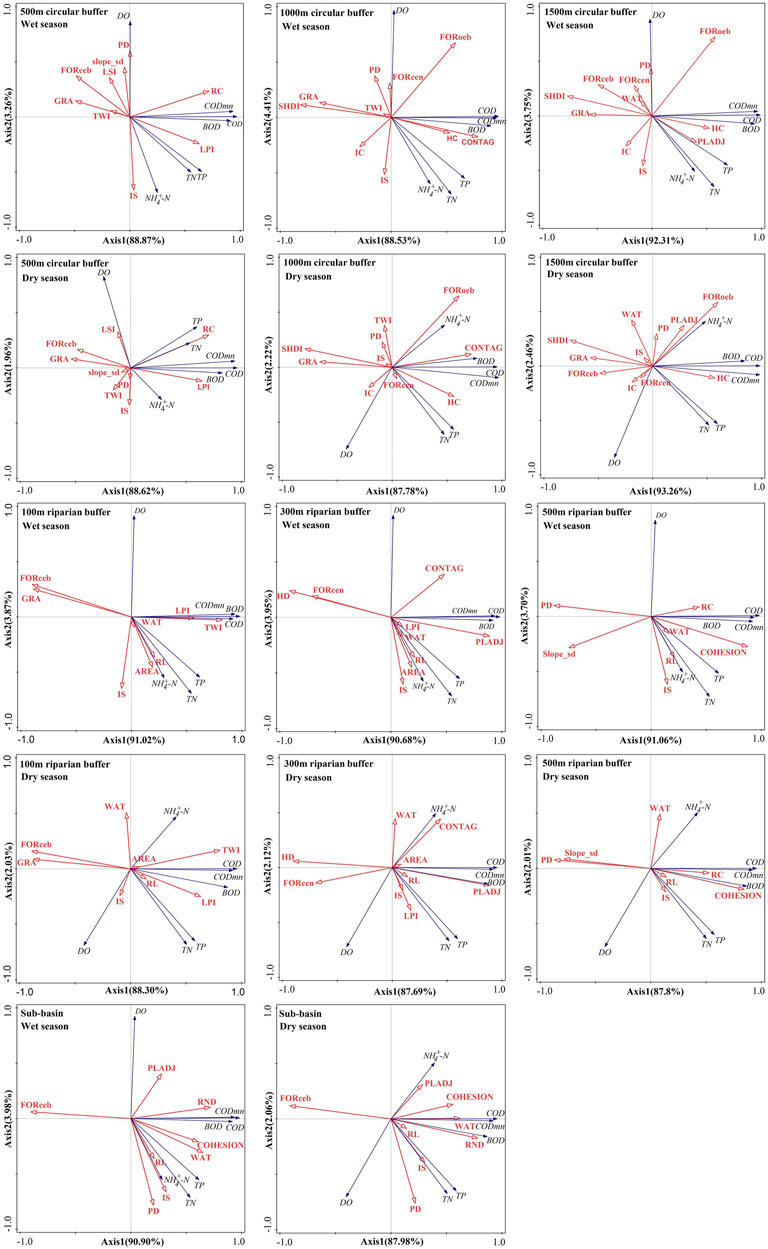
Figure 5. Redundancy analysis (RDA) was used to examine the connection between water quality parameters (shown by blue lines) and landscape metrics (represented by red lines) at different seasons and spatial scales.
The RDA assessed the impact of landscape metrics on water quality (Figure 6; Table 4). Most of the water quality variation was accounted for the first two axes. In the wet season, landscape metrics accounted for over 93.26% of the variations in water quality. However, this explanation decreased by 0.23%–4.62% during the dry season. 91.27%–97.34% changes in water quality can be determined by landscape metrics at the circular buffer zone scale. The explanation dropped to 91.12%–95.70% at the sub-basin zone. At the riparian buffer zone scale, the explanation dropped to 90.76%–95.69%. Landscape metrics at the circular buffer zone scale provides a more reliable representation of changes in water quality compared to the riparian buffer zone and sub-basin scale. Additionally, these landscape metrics have a greater impact when it rains.
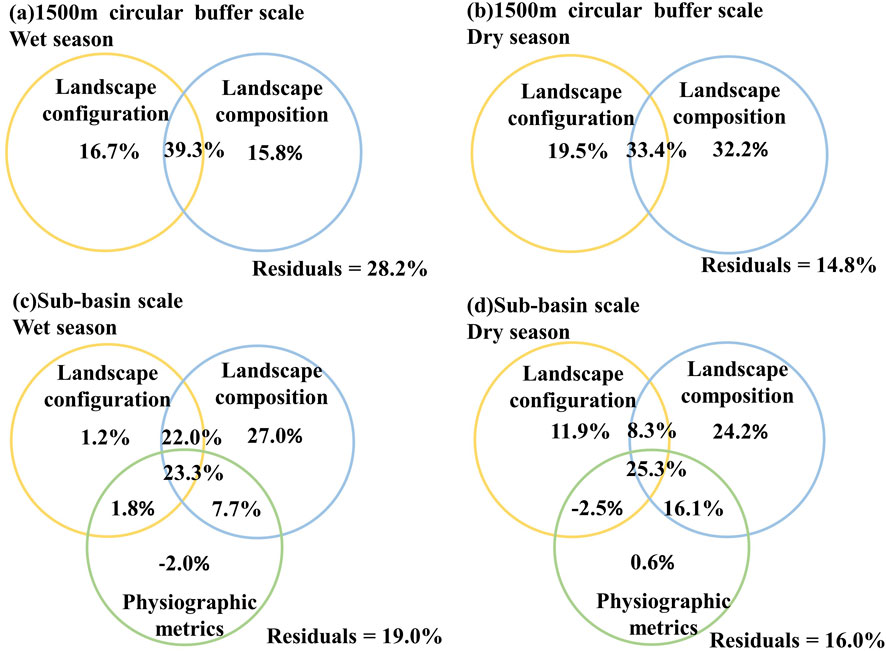
Figure 6. The results of the variation partitioning analysis (VPA) show how much of the total variation in water quality can be accounted by landscape composition, landscape configuration, and physiographic metrics. (A) 1,500 m circular buffer scale Wet season, (B) 1,500 m circular buffer scale Dry season, (C) Sub-basin scale Wet season, (D) Sub-basin scale Dry season.
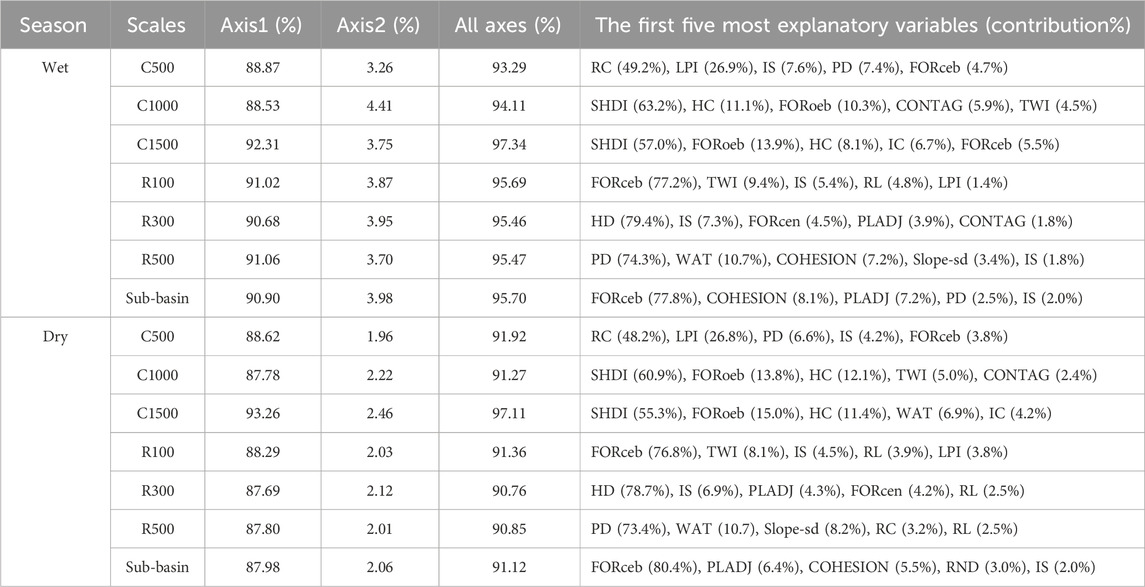
Table 4. The RDA analysis for the proportion of total variation in water quality.
During the wet season, the landscape metrics exhibited the highest explanatory rate on water quality within the 1,500 m width of the circular buffer zone, explaining up to 97.34% of the variation. The indicators SHDI (57.0%) and FORoeb (13.9%) were shown to be the most important factors influencing water quality. During the dry season, the landscape metrics exhibited the greatest explanatory power within the circular buffer zone with a width of 1,500 m, explaining up to 97.11% of the variation in water quality. The variables SHDI (55.3%) and FORoeb (15.0%) were also shown to have the most significant impact on water quality.
Most water quality parameters, including COD, CODmn, BOD, TN, TP and NH4+-N were positively related to LPI, RC, HC, CONTAG, PLADJ and COHESION, while negatively correlated with GRA, SHDI, FORceb, HD, PD, and Slope-sd. However, the water quality parameter DO is the opposite of the other water quality parameters, DO were positively correlated with GRA, LSI, FORceb and HD, negatively correlated with LPI, CONTAG, PLADJ and HC. In particular, the results were slightly different at the sub-basin scale. Only FORceb showed a negative correlation with water quality, whereas the other metrics, including PD, RND, and COHESION, etc., exhibited a positive relationship with water quality indicators.
The VPA analysis revealed that the landscape composition had the most significant influence on the overall variations in water quality. Specifically, it accounted for 54.3%–73.9% of the variations in water quality, as shown in Figure 7.
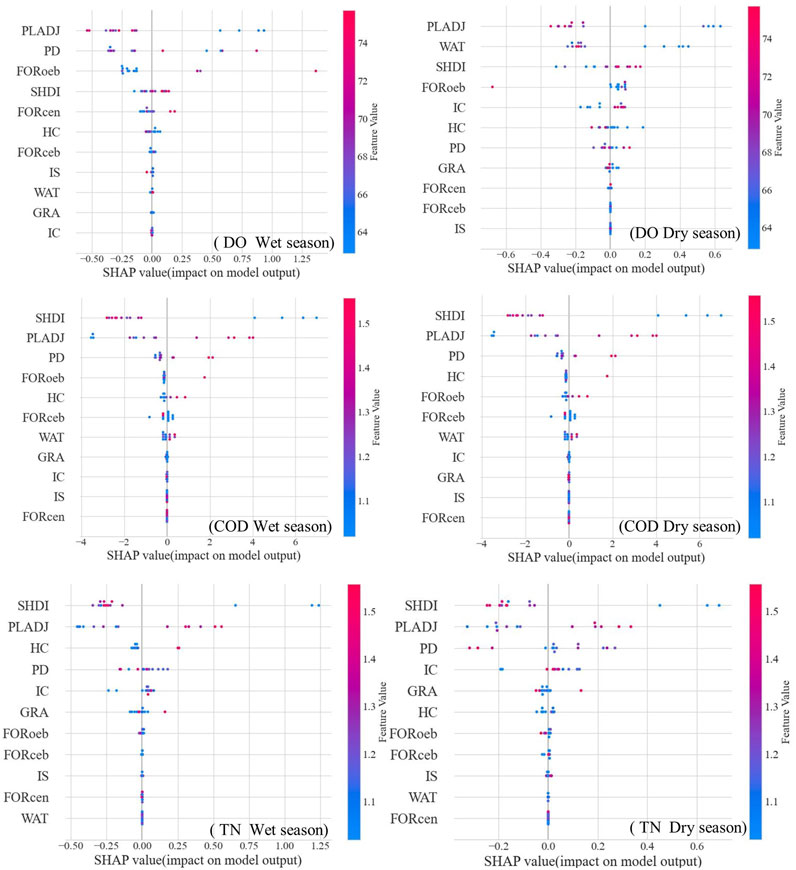
Figure 7. SHAP results for DO, COD, and TN at 1,500 m circular buffer zone.
At the 1,500 m circular buffer zone scale, the combined effects of landscape configuration and landscape composition on water quality varied between 33.4% and 39.3%. This interaction effect was particularly noticeable during the wet season. At the sub-basin scale, the interactive contributions of landscape configuration, landscape composition, and physiographic metrics on water quality varied from 23.3% to 25.3%. These effects were especially obvious during the dry season. In terms of the interaction of landscape composition and landscape configuration alone, the wet season showed a stronger interaction impact. The least independent contributor to changes in water quality was physiographic metrics.
Regarding seasons, water quality showed the greatest variation in landscape composition (2.8%–16.4%), followed by landscape configuration (2.8%–10.7%) and physiographic metrics (−2.0%–0.64%). This suggested that the variations in seasonal water quality were primarily due to changes in landscape composition. Regarding spatial scales, the independent effects of landscape configuration varied from 7.6% to 15.5%, which was slightly greater than the range of landscape composition (8.0%–11.2%). These finding suggest that landscape configuration is the main element causing spatial scale variations of water quality.
The SHAP method was used at the 1500 m circular buffer zone and sub-basin scales (Figures 7, 8).
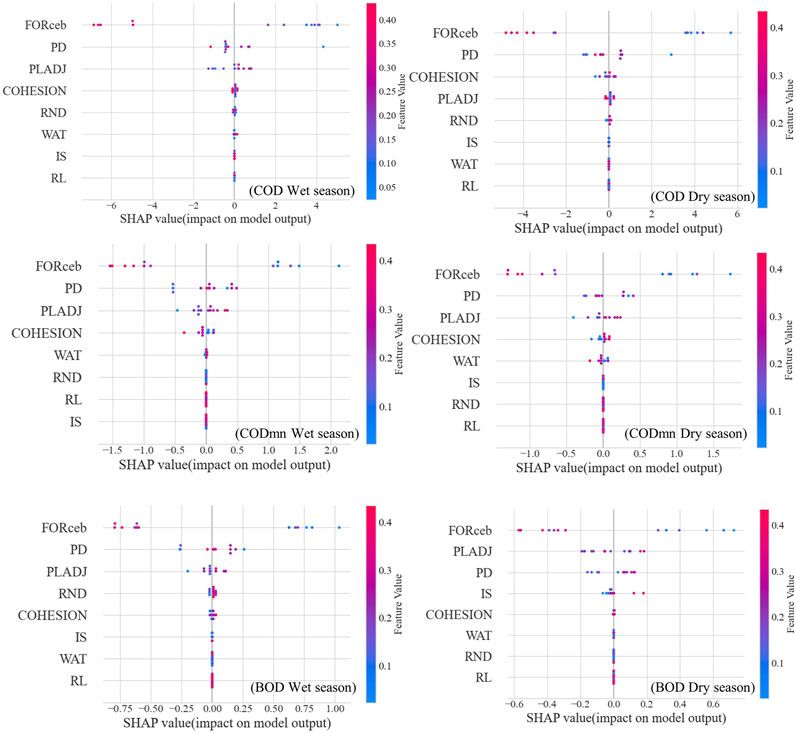
Figure 8. SHAP results for COD, CODmn, and BOD at the sub-basin scale.
At the 1,500 m circular buffer zone scale, it was noticed that the SHAP values of COD, CODmn, and TN increased as the feature values of PLADJ increased. However, raising PLADJ may have the opposite effect of reducing DO. SHAP values of COD, BOD, CODmn and TN decreased with increasing feature values of SHDI. At the 1500 m circular buffer zone, SHDI and PLADJ were the main metrics controlling watershed COD, CODmn, and TN.
At the sub-basin scale, there was a noticeable increase in the SHAP values of COD, CODmn, and TN as the feature values of PLADJ increased. SHAP values of COD, BOD, and CODmn, decreased with increasing feature values of FORceb. SHAP values of DO decrease with increasing feature values of IS. FORceb, PD, and PLADJ were the main metric controlling COD, BOD, and CODmn in the basin.
Variations in water quality are closely linked to land use. According to our research, cropland and impervious surfaces deteriorated water quality, whereas forest and grassland improved it. These results align with findings from prior research (Shi et al., 2017; Xu et al., 2023; Mello et al., 2018). At a finer scale for land use types, closed evergreen broadleaved forest improves water quality, while rainfed cropland and herbaceous cover have a detrimental influence on water quality. Excessive use of tillage and fertilizers in agriculture can lead to an excess of nutrients such as nitrogen and phosphorus in the soil, which cannot be fully utilized by the crop, leading to eutrophication of the water (Husk et al., 2024). As a result, these nutrients are carried into streams through irrigation and rainfall runoff, contributing to elevated levels of nutrients in the water (Zhang et al., 2014; Zhao et al., 2010). Wang et al. (2020) also claimed that in the FRB, farmland has the most significant influence on agricultural NPS pollution. Forest and grassland play a crucial role in improving river water quality by retaining soil nutrients, filtering pollutants, and intercepting sediment, (Xu et al., 2019; Winston et al., 2011).
Landscape configuration is critical in governing ecological systems (Mitchell et al., 2013). In our results, LPI, CONTAG, PLADJ, and COHESION showed a positive association with water quality, whereas SHDI, PD, and LSI exhibited a negative correlation with water quality. LPI assesses the percentage of the largest patches within the landscape (Herzog et al., 2001), rainfed cropland was the most predominant landscape in the study area, and the use of nitrogen and phosphorus fertilizers on rainfed cropland can lead to high polluting water quality in rivers. As the LSI increases, the complexity of the landscape shape also increases. The results indicate a negative connection between LSI and NH4+-N, TN and TP. This suggests that a landscape with a more complicated patch shape is effective in retaining more nutrients (Shi et al., 2017). Contrary to the research of Shi et al. (2017), PD, SHDI had a negative relationship with water quality, while CONTAG, COHESION,PLADJ displayed a positive relationship with water quality. PD is a measure of fragmentation and SHDI reflects the diversity of patches in the watershed. CONTAG is linked to the distribution and interspersion of different land use, where low values indicate a low level of clustering. COHESION reflects the level of connectivity of the natural landscape, with COHESION approaches to −1 indicating a more dispersed the distribution of patches, while a COHESION value approaching to one indicates a more clustered distribution of patches. The FRB has the largest proportion of cropland, while the other basins have the largest proportion of forested land. This could be the reason for the result, which contradicts the findings of Shi et al. (2017).
Several research have been conducted to figure out the correlation between water quality and physiographic metrics (Wu and Lu, 2021; Xu et al., 2023). The results of our investigation indicated a negative correlation between the physiographic metrics HD and Slope-sd and water quality. Higher Slope-sd values and relief amplitude (HD) values indicate higher flow rates, steep slopes result in accelerated runoff, which gathers and transports contaminants into the stream, hence enhancing river water quality (Xu et al., 2022b; Zhou et al., 2017). Furthermore, physiographic metrics can indirectly influence water quality by altering the arrangement of land use (Xu et al., 2022b). Slope and elevation increases can improve water quality by limiting human activities like agriculture and industry (Li et al., 2020).
The combination of three landscape metrics significantly influences water quality, both independently and through interactive effects. Specifically, further comparing the three types of metrics at the scale with the highest explanatory rates, at the 1500 m width of the circular buffer zone scale, and at the sub-basin scale, our results indicate that landscape composition has the greatest impact on water quality, followed by landscape configuration, and lastly, physiographic metrics (Figure 7). This contradicts the results of certain investigations (Wu and Lu, 2021; Li et al., 2018). This may be due to the fine-grained land cover maps we used in this study, according to Xu et al. (2021), a finer land use classification can better respond to the impact of landscape composition on water quality.
Seasonal fluctuations in precipitation and runoff greatly impact the concentrations of contaminants in stream water. The levels of CODmn, COD, and TN were elevated during the wet season. In our study, the influence of landscape metrics on water quality was more significant during the wet season compared to the dry season. This conclusion was supported by many prior research (Wu and Lu, 2021; Shi et al., 2017; Mei et al., 2025). This could be attributed to higher rainfall events and intensity during the wet season, leading to increased surface runoff and transport of more soil particles from June to August (Nobre et al., 2020).
Depending on the analysis’s scale, different patterns of land use and cover have different effects on water quality (Ding et al., 2016; Mainali and Chang, 2018). The findings indicated that the landscape metrics had the best explanatory power at the 1,500 m width of the circular buffer zone, followed by sub-basin, the 100 m width of the riparian buffer zone. At the circular buffer zone scale, the explanatory power of the composite landscape metrics increases with increasing width. In contrast, at the riparian buffer zone scale, the explanatory power of the composite landscape decreases with increasing width. At the sub-basin scale, FORceb plays a crucial function in enhancing water quality, whereas in the wet season, the effects of PD on TN, TP, and NH4+-N are detrimental, which is different from the results at the buffer scale, therefore, at the sub-basin scale, large tracts of forest should be kept intact as much as possible to avoid fragmentation caused by too much farmland, urban buildings.
Regarding seasons, landscape composition showed the biggest seasonal variations in water quality (2.8%–16.4%), suggesting that landscape composition was primarily responsible for seasonal differences in water quality. In terms of scales, landscape configuration had the greatest influence on water quality (7.6%–15.5%). This suggested that spatial scale variations were mostly influenced by landscape configuration. This finding is exactly opposite to the research of Xu et al. (2023). In conclusion, the impact of landscape metrics on water quality is contingent upon the scale, and it also fluctuates over seasons and periods of time.
Overall, it appears that basin area, river length, and river network density have a relatively weak effect on water quality. In the wet season, river length contributes 2.5%–4.8% to water quality at the 100 m riparian buffer zone. In the dry season, this contribution is observed within riparian buffer zones of 100, 300 and 500 m. River network density contributes to water quality only at the sub-basin scale under the dry season (3%). Basin area at the 100 m, 300 m riparian buffer zone scale has a detrimental effect on water quality, and the larger the basin area within the riparian buffer zone, the more polluted the water quality is, nutrients in water bodies spread with river migration.
Contrary to expectations, the impacts of river length, river network density, and basin area on river water quality were not as strong as we expected. This may be due to the greater influence of landscape composition, which masks the impact of river length, river network density, and basin area on water quality. Furthermore, the distribution of the location of NPS pollution sources, and the velocity and residence time of water movement, may also make the impact of river structural features on water quality weakened. There are still many unanswered questions about the spatial structure of rivers. For example, Qin et al. (2020) reported that the depth of river channel has an impact on the amount of nitrogen and phosphorus nutrients in waters, thus blurring the relationship between farmland and water quality. The study will conduct additional research to examine the impact of river structure on water quality in the future.
We explored the effects of landscape metrics on water quality at different spatial and temporal scales through RDA, VPA, and SHAP methods. The main conclusions are: (1) the impact of landscape composition on water quality was more significant compared to the effects of landscape configuration and physiographic metrics; (2) forests and grasslands improved water quality, while cropland and impervious surfaces worsened water quality; at a finer scale of land use types, closed broadleaf evergreen forests improved water quality, while in contrast, rainfed cropland negatively affected water quality; (3) LPI, CONTAG, PLADJ, and COHESION were positively correlated with water quality, while SHDI, PD, and LSI were negatively correlated with water quality; (4) the circular buffer zone scale had the highest interpretation, followed by the sub-basin and the riparian buffer zone scale, and the 1,500 m circular buffer zone was the key scale with the highest interpretation rate; (5) landscape metrics were slightly more relevant to water quality in the wet season than in the dry season; (6) water quality was improved by large relief amplitude and slope standard deviation; the water quality is not significantly affected by the river network density, the length of the river, or the basin area.
The FRB is the main grain and oil producing area in Sichuan and Chongqing provinces. Agricultural NPS and man-made soil erosion is serious, the contradiction between resource protection and exploitation is increasingly prominent. In order to preserve and improve the water environment of the basin, it is essential to establish appropriate regulatory measures while promoting the growth of local companies. For example, forests and grasslands improve water quality, and emphasis should be placed on grassland and forest development, such as increased planting of broadleaf evergreen forest vegetation. Especially at the sub-basin scale, the role of FORceb in improving water quality is crucial. The construction of high-quality forest ecosystems should be strengthened at the sub-basin scale. This can be achieved through the precise enhancement of forest quality and the construction of urban and peri-urban ecological green space systems. Whereas agricultural land and impervious surfaces deteriorate water quality, conservation tillage (no-tillage) as well as precision fertilizer application can help to reduce nutrient losses. Ecological protection and construction should focus on: strengthening conservation tillage of farmland, management and rehabilitation of degraded and polluted farmland, prevention and control of agricultural surface pollution, comprehensive management of soil erosion in small watersheds, and establishing stable agricultural farming systems. This study confirms the critical significance of circular buffer zone in protecting the water quality of the FRB, particularly in the long-distance buffer zone (1,500 m). Consequently, it is recommended to establish vegetation buffer strips within the circular buffer zone of the streams to minimize the arrangement of farmland, thereby enhancing the water quality.
This study has some limitations. Firstly, the study period of June 2017 to May 2022 is not a long enough time span and landscape metrics may not have changed strongly enough. Therefore, changes in the time series were not captured, and future studies could lengthen the time span. Secondly, this study aimed to investigate the effects of influencing factors on water quality and did not further use these factors for water quality prediction. In future studies, we will also combine remote sensing imagery and landscape metrics for water quality prediction. Despite the limitations of our study, this study used fine-grained land use maps as the basis for landscape indicators. This is rare in previous studies and provides a new way of thinking for future research. Our study used the SHAP method, which can be combined with machine learning to enhance the interpretability of the model and can be applied to more study areas.
Publicly available datasets were analyzed in this study. This data can be found here: https://szzdjc.cnemc.cn:8070/GJZ/Business/Publish/Main.html.
YZ: Data curation, Funding acquisition, Resources, Writing–review and editing. JH: Formal Analysis, Methodology, Writing–original draft. LF: Supervision, Writing–review and editing. BW: Software, Writing–review and editing. YC: Supervision, Writing–review and editing. LM: Supervision, Writing–review and editing.
The author(s) declare that financial support was received for the research, authorship, and/or publication of this article. This research was funded by the Third Xinjiang Scientific Expedition Program under Grant No. 2021xjkk1305, Key Laboratory of Land Satellite Remote Sensing Application, Ministry of Natural Resources of the People’s Republic of China under Grant No. KLSMNR-G202310, the National Natural Science Foundation of China under Grant Nos 42071316, 41901292.
We thank the reviewers for their insights and constructive comments to help improve the paper.
The authors declare that the research was conducted in the absence of any commercial or financial relationships that could be construed as a potential conflict of interest.
The author(s) declare that no Generative AI was used in the creation of this manuscript.
All claims expressed in this article are solely those of the authors and do not necessarily represent those of their affiliated organizations, or those of the publisher, the editors and the reviewers. Any product that may be evaluated in this article, or claim that may be made by its manufacturer, is not guaranteed or endorsed by the publisher.
Ai, L., Shi, Z. H., Yin, W., and Huang, X. (2015). Spatial and seasonal patterns in stream water contamination across mountainous watersheds: linkage with landscape characteristics. J. Hydrology 523, 398–408. doi:10.1016/j.jhydrol.2015.01.082
Alakbar, T., and Burgan, H. I. (2024). Regional power duration curve model for ungauged intermittent river basins. J. Water Clim. Change 15, 4596–4612. doi:10.2166/wcc.2024.207
Basu, N. B., VAN Meter, K. J., Byrnes, D. K., VAN Cappellen, P., Brouwer, R., Jacobsen, B. H., et al. (2022). Managing nitrogen legacies to accelerate water quality improvement. Nat. Geosci. 15, 97–105. doi:10.1038/s41561-021-00889-9
Caldwell, P. V., Martin, K. L., Vose, J. M., Baker, J. S., Warziniack, T. W., Costanza, J. K., et al. (2023). Forested watersheds provide the highest water quality among all land cover types, but the benefit of this ecosystem service depends on landscape context. Sci. Total Environ. 882, 163550. doi:10.1016/j.scitotenv.2023.163550
Cheng, X., Song, J., and Yan, J. (2023). Influences of landscape pattern on water quality at multiple scales in an agricultural basin of western China. Environ. Pollut. 319, 120986. doi:10.1016/j.envpol.2022.120986
Ding, J., Jiang, Y., Liu, Q., Hou, Z., Liao, J., Fu, L., et al. (2016). Influences of the land use pattern on water quality in low-order streams of the Dongjiang River basin, China: a multi-scale analysis. Sci. Total Environ. 551-552, 205–216. doi:10.1016/j.scitotenv.2016.01.162
Donohue, I., Mcgarrigle, M. L., and Mills, P. (2006). Linking catchment characteristics and water chemistry with the ecological status of Irish rivers. Water Res. 40, 91–98. doi:10.1016/j.watres.2005.10.027
Dou, J., Xia, R., Chen, Y., Chen, X., Cheng, B., Zhang, K., et al. (2022). Mixed spatial scale effects of landscape structure on water quality in the Yellow River. J. Clean. Prod. 368, 133008. doi:10.1016/j.jclepro.2022.133008
Herzog, F., Lausch, A., Müller, E., Thulke, H.-H., Steinhardt, U. T. A., and Lehmann, S. (2001). Landscape metrics for assessment of landscape destruction and rehabilitation. Environ. Manag. 27, 91–107. doi:10.1007/s002670010136
Hoylman, Z. H., Jencso, K. G., Hu, J., Holden, Z. A., Martin, J. T., and Gardner, W. P. (2019). The climatic water balance and topography control spatial patterns of atmospheric demand, soil moisture, and shallow subsurface flow. Water Resour. Res. 55, 2370–2389. doi:10.1029/2018wr023302
Husk, B., Julian, P., Simon, D., Tromas, N., Phan, D., Painter, K., et al. (2024). Improving water quality in a hypereutrophic lake and tributary through agricultural nutrient mitigation: a Multi-year monitoring analysis. J. Environ. Manag. 354, 120411. doi:10.1016/j.jenvman.2024.120411
Lausch, A., Selsam, P., Heege, T., VON Trentini, F., Almeroth, A., Borg, E., et al. (2025). Monitoring and modelling landscape structure, land use intensity and landscape change as drivers of water quality using remote sensing. Sci. Total Environ. 960, 178347. doi:10.1016/j.scitotenv.2024.178347
Li, N. X., Xu, J. F., Yin, W., Chen, Q. Z., Wang, J., and Shi, Z. H. (2020). Effect of local watershed landscapes on the nitrogen and phosphorus concentrations in the waterbodies of reservoir bays. Sci. Total Environ. 716, 137132. doi:10.1016/j.scitotenv.2020.137132
Li, F., Luo, Q., and Zhao, Y. (2023). Characterization and classification of river network types. Water Resour. Manag. 37, 6219–6236. doi:10.1007/s11269-023-03652-4
Li, K., Chi, G., Wang, L., Xie, Y., Wang, X., and Fan, Z. (2018). Identifying the critical riparian buffer zone with the strongest linkage between landscape characteristics and surface water quality. Ecol. Indic. 93, 741–752. doi:10.1016/j.ecolind.2018.05.030
Liu, R., Xu, F., Zhang, P., Yu, W., and Men, C. (2016). Identifying non-point source critical source areas based on multi-factors at a basin scale with SWAT. J. Hydrology 533, 379–388. doi:10.1016/j.jhydrol.2015.12.024
Liu, S., Xu, J., Wang, R., Fu, X., Liu, X., Zhao, Y., et al. (2025). Investigating the causal effects of anthropogenic factors on urban streams and lakes water quality by integrating causal inference with interpretable machine learning. J. Clean. Prod. 488, 144626. doi:10.1016/j.jclepro.2024.144626
Li, Y., Fang, L., Yuanzhu, W., Mi, W., Ji, L., Guixiang, Z., et al. (2022). Anthropogenic activities accelerated the evolution of river trophic status. Ecol. Indic. 136, 108584. doi:10.1016/j.ecolind.2022.108584
Lundberg, S. M., and Lee, S.-I. (2017). “A unified approach to interpreting model predictions,” in Proceedings of the 31st international conference on neural information processing systems.
Mainali, J., and Chang, H. (2018). Landscape and anthropogenic factors affecting spatial patterns of water quality trends in a large river basin, South Korea. J. Hydrology 564, 26–40. doi:10.1016/j.jhydrol.2018.06.074
Mei, K., Shi, H., Wu, Y., Dahlgren, R. A., Ji, X., Yang, M., et al. (2025). Impact of landscape patterns on river water quality: spatial-scale effects across an agricultural-urban interface. Ecol. Indic. 170, 113019. doi:10.1016/j.ecolind.2024.113019
Mello, K. D., Valente, R. A., Randhir, T. O., Dos Santos, A. C. A., and Vettorazzi, C. A. (2018). Effects of land use and land cover on water quality of low-order streams in Southeastern Brazil: watershed versus riparian zone. Catena 167, 130–138. doi:10.1016/j.catena.2018.04.027
Mitchell, M. G. E., Bennett, E. M., and Gonzalez, A. (2013). Linking landscape connectivity and ecosystem service provision: current knowledge and research gaps. Ecosystems 16, 894–908. doi:10.1007/s10021-013-9647-2
Naderian, D., Noori, R., Heggy, E., Bateni, S. M., Bhattarai, R., Nohegar, A., et al. (2024). A water quality database for global lakes. Resour. Conservation Recycl. 202, 107401. doi:10.1016/j.resconrec.2023.107401
Nobre, R. L. G., Caliman, A., Cabral, C. R., AraúJO, F. D. C., GuéRIN, J., Dantas, F. D. C. C., et al. (2020). Precipitation, landscape properties and land use interactively affect water quality of tropical freshwaters. Sci. Total Environ. 716, 137044. doi:10.1016/j.scitotenv.2020.137044
Ongley, E. D., Xiaolan, Z., and Tao, Y. (2010). Current status of agricultural and rural non-point source Pollution assessment in China. Environ. Pollut. 158, 1159–1168. doi:10.1016/j.envpol.2009.10.047
Peng, S., and Li, S. (2021). Scale relationship between landscape pattern and water quality in different pollution source areas: a case study of the Fuxian Lake watershed, China. Ecol. Indic. 121, 107136. doi:10.1016/j.ecolind.2020.107136
Qin, B., Zhou, J., Elser, J. J., Gardner, W. S., Deng, J., and Brookes, J. D. (2020). Water depth underpins the relative roles and fates of nitrogen and phosphorus in lakes. Environ. Sci. and Technol. 54, 3191–3198. doi:10.1021/acs.est.9b05858
Shen, Z., Qiu, J., Hong, Q., and Chen, L. (2014). Simulation of spatial and temporal distributions of non-point source pollution load in the Three Gorges Reservoir Region. Sci. Total Environ. 493, 138–146. doi:10.1016/j.scitotenv.2014.05.109
Shi, P., Zhang, Y., Li, Z., Li, P., and Xu, G. (2017). Influence of land use and land cover patterns on seasonal water quality at multi-spatial scales. Catena 151, 182–190. doi:10.1016/j.catena.2016.12.017
Shu, W., Wang, P., Xu, Q., Zeng, T., Ding, M., Zhang, H., et al. (2022). Coupled effects of landscape structures and water chemistry on bacterioplankton communities at multi-spatial scales. Sci. Total Environ. 811, 151350. doi:10.1016/j.scitotenv.2021.151350
Sun, X., Rosado, D., HöRMANN, G., Zhang, Z., Loose, L., Nambi, I., et al. (2023). Assessment of seasonal and spatial water quality variation in a cascading lake system in Chennai, India. Sci. Total Environ. 858, 159924. doi:10.1016/j.scitotenv.2022.159924
Wang, Y.-B., Junaid, M., Deng, J.-Y., Tang, Q.-P., Luo, L., Xie, Z.-Y., et al. (2024). Effects of land-use patterns on seasonal water quality at multiple spatial scales in the Jialing River, Chongqing, China. Catena 234, 107646. doi:10.1016/j.catena.2023.107646
Wang, H., Xiong, X., Wang, K., Li, X., Hu, H., Li, Q., et al. (2023). The effects of land use on water quality of alpine rivers: a case study in Qilian Mountain, China. Sci. Total Environ. 875, 162696. doi:10.1016/j.scitotenv.2023.162696
Wang, K., Wang, P., Zhang, R., and Lin, Z. (2020). Determination of spatiotemporal characteristics of agricultural non-point source pollution of river basins using the dynamic time warping distance. J. Hydrology 583, 124303. doi:10.1016/j.jhydrol.2019.124303
Wang, R., Kim, J.-H., and Li, M.-H. (2021). Predicting stream water quality under different urban development pattern scenarios with an interpretable machine learning approach. Sci. Total Environ. 761, 144057. doi:10.1016/j.scitotenv.2020.144057
Winston, R. J., Hunt, W. F., Osmond, D. L., Lord, W. G., and Woodward, M. (2011). Field evaluation of four level spreader-vegetative filter strips to improve urban storm-water quality. J. Irrigation Drainage Engineering-asce 137, 170–182. doi:10.1061/(asce)ir.1943-4774.0000173
Wu, J., and Lu, J. (2021). Spatial scale effects of landscape metrics on stream water quality and their seasonal changes. Water Res. 191, 116811. doi:10.1016/j.watres.2021.116811
Xu, G., Li, P., Lu, K., Tantai, Z., Zhang, J., Ren, Z., et al. (2019). Seasonal changes in water quality and its main influencing factors in the Dan River basin. Catena 173, 131–140. doi:10.1016/j.catena.2018.10.014
Xu, H., Tan, X., Liang, J., Cui, Y., and Gao, Q. (2022a). Impact of agricultural non-point source pollution on river water quality: evidence from China. Front. Ecol. Evol. 10. doi:10.3389/fevo.2022.858822
Xu, J., Bai, Y., You, H., Wang, X., Ma, Z., and Zhang, H. (2022b). Water quality assessment and the influence of landscape metrics at multiple scales in Poyang Lake basin. Ecol. Indic. 141, 109096. doi:10.1016/j.ecolind.2022.109096
Xu, M., Xu, G., Li, Z., Dang, Y., Li, Q., Min, Z., et al. (2023). Effects of comprehensive landscape patterns on water quality and identification of key metrics thresholds causing its abrupt changes. Environ. Pollut. 333, 122097. doi:10.1016/j.envpol.2023.122097
Xu, Q., Wang, P., Shu, W., Ding, M., and Zhang, H. (2021). Influence of landscape structures on river water quality at multiple spatial scales: a case study of the Yuan river watershed, China. Ecol. Indic. 121, 107226. doi:10.1016/j.ecolind.2020.107226
Zhang, S., Xia, C., Li, T., Wu, C., Deng, O., Zhong, Q., et al. (2016). Spatial variability of soil nitrogen in a hilly valley: multiscale patterns and affecting factors. Sci. Total Environ. 563-564, 10–18. doi:10.1016/j.scitotenv.2016.04.111
Zhang, X., Liu, L., Chen, X., Gao, Y., Xie, S., and Mi, J. (2021). GLC_FCS30: global land-cover product with fine classification system at 30 m using time-series Landsat imagery. Earth Syst. Sci. Data 13, 2753–2776. doi:10.5194/essd-13-2753-2021
Zhang, X., Liu, Y., and Zhou, L. (2018). Correlation analysis between landscape metrics and water quality under multiple scales. Int. J. Environ. Res. Public Health 15, 1606. doi:10.3390/ijerph15081606
Zhang, Y., Li, F., Zhang, Q., Li, J., and Liu, Q. (2014). Tracing nitrate pollution sources and transformation in surface- and ground-waters using environmental isotopes. Sci. Total Environ. 490, 213–222. doi:10.1016/j.scitotenv.2014.05.004
Zhang, Z., Huang, J., Duan, S., Huang, Y., Cai, J., and Bian, J. (2022). Use of interpretable machine learning to identify the factors influencing the nonlinear linkage between land use and river water quality in the Chesapeake Bay watershed. Ecol. Indic. 140, 108977. doi:10.1016/j.ecolind.2022.108977
Zhao, M., Zeng, C., Liu, Z., and Wang, S. (2010). Effect of different land use/land cover on karst hydrogeochemistry: a paired catchment study of Chenqi and Dengzhanhe, Puding, Guizhou, SW China. J. Hydrology 388, 121–130. doi:10.1016/j.jhydrol.2010.04.034
Zhou, P., Huang, J., Pontius, R. G., and Hong, H. (2016). New insight into the correlations between land use and water quality in a coastal watershed of China: does point source pollution weaken it? Sci. Total Environ. 543, 591–600. doi:10.1016/j.scitotenv.2015.11.063
Keywords: water quality, fine-grained land use, landscape metrics, multiscale, Fujiang river basin
Citation: Zhou Y, He J, Feng L, Wang B, Chen Y and Miao L (2025) Multiscale impacts of landscape metrics on water quality based on fine-grained land use maps. Front. Environ. Sci. 13:1544078. doi: 10.3389/fenvs.2025.1544078
Received: 12 December 2024; Accepted: 03 February 2025;
Published: 20 February 2025.
Edited by:
Buddhi Wijesiri, Queensland University of Technology, AustraliaReviewed by:
Halil Ibrahim Burgan, Akdeniz University, TürkiyeCopyright © 2025 Zhou, He, Feng, Wang, Chen and Miao. This is an open-access article distributed under the terms of the Creative Commons Attribution License (CC BY). The use, distribution or reproduction in other forums is permitted, provided the original author(s) and the copyright owner(s) are credited and that the original publication in this journal is cited, in accordance with accepted academic practice. No use, distribution or reproduction is permitted which does not comply with these terms.
*Correspondence: Ya’nan Zhou, emhvdXluQGhodS5lZHUuY24=
Disclaimer: All claims expressed in this article are solely those of the authors and do not necessarily represent those of their affiliated organizations, or those of the publisher, the editors and the reviewers. Any product that may be evaluated in this article or claim that may be made by its manufacturer is not guaranteed or endorsed by the publisher.
Research integrity at Frontiers
Learn more about the work of our research integrity team to safeguard the quality of each article we publish.