 Unarine E. Tshishonga
 Oupa E. Malahlela
95% of researchers rate our articles as excellent or good
Learn more about the work of our research integrity team to safeguard the quality of each article we publish.
Find out more
ORIGINAL RESEARCH article
Front. Environ. Sci. , 21 March 2025
Sec. Environmental Informatics and Remote Sensing
Volume 13 - 2025 | https://doi.org/10.3389/fenvs.2025.1526906
Plant nitrogen (N) estimation using real-time and non-convection methods is very crucial for ecosystem management. This study aimed at estimating plant N concentration of indigenous vegetation in Luvuvhu River Catchment (LRC) using both field and remotely sensed data from Sentinel-2 imagery. The study used three different categories of spectral indices to fulfil its objectives. Red edge based, nitrogen related, and combined spectral indices based on Sentinel-2 data were subjected to stepwise regression on R studio software to determine which category of spectral indices is more efficient in estimating plant N concentration. Results have shown that combined spectral indices performed better with R2 = 0.59, RMSE = 0.47% and MAE = 0.38%, followed by N based spectral indices with R2 = 0.44, RMSE = 0.65% and MAE = 0.48%, and the last category is red edge based spectral indices with R2 = 0.35, RMSE = 0.81% and MAE = 0.65%. The coefficients of the best performing model obtained from stepwise regression were used to compute multiple linear regression on QGIS to produce a map showing the concentration of plant N across the study area. Plant N varies with plant species and, the thematic map created show how plant N is distributed across the study area. With the help of this study, forest managers can better manage the natural vegetation by collaborating with forest communities. This possible partnership will create green jobs in addition to revenue. The link of the natural regeneration, reforestation, agroforestry and quantification by Sentinel-2 images for emission reduction will be beneficial for their livelihood. On a broader scale, participatory management is a good way to mitigate and adapt to climate change. On the other hand, the study suggests that more in-depth research should be conducted to explore further properties of red-edge indices for vegetation parameters prediction.
Nitrogen (N) is a main regulator of several leaf physiological processes, such as photosynthesis, respiration, and transpiration (Reich et al., 2006), and it correlates well with chlorophyll (Chl) content, light use efficiency (LUT), and net primary production (Jiang et al., 2021). N is the principal component which restrains productivity of various terrestrial ecosystems (Richards et al., 2012). This is influenced by the fact that N is a well-known resource that limits plants’ productivity and growth (Ustin, 2013). Spatial patterns of N at leaf level help us to understand the part that terrestrial ecosystems play in the larger Earth system since they are connected to fluctuations of carbon, water, and energy (Ollinger et al., 2008). Canopy N is also associated with the capacity of vegetation to hold atmospheric N deposition (Lindsay, 2017), which has increased together with atmospheric carbon dioxide (CO2) over the years because of increased use of fossil fuel and production of artificial fertilizer using harmful chemicals (Galloway et al., 2008). The distribution of plant N varies across the landscape due to many variables.
Plant N concentration among plants found in natural ecosystems differs by over 32% (Hobbie et al., 2005) and this varies with topographic gradients and cycling of nutrients, among species (Craine et al., 2009), and in response to manipulations of resource obtainability for experimental purposes (Amundson et al., 2003). Plant N may also be affected by other factors such as land-use history, changes in CO2 concentration, acid deposition, and limitation of another nutrient element supply (Goodale and Aber, 2001; Hallett and Hornbeck, 1997). Overall, plant N can be used as a measure to generalize patterns of N cycling globally (Lindsay, 2017) as well as a vital indicator to assess changes in N cycling that might accompany anthropogenic influence on ecosystems such as rising atmospheric CO2 (Huber et al., 2011). As the main nutrient that limits plants’ growth, plant N availability, the way it fluctuates in ecosystems, and how it responds to global change will have long term significant impacts on carbon (C) sequestration in various ecosystems (Luo et al., 2004). Estimations of N at leaf level and canopy N concentration of vegetation allow for a better understanding of ecosystem functioning and biochemical processes (Lee and Nguyen, 2005).
Traditionally, chemical analysis has been used to obtain canopy and foliar N (Serrano et al., 2002). This approach is accurate, but destructive, time-consuming, and costly (Sáez-Plaza et al., 2013). Thus, make it impractical to measure canopy and leaf N for a large area of forests consisting of different vegetation types using the chemical analysis method. To our advantage, remote sensing has turned things around, such assessments can be carried out a low cost, and within a very short space of time across large spatial scales (Walshe et al., 2020). Remote sensing has been used for various applications in vegetation monitoring such as land cover change detection, species classification, land cover estimation, and defoliation (Walshe et al., 2020). Leaf N has been determined in forests (Singh et al., 2015), grassland and crop ecosystems using remote sensing techniques over the years (Yao et al., 2015).
Airborne and spaceborne serve as exceptional tools for temporal and spatial monitoring of leaf N since they provide continuous information in manifold spectral and directional settings (Ustin et al., 2009; Cohen and Goward, 2004). A growing number of hyperspectral imagery reports have been exceptional when it comes to leaf and canopy N prediction for various plants community (Wang and Wei, 2016). However, hyperspectral data are often affected by high dimensionality and are relatively costly to acquire. On the other hand, multispectral data such as Sentinel-2 and field spectroscopy can be used as primary data sources since they are relatively cheaper and easily accessible (Chemura et al., 2018). Launched in 2015, Sentinel-2 is the European Space Agency’s (ESA) state-of-the-art sensor. It has a high spatial resolution (10–60 m range) and 13 bands that span from visible to near-infrared and shortwave infrared (Gholizadeh et al., 2016). Many vegetation characteristics, including the Leaf Area Index (LAI), nitrogen and chlorophyll, biophysical parameters, and Red-Edge Position, can be estimated with the use of Sentinel-2 (Frampton et al., 2013; Clevers and Gitelson, 2013; Verrelst et al., 2013). However, leaf trait contents are distributed differently across vegetation canopies along vertical canopy profile of different species which makes it complex to estimate them (Gara et al., 2018). Other factors such canopy structure, mask of the strong water absorption (Dash and Curran, 2004), viewing geometry and background make it a challenge to retrieve plant N at the canopy level (Grogan and Chapin, 2000).
Nonetheless, retrieval of many vegetation parameters such as plant N, leaf Chl, and others are dominated by empirical techniques such as spectral indices (Gitelson et al., 2003), traditional regression techniques such as stepwise multiple linear regression and partial least square regression (PLSR), to several machine learning approaches such as support vector regression (SVR), neural network and random forest (RF) (Zhao et al., 2013). Spectral indices are one of the simplest and frequently utilized methods to estimate leaf biochemical contents such as N, Chl and vegetation leaf water content (Gitelson A. A. et al., 1996; Wang B. et al., 2018). Spectral indices calculated from the Sentinel-2 product were investigated in this study. The Normalized Difference Vegetation Index, Modified Simple Ratio, and Atmospherically Resistant Vegetation Index (ARVI) are among the broadband indices that are obtained from Sentinel-2 imagery. Normally, the Normalized Difference Vegetation Index (NDVI) is the most widely used vegetation index, and it is typically used to analyse vegetation and its changes over time at both local and regional levels (Ali et al., 2022). The Ratio Vegetation indicator (RVI), the most fundamental indicator used in vegetation study and monitoring, has been refined into the Modified Simple Ratio (MSR) (Calvão and Palmeirim, 2011). N in leaf cells mostly occurs in proteins and chlorophylls (Kokaly et al., 2009). Plant N and Chl correlate well across various plant species (Homolova et al., 2013), therefore, spectral indices formulated for Chl have been employed as a means of N estimation (Le Maire et al., 2008). This study aimed to map plant N concentration using different categories of spectral indices and stepwise multiple linear regression in the Luvuvhu River Catchment.
The Luvuvhu River Catchment is in the northeastern region of Limpopo province, South Africa as shown in Figure 1. The catchment is situated between the latitudes 220 17′ 33″ S and 230 17′ 57″ S and longitudes 290 49′ 46″ E and 310 23′ 32″ E. The Luvuvhu River Catchment covers an area of approximately 331,602 447 ha with an elevation in the catchment ranging between 200 and 1,700 m resulting in shallow storage dams that are exposed to excess evaporation due to large water surfaces (Odiyo et al., 2012). The catchment is also characterized by topographic features such as the Soutpansberg mountain range in the eastern side of the catchment. This topographic feature rises to a height of approximately 1 700 m above mean sea level prior to reaching the low-lying surface of the Limpopo River Valley (Kundu et al., 2013). The landscape in other parts of the catchment has a mean ridge height of about 800–1 200 m while some places within the catchment reach a peak above 1 500 m (Kundu et al., 2013).
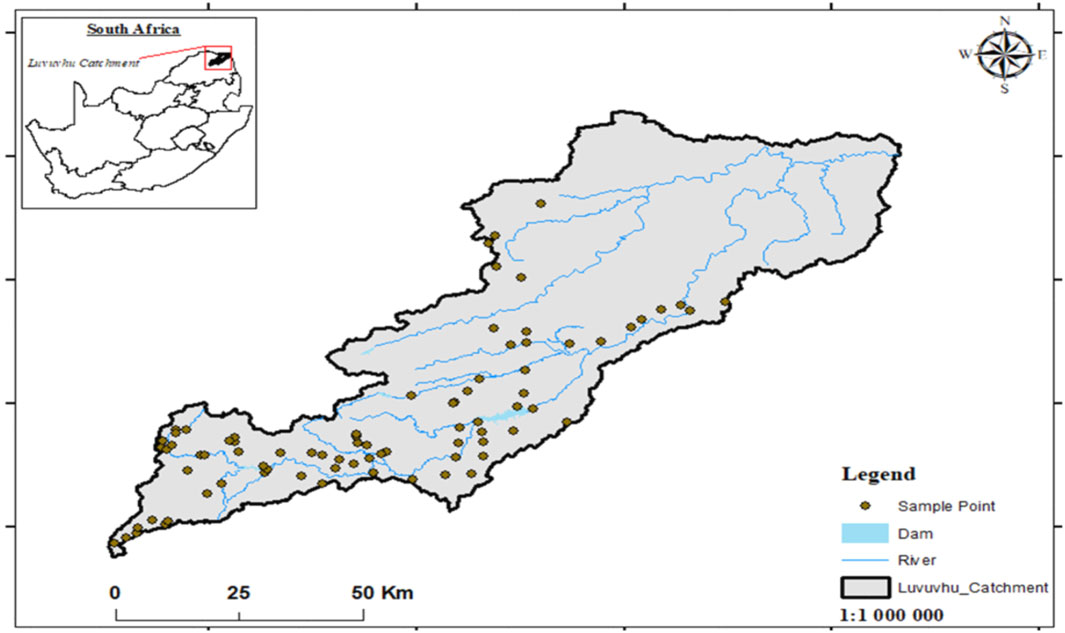
Figure 1. Map showing the study area.
Precipitation in some parts of the catchment is influenced by orographic uplift due to east-west orientation of Soutpansberg mountain range where the western movement of moisture from the Indian Ocean results into 1 200 mm to 1 500 mm/year in the forested mountain headwaters (Shongwe, 2007). Semi-arid forest and bushland receive only receive 200 mm–600 mm/year as the terrain drops across the study area. Extreme topographic diversity and altitude changes over short distances within the Soutpansberg result in dramatic climatic variance within the LRC (Volenzo and Odiyo, 2018). Luvuvhu River Catchment is characterized by subtropical climate with distinct wet conditions during November to March, and little rainfall from April to October during winter with little precipitation. High temperatures in the study area influence the gradual increase in evaporation rates ranging between 1 400 mm and 1 900 mm/year (Nethononda, 2018).
Fieldwork was conducted between the 2nd and 11th of December 2021 using simple random sampling. This period was chosen because it is the growing period in the subtropical environment of South Africa and the peak season for plant N in vegetation. The study region had both broadleaf and needle leaf plant species, and their distribution varied across the study area. To incorporate various plant species and canopy structures, dominating species within the sampled point was the one considered for this study. However, other plant species around the sampled points were also taken into consideration to supplement plant data collected. A total of 82 sampling points was generated and spread out within the study area with at least 2 km between the points to minimize pixel overlapping on satellite imagery. Data were randomly split into 60% training (
Satellite images from Sentinel-2 were downloaded from (https://scihub.copernicus.eu/) between 02nd December and 09 December 2021 leaf nitrogen estimation. The centre positions and spatial resolutions of all bands from the Sentinel-2 images are summarized in Table 1. All bands were resampled to 10 m spatial resolution using the resampling tool in the Sentinel Applications Platform (SNAP) software 4.0 and the nearest method. This study utilized ten bands (490, 560, 665, 705, 740, 783, 842, 865, 1,610, and 2,190 nm) from the Sentinel-2 images. Like other spaceborne optical sensors, Sentinel-2 is also affected by atmospheric, topographic, shadows, and cloud cover (Pflug et a., 2016; Main-Knorn et al., 2017). These effects have the potential of reducing classification accuracy during a land cover/use mapping (Phiri et al., 2018).
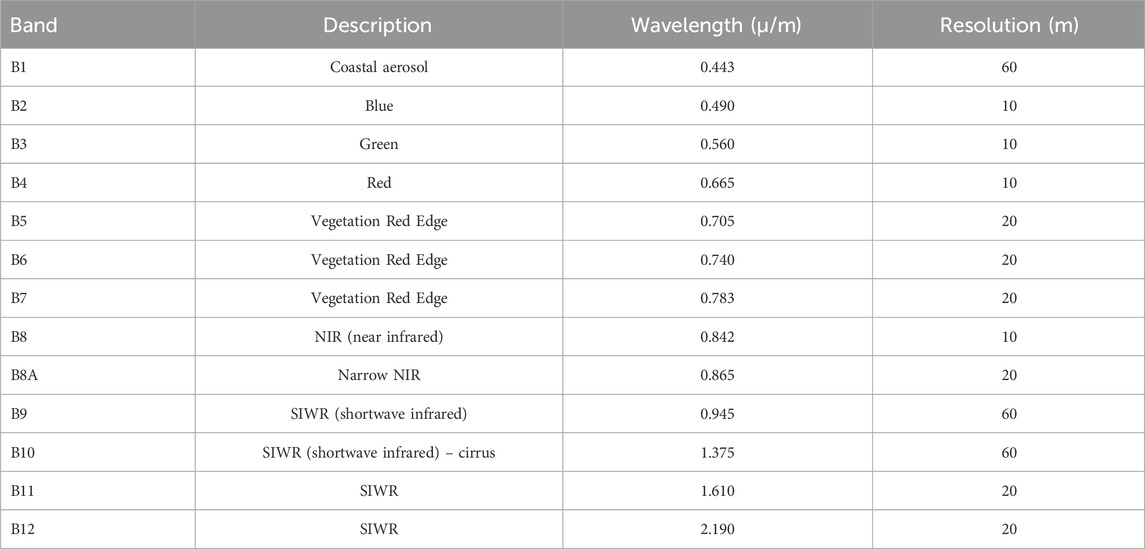
Table 1. List of sentinel-2 bands (Herman et al., 2018).
The atmospheric correction of the Sentinel-2 images was performed using the Sen2Cor atmospheric correction toolbox in the Sentinel Application Platform (SNAP) software (version 4.0). The atmosphere contains several components that influence the spectral information. The aim of atmospheric correction is the conversion of at-sensor radiance with atmospheric influences to at-ground reflectance with reduced atmospheric influences. Atmospheric correction improves the quality of the image, and consequently, the relationship between field measured N and spectral reflectance, by minimizing the influence of the atmosphere’s brightness on the image spectral value (Hadjimitsis et al., 2010).
Vegetation indices reduce the total amount of reflectance information obtained from a remote sensing platform into a smaller number of optical properties that are highly correlated with the trait of interest. Therefore, identifying and extracting critical bands from Sentinel-2 imagery is crucial for enhancing the accuracy of estimating plant N (Rao et al., 2008; Houborg et al., 2013). This study used 27 vegetation indices that were listed in the literature (Baret, 2016; (Kemenova and Dimitrov, 2021). Selected optical indices based on Sentinel-2 sensor are developed from visible NIR, red-edge and SWIR part of the spectrum. Chlorophyll-related spectral indices that use the red-edge part of the spectrum were used, and since chlorophyll serves as a proxy to nitrogen, such spectral indices can be explored for indirect nitrogen estimation in the forest (Houles et al., 2007), which has yielded good results in many ecosystems such as grassland and for agricultural crops (Clevers and Gitelson, 2013). The SWIR-related vegetation indices were also explored since Perich et al. (2021) suggested that the SWIR was the best region for plant N status. This may be because protein and amino acid molecules in plants contain N (Perchlik and Tegeder, 2017). Proteins typically absorb short-wave infrared light (Yu et al., 2024), hence, when using the SWIR to monitor plant growth, light in this band is absorbed by proteins in the plant, resulting in absorption peaks in the spectrum (He et al., 2023), therefore, combining the SWIR band and RE can effectively monitor the plant N concentration (Yu et al., 2024). Vegetation indices were calculated using formulas on Tables 2, 3.
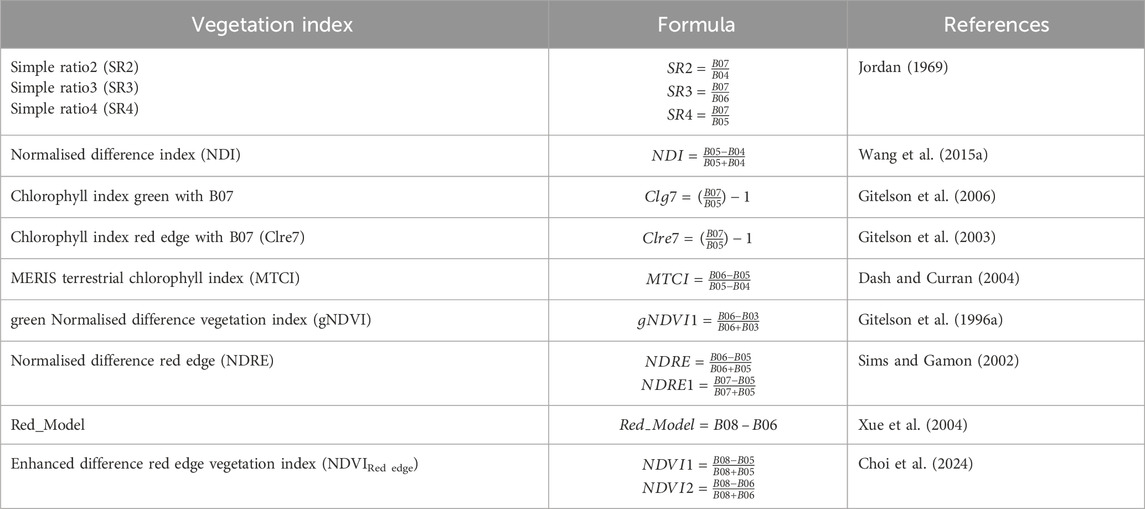
Table 2. Summary of selected optical narrowband spectral indices used in this study based on Sentinel-2.
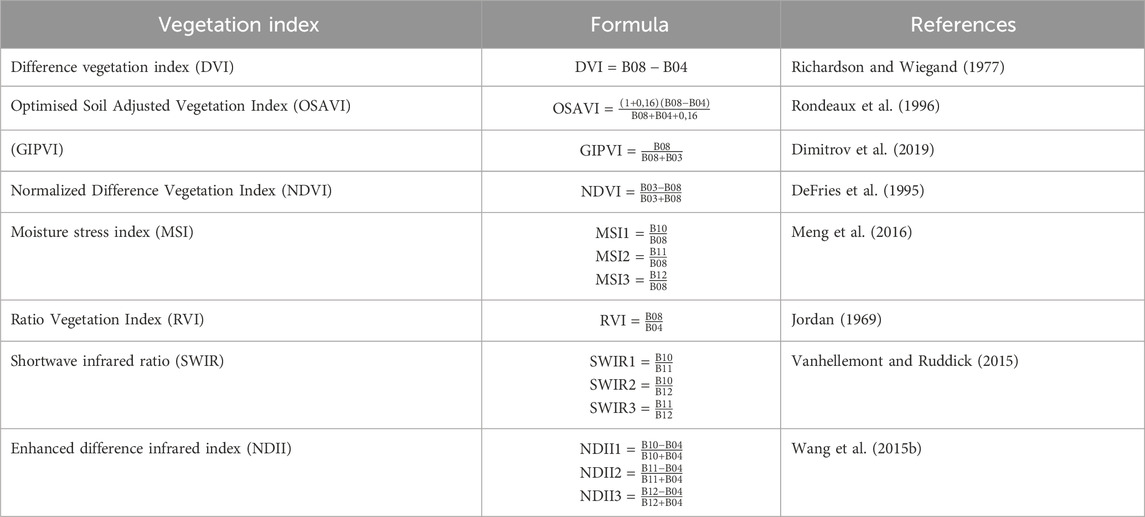
Table 3. Summary of selected optical broadband spectral indices used in this study based on Sentinel-2.
For this study, n = 82 samples were collected from the field and dataset was randomly split into 60% (n = 49) training data and 40% (n = 33) calibration data in R studio software. Training data set was used to train the model for plant nitrogen concentration estimation in R studio software. The study used stepwise multiple linear regression for each data set to determine variables that are significant and insignificant for the final model. Variables that were not significant for the respective models were eliminated, and models remained with variables that were significant.
Validation data set (n = 33) was used to assess the validity of the model. Three data sets that were calibrated using stepwise multiple linear regression were validated by comparing observed values and predicted values from the validation data set. The coefficient of determination (R2), root mean square error (RMSE) given by Equation 1, and mean absolute error (MAE) given by Equation 2 were used to describe and compute the relationship between observed and predicted plant N, and the two metrics can be expressed as follows:
Where xi and yi are the measured and predicted plant nitrogen, x is the mean of measured plant nitrogen, and n is the total number of samples.
The study sampled variety of natural vegetation species as listed in Table 4, those species included both needle leaf and broadleaved vegetation in the study area.
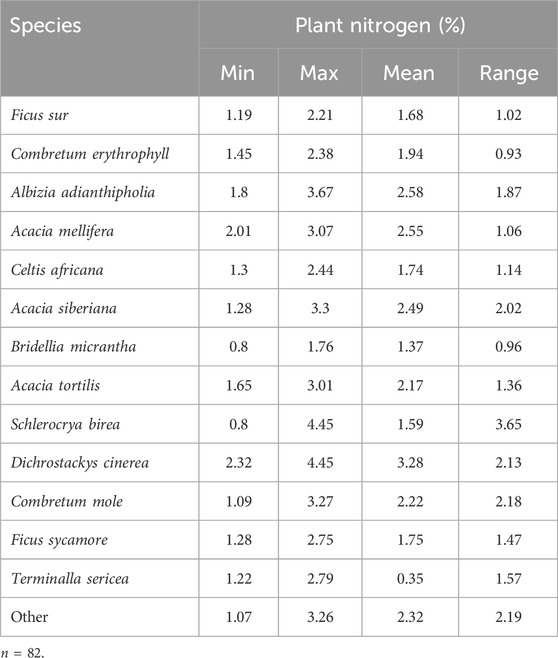
Table 4. Sampled indigenous species with important statistical information.
Table 5 shows that the stepwise regression was repeated for narrowband spectral indices, broadband spectral indices, and combined bands spectral indices where insignificant variables were eliminated from the models. Combined spectral indices have produced higher correlation between observed and predicted values of plant N with R2 = 0.59, followed by broadband indices with R2 = 0.44 and the narrowband indices with R2 = 0.35.
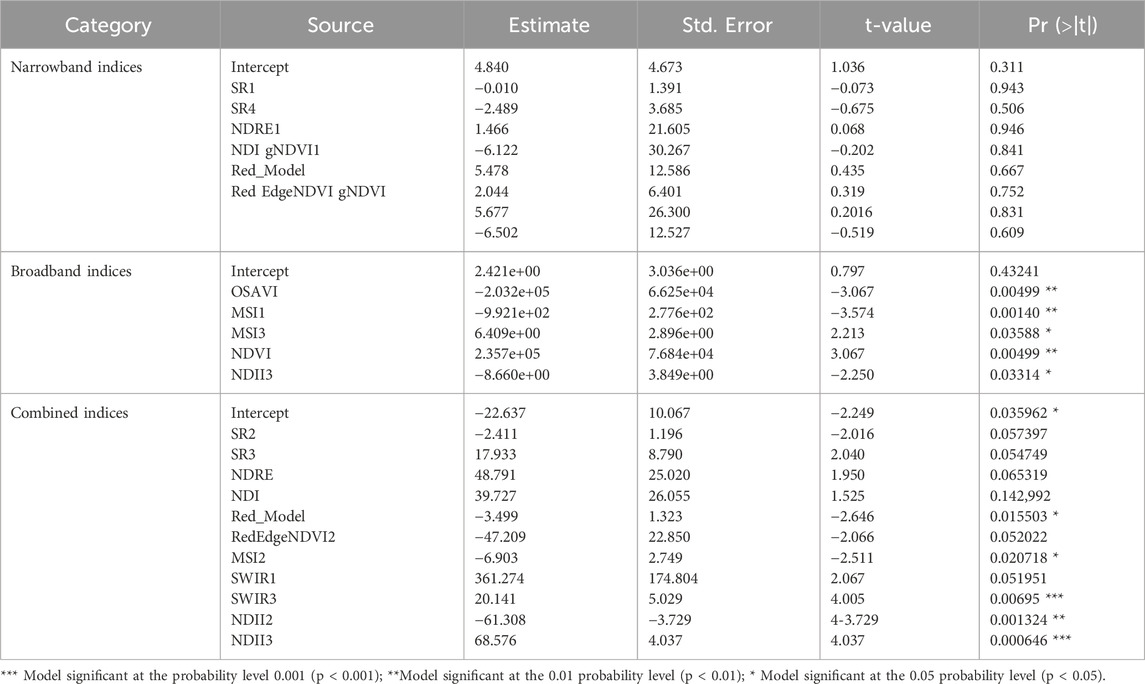
Table 5. Significant variables resulting from stepwise logistic regression analysis.
The final model selected explanatory variables based on significance level as probability to be selected was≤0.05 and probability for exclusion was≥0.100. Results showed that from this model, spectral indices from the red edge were the most insignificant indices with all of them producing results at p > 0.05. From this model, the most significant spectral indices come from the broadband part of the spectrum with OSAVI, MSI1 and NDVI having p < 0.05. More than 60% of broadband spectral indices have shown negative relationship regarding plant nitrogen concentration in the study area. OSAVI, MSI1 and NDII3 have showed significant negative relationship with NDVI and MSI3 showing positive relation regarding plant nitrogen concentration. About 40% of spectral indices selected from combined spectral indices model have shown to be significant with p < 0.05, with SWIR3 and NDII3 being most significant at p < 0.001 and positive relationship regarding plant nitrogen concentration.
Figures 2–4 show the results of indigenous plant nitrogen concentration models which were constructed based on Sentinel-2 data. These models randomly selected 49 training points to train the model and used 33 as verification points. The narrowband model produced an accuracy of R2 = 0.35, RMSE = 0.81% and MAE = 0.65, broadband model produced an accuracy of R2 = 0.44, RMSE = 0.65% and MAE = 0.48, and the model containing both narrowband and broadband produced an accuracy of R2 = 0.59, RMSE = 0.47% and MAE = 0.35%. Based on these results, the study has selected the model with both narrowband and broadband indices to estimate plant nitrogen across the study area.
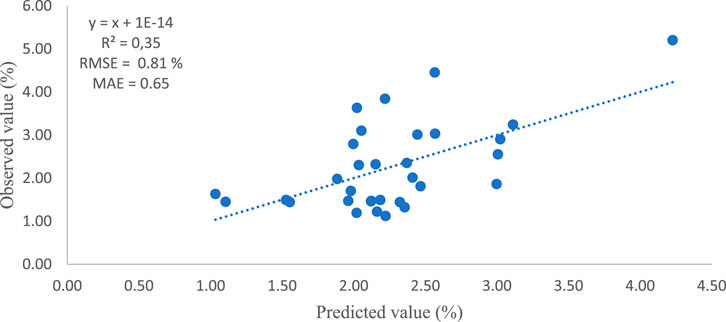
Figure 2. Relationship between observed and predicted values of plant nitrogen using selected red-edge indices from stepwise regression and 33 validation points.
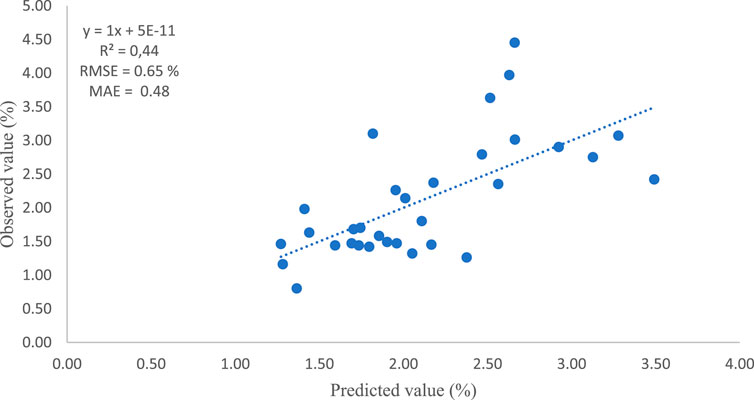
Figure 3. Relationship between observed and predicted values of plant nitrogen using selected nitrogen related indices from stepwise regression and 33 validation points.
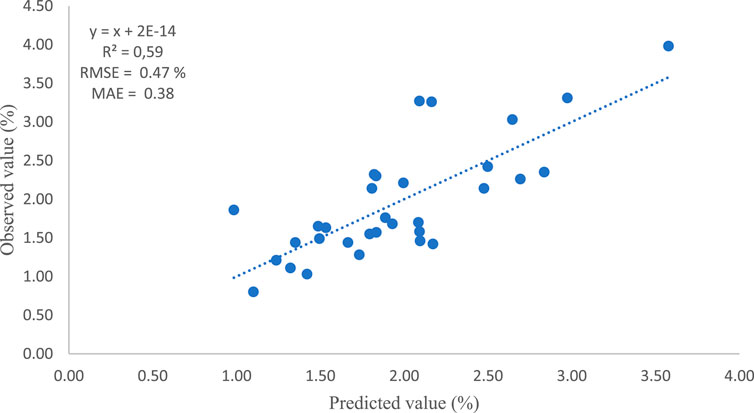
Figure 4. Relationship between observed and predicted values of plant nitrogen using selected combined bands indices from stepwise regression and 33 validation points.
The first activity regarding the mapping of plant N across the study areas was to resample Sentinel-2 image strips to 30 m spatial resolution, then mosaic them to a single image. The regression model from stepwise regression was used to compute multiple linear regression (equation) using raster calculator on QGIS which was then applied to the masked image and resulted in the map showing plant N concentration across Luvuvhu River Catchment. The spatial distribution of plant N correlates well with the distribution of various plants species across the catchment, this was observed during field visits. Three models, i.e., narrowband, broadband and combined (stepwise selection) were selected for plant N prediction based on their performance (R2 values). Results in Table 6 have shown that combined spectral indices performed better with R2 = 0.59, RMSE = 0.47% and MAE = 0.38%, followed by N based spectral indices with R2 = 0.44, RMSE = 0.65% and MAE = 0.48%, and the last category is red edge based spectral indices with R2 = 0.35, RMSE = 0.81% and MAE = 0.65%. The R2 evaluation showed that the combined indices model should be used to map spatial distribution of plant N over Luvuvhu Catchment Area.
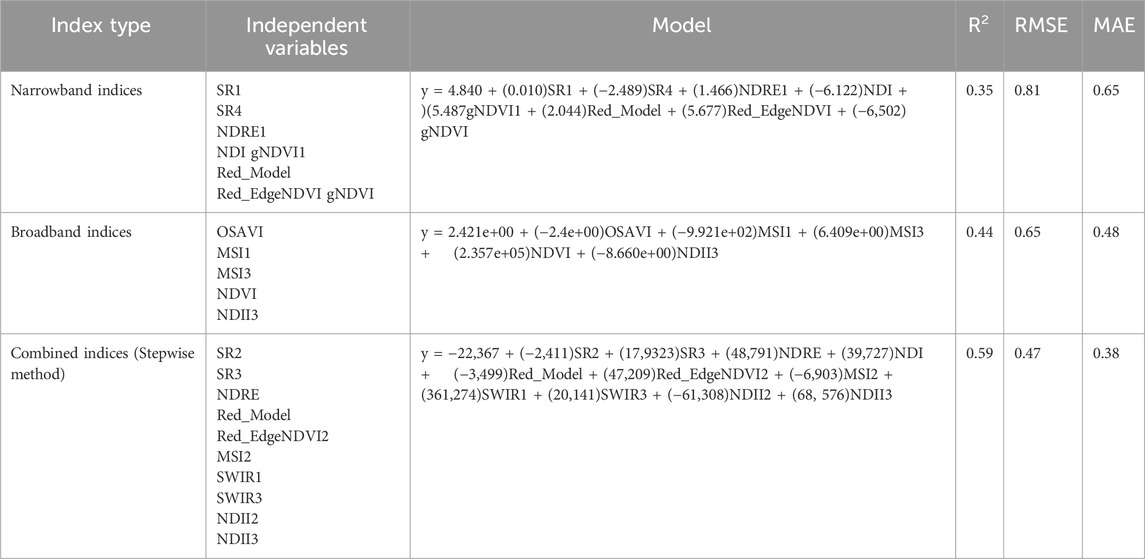
Table 6. Accuracy assessment of regression models.
The resultant map was shown on Figure 5. From results density of natural vegetation is higher at southwestern part of study area hence there is relatively higher plant N concentration while moving towards northwestern and some areas at the center of the study area the natural vegetation is less resulting in plant N concentration. The southwestern and eastern aspects are cool hence has more vegetation cover and plant N as compared to the northwestern aspect which is warmer. The plant N of needleleaf species which dominates the northwestern and eastern of the study area will be less while compared to broadleaved species due to low wood density, volume and age of broadleaved species than that of needleleaf species.
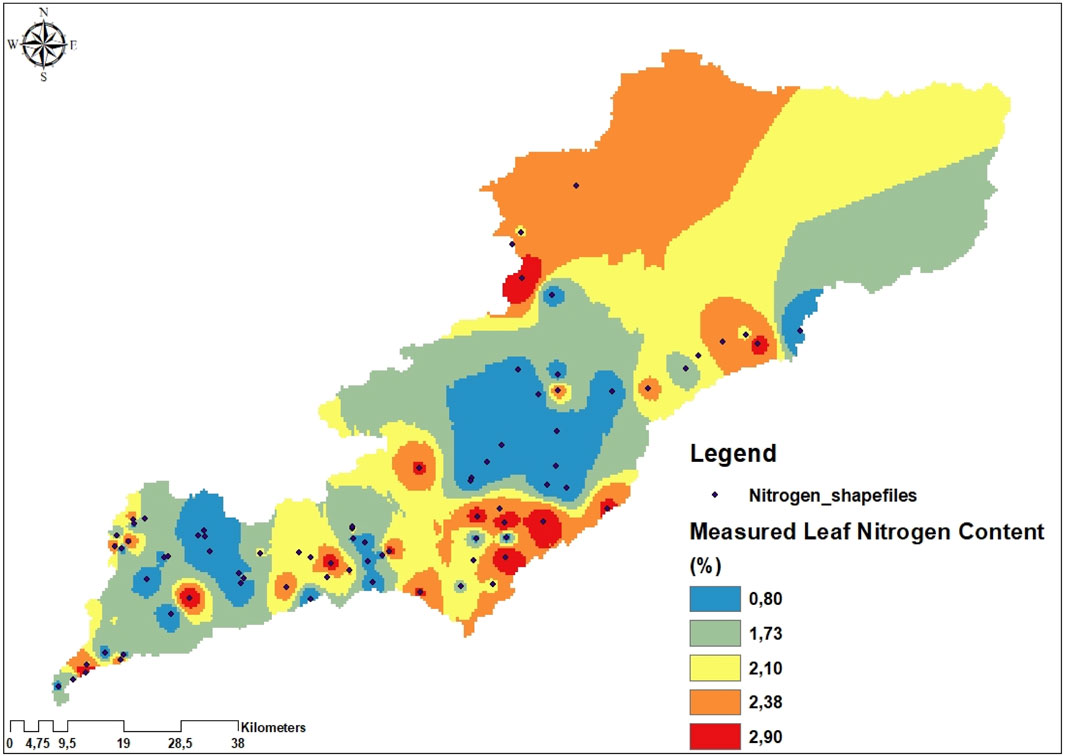
Figure 5. Interpolation map of sampling points.
This study used ordinary Kriging to create the interpolation of plant N in Luvuvhu Catchment Area as shown in Figure 6. Kriging is a geostatistical interpolation with multistep technique that considers both the distance and the degree of variation between known points when estimating the unknown points (Paramasivam and Venkatramanan, 2019). In Kriging, interpolated values are modelled by a Gaussian process governed by prior covariance, and it is used to forecast geographic area. This method of interpolation was considered for this study to gain a general overview of how plant N concentration is like across the entire catchment since sampled poigurents are not spread throughout the study area. Data obtained from the interpolation map helps to improve the accuracy of the study since it gives general overview of plant N concentration.
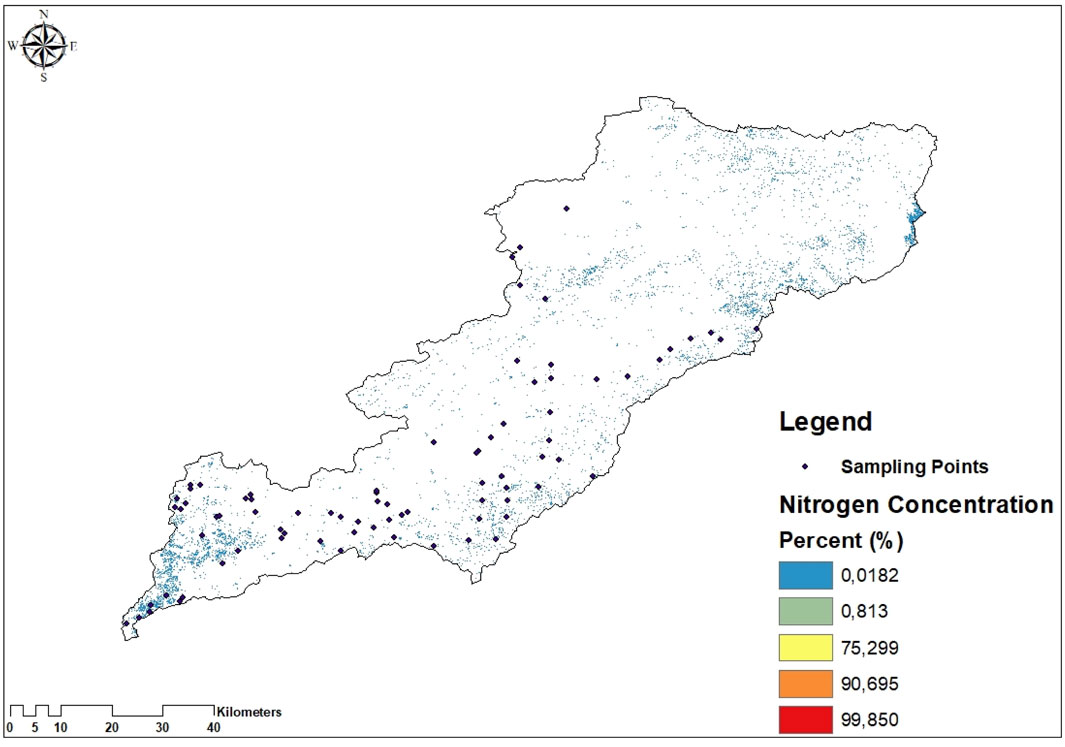
Figure 6. Plant nitrogen concentration distribution map in the study area based on Sentinel-2 data and 11 indices.
In this study, the coefficient of determination (R2), the root-mean-square error (RMSE), and the percentage rootmean-square error (RMSE%) were used to evaluate the performance of the models and the accuracy of the plant N map as shown in Table 7 (Li et al., 2019). Besides the R2, the residual sums of squares for the regression of actual and modelled values (RSS) were also used to evaluate the accuracy of the semivariogram models using Equation 3. (Robertson et al., 2014):
where si represents the actual semivariance values, Osi represents the predicted semivariance values by the semivariogram model, and n is the number of semivariance values. A lower RSS value indicates a relatively better estimation performance of the semivariogram model.

Table 7. Accuracy assessment of Kriging models.
The aim of this study was to estimate and map plant nitrogen concentration of indigenous vegetation in the Luvuvhu River Catchment in Limpopo province using Sentinel-2 data. Remote sensing makes it feasible to monitor plant N concentration at a large scale effectively and at a low cost. However, remote sensing mostly obtains spectral reflectance of the canopy of vegetation which requires the need to understand spectral traits of vegetation to be mapped. This allows for the establishment of the relationship between physiological, ecological variables, and spectral reflectance which will allow rapid N estimation and vegetation health monitoring (Vigneau et al., 2011; Osbome et al., 2011). Spectral reflectance of vegetation is influenced by many factors which result in changes in spectral reflectance across the study area (Liu et al., 2019). Therefore, this presents a challenge to come up with spectral indices which are simple and applicable for plant N estimation.
However, Sentinel-2 allows for the construction of chlorophyll-related spectral indices using the red-edge part of the spectrum, and since chlorophyll serves as a proxy to nitrogen, such spectral indices can be explored for indirect nitrogen estimation in the forest, which has yielded good results in many ecosystems such as grassland and for agricultural crops (Clevers and Gitelson, 2013). However, spectral indices also have many factors that mostly affect them (Zheng et al., 2018). For vegetation parameters estimations, some of spectral indices have excessive capability for soil noise reduction (Rondeaux et al., 1996), while others are very useful by avoiding at saturation for vegetation spectra (Jordan, 1969). In cases where the ecosystem is nitrogen-rich, the correlation between chlorophyll and nitrogen becomes weak (Hallik et al., 2009). Hence, it is very crucial to be considerate when choosing spectral indices that are related to chlorophyll for nitrogen estimation, and to consider the features that are sensitive to nitrogen when selecting spectral indices to estimate plant N (Osco et al., 2020; Zheng et al., 2018). NIR serves as a principal constituent for various spectral indices (Rondeaux et al., 1996). However, in practice, the red edge is one of the most utilized spectral features for vegetation health evaluation (Vigneau et al., 2011).
Therefore, in this study, three groups of spectral indices linked to the biochemical and physical properties of vegetation such as nitrogen, structure, and chlorophyll were used with Sentinel-2 imagery to estimate plant N in the study area. Three models were built for plant N concentration in this study, namely, red edge, nitrogen based and combined spectral indices to explore the relationship between predicted and observed N values for plant N concentration estimation. Spectral indices constructed from the combination of bands (red edge and nitrogen based) in Sentinel-2 data have the potential to extract vegetation properties and be utilised for a wide range of application such as plant N, chlorophyll, and water content estimation (Li et al., 2014a; Hunt Jr et al., 2013). A combination of spectral regression models which are suitable for plant N estimation are very useful for vegetation health monitoring. The SWIR and the red edge region had the greatest impact on plant N estimation among the evaluated spectral indices. The red edge is a useful band for tracking vegetative metrics, as is the case with most of the research (Jiang et al., 2021). A sensitive area for tracking the amount of chlorophyll in plants is the red edge, which exhibits abrupt variations in reflectance. The degree of chlorophyll absorption determines the red edge zone (Li et al., 2014b). Nevertheless, the study’s findings also show that SWIR can successfully raise plant N estimation accuracy. Similarly, the SWIR was proposed by Perich et al. (2021) as the optimal zone for plant N status. This could be because plants have nitrogen in their protein and amino acid molecules. Generally, short-wave infrared light is absorbed by proteins. Proteins in the plant absorb light in this band, which causes absorption peaks to appear in the spectrum when using the SWIR to track plant growth.
Furthermore, stepwise regression was used to determine the category of spectral indices with better performance when it comes to predicting plant nitrogen. Regression model of combined spectral indices from the red edge and the broadband was used in this study since it showed higher correlation between the observed and predicted values of plant N which presents reference for the plant N monitoring using spectral indices in the subtropical environment. The combination of broadband and narrowband spectral indices performed best for this study with R2 = 0.59. According to the Darvishzadeh et al. (2008) study, foliar N and indices have been found to correlate, and both narrowband and broadband regions appear to be significant predictors of foliar N. The method of using the whole spectrum has yielded the best results since it was able to leverage important regions across the spectrum and discern differences in foliar N both between and within varying biomes (Darvishzadeh et al., 2008). The broadband spectral indices came second with R2 = 0.44. Foody et al. (2001) study supported our results according to which there is poor correlation between the observed and predicted plant N using the broadband spectral indices. Main problem is saturation hence the accuracy is less; saturation can be due to complex structure of forest in result of which broadband VIs did not observe the plant N increase. Finally, the narrowband spectral indices with R2 = 0.35. Wang et al. (2016) studied that reason of saturation is the computation of indices through NIR and red spectral band and the red band absorbs electromagnetic radiation and remains constant while the canopy cover increases hence in result at 100% canopy cover red energy absorption reaches to peak. Also, the soil reflectance and topography influence plant N estimation using spectral indices therefore assessment of different spectral indices is very useful (Heiskanen, 2006). However, the study by Imran et at., (2020) has shown that a relationship of plant N with these vegetation indices is best due to the reason that red-edge band is located in high chlorophyll reflectance and absorption area which is between red and NIR region due to which the change in chlorophyll as well as leaf properties have greater effect on the red-edge spectral band. It was found that red edge indices have more accuracy and correlation as compared to broadband indices (Xie et al., 2018). The NIR region can contain spectral variation due to structural variables that covary with foliar N concentrations and can influence overall reflectance and absorption from this region (Knyazikhin et al., 2013; Lepine et al., 2016; Ollinger et al., 2008). For this investigation, summed reflectance values over the whole NIR area did not account for more than 35% of the variance in foliar N, even though narrowband within this region consistently emerged as significant predictors of foliar N. Since only specific portions of the NIR were important, this might be due to atmospheric effects rather than broad structural changes with changing N concentrations. Variation of plant nitrogen concentration is well explained by functional and species composition in the study area. This is dependable looking into studies from various ecosystems, such as temperate, tropical, boreal, and Mediterranean ecosystems (Asner and Martin, 2009).
The resultant map shown in Figure 6 Indicates density of forest is higher at northern part of study area since have higher biomass as well as towards southwestern and northeastern side vegetation is less hence the plant N is relatively higher compared to other parts. The southwestern aspect is cool hence have more vegetation cover and plant N as compared to northern aspect which is warmer.
This study compared the performance of three groups of spectral indices which are mostly related to nitrogen, chlorophyll, and structural properties, derived from Sentinel-2 imagery to estimate the concentration of plant N in a subtropical environment of South Africa. Further, it was found that there are still very few studies in South Africa dedicated to utilizing Sentinel-2 data for plant N estimation. Plant N varies greatly across the study area depending on species composition. The resultant map shown in Figure 6. Indicates density of forest is higher at northern part of study area since have higher biomass as well as towards southwestern and northeastern side vegetation is less hence the plant N is relatively higher compared to other parts. The southwestern aspect is cool hence have more vegetation cover and plant N as compared to northern aspect which is warmer.
Results from stepwise regression showed that showed that plant N can be estimated using different groups of indices with acceptable accuracy in the subtropical environment. Results have shown that combined spectral indices performed better with R2 = 0.59, RMSE = 0.47% and MAE = 0.38%, followed by N related spectral indices with R2 = 0.44, RMSE = 0.65% and MAE = 0.48%, and the last category is red edge based spectral indices with R2 = 0.35, RMSE = 0.81% and MAE = 0.65%. Most of the structural related indices could estimate nitrogen at a moderate to good accuracy, due to the functional link between canopy structure and nitrogen resulting from functional type and species differences. Improvements could be accomplished by using multiple VIs with differing feature relevance according to different methods and by using hyperspectral data instead of Sentinel-2 imagery. Although the VIs from different ways could have different feature relevance, stacking them while considering different methodologies could prevent overfitting and should be used to monitor vegetation biophysical parameters and improve classification accuracy. We expect that these predictions will also be very helpful in limiting the uncertainty of biogeochemical models for a variety of terrestrial ecosystems around the world.
The original contributions presented in the study are included in the article/supplementary material, further inquiries can be directed to the corresponding author.
UT: Writing–original draft, Writing–review and editing. OM: Writing–original draft, Writing–review and editing.
The author(s) declare that financial support was received for the research, authorship, and/or publication of this article. This study has been funded by the University of Venda.
The authors thank the editor and reviewers for their helpful comments and valuable suggestions. We also like to thank the United States Geological Survey, and the R Development Core Team for making data and processing software freely available.
The authors declare that the research was conducted in the absence of any commercial or financial relationships that could be construed as a potential conflict of interest.
The author(s) declare that no Generative AI was used in the creation of this manuscript.
All claims expressed in this article are solely those of the authors and do not necessarily represent those of their affiliated organizations, or those of the publisher, the editors and the reviewers. Any product that may be evaluated in this article, or claim that may be made by its manufacturer, is not guaranteed or endorsed by the publisher.
Ali, A., Rondelli, V., Martelli, R., Falsone, G., Lupia, F., and Barbanti, L. (2022). Management zones delineation through clustering techniques based on soils traits, NDVI data, and multiple year crop yields. Agriculture 12 (2), 231. doi:10.3390/agriculture12020231
Amundson, R., Austin, A. T., Schuur, E. A., Yoo, K., Matzek, V., Kendall, C., et al. (2003). Global patterns of the isotopic composition of soil and plant nitrogen. Glob. Biogeochem. cycles 17 (1). doi:10.1029/2002gb001903
Asner, G. P., and Martin, R. E. (2009). Airborne spectranomics: mapping canopy chemical and taxonomic diversity in tropical forests. Front. Ecol. Environ. 7 (5), 269–276. doi:10.1890/070152
Baret, F. (2016). “Estimation of biophysical variables from satellite observations,” in Land surface remote sensing in agriculture and forest (Elsevier), 37–80.
Calvão, T., and Palmeirim, J. M. (2011). A comparative evaluation of spectral vegetation indices for the estimation of biophysical characteristics of Mediterranean semi-deciduous shrub communities. Int. J. Remote Sens. 32 (8), 2275–2296. doi:10.1080/01431161003698245
Chemura, A., Mutanga, O., Odindi, J., and Kutywayo, D. (2018). Mapping spatial variability of foliar nitrogen in coffee (Coffea arabica L.) plantations with multispectral Sentinel-2 MSI data. ISPRS J. Photogrammetry Remote Sens. 138, 1–11. doi:10.1016/j.isprsjprs.2018.02.004
Choi, H. B., Han, K. H., and Seo, J. (2024). Normalized difference red-edge estimation with modified DiscoGAN model. IEEE Access, 1. doi:10.1109/access.2024.3517602
Clevers, J. G., and Gitelson, A. A. (2013). Remote estimation of crop and grass chlorophyll and nitrogen content using red-edge bands on Sentinel-2 and-3. Int. J. Appl. Earth Observation Geoinformation 23, 344–351. doi:10.1016/j.jag.2012.10.008
Cohen, W. B., and Goward, S. N. (2004). Landsat's role in ecological applications of remote sensing. Bioscience 54 (6), 535–545. doi:10.1641/0006-3568(2004)054[0535:lrieao]2.0.co;2
Craine, J. M., Elmore, A. J., Aidar, M. P., Bustamante, M., Dawson, T. E., Hobbie, E. A., et al. (2009). Global patterns of foliar nitrogen isotopes and their relationships with climate, mycorrhizal fungi, foliar nutrient concentrations, and nitrogen availability. New Phytol. 183 (4), 980–992. doi:10.1111/j.1469-8137.2009.02917.x
Croft, H., Chen, J. M., and Zhang, Y. (2014). The applicability of empirical vegetation indices for determining leaf chlorophyll content over different leaf and canopy structures. Ecol. Complex. 17, 119–130. doi:10.1016/j.ecocom.2013.11.005
Darvishzadeh, R., Skidmore, A., Schlerf, M., Atzberger, C., Corsi, F., and Cho, M. (2008). LAI and chlorophyll estimation for a heterogeneous grassland using hyperspectral measurements. ISPRS J. photogrammetry remote Sens. 63 (4), 409–426. doi:10.1016/j.isprsjprs.2008.01.001
Dash, J., and Curran, P. J. (2004). The MERIS terrestrial chlorophyll index. Int. J. Remote Sens. 25, 5403–5413. doi:10.1080/0143116042000274015
DeFries, R., Hansen, M., and Townshend, J. (1995). Global discrimination of land cover types from metrics derived from AVHRR pathfinder data. Remote Sens. Environ. 54 (3), 209–222. doi:10.1016/0034-4257(95)00142-5
Dimitrov, P., Kamenova, I., Roumenina, E., Filchev, L., Ilieva, I., Jelev, G., et al. (2019). Estimation of biophysical and biochemical variables of winter wheat through Sentinel-2 vegetation indices. Bulg. J. Agric. Sci. 25, 819–832.
Foody, G. M., Cutler, M. E., McMorrow, J., Pelz, D., Tangki, H., Boyd, D. S., et al. (2001). Mapping the biomass of Bornean tropical rain forest from remotely sensed data. Glob. Ecol. Biogeogr. 10 (4), 379–387. doi:10.1046/j.1466-822x.2001.00248.x
Frampton, W. J., Dash, J., Watmough, G., and Milton, E. J. (2013). Evaluating the capabilities of Sentinel-2 for quantitative estimation of biophysical variables in vegetation. ISPRS J. photogrammetry remote Sens. 82, 83–92. doi:10.1016/j.isprsjprs.2013.04.007
Galloway, J., Raghuram, N., and Abrol, Y. P. (2008). A perspective on reactive nitrogen in a global, Asian and Indian context. Curr. Sci., 1375–1381.
Gara, T. W., Darvishzadeh, R., Skidmore, A. K., and Wang, T. (2018). Impact of vertical canopy position on leaf spectral properties and traits across multiple species. Remote Sens. 10 (2), 346. doi:10.3390/rs10020346
Gholizadeh, M. H., Melesse, A. M., and Reddi, L. (2016). A comprehensive review on water quality parameters estimation using remote sensing techniques. Sensors 16 (8), 1298. doi:10.3390/s16081298
Gitelson, A., Karnieli, A., Goldman, N., Yacobi, Y. Z., and Mayo, M. (1996a). Chlorophyll estimation in the Southeastern Mediterranean using CZCS images: adaptation of an algorithm and its validation. J. Mar. Syst. 9 (3-4), 283–290. doi:10.1016/s0924-7963(95)00047-x
Gitelson, A. A., Gritz, Y., and Merzlyak, M. N. (2003). Relationships between leaf chlorophyll content and spectral reflectance and algorithms for non-destructive chlorophyll assessment in higher plant leaves. J. plant physiology 160 (3), 271–282. doi:10.1078/0176-1617-00887
Gitelson, A. A., Keydan, G. P., and Merzlyak, M. N. (2006). Three-band model for noninvasive estimation of chlorophyll, carotenoids, and anthocyanin contents in higher plant leaves. Geophys. Res. Lett. 33 (11). doi:10.1029/2006gl026457
Gitelson, A. A., Merzlyak, M. N., and Lichtenthaler, H. K. (1996b). Detection of red edge position and chlorophyll content by reflectance measurements near 700 nm. J. plant physiology 148 (3-4), 501–508. doi:10.1016/s0176-1617(96)80285-9
Goodale, C. L., and Aber, J. D. (2001). The long-term effects of land-use history on nitrogen cycling in northern hardwood forests. Ecol. Appl. 11 (1), 253–267. doi:10.1890/1051-0761(2001)011[0253:tlteol]2.0.co;2
Grogan, P., and Chapin, F. S. (2000). Nitrogen limitation of production in a Californianannual grassland: the contribution of arbuscularmycorrhizae. Biogeochemistry 49 (1), 37–51.
Hadjimitsis, D. G., Papadavid, G., Agapiou, A., Themistocleous, K., Hadjimitsis, M. G., Retalis, A., et al. (2010). Atmospheric correction for satellite remotely sensed data intended for agricultural applications: impact on vegetation indices. Nat. Hazards Earth Syst. Sci. 10 (1), 89–95. doi:10.5194/nhess-10-89-2010
Hallett, R. A., and Hornbeck, J. W. (1997). Foliar and soil nutrient relationships in red oak and white pine forests. Can. J. For. Res. 27 (8), 1233–1244. doi:10.1139/cjfr-27-8-1233
Hallik, L., Kull, O., Niinemets, Ü., and Aan, A. (2009). Contrasting correlation networks between leaf structure, nitrogen and chlorophyll in herbaceous and woody canopies. Basic Appl. Ecol. 10 (4), 309–318. doi:10.1016/j.baae.2008.08.001
Han, L., Yang, G., Dai, H., Xu, B., Yang, H., Feng, H., et al. (2019). Modeling maize above-ground biomass based on machine learning approaches using UAV remote-sensing data. Plant methods 15 (1), 10–19. doi:10.1186/s13007-019-0394-z
He, X., Shen, X., Beckett, P., Xiao, D., Liu, X., and Yin, R. (2023). Hybrid SWM-IR narrow bandpass filters with high optical density. Appl. Opt. 62 (15), 4074–4079. doi:10.1364/ao.491764
Heiskanen, J. (2006). Estimating aboveground tree biomass and leaf area index in a mountain birch forest using ASTER satellite data. International Journal of Remote Sensing, 27(6), 1135–1158.
Herman, M. R., Nejadhashemi, A. P., Abouali, M., Hernandez-Suarez, J. S., Daneshvar, F., Zhang, Z., et al. (2018). Evaluating the role of evapotranspiration remote sensing data in improving hydrological modeling predictability. J. Hydrology 556, 39–49. doi:10.1016/j.jhydrol.2017.11.009
Hobbie, E. A., Jumpponen, A., and Trappe, J. (2005). Foliar and fungal 15 N: 14 N ratios reflect development of mycorrhizae and nitrogen supply during primary succession: testing analytical models. Oecologia 146 (2), 258–268. doi:10.1007/s00442-005-0208-z
Homolova, L., Malenovský, Z., Clevers, J. G., García-Santos, G., and Schaepman, M. E. (2013). Review of optical-based remote sensing for plant trait mapping. Ecol. Complex. 15, 1–16. doi:10.1016/j.ecocom.2013.06.003
Houborg, R., Cescatti, A., Migliavacca, M., and Kustas, W. P. (2013). Satellite retrievals of leaf chlorophyll and photosynthetic capacity for improved modeling of GPP. Agric. For. Meteorology 177, 10–23. doi:10.1016/j.agrformet.2013.04.006
Houles, V., Guerif, M., and Mary, B. (2007). Elaboration of a nitrogen nutrition indicator for winter wheat based on leaf area index and chlorophyll content for making nitrogen recommendations. Eur. J. Agron. 27 (1), 1–11. doi:10.1016/j.eja.2006.10.001
Huber, S. A., Balz, A., Abert, M., and Pronk, W. (2011). Characterisation of aquatic humic and non-humic matter with size-exclusion chromatography–organic carbon detection–organic nitrogen detection (LC-OCD-OND). Water Res. 45 (2), 879–885. doi:10.1016/j.watres.2010.09.023
Hunt Jr, E. R., Doraiswamy, P. C., McMurtrey, J. E., Daughtry, C. S., Perry, E. M., and Akhmedov, B. (2013). A visible band index for remote sensing leaf chlorophyll content at the canopy scale. Int. J. Appl. earth observation Geoinformation 21, 103–112. doi:10.1016/j.jag.2012.07.020
Imran, H. A., Gianelle, D., Rocchini, D., Dalponte, M., Martín, M. P., Sakowska, K., et al. (2020). VIS-NIR, red-edge and NIR-shoulder based normalized vegetation indices response to co-varying leaf and Canopy structural traits in heterogeneous grasslands. Remote Sens. 12 (14), 2254. doi:10.3390/rs12142254
Jiang, H., Song, L., Li, Y., Ma, M., and Fan, L. (2021). Monitoring the reduced resilience of forests in southwest China using long-term remote sensing data. Remote Sens. 14 (1), 32. doi:10.3390/rs14010032
Jordan, C. F. (1969). Derivation of leaf-area index from quality of light on the forest floor. Ecology 50 (4), 663–666. doi:10.2307/1936256
Kamenova, I., and Dimitrov, P. (2021). Evaluation of Sentinel-2 vegetation indices for prediction of LAI, fAPAR and fCover of winter wheat in Bulgaria. European Journal of Remote Sensing, 54(sup1), 89–108.
Knyazikhin, Y., Schull, M. A., Stenberg, P., Mõttus, M., Rautiainen, M., Yang, Y., et al. (2013). Hyperspectral remote sensing of foliar nitrogen content. Proc. Natl. Acad. Sci. 110 (3), E185–E192. doi:10.1073/pnas.1210196109
Kokaly, R. F., Asner, G. P., Ollinger, S. V., Martin, M. E., and Wessman, C. A. (2009). Characterizing canopy biochemistry from imaging spectroscopy and its application to ecosystem studies. Remote Sens. Environ. 113, S78–S91. doi:10.1016/j.rse.2008.10.018
Kundu, P. M., Singo, R. L., Odiyo, J. O., Mathivha, F. I., and Nkuna, R. N. (2013). Extraction and analysis of morphologic and hydrologic properties for Luvuvhu River Catchment in Limpopo province, South Africa. Water Soc. II 178, 1129.
Lee, B. W., and Nguyen, T. A. (2005). Spatial yield variability and site-specific nitrogen prescription for the improved yield and grain quality of rice. In Proceedings of the Korean society of crop science conference (pp. 57–74). Korea: Korean Society of Crop Science.
Le Maire, G., François, C., Soudani, K., Berveiller, D., Pontailler, J. Y., Bréda, N., et al. (2008). Calibration and validation of hyperspectral indices for the estimation of broadleaved forest leaf chlorophyll content, leaf mass per area, leaf area index and leaf canopy biomass. Remote Sens. Environ. 112 (10), 3846–3864. doi:10.1016/j.rse.2008.06.005
Lepine, L. C., Ollinger, S. V., Ouimette, A. P., and Martin, M. E. (2016). Examining spectral reflectance features related to foliar nitrogen in forests: implications for broad-scale nitrogen mapping. Remote Sens. Environ. 173, 174–186. doi:10.1016/j.rse.2015.11.028
Li, F., Miao, Y., Feng, G., Yuan, F., Yue, S., Gao, X., et al. (2014a). Improving estimation of summer maize nitrogen status with red edge-based spectral vegetation indices. Field Crops Res. 157, 111–123. doi:10.1016/j.fcr.2013.12.018
Li, F., Mistele, B., Hu, Y., Chen, X., and Schmidhalter, U. (2014b). Optimising three-band spectral indices to assess aerial N concentration, N uptake and aboveground biomass of winter wheat remotely in China and Germany. ISPRS J. Photogrammetry Remote Sens. 92, 112–123. doi:10.1016/j.isprsjprs.2014.03.006
Li, Y., Guan, K., Yu, A., Peng, B., Zhao, L., Li, B., et al. (2019). Toward building a transparent statistical model for improving crop yield prediction: modeling rainfed corn in the US. Field Crops Res. 234, 55–65. doi:10.1016/j.fcr.2019.02.005
Lindsay, E. J. (2017). Mapping Canada's rangeland and forage resources using Earth observation. Ottawa, Ontario: Carleton University.
Liu, X., Zhou, Y., Zhao, J., Yao, R., Liu, B., and Zheng, Y. (2019). Siamese convolutional neural networks for remote sensing scene classification. IEEE Geoscience Remote Sens. Lett. 16 (8), 1200–1204. doi:10.1109/lgrs.2019.2894399
Luo, Y., Su, B. O., Currie, W. S., Dukes, J. S., Finzi, A., Hartwig, U., et al. (2004). Progressive nitrogen limitation of ecosystem responses to rising atmospheric carbon dioxide. Bioscience 54 (8), 731–739. doi:10.1641/0006-3568(2004)054[0731:pnloer]2.0.co;2
Main-Knorn, M., Pflug, B., Louis, J., Debaecker, V., Müller-Wilm, U., and Gascon, F. (2017). “Sen2Cor for sentinel-2,”, 10427. 37–48.Image signal Process. remote Sens. XXIII
Mathis, C. L., McNeil Jr, D. J., Lee, M. R., Grozinger, C. M., King, D. I., Otto, C. R., et al. (2021). Pollinator communities vary with vegetation structure and time since management within regenerating timber harvests of the Central Appalachian Mountains. For. Ecol. Manag. 496, 119373. doi:10.1016/j.foreco.2021.119373
Meng, J., Li, S., Wang, W., Liu, Q., Xie, S., and Ma, W. (2016). Mapping forest health using spectral and textural information extracted from spot-5 satellite images. Remote Sens. 8 (9), 719. doi:10.3390/rs8090719
Nethononda, V. G. (2018). Determination of irrigation water quality of surface and groundwater in Luvuvhu catchment in Limpopo, South Africa Doctoral dissertation. Kzwazul-Natal: University of Kwazul-Natal.
Odiyo, J. O., Chimuka, L., Mamali, M. A., and Fatoki, O. S. (2012). Trophic status of Vondo and Albasini Dams; impacts on aquatic ecosystems and drinking water. Int. J. Environ. Sci. Technol. 9 (2), 203–218. doi:10.1007/s13762-012-0034-x
Ollinger, S. V., Richardson, A. D., Martin, M. E., Hollinger, D. Y., Frolking, S. E., Reich, P. B., et al. (2008). Canopy nitrogen, carbon assimilation, and albedo in temperate and boreal forests: functional relations and potential climate feedbacks. Proc. Natl. Acad. Sci. 105 (49), 19336–19341. doi:10.1073/pnas.0810021105
Osbome, R. W., Bar-Shalom, Y., and Willett, P. (2011). “Track-to-track association with augmented state,” in 14th international conference on information fusion (IEEE), 1–8.
Osco, L. P., Junior, J. M., Ramos, A. P. M., Furuya, D. E. G., Santana, D. C., Teodoro, L. P. R., et al. (2020). Leaf nitrogen concentration and plant height prediction for maize using UAV-based multispectral imagery and machine learning techniques. Remote Sens. 12 (19), 3237. doi:10.3390/rs12193237
Paramasivam, C. R., and Venkatramanan, S. (2019). “An introduction to various spatial analysis techniques,” in GIS and geostatistical techniques for groundwater science, 23–30.
Perchlik, M., and Tegeder, M. (2017). Improving plant nitrogen use efficiency through alteration of amino acid transport processes. Plant physiol. 175 (1), 235–247. doi:10.1104/pp.17.00608
Perich, G., Aasen, H., Verrelst, J., Argento, F., Walter, A., and Liebisch, F. (2021). Crop nitrogen retrieval methods for simulated sentinel-2 data using in-field spectrometer data. Remote Sens. 13 (12), 2404. doi:10.3390/rs13122404
Phiri, D., Morgenroth, J., Xu, C., and Hermosilla, T. (2018). Effects of pre-processing methods on Landsat OLI-8 land cover classification using OBIA and random forests classifier. Int. J. Appl. earth observation geoinformation 73, 170–178. doi:10.1016/j.jag.2018.06.014
Rao, N. R., Garg, P. K., Ghosh, S. K., and Dadhwal, V. K. (2008). Estimation of leaf total chlorophyll and nitrogen concentrations using hyperspectral satellite imagery. J. Agric. Sci. 146 (1), 65–75. doi:10.1017/s0021859607007514
Reich, P. B., Hobbie, S. E., Lee, T., Ellsworth, D. S., West, J. B., Tilman, D., et al. (2006). Nitrogen limitation constrains sustainability of ecosystem response to CO2. Nature 440 (7086), 922–925. doi:10.1038/nature04486
Richards, A. E., Brackin, R., Lindsay, D. A. J., and Schmidt, S. (2012). Effect of fire and tree-grass patches on soil nitrogen in Australian tropical savannas. Austral Ecol. 37 (6), 668–677. doi:10.1111/j.1442-9993.2011.02335.x
Richardson, A. J., and Wiegand, C. L. (1977). Distinguishing vegetation from soil background information. Photogrammetric Eng. remote Sens. 43 (12), 1541–1552.
Robertson, C., Long, J. A., Nathoo, F. S., Nelson, T. A., and Plouffe, C. C. (2014). Assessing quality of spatial models using the structural similarity index and posterior predictive checks. Geogr. Anal. 46 (1), 53–74. doi:10.1111/gean.12028
Rondeaux, G., Steven, M., and Baret, F. (1996). Optimization of soil-adjusted vegetation indices. Remote Sens. Environ. 55 (2), 95–107. doi:10.1016/0034-4257(95)00186-7
Sáez-Plaza, P., Navas, M. J., Wybraniec, S., Michałowski, T., and Asuero, A. G. (2013). An overview of the Kjeldahl method of nitrogen determination. Part II. Sample preparation, working scale, instrumental finish, and quality control. Crit. Rev. Anal. Chem. 43 (4), 224–272. doi:10.1080/10408347.2012.751787
Serrano, L., Penuelas, J., and Ustin, S. L. (2002). Remote sensing of nitrogen and lignin in Mediterranean vegetation from AVIRIS data: decomposing biochemical from structural signals. Remote Sens. Environ. 81 (2-3), 355–364. doi:10.1016/s0034-4257(02)00011-1
Shongwe, L. B. (2007). The implications of transfrontier conservation areas: a comparative policy analysis study of sustainable development in South Africa between the great Limpopo transfrontier conservation area and Lubombo transfrontier resource area. Pretoria: University of Pretoria.
Sims, D. A., and Gamon, J. A. (2002). Relationships between leaf pigment content and spectral reflectance across a wide range of species, leaf structures and developmental stages. Remote Sens. Environ. 81 (2-3), 337–354. doi:10.1016/s0034-4257(02)00010-x
Singh, F., Kang, J. S., Singh, A., and Singh, T. (2015). Nutrient uptake, nutrient availability and quality parameters of mechanically transplanted rice (Oryza sativa L.) under split doses of nitrogen. Agric. Sci. Digest-A Res. J. 35 (2), 95–100. doi:10.5958/0976-0547.2015.00035.x
Ustin, S. L. (2013). Remote sensing of canopy chemistry. Proc. Natl. Acad. Sci. 110 (3), 804–805. doi:10.1073/pnas.1219393110
Ustin, S. L., Gitelson, A. A., Jacquemoud, S., Schaepman, M., Asner, G. P., Gamon, J. A., et al. (2009). Retrieval of foliar information about plant pigment systems from high resolution spectroscopy. Remote Sens. Environ. 113, S67–S77. doi:10.1016/j.rse.2008.10.019
Ustin, S. L., Roberts, D. A., Gamon, J. A., Asner, G. P., and Green, R. O. (2004). Using imaging spectroscopy to study ecosystem processes and properties. BioScience 54 (6), 523–534. doi:10.1641/0006-3568(2004)054[0523:uistse]2.0.co;2
Vanhellemont, Q., and Ruddick, K. (2015). Advantages of high-quality SWIR bands for ocean colour processing: examples from Landsat-8. Remote Sens. Environ. 161, 89–106. doi:10.1016/j.rse.2015.02.007
Verrelst, J., Rivera, J. P., Moreno, J., and Camps-Valls, G. (2013). Gaussian processes uncertainty estimates in experimental Sentinel-2 LAI and leaf chlorophyll content retrieval. ISPRS J. photogrammetry remote Sens. 86, 157–167. doi:10.1016/j.isprsjprs.2013.09.012
Vigneau, N., Ecarnot, M., Rabatel, G., and Roumet, P. (2011). Potential of field hyperspectral imaging as a non-destructive method to assess leaf nitrogen content in Wheat. Field Crops Res. 122 (1), 25–31. doi:10.1016/j.fcr.2011.02.003
Volenzo, T. E., and Odiyo, J. (2018). Ecological public health and participatory planning and assessment dilemmas: the case of water resources management. Int. J. Environ. Res. Public Health 15 (8), 1635. doi:10.3390/ijerph15081635
Walshe, D., McInerney, D., Van De Kerchove, R., Goyens, C., Balaji, P., and Byrne, K. A. (2020). Detecting nutrient deficiency in spruce forests using multispectral satellite imagery. Int. J. Appl. Earth Observation Geoinformation 86, 101975. doi:10.1016/j.jag.2019.101975
Wang, B., Jia, K., Liang, S., Xie, X., Wei, X., Zhao, X., et al. (2018a). Assessment of Sentinel-2 MSI spectral band reflectances for estimating fractional vegetation cover. Remote Sens. 10 (12), 1927. doi:10.3390/rs10121927
Wang, L., and Wei, Y. (2016). Revised normalized difference nitrogen index (NDNI) for estimating canopy nitrogen concentration in wetlands. Optik 127 (19), 7676–7688. doi:10.1016/j.ijleo.2016.05.115
Wang, S., Baig, M. H. A., Zhang, L., Jiang, H., Ji, Y., Zhao, H., et al. (2015a). A simple enhanced water index (EWI) for percent surface water estimation using Landsat data. IEEE J. Sel. Top. Appl. Earth Observations Remote Sens. 8 (1), 90–97. doi:10.1109/jstars.2014.2387196
Wang, X., Zhang, F., and Johnson, V. C. (2018b). New methods for improving the remote sensing estimation of soil organic matter content (SOMC) in the Ebinur Lake Wetland National Nature Reserve (ELWNNR) in northwest China. Remote Sens. Environ. 218, 104–118. doi:10.1016/j.rse.2018.09.020
Wang, Z., Gang, C., Li, X., Chen, Y., and Li, J. (2015b). Application of a normalized difference impervious index (NDII) to extract urban impervious surface features based on Landsat TM images. Int. J. Remote Sens. 36 (4), 1055–1069. doi:10.1080/01431161.2015.1007250
Wang, Z., Wang, T., Darvishzadeh, R., Skidmore, A. K., Jones, S., Suarez, L., et al. (2016). Vegetation indices for mapping canopy foliar nitrogen in a mixed temperate forest. Remote Sens. 8 (6), 491. doi:10.3390/rs8060491
Xie, Q., Dash, J., Huang, W., Peng, D., Qin, Q., Mortimer, H., et al. (2018). Vegetation indices combining the red and red-edge spectral information for leaf area index retrieval. IEEE J. Sel. Top. Appl. earth observations remote Sens. 11 (5), 1482–1493. doi:10.1109/jstars.2018.2813281
Xue, L., Cao, W., Luo, W., Dai, T., and Zhu, Y. (2004). Monitoring leaf nitrogen status in rice with canopy spectral reflectance. Agron. J. 96 (1), 135–142. doi:10.2134/agronj2004.0135
Yao, X., Huang, Y., Shang, G., Zhou, C., Cheng, T., Tian, Y., et al. (2015). Evaluation of six algorithms to monitor wheat leaf nitrogen concentration. Remote Sens. 7 (11), 14939–14966. doi:10.3390/rs71114939
Yu, H., Zhu, D., Wan, S., Jiang, Y., Lu, C., Zhang, R., et al. (2024). “Detecting polder water surface dynamics using multi-source remote sensing data,”, 110. MDPI, 19. doi:10.3390/proceedings2024110019
Zhao, K., Valle, D., Popescu, S., Zhang, X., and Mallick, B. (2013). Hyperspectral remote sensing of plant biochemistry using Bayesian model averaging with variable and band selection. Remote Sens. Environ. 132, 102–119. doi:10.1016/j.rse.2012.12.026
Keywords: nitrogen, Sentinel-2, spectral indices, broadband, narrowband
Citation: Tshishonga UE and Malahlela OE (2025) Mapping plant nitrogen concentration within Luvuvhu River Catchment using Sentinel-2 imagery. Front. Environ. Sci. 13:1526906. doi: 10.3389/fenvs.2025.1526906
Received: 12 November 2024; Accepted: 21 February 2025;
Published: 21 March 2025.
Edited by:
Sawaid Abbas, University of the Punjab, PakistanReviewed by:
Faisal Mumtaz, Chinese Academy of Sciences (CAS), ChinaCopyright © 2025 Tshishonga and Malahlela. This is an open-access article distributed under the terms of the Creative Commons Attribution License (CC BY). The use, distribution or reproduction in other forums is permitted, provided the original author(s) and the copyright owner(s) are credited and that the original publication in this journal is cited, in accordance with accepted academic practice. No use, distribution or reproduction is permitted which does not comply with these terms.
*Correspondence: Unarine E. Tshishonga, dW5hcmluZWVtYW51ZWx0QGdtYWlsLmNvbQ==
Disclaimer: All claims expressed in this article are solely those of the authors and do not necessarily represent those of their affiliated organizations, or those of the publisher, the editors and the reviewers. Any product that may be evaluated in this article or claim that may be made by its manufacturer is not guaranteed or endorsed by the publisher.
Research integrity at Frontiers
Learn more about the work of our research integrity team to safeguard the quality of each article we publish.